
Green Emotion: Incorporating Emotional Perception in Green Marketing to Increase Green Furniture Purchase Intentions


Abstract
1. Introduction
- How do green furniture’s green and traditional characteristics affect consumers’ emotional perceptions?
- How do consumers’ emotional perceptions, specifically their perceived pleasure, arousal, and dominance, influence their intentions to purchase green furniture?
- Does PAD 3D significantly mediate the relationship between green furniture characteristics and green purchase intentions?
- Is there a notable distinction between green furniture’s green and conventional characteristics in terms of evoking an emotional reaction from consumers and their inclination to make a purchase?
- Do consumers’ demographic variables, such as gender, age, and educational background, have varying emotional effects on their inclinations to purchase green furniture?
2. Literature Review
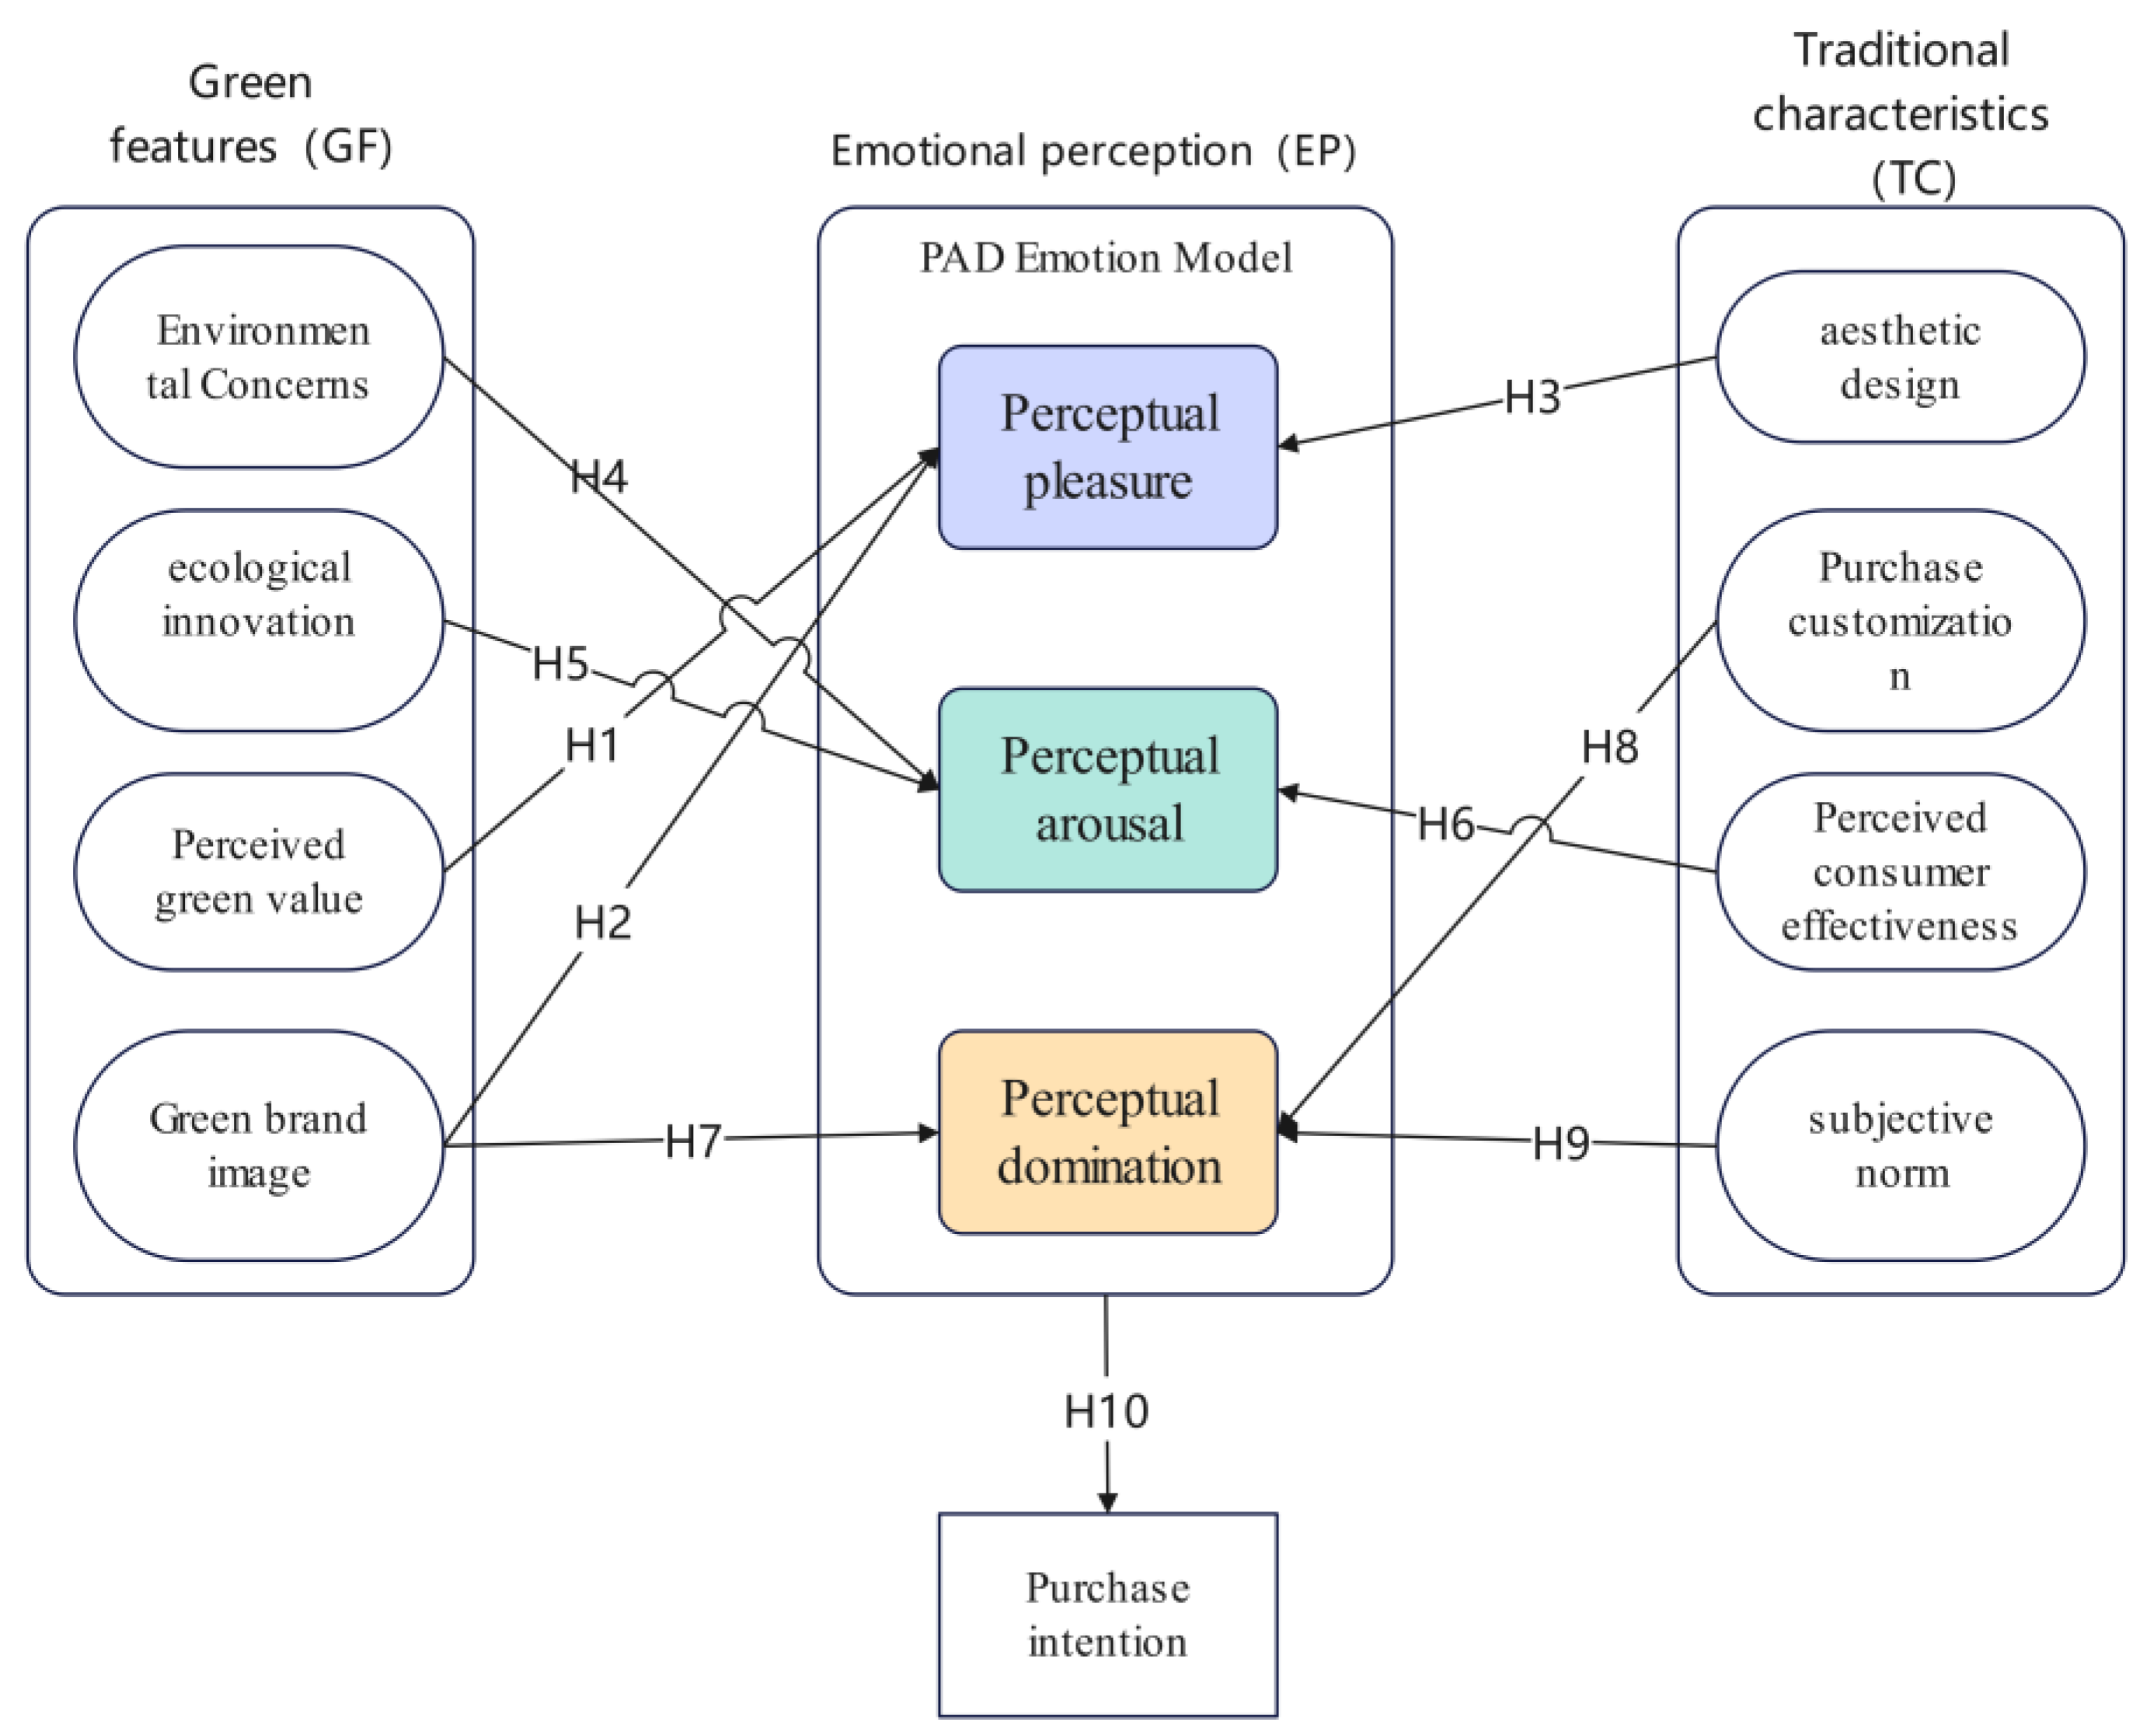
3. Theoretical Framework and Research Hypotheses
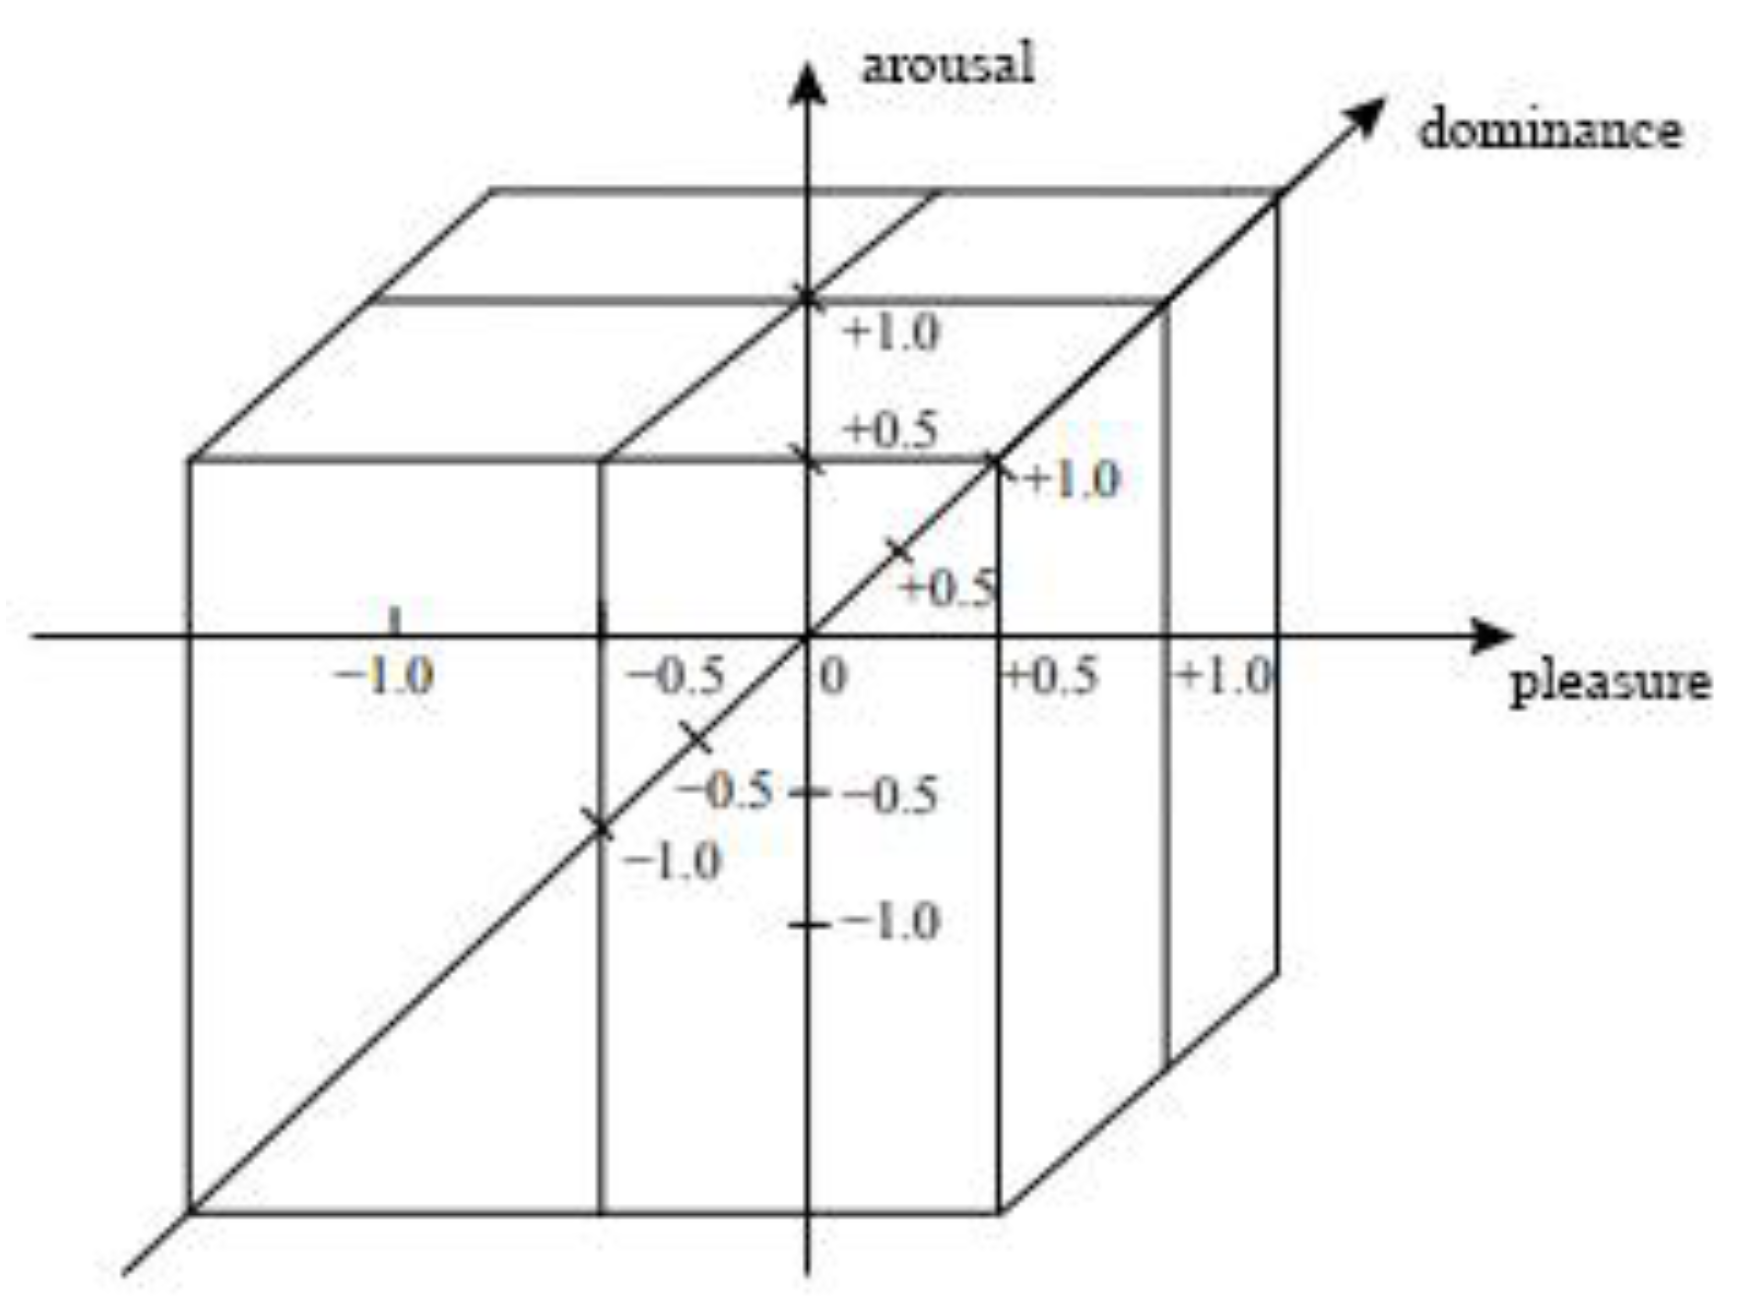
3.1. PAD 3D Emotional Model
3.2. Perceived Pleasure Factor
3.2.1. Perceived Green Value
3.2.2. Green Brand Image
3.2.3. Aesthetic Design
3.3. Perceived Arousal Factors
3.3.1. Environmental Awareness
3.3.2. Eco-Innovation
3.3.3. Perceived Consumer Effectiveness
3.4. Perceived Dominance Factors
3.4.1. Green Brand Image
3.4.2. Purchase Customization
3.4.3. Subjective Norms
3.5. Perceived Pleasure, Arousal, and Dominance Outcomes
3.6. Theoretical Framework
4. Experiments
4.1. Research Methods and Materials
4.2. Analytical Method
5. Results
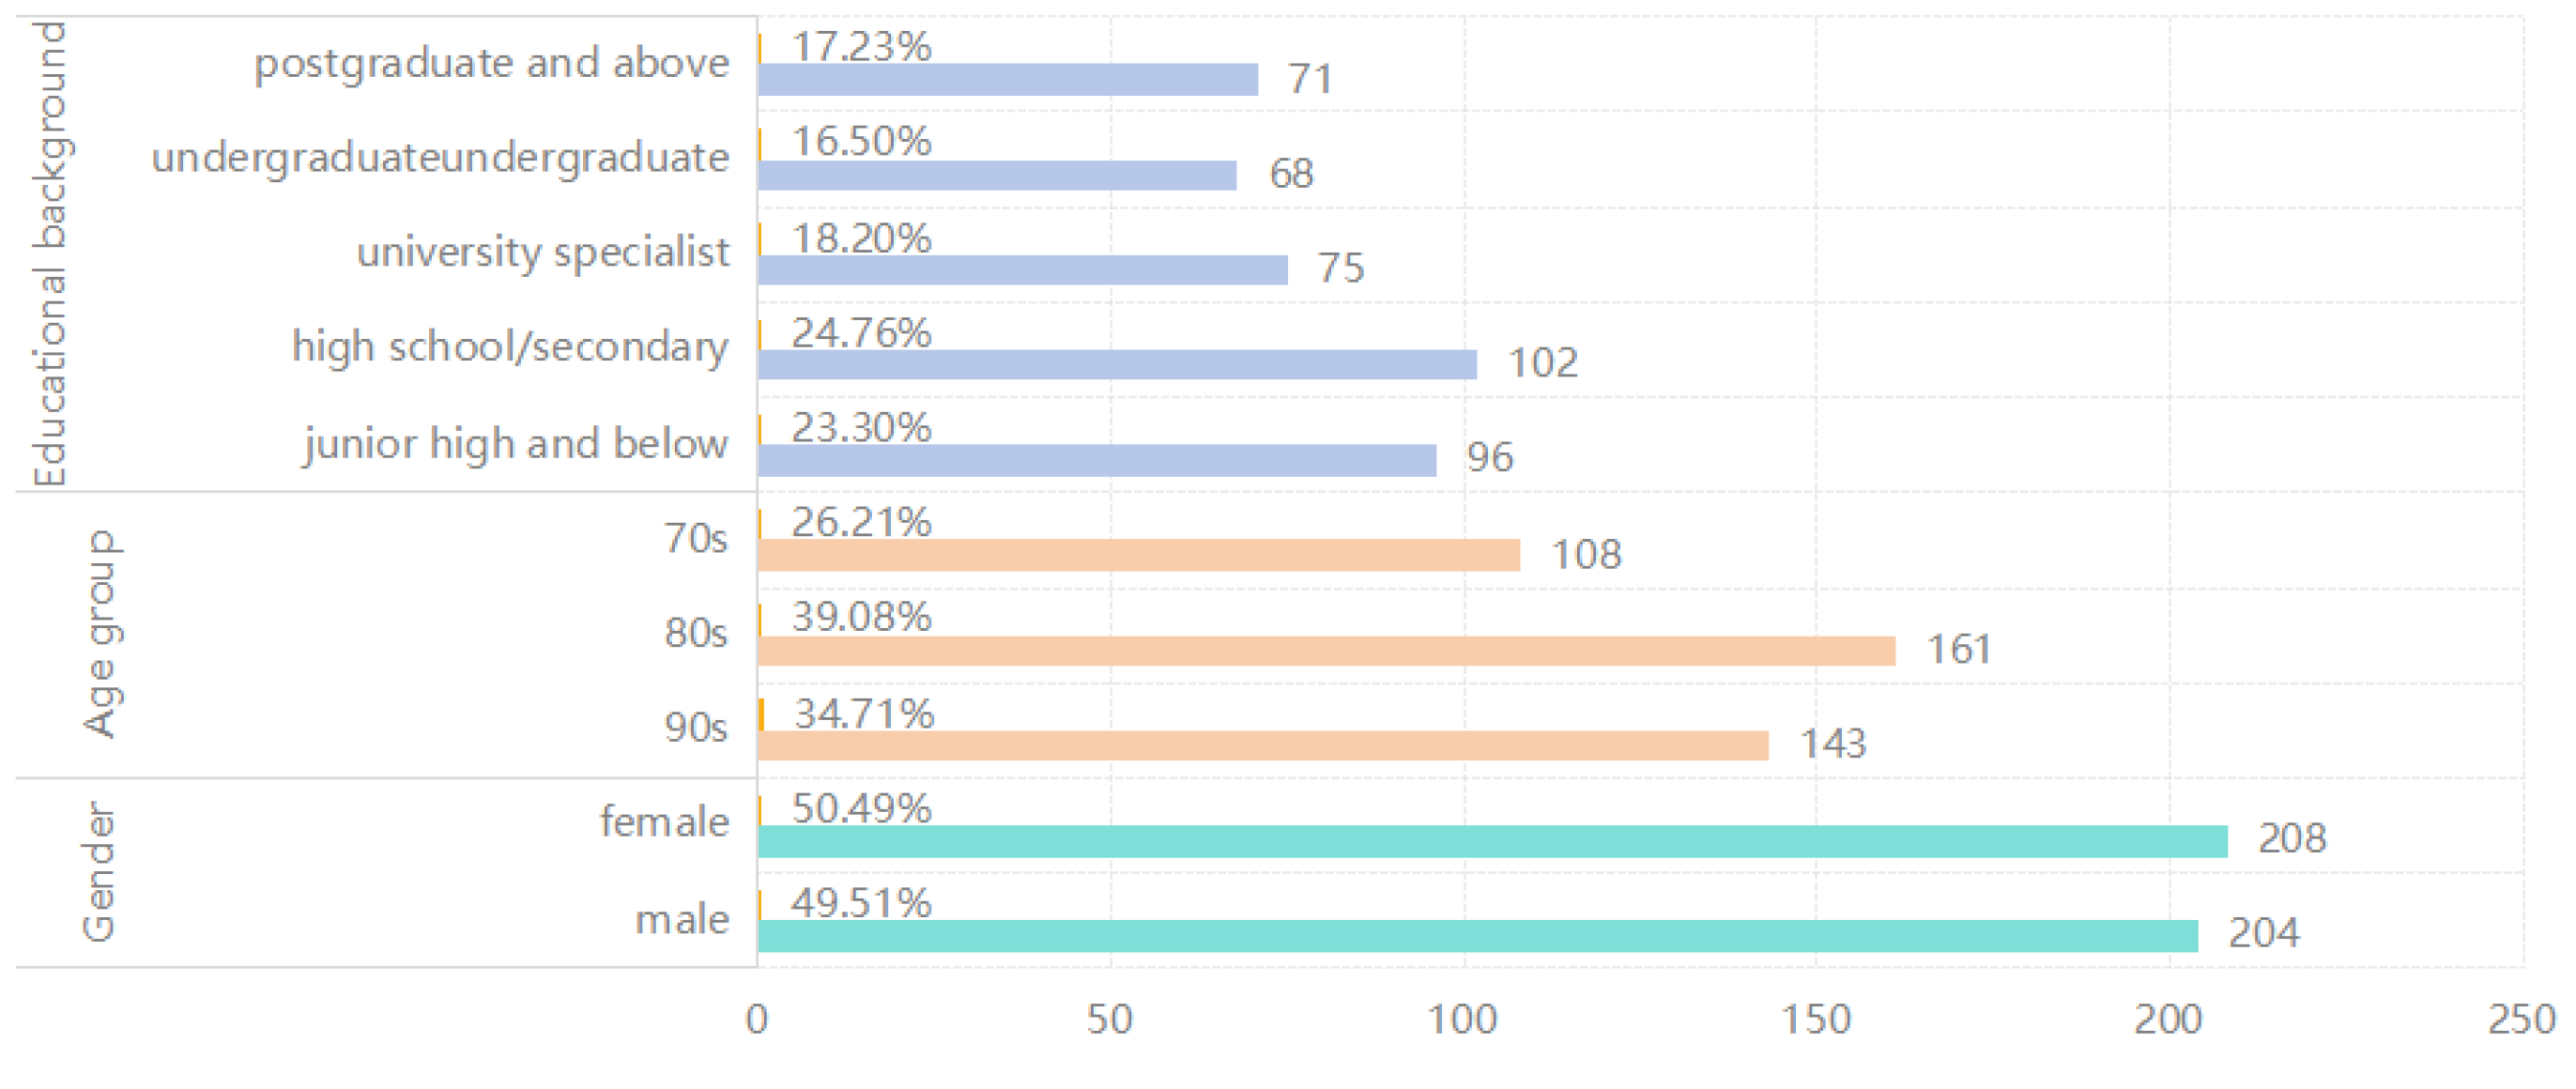
5.1. Demographics
5.2. Data Validity Testing
5.3. Measurement Models
5.3.1. Reliability Test
5.3.2. Distinctive Validity
5.3.3. Covariance Test
5.4. Structural Models
5.4.1. Model Fit
5.4.2. R2
5.4.3. Q2 and F2
5.5. Hypothesis Testing Results
5.6. Comparative Analysis of Green and Traditional Features
5.7. Multi-Cluster Structural Equation Modelling Analysis
- Individuals born after the 1970s may have a greater inclination to place trust in established brands and regard environmentally friendly furniture brands with greater importance;
- Furthermore, individuals born after the 1970s may already have a deeply rooted sense of environmental consciousness. Consequently, individuals are more inclined to experience enjoyment and opt for environmentally friendly brands;
- Individuals born after the 1990s may exhibit a greater emphasis on sustainable principles;
- Individuals born after the 1990s are more inclined to utilize social media platforms and are susceptible to the impact of environmental issues discussed on these platforms. Exposure to green ideals on social media can significantly impact individuals, increasing their susceptibility to influence and fostering greater interest and satisfaction with green furniture;
- Women are typically more emotional and focused on emotional experiences, and green furniture may inspire emotional resonance in women through features such as its sustainable philosophy and the aesthetics and style of home décor, making them more likely to desire to buy.
6. Discussion
7. Conclusions
- (1)
- Perceived arousal (PD) and purchase intention (PI) (0.149 = medium effect), eco-innovation (EI) and perceived arousal (PA) (0.145 = medium effect), perceived dominance (PD) and purchase intention (PI) (0.104 = weak effect), a green brand image (GBI) and perceived pleasure (PP) (0.094 = weak effect), through F2 values, and subjective norms (SN) and perceived domination (PD) (0.094 = weak effect), had the greatest impact on the emotional perception of green furniture purchase intent.
- (2)
- All explanatory variables are significantly related to the explanatory variable (green furniture purchasing intention). Furthermore, all PAD three-dimensional emotions significantly moderated the association between green furniture attributes and purchasing intent.
- (3)
- Additional examination using multi-group structural equation modeling indicates that the impact of a green brand image (GBI) on the intention to purchase green furniture is more substantial for consumers born after the 1970s than those born after the 1990s. Conversely, the influence of perceived green value (PGV) on the intention to purchase green furniture is more significant for consumers born after the 1990s due to their higher level of pleasure. Furthermore, females are more likely than males to be influenced by the features of green furniture, which elicit emotional perception and generate purchase intention. Simultaneously, women are more prone to being swayed by the attributes of green furniture, which affects their emotional perception and intention to make a purchase.
- (4)
- This study examined the impact of green features and traditional features of green furniture on consumers’ emotional perception and purchase intention. The findings revealed that green features had a more substantial influence on emotional perception (β = 0.511, p < 0.001) compared to traditional features (β = 0.390, p < 0.001). They exhibited greater strength.
- (1)
- Enhance the emotional marketing plan: Considering the significant influence of emotional perception on the intention to purchase, green furniture companies should improve their emotional marketing strategy. By utilizing emotional advertising, brand narrative, education, and publicity, we may heighten consumers’ environmental consciousness and self-assurance, reinforcing their emotional attachment and intention to purchase.
- (2)
- Emphasis on green features and eco-innovation: Research results show that in green furniture marketing, it is crucial to emphasize the product’s green features, followed by eco-innovation, which has the most significant impact on consumers’ perceived pleasure. Therefore, companies should continuously launch products that meet environmental needs and highlight the green features of furniture, such as environmental protection and sustainability, to attract consumers and enhance their pleasure.
- (3)
- Improving green brand image: The findings indicate that a green brand image has the greatest impact on consumers’ perceived pleasure. As a result, businesses should commit to developing a positive green brand image through brand marketing activities and brand image to improve consumer satisfaction. They should also use branding and marketing methods to encourage consumers to favorably appraise and recognize green furniture while keeping in mind the influence of subjective norms.
- (4)
- Customized services and distinct experiences: The findings indicate that purchase customization has the biggest impact on perceived dominance. As a result, businesses can match consumer demand for individualized products by offering customized services. In addition, because different gender and age groups have different levels of willingness to buy, in the case of fierce market competition, green furniture enterprises should focus on specific groups of users to achieve differentiated product services.
- Due to the use of the questionnaire approach, the data acquired for this study were limited to a cross-sectional perspective. To address this constraint, future analyses should investigate using a longitudinal experimental design;
- An analysis can be conducted to examine the emotional influence of intentions to make environmentally friendly purchases in various locations;
- This paper only investigated the impact of green furniture features on consumers’ emotional responses, and the mechanisms explored in the future could be the dual-mediated impacts of the functional and emotional dimensions.
Author Contributions
Funding
Institutional Review Board Statement
Informed Consent Statement
Data Availability Statement
Acknowledgments
Conflicts of Interest
Appendix A

| Components | Items | Sources | |
|---|---|---|---|
| Green Feature (GF) | Environmental Awareness (EA) | (EA-01) I am very concerned about the current environmental situation in my country | [45,70] |
| (EA-02) I believe that individuals have a responsibility to protect the environment. | |||
| (EA-03) I am willing to control my consumption to protect the environment | |||
| Eco-Innovation (EI) | (EI-01) I think green furniture is easier to recycle than traditional furniture | [71] | |
| (EI-02) I think green furniture reduces the damage caused by waste compared to traditional furniture. | |||
| (EI-03) I think green furniture uses less material than traditional furniture. | |||
| Perceived Green Value (PGV) | (PGV-01) I think green furniture is more valuable to the environment than traditional furniture. | [72] | |
| (PGV-02) I think green furniture is more valuable compared to paid currency. | |||
| (PGV-03) I hope that green furniture will improve environmental performance. | |||
| Green Brand Image (GBI) | (GBI-01) I think to implement green practices, green furniture is successful. | [32] | |
| (GBI-02) I think that by implementing green practices, green furniture will have a good reputation. | |||
| (GBI-03) I think green furniture is in the limelight to implement environmental protection measures. | |||
| (GBI-04) Green furniture with good green brand trust appeals to me. | |||
| Traditional Characteristics (TC) | Aesthetic Design (AD) | (AAD-01) I would love visually appealing green furniture. | [22,24] |
| (AAD-02) I like green furniture that has a sense of design and has been professionally designed. | |||
| (AAD-03) Furniture with innovative green materials appeals to me! | |||
| Purchase Customisation (PC) | (PC-01) I like to personalize when buying furniture | [58] | |
| (PC-02) I want to buy green furniture with CMF (Colour, Material, Workmanship) at my disposal. | |||
| (PC-03) I would buy green furniture that can be customized. | |||
| Perceived Consumer Effectiveness (PCE) | (PCE-01) I think it’s worth it for individual consumers to try to protect and improve the environment. | [73] | |
| (PCE-02) By purchasing green furniture, I believe I can positively impact the environment and society. | |||
| (PCE-03) I believe that by greening my consumption, I will influence my living environment. | |||
| Subjective norms (SN) | (SN-01) People who are important to me think I should buy green furniture. | [45,62] | |
| (SN-02) People who influence my behavior think I should buy green furniture. | |||
| (SN-03) People whose opinions I value prefer me to use green furniture. | |||
| Emotional perception (EP) | Perceived Pleasure (PP) | (PP-01) Buying furniture with more green values would make me feel very friendly | [16] |
| (PP-02) Buying green furniture with good aesthetic design will make me happy! | |||
| (PP-03) I am very interested in green furniture with a good green brand image. | |||
| Perceptual Arousal (PA) | (PA-01) I’m very conscious of the need to protect the environment by controlling consumption. | ||
| (PA-02) Eco-innovation through the purchase of green furniture would excite me! | |||
| (PA-03) The efficacy of the positive impact of buying green furniture makes me feel relaxed | |||
| Perceptual Domination (PD) | (PD-01) Green brand image will have a dominant influence on whether I buy green furniture or not. | ||
| (PD-02) I want to buy green furniture that I can customize at my discretion. | |||
| (PD-03) Whether or not I buy green furniture can be influenced by others. | |||
| Purchase Intention (PI) | (PI-01) I’m willing to buy green furniture that gives me pleasure. | [11] | |
| (PI-02) I’m willing to buy green furniture that excites me. | |||
| (PI-03) I am willing to buy green furniture at my disposal | |||
References
- He, Q.; Silliman, B.R. Climate change, human impacts, and coastal ecosystems in the Anthropocene. Curr. Biol. 2019, 29, R1021–R1035. [Google Scholar] [CrossRef] [PubMed]
- Klein Goldewijk, K.; Beusen, A.; Janssen, P. Long-term dynamic modeling of global population and built-up area in a spatially explicit way: HYDE 3.1. Holocene 2010, 20, 565–573. [Google Scholar] [CrossRef]
- Le Tan, T.; Quang, N.D. Influencing factors on eco-friendly furniture buying behaviour in the city of danang-vietnam. Remit. Rev. 2023, 8, 2074–2097. [Google Scholar]
- Zhu, J.; Niu, J. Green Material Characteristics Appllied to Office Desk Furniture. BioResources 2022, 17, 2228–2242. [Google Scholar] [CrossRef]
- Xiong, X.; Ma, Q.; Yuan, Y.; Wu, Z.; Zhang, M. Current situation and key manufacturing considerations of green furniture in China: A review. J. Clean. Prod. 2020, 267, 121957. [Google Scholar] [CrossRef]
- Parikka-Alhola, K. Promoting environmentally sound furniture by green public procurement. Ecol. Econ. 2008, 68, 472–485. [Google Scholar] [CrossRef]
- Xie, X.; Zhu, J.; Ding, S.; Chen, J. AHP and GCA Combined Approach to Green Design Evaluation of Kindergarten Furniture. Sustainability 2023, 16, 1. [Google Scholar] [CrossRef]
- Nekmahmud, M.; Fekete-Farkas, M. Why not green marketing? Determinates of consumers’ intention to green purchase decision in a new developing nation. Sustainability 2020, 12, 7880. [Google Scholar] [CrossRef]
- Blackwell, R.D.; Miniard, P.W.; Engel, J.F. Consumer Behavior, 10th ed., Thomson South-Western: Singapore, 2006.
- Van Delft, W.C.J.M. Omnichannel Shopping Behaviour during the Customer Journey. Master’s Thesis, Eindhoven University of Technology, Eindhoven, The Netherland, 2013. [Google Scholar]
- Zaharia, S.I. Consumer Behaviour in Multi-Channel-Retailing-How do Consumers Use the Channels of a Multi-Channel-Retailer during the Buying Process; University of Duisburg-Essen, Department of Marketing and Retailing: Duisburg-Essen, Germany, 2005; pp. 1–16. [Google Scholar]
- Neidenthal, P.M.; Krauth-Gruber, S.; Ric, F. Psychology of Emotion: Interpersonal, Experiential, and Cognitive Approaches; Psychology Press: Hove, UK, 2006. [Google Scholar]
- Yu, S.; Zheng, Q.; Chen, T.; Zhang, H.; Chen, X. Consumer personality traits vs. their preferences for the characteristics of wood furniture products. BioResources 2023, 18, 7443. [Google Scholar] [CrossRef]
- Hsieh, S.H.; Lee, C.T.; Tseng, T.H. Branded app atmospherics: Examining the effect of pleasure–arousal–dominance in brand relationship building. J. Retail. Consum. Serv. 2021, 60, 102482. [Google Scholar] [CrossRef]
- Cho, Y.; Lee, E.J. Impact of interior colors in retail store atmosphere on consumers’ perceived store luxury, emotions, and preference. Cloth. Text. Res. J. 2017, 35, 33–48. [Google Scholar] [CrossRef]
- Yang, K.; Kim, H.J.M.; Zimmerman, J. Emotional branding on fashion brand websites: Harnessing the Pleasure-Arousal-Dominance (PAD) model. J. Fash. Mark. Manag. 2020, 24, 555–570. [Google Scholar] [CrossRef]
- Wei, Y.; Zhang, Y.; Wang, Y.; Liu, C. A study of the emotional impact of interior lighting color in rural bed and breakfast space design. Buildings 2023, 13, 2537. [Google Scholar] [CrossRef]
- Xie, S.; Madni, G.R. Impact of social media on young generation’s green consumption behavior through subjective norms and perceived green value. Sustainability 2023, 15, 3739. [Google Scholar] [CrossRef]
- Majeed, M.U.; Aslam, S.; Murtaza, S.A.; Attila, S.; Molnár, E. Green marketing approaches and their impact on green purchase intentions: Mediating role of green brand image and consumer beliefs towards the environment. Sustainability 2022, 14, 11703. [Google Scholar] [CrossRef]
- Moslehpour, M.; Chau, K.Y.; Du, L.; Qiu, R.; Lin, C.-Y.; Batbayar, B. Predictors of green purchase intention toward eco-innovation and green products: Evidence from Taiwan. Econ. Res.-Ekon. Istraž. 2023, 36, 2121934. [Google Scholar] [CrossRef]
- Xu, X.; Hua, Y.; Wang, S.; Xu, G. Determinants of consumer’s intention to purchase authentic green furniture. Resour. Conserv. Recycl. 2020, 156, 104721. [Google Scholar] [CrossRef]
- Klabi, F.; Binzafrah, F. The mechanisms for influencing green purchase intention by environmental concern: The roles of self-green image congruence and green brand trust. South Asian J. Manag. 2022, 16, 76–101. [Google Scholar] [CrossRef]
- Yu, C.; Liu, W.; Fei, Y.; Chen, J.; Hu, Z. Influencing factors of online furniture purchase behavior based on analytic hierarchy process. BioResources 2023, 18, 2857. [Google Scholar] [CrossRef]
- Mehrabian, A.; Russell, J.A. An Approach to Environmental Psychology; MIT Press: Cambridge, MA, USA, 1974. [Google Scholar]
- Bran, A.; Vaidis, D.C. On the characteristics of the cognitive dissonance state: Exploration within the pleasure arousal dominance model. Psychol. Belg. 2020, 60, 86. [Google Scholar] [CrossRef]
- Huang, M.-X.; Ali, R.; Liao, J.-Y. The Effect of User Experience in Online Games on Word of Mouth: A Pleasure-Arousal-Dominance (PAD) Model Perspective. Comput. Hum. Behav. 2017, 75, 329–338. [Google Scholar] [CrossRef]
- Patterson, P.G.; Spreng, R.A. Modelling the relationship between perceived value, satisfaction and repurchase intentions in a business-to-business, services context: An empirical examination. Int. J. Serv. Ind. Manag. 1997, 8, 414–434. [Google Scholar] [CrossRef]
- Hur, W.M.; Kim, Y.; Park, K. Assessing the effects of perceived value and satisfaction on customer loyalty: A ‘green’ perspective. Corp. Soc. Responsib. Environ. Manag. 2013, 20, 146–156. [Google Scholar] [CrossRef]
- Luchs, M.G.; Mooradian, T.A. Sex, personality, and sustainable consumer behaviour: Elucidating the gender effect. J. Consum. Policy 2012, 35, 127–144. [Google Scholar] [CrossRef]
- Brady, M.K.; Robertson, C.J. An exploratory study of service value in the USA and Ecuador. Int. J. Serv. Ind. Manag. 1999, 10, 469–486. [Google Scholar] [CrossRef]
- Cronin, J.J.; Brady, M.K.; Brand, R.R.; Hightower, R.; Shemwell, D.J. A cross-sectional test of the effect and conceptualization of service value. J. Serv. Mark. 1997, 11, 375–391. [Google Scholar] [CrossRef]
- Bashir, S.; Khwaja, M.G.; Rashid, Y.; Turi, J.A.; Waheed, T. Green brand benefits and brand outcomes: The mediating role of green brand image. Sage Open 2020, 10, 2158244020953156. [Google Scholar] [CrossRef]
- Delgado-Ballester, E.; Munuera-Alemán, J.L. Brand trust in the context of consumer loyalty. Eur. J. Mark. 2001, 35, 1238–1258. [Google Scholar] [CrossRef]
- Saputra, M.H.; Ardyan, E.; Tanesia, C.Y.; Ariningsih, E.P. Building Brand Resonance: Optimizing Symbolic Brand Reputation and Customers’ Emotional Value. ASEAN Mark. J. 2021, 13, 5. [Google Scholar] [CrossRef]
- Mourad, M.; Serag Eldin Ahmed, Y. Perception of green brand in an emerging innovative market. Eur. J. Innov. Manag. 2012, 15, 514–537. [Google Scholar] [CrossRef]
- Hekkert, P.; Snelders, D.; Van Wieringen, P.C.W. ‘Most advanced, yet acceptable’: Typicality and novelty as joint predictors of aesthetic preference in industrial design. Br. J. Psychol. 2003, 94, 111–124. [Google Scholar] [CrossRef] [PubMed]
- Norman Donald, A. The Design of Everyday Things; MIT Press: Cambridge, MA, USA, 2002. [Google Scholar]
- Desmet, P.; Hekkert, P. Framework of product experience. Int. J. Des. 2007, 1, 57–66. [Google Scholar] [CrossRef]
- Cyr, D.; Head, M.; Ivanov, A. Design aesthetics leading to m-loyalty in mobile commerce. Inf. Manag. 2006, 43, 950–963. [Google Scholar] [CrossRef]
- Creusen, M.E.H.; Veryzer, R.W.; Schoormans, J.P.L. Product value importance and consumer preference for visual complexity and symmetry. Eur. J. Mark. 2010, 44, 1437–1452. [Google Scholar] [CrossRef]
- Xiong, X.; Yue, X.; Dong, W.; Xu, Z. Current status and system construction of used-furniture recycling in China. Environ. Sci. Pollut. Res. 2022, 29, 82729–82739. [Google Scholar] [CrossRef] [PubMed]
- Wang, S.; Fan, J.; Zhao, D.; Yang, S.; Fu, Y. Predicting consumers’ intention to adopt hybrid electric vehicles: Using an extended version of the theory of planned behavior model. Transportation 2016, 43, 123–143. [Google Scholar] [CrossRef]
- Pagiaslis, A.; Krontalis, A.K. Green consumption behavior antecedents: Environmental concern, knowledge, and beliefs. Psychol. Mark. 2014, 31, 335–348. [Google Scholar] [CrossRef]
- Bamberg, S.; Ajzen, I.; Schmidt, P. Choice of travel mode in the theory of planned behavior: The roles of past behavior, habit, and reasoned action. Basic Appl. Soc. Psychol. 2003, 25, 175–187. [Google Scholar] [CrossRef]
- Chen, M.F.; Tung, P.J. Developing an extended theory of planned behavior model to predict consumers’ intention to visit green hotels. Int. J. Hosp. Manag. 2014, 36, 221–230. [Google Scholar] [CrossRef]
- Griskevicius, V.; Tybur, J.M.; Van den Bergh, B. Going green to be seen: Status, reputation, and conspicuous conservation. J. Personal. Soc. Psychol. 2010, 98, 392. [Google Scholar] [CrossRef]
- Stea, D.; Foss, N.J.; Christensen, P.H. Physical separation in the workplace: Separation cues, separation awareness, and employee motivation. Eur. Manag. J. 2015, 33, 462–471. [Google Scholar] [CrossRef]
- Lin, C.-P.; Chen, S.-C.; Chiu, C.-K.; Lee, W.-Y. Understanding purchase intention during product-harm crises: Moderating effects of perceived corporate ability and corporate social responsibility. J. Bus. Ethics 2011, 102, 455–471. [Google Scholar] [CrossRef]
- Sharma, N.; Paço, A.; Kautish, P. The impact of eco-innovation on green buying behaviour: The moderating effect of emotional loyalty and generation. Manag. Environ. Qual. 2022, 33, 1026–1045. [Google Scholar] [CrossRef]
- Ellen, P.S.; Wiener, J.L.; Cobb-Walgren, C. The role of perceived consumer effectiveness in motivating environmentally conscious behaviors. J. Public Policy Mark. 1991, 10, 102–117. [Google Scholar] [CrossRef]
- Roberts, J.A. Green consumers in the 1990s: Profile and implications for advertising. J. Busin. Res. 1996, 36, 217–231. [Google Scholar] [CrossRef]
- Schultz, P.W.; Nolan, J.M.; Cialdini, R.B.; Goldstein, N.J.; Griskevicius, V. The constructive, destructive, and reconstructive power of social norms. Psychol. Sci. 2007, 18, 429–434. [Google Scholar] [CrossRef] [PubMed]
- Tarkiainen, A.; Sundqvist, S. Subjective norms, attitudes and intentions of Finnish consumers in buying organic food. Br. Food J. 2005, 107, 808–822. [Google Scholar] [CrossRef]
- Martínez-Garmendia, J. Application of hedonic price modeling to consumer packaged goods using store scanner data. J. Bus. Res. 2010, 63, 690–696. [Google Scholar] [CrossRef]
- Pomering, A.; Johnson, L.W. Advertising corporate social responsibility initiatives to communicate corporate image: Inhibiting scepticism to enhance persuasion. Corp. Commun. Int. J. 2009, 14, 420–439. [Google Scholar] [CrossRef]
- Chen, Y.; Sun, W. R&D Strategy Study of Customized Furniture with Film-Laminated Wood-Based Panels Based on an Analytic Hierarchy Process/Quality Function Deployment Integration Approach. BioResources 2023, 18, 8249–8263. [Google Scholar] [CrossRef]
- Suri, R.; Monroe, K.B. The effects of time constraints on consumers’ judgments of prices and products. J. Consum. Res. 2003, 30, 92–104. [Google Scholar] [CrossRef]
- Schreier, M. The value increment of mass-customized products: An empirical assessment. J. Consum. Behav. 2006, 5, 317–327. [Google Scholar] [CrossRef]
- Ha, H.Y.; Janda, S. The effect of customized information on online purchase intentions. Internet Res. 2014, 24, 496–519. [Google Scholar] [CrossRef]
- Kim, H.Y.; Lee, Y. The effect of online customization on consumers’ happiness and purchase intention and the mediating roles of autonomy, competence, and pride of authorship. Int. J. Hum.–Comput. Interact. 2020, 36, 403–413. [Google Scholar] [CrossRef]
- Ajzen, I. The theory of planned behavior. Organ. Behav. Hum. Decis. Process. 1991, 50, 179–211. [Google Scholar] [CrossRef]
- Kim, Y.; Han, H. Intention to pay conventional-hotel prices at a green hotel—A modification of the theory of planned behavior. J. Sustain. Tour. 2010, 18, 997–1014. [Google Scholar] [CrossRef]
- Cialdini, R.B.; Reno, R.R.; Kallgren, C.A. A focus theory of normative conduct: Recycling the concept of norms to reduce littering in public places. J. Personal. Soc. Psychol. 1990, 58, 1015. [Google Scholar] [CrossRef]
- Ko, E.; Hwang, Y.K.; Kim, E.Y. Green marketing’ functions in building corporate image in the retail setting. J. Bus. Res. 2013, 66, 1709–1715. [Google Scholar] [CrossRef]
- Donovan, R.J.; Rossiter, J.R.; Marcoolyn, G.; Nesdale, A. Store atmosphere and purchasing behavior. J. Retail. 1994, 70, 283–294. [Google Scholar] [CrossRef]
- Song, J.; Zahedi, F.M. A theoretical approach to web design in e-commerce: A belief reinforcement model. Manag. Sci. 2005, 51, 1219–1235. [Google Scholar] [CrossRef]
- Eroglu, S.A.; Machleit, K.A.; Davis, L.M. Atmospheric qualities of online retailing: A conceptual model and implications. J. Bus. Res. 2001, 54, 177–184. [Google Scholar] [CrossRef]
- Ha, Y.; Lennon, S.J. Effects of site design on consumer emotions: Role of product involvement. J. Res. Interact. Mark. 2010, 4, 80–96. [Google Scholar] [CrossRef]
- Hsieh, J.K.; Hsieh, Y.C.; Chiu, H.C.; Yang, Y.-R. Customer response to web site atmospherics: Task-relevant cues situational involvement PAD. J. Interact. Mark. 2014, 28, 225–236. [Google Scholar] [CrossRef]
- Paul, J.; Modi, A.; Patel, J. Predicting green product consumption using theory of planned behavior and reasoned action. J. Retail. Consum. Serv. 2016, 29, 123–134. [Google Scholar] [CrossRef]
- Yurdakul, M.; Kazan, H. Effects of eco-innovation on economic and environmental performance: Evidence from Turkey’s manufacturing companies. Sustainability 2020, 12, 3167. [Google Scholar] [CrossRef]
- Chen, Y.S.; Chang, C.H. Enhance green purchase intentions: The roles of green perceived value, green perceived risk, and green trust. Manag. Decis. 2012, 50, 502–520. [Google Scholar] [CrossRef]
- Cho, Y.-N.; Thyroff, A.; Rapert, M.I.; Park, S.-Y.; Lee, H.J. To be or not to be green: Exploring individualism and collectivism as antecedents of environmental behavior. J. Bus. Res. 2013, 66, 1052–1059. [Google Scholar] [CrossRef]
- Gudarzi, E.; Tajdini, A.; Pourmousa, S.; Latibari, A.J.; Roohnia, M. Structural equation modeling (SEM) of consumer preferences for wooden furniture (home and office). BioResources 2022, 17, 1551. [Google Scholar] [CrossRef]
- Lei, P.W.; Wu, Q. Introduction to structural equation modeling: Issues and practical considerations. Educ. Meas. Issues Pract. 2007, 26, 33–43. [Google Scholar] [CrossRef]
- Siddiqui, M.H.; Sharma, T.G. Analyzing customer satisfaction with service quality in life insurance services. J. Target. Meas. Anal. Mark. 2010, 18, 221–238. [Google Scholar] [CrossRef]
- Babin, B.J.; Hair, J.F.; Boles, J.S. Publishing research in marketing journals using structural equation modeling. J. Mark. Theory Pract. 2008, 16, 279–286. [Google Scholar] [CrossRef]
- Gerpott, T.J.; Rams, W.; Schindler, A. Customer retention, loyalty, and satisfaction in the German mobile cellular telecommunications market. Telecommun. Policy 2001, 25, 249–269. [Google Scholar] [CrossRef]
- Xu, J.; Gong, J.; Ji, D. Exploring the determinants of users’ co-creation behavior on music streaming platforms in China. PLoS ONE 2023, 18, e0291313. [Google Scholar] [CrossRef]
- Hair, J.F.; Gabriel, M.; Patel, V. AMOS covariance-based structural equation modeling (CB-SEM): Guidelines on its application as a marketing research tool. Braz. J. Mark. 2014, 13, 44–55. [Google Scholar] [CrossRef]
- Wah Yap, B.; Ramayah, T.; Nushazelin Wan Shahidan, W. Satisfaction and trust on customer loyalty: A PLS approach. Bus. Strategy Ser. 2012, 13, 154–167. [Google Scholar] [CrossRef]
- Hair, J.; Hollingsworth, C.L.; Randolph, A.B.; Chong, A.Y.L. An updated and expanded assessment of PLS-SEM in information systems research. Ind. Manag. Data Syst. 2017, 117, 442–458. [Google Scholar] [CrossRef]
- Hu, L.; Bentler, P.M. Fit indices in covariance structure modeling: Sensitivity to underparameterized model misspecification. Psychol. Methods 1998, 3, 424. [Google Scholar] [CrossRef]
- Carrión, G.C.; Henseler, J.; Ringle, C.M.; Roldán, J.L. Prediction-oriented modeling in business research by means of PLS path modeling: Introduction to a JBR special section. J. Bus. Res. 2016, 69, 4545–4551. [Google Scholar] [CrossRef]
- Zhang, W.; Zhou, C.; Yu, M.; Huang, T.; Kaner, J. Interface design for the mobile terminal for furniture shopping in the post-epidemic era: An empirical evidence of user demand collection. BioResources 2023, 18, 5750. [Google Scholar] [CrossRef]
- Zhao, L.; Lee, S.H.; Copeland, L.R. Social media and Chinese consumers’ environmentally sustainable apparel purchase intentions. Asia Pac. J. Mark. Logist. 2019, 31, 855–874. [Google Scholar] [CrossRef]
- Zhou, C.; Qian, Y.; Huang, T.; Kaner, J.; Zhang, Y. The impact of different age-friendly smart home interface styles on the interaction behavior of elderly users. Front. Psychol. 2022, 13, 935202. [Google Scholar] [CrossRef] [PubMed]
| Items | Indexes |
|---|---|
| Green Feature (GF) | Environmental Awareness (EA) |
| Eco-Innovation (EI) | |
| Perceived Green Value (PGV) | |
| Green Brand Image (GBI) | |
| Traditional Characteristics (TC) | Aesthetic Design (AD) |
| Purchase Customisation (PC) | |
| Perceived Consumer Effectiveness (PCE) | |
| Subjective Norms (SN) |
| KMO and Bartlett’s Test | ||
|---|---|---|
| Kaiser–Meyer–Olkin metric for sampling adequacy. | 0.987 | |
| Bartlett’s test of sphericity | approximate chi-square (math.) | 12,726.578 |
| df | 820 | |
| Sig. | 0.000 | |
| Component | Cronbach’s Alpha | rho_A | Composite Reliability | Average Extraction Variance (AVE) |
|---|---|---|---|---|
| AD | 0.807 | 0.807 | 0.886 | 0.721 |
| EA | 0.875 | 0.876 | 0.923 | 0.800 |
| EI | 0.883 | 0.884 | 0.928 | 0.811 |
| GBI | 0.870 | 0.870 | 0.911 | 0.719 |
| PA | 0.811 | 0.812 | 0.888 | 0.726 |
| PC | 0.811 | 0.811 | 0.888 | 0.725 |
| PCE | 0.805 | 0.807 | 0.885 | 0.720 |
| PD | 0.839 | 0.839 | 0.903 | 0.756 |
| PI | 0.850 | 0.850 | 0.909 | 0.769 |
| PP | 0.835 | 0.836 | 0.901 | 0.752 |
| PGV | 0.890 | 0.890 | 0.931 | 0.819 |
| SN | 0.807 | 0.807 | 0.886 | 0.721 |
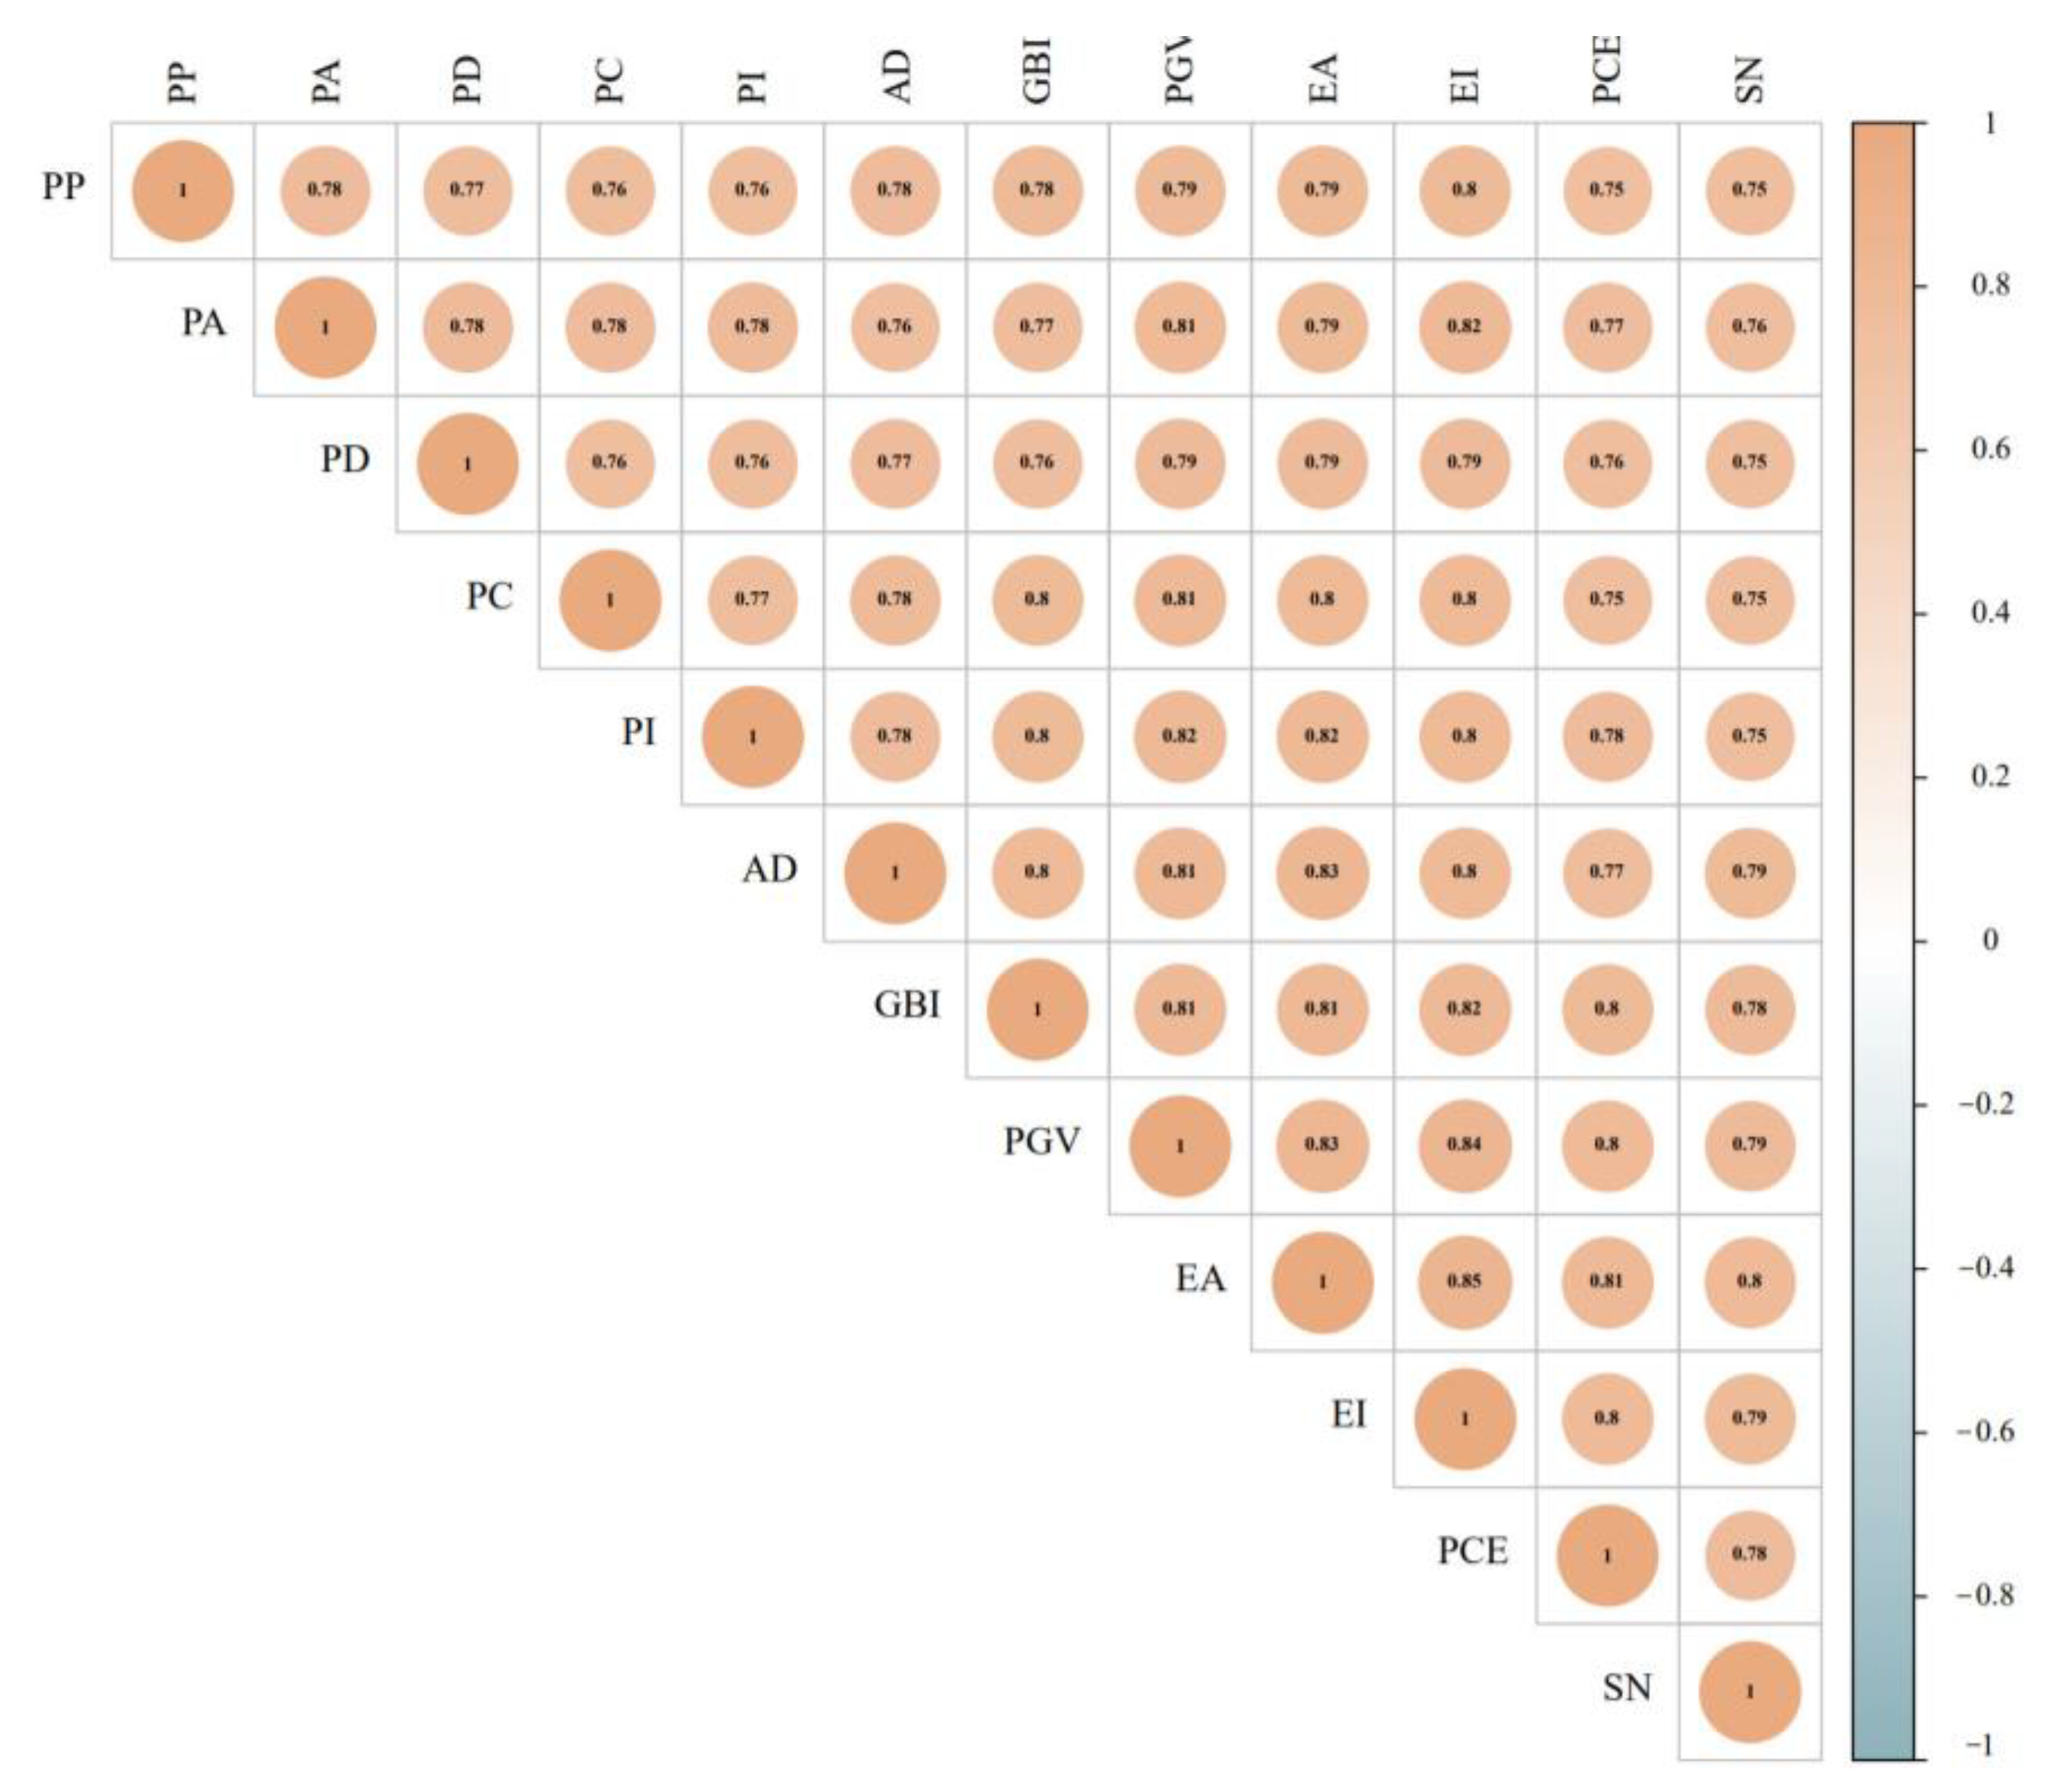
| AD | EA | EI | GBI | PA | PC | PCE | PD | PI | PP | PGV | SN | |
| AD | 0.849 | |||||||||||
| EA | 0.831 *** | 0.894 | ||||||||||
| EI | 0.802 *** | 0.852 *** | 0.900 | |||||||||
| GBI | 0.802 *** | 0.814 *** | 0.817 *** | 0.848 | ||||||||
| PA | 0.757 *** | 0.794 *** | 0.817 *** | 0.767 *** | 0.852 | |||||||
| PC | 0.785 *** | 0.800 *** | 0.802 *** | 0.794 *** | 0.776 *** | 0.852 | ||||||
| PCE | 0.765 *** | 0.809 *** | 0.804 *** | 0.795 *** | 0.770 *** | 0.753 *** | 0.848 | |||||
| PD | 0.774 *** | 0.788 *** | 0.786 *** | 0.764 *** | 0.762 *** | 0.758 *** | 0.755 *** | 0.870 | ||||
| PI | 0.780 *** | 0.816 *** | 0.802 *** | 0.798 *** | 0.784 *** | 0.768 *** | 0.776 *** | 0.765 *** | 0.877 | |||
| PP | 0.776 *** | 0.792 *** | 0.796 *** | 0.785 *** | 0.777 *** | 0.764 *** | 0.746 *** | 0.767 *** | 0.755 *** | 0.867 | ||
| PGV | 0.810 *** | 0.831 *** | 0.840 *** | 0.812 *** | 0.806 *** | 0.812 *** | 0.805 *** | 0.788 *** | 0.820 *** | 0.786 *** | 0.905 | |
| SN | 0.791 *** | 0.800 *** | 0.794 *** | 0.780 *** | 0.758 *** | 0.754 *** | 0.764 *** | 0.753 *** | 0.750 *** | 0.751 *** | 0.787 *** | 0.849 |
| VIF | VIF | ||
|---|---|---|---|
| AD_Row1 | 1.840 | PC_Row1 | 1.753 |
| AD_Row2 | 1.668 | PC_Row2 | 1.762 |
| AD_Row3 | 1.767 | PC_Row3 | 1.798 |
| EA_Row1 | 2.397 | PD_Row1 | 2.086 |
| EA_Row2 | 2.527 | PD_Row2 | 1.869 |
| EA_Row3 | 2.216 | PD_Row3 | 1.993 |
| EI_Row1 | 2.300 | PI_Row1 | 2.152 |
| EI_Row2 | 2.603 | PI_Row2 | 2.233 |
| EI_Row3 | 2.628 | PI_Row3 | 1.903 |
| GBI_Row1 | 2.169 | PP_Row1 | 1.949 |
| GBI_Row2 | 2.044 | PP_Row2 | 1.966 |
| GBI_Row3 | 2.049 | PP_Row3 | 1.914 |
| GBI_Row4 | 2.126 | PGV_Row1 | 2.636 |
| PA_Row1 | 1.828 | PGV_Row2 | 2.622 |
| PA_Row2 | 1.806 | PGV_Row3 | 2.529 |
| PA_Row3 | 1.702 | SN_Row1 | 1.805 |
| PCE_Row1 | 1.674 | SN_Row2 | 1.631 |
| PCE_Row2 | 1.792 | SN_Row3 | 1.871 |
| PCE_Row3 | 1.771 |
| Saturated Model | Estimated Model | |
|---|---|---|
| SRMR | 0.034 | 0.053 |
| d_ULS | 0.837 | 1.957 |
| d_G | 0.776 | 0.888 |
| chi-square value | 1835.288 | 1968.952 |
| NFI | 0.859 | 0.849 |
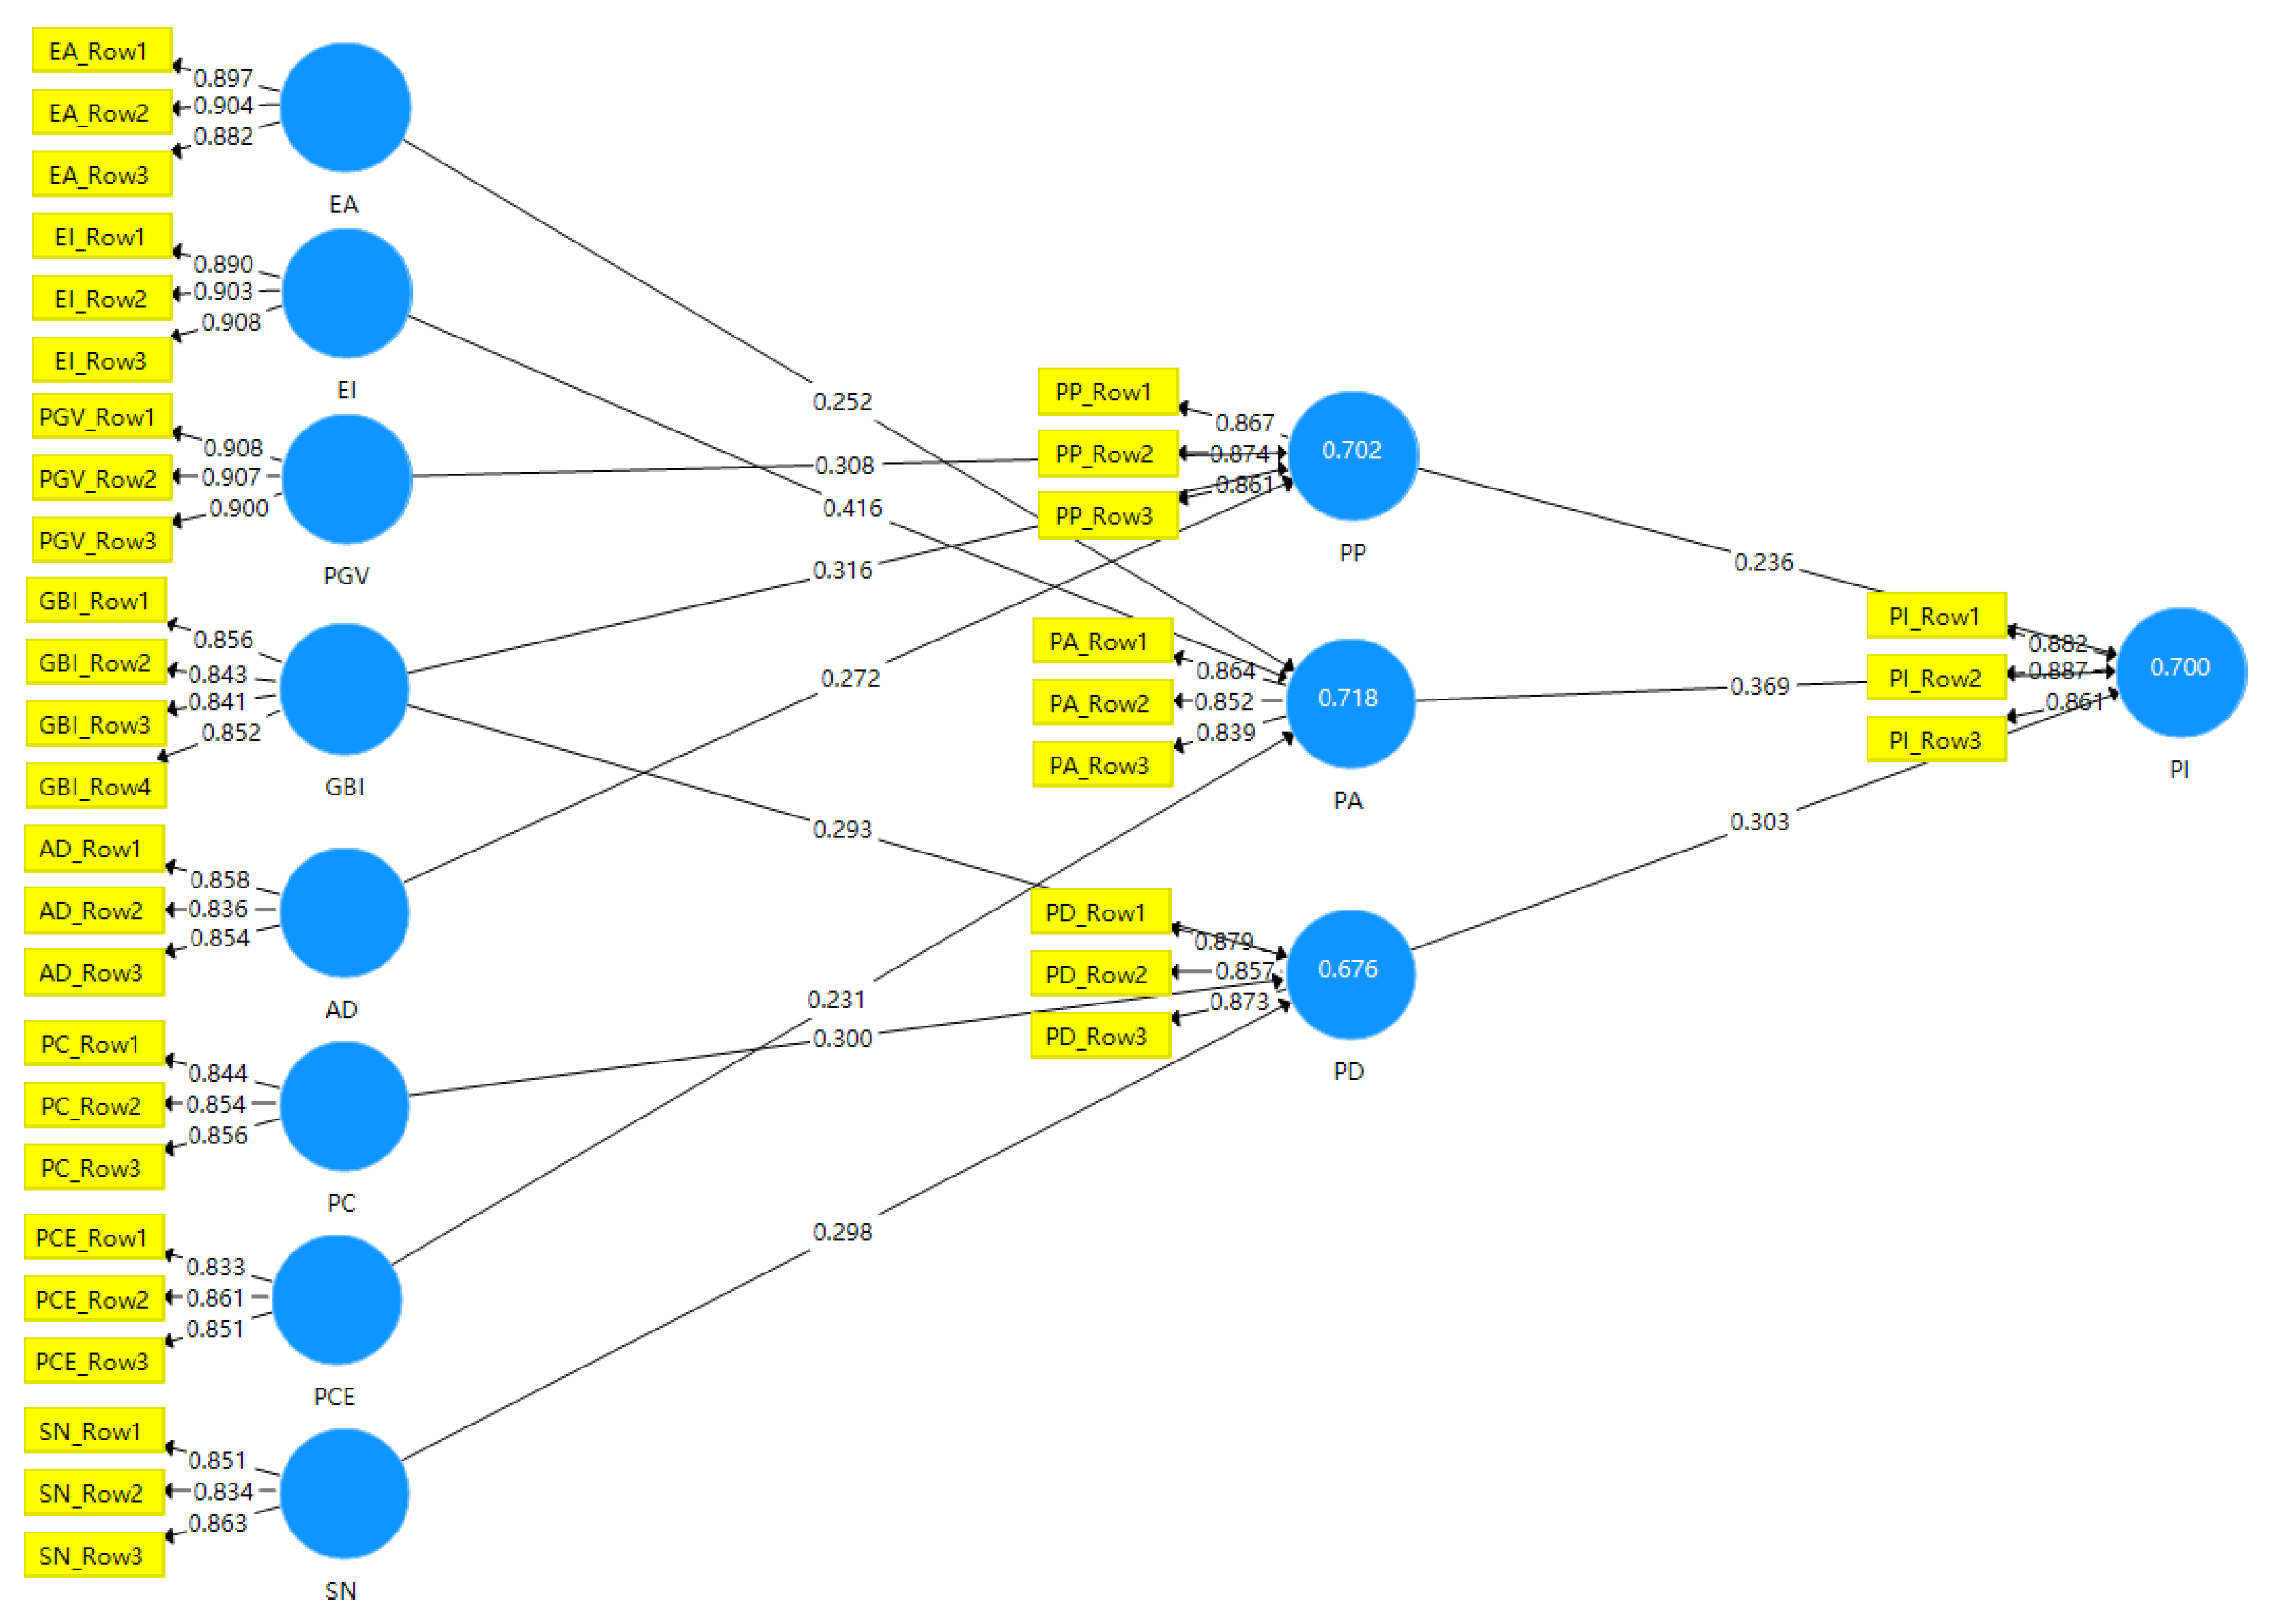
| R2 | Adjusted R2 | |
|---|---|---|
| PA | 0.718 | 0.716 |
| PD | 0.676 | 0.673 |
| PI | 0.700 | 0.697 |
| PP | 0.702 | 0.699 |
| F2 | |
|---|---|
| PA→PI | 0.149 |
| EI→PA | 0.145 |
| PD→PI | 0.104 |
| GBI→PP | 0.094 |
| SN→PD | 0.094 |
| Path | Path Factor (β) | T-Statistic (|O/STDEV|) | p-Value | 95%CI | Results | |
|---|---|---|---|---|---|---|
| LLCI | ULCI | |||||
| AD→PP | 0.272 | 5.218 | <0.001 | 0.166 | 0.373 | Accept |
| EA→PA | 0.252 | 4.294 | <0.001 | 0.148 | 0.381 | Accept |
| EI→PA | 0.416 | 7.557 | <0.001 | 0.305 | 0.518 | Accept |
| GBI→PD | 0.293 | 6.424 | <0.001 | 0.203 | 0.373 | Accept |
| GBI→PP | 0.316 | 6.610 | <0.001 | 0.209 | 0.404 | Accept |
| PA→PI | 0.369 | 8.054 | <0.001 | 0.276 | 0.454 | Accept |
| PC→PD | 0.300 | 6.245 | <0.001 | 0.202 | 0.386 | Accept |
| PCE→PA | 0.231 | 4.389 | <0.001 | 0.125 | 0.327 | Accept |
| PD→PI | 0.303 | 6.874 | <0.001 | 0.209 | 0.382 | Accept |
| PP→PI | 0.236 | 5.398 | <0.001 | 0.147 | 0.316 | Accept |
| PGV→PP | 0.308 | 6.827 | <0.001 | 0.216 | 0.392 | Accept |
| SN→PD | 0.298 | 6.781 | <0.001 | 0.213 | 0.385 | Accept |
| EA→PA→PI | 0.093 | 3.632 | <0.001 | 0.049 | 0.149 | Accept |
| EI→PA→PI | 0.154 | 5.836 | <0.001 | 0.102 | 0.208 | Accept |
| PCE→PA→PI | 0.085 | 3.706 | <0.001 | 0.045 | 0.132 | Accept |
| GBI→PD→PI | 0.089 | 4.433 | <0.001 | 0.052 | 0.131 | Accept |
| PC→PD→PI | 0.091 | 4.596 | <0.001 | 0.056 | 0.131 | Accept |
| SN→PD→PI | 0.090 | 4.850 | <0.001 | 0.060 | 0.127 | Accept |
| AD→PP→PI | 0.064 | 3.870 | <0.001 | 0.037 | 0.103 | Accept |
| GBI→PP→PI | 0.075 | 4.119 | <0.001 | 0.042 | 0.112 | Accept |
| PGV→PP→PI | 0.073 | 4.056 | <0.001 | 0.041 | 0.111 | Accept |
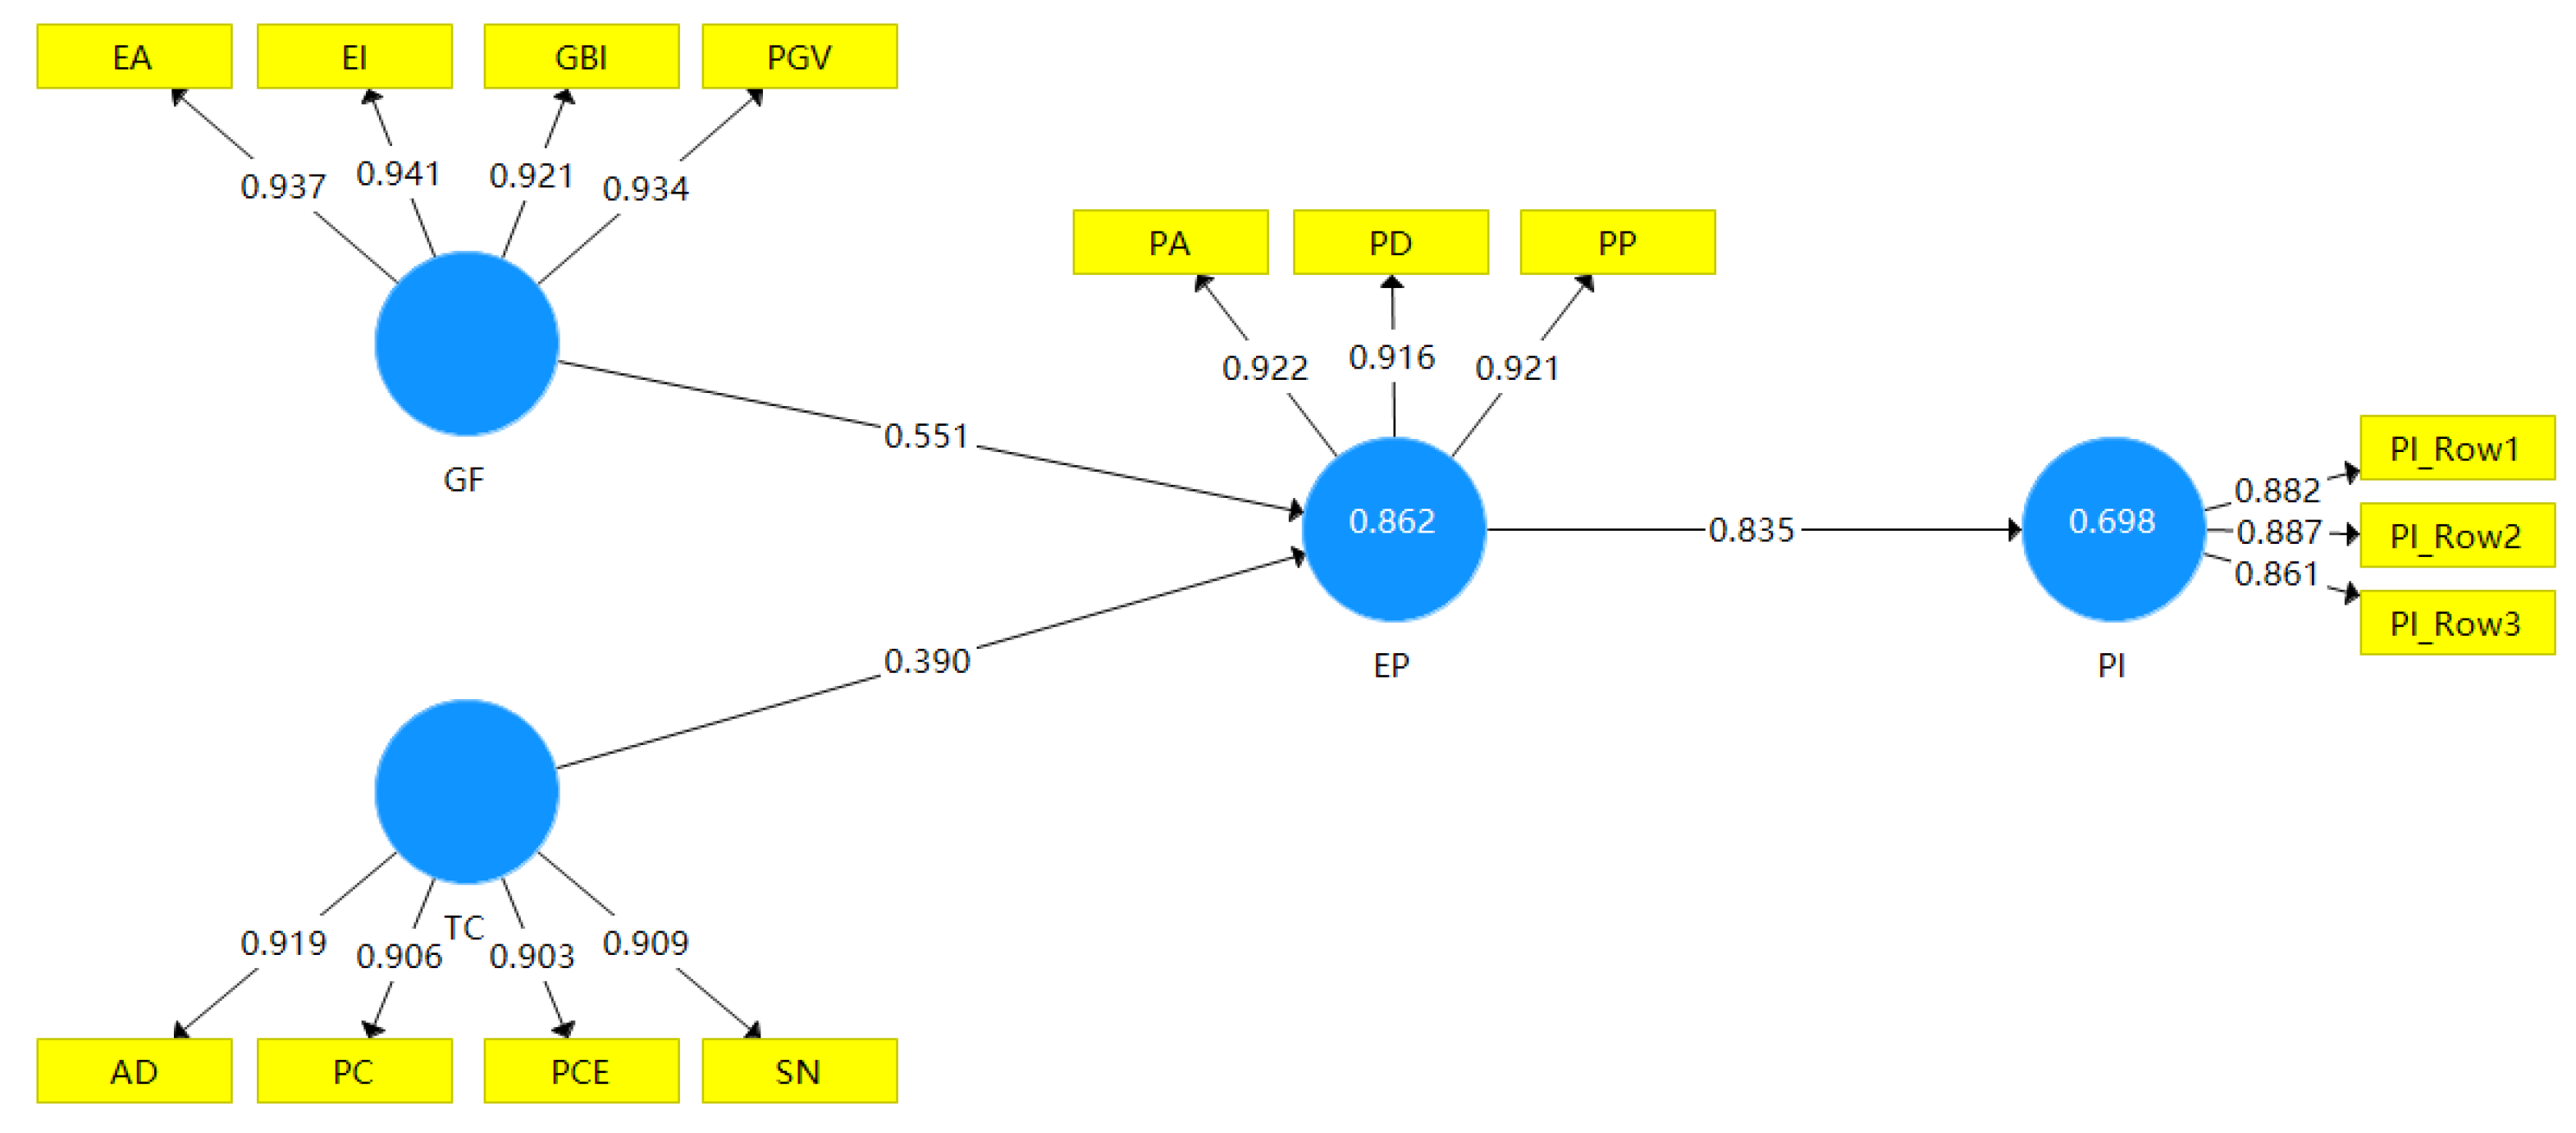
| Path | Path Factor (β) | T-Statistic (|O/STDEV|) | p-Value | 95%CI | Results | |
|---|---|---|---|---|---|---|
| LLCI | ULCI | |||||
| EP→PI | 0.835 | 62.059 | <0.001 | 0.805 | 0.859 | Accept |
| GF→EP | 0.551 | 9.869 | <0.001 | 0.447 | 0.673 | Accept |
| TC→EP | 0.390 | 6.966 | <0.001 | 0.270 | 0.497 | Accept |
| GF→EP→PI | 0.460 | 9.634 | <0.001 | 0.374 | 0.563 | Accept |
| TC→EP→PI | 0.326 | 6.938 | <0.001 | 0.225 | 0.415 | Accept |
| Demographics | GBI→PP | PGV→PP | EP→PI | |
|---|---|---|---|---|
| Gender | Male | 0.329 | 0.381 | 0.807 * |
| Female | 0.299 | 0.230 | 0.861 * | |
| Age group by birth | 1990s | 0.197 * | 0.407 ** | 0.822 |
| 1980s | 0.277 | 0.387 ** | 0.859 | |
| 1970s | 0.509 * | 0.064 ** | 0.823 | |
| Educational background | Low | 0.263 | 0.282 | 0.844 |
| High | 0.379 | 0.310 | 0.826 | |
Disclaimer/Publisher’s Note: The statements, opinions and data contained in all publications are solely those of the individual author(s) and contributor(s) and not of MDPI and/or the editor(s). MDPI and/or the editor(s) disclaim responsibility for any injury to people or property resulting from any ideas, methods, instructions or products referred to in the content. |
© 2024 by the authors. Licensee MDPI, Basel, Switzerland. This article is an open access article distributed under the terms and conditions of the Creative Commons Attribution (CC BY) license (https://creativecommons.org/licenses/by/4.0/).
Share and Cite
Yu, S.; Zhong, Z.; Zhu, Y.; Sun, J. Green Emotion: Incorporating Emotional Perception in Green Marketing to Increase Green Furniture Purchase Intentions. Sustainability 2024, 16, 4935. https://doi.org/10.3390/su16124935
Yu S, Zhong Z, Zhu Y, Sun J. Green Emotion: Incorporating Emotional Perception in Green Marketing to Increase Green Furniture Purchase Intentions. Sustainability. 2024; 16(12):4935. https://doi.org/10.3390/su16124935
Chicago/Turabian StyleYu, Shulan, Zhen Zhong, Yalin Zhu, and Jing Sun. 2024. "Green Emotion: Incorporating Emotional Perception in Green Marketing to Increase Green Furniture Purchase Intentions" Sustainability 16, no. 12: 4935. https://doi.org/10.3390/su16124935
APA StyleYu, S., Zhong, Z., Zhu, Y., & Sun, J. (2024). Green Emotion: Incorporating Emotional Perception in Green Marketing to Increase Green Furniture Purchase Intentions. Sustainability, 16(12), 4935. https://doi.org/10.3390/su16124935