Article

Spatial Analysis and Risk Assessment of Meteorological Disasters Affecting Cotton Cultivation in Xinjiang: A Comprehensive Model Approach

1
National Engineering Technology Research Center for Desert-Oasis Ecological Construction, Xinjiang Institute of Ecology and Geography, Chinese Academy of Sciences, 818 South Beijing Road, Urumqi 830011, China
2
University of Chinese Academy of Sciences, Beijing 100049, China
3
Division of Risk Monitoring and Comprehensive Disaster Reduction, Department of Emergency Management, Urumqi 830011, China
*
Author to whom correspondence should be addressed.
These authors contributed equally to this work.
Sustainability 2024, 16(12), 4938; https://doi.org/10.3390/su16124938
Submission received: 3 April 2024 / Revised: 22 May 2024 / Accepted: 5 June 2024 / Published: 8 June 2024

Abstract

:
A systematic understanding of the spatial distribution of meteorological disasters that affect cotton growth, such as rainstorms, gales, and hail, is important for reducing plant losses and promoting sustainable development. Our study aimed to evaluate the risk of meteorological disasters during cotton growth and analyze their spatial distribution and driving factors. A risk assessment model for major meteorological disasters during cotton cultivation in Xinjiang was established by integrating entropy weight methods and an analytic hierarchy process. A cotton meteorological disaster risk assessment index system, including the vulnerability of disaster-bearing bodies, hazards of disaster-causing factors, and exposure of disaster-bearing bodies, was constructed using Google Earth Engine. We determined the comprehensive risk levels of major meteorological disasters for cotton in various regions of Xinjiang. Research shows that the selection of indicators is very important, and crop risk assessment with a clear disaster-bearing body can make the results more accurate. It is necessary to consider the risk assessment of multiple disaster species for meteorological disaster risk assessment. The results revealed spatial differences in the meteorological disaster risk for cotton in 2020. The very high and high risks for cotton accounted for 42% of the cotton planting area, mainly distributed in Karamay, Tacheng, Kashgar, Changjizhou, Kezhou, and Ilizhou. Consequently, this study provides a scientific basis for cotton cultivation in Xinjiang, China.

1. Introduction

Cotton is a globally significant crop that provides humanity with fiber, oilseed, and textile materials. China is the largest producer and consumer of cotton worldwide. Cotton cultivation in China occurs in three major regions: the Yangtze River Basin, the Yellow River Basin, and Xinjiang (Figure 1a). Xinjiang is the largest cotton-producing region in China in terms of both cultivation scale and total output. According to data from the National Bureau of Statistics of China and the Xinjiang Uygur Autonomous Region Bureau of Statistics, in 1949, Xinjiang’s cotton output accounted for only 1% of China’s total cotton production. By 2011, this figure exceeded 50% and has continued to rise (Figure 1b,c). Statistics from 2021 indicate that Xinjiang’s cotton planting area and total output account for 83% and 90% of China’s total, respectively [1].
Xinjiang, located in an arid region of Central Asia, suffers from water scarcity and possesses a fragile ecological environment, making it particularly sensitive to climate change [2]. As a crucial agricultural base for grain and cotton production in China, it is prone to natural disasters. Over 70% of China’s cities and more than 50% of its population are located in high-risk areas for meteorological, seismic, geological, and marine disasters. Absolute economic losses from natural disasters exhibited a notable upward trend, escalating from USD 32,246 million in the 1980s to the 1990s to surpassing USD 59,457 million from 2010 to 2018, and persistently remaining at elevated levels [3]. Based on data from the third Xinjiang scientific expedition, cotton in the Aksu region has been affected by 4171 natural disasters, covering an area of 48,000 ha and resulting in a loss of USD 25.4 million. Losses caused by major windstorms, hailstorms, and heavy rain account for 98% of all natural disasters, covering 98% of the affected area. However, a comprehensive meteorological disaster risk assessment system for cotton production in Xinjiang has yet to be established. Assessments of such disasters are currently limited to spatiotemporal distribution characteristics [4,5,6,7] and single meteorological events [8], resulting in an insufficient understanding of the combined risks posed by major meteorological disasters. This lack of a comprehensive understanding makes it difficult to identify disaster risks, hampers the emergency management of cotton cultivation, and hinders the development of specific disaster prevention and mitigation strategies.
With the acceleration of global climate change, the frequency, intensity, duration, and spatial extent of extreme weather events have changed, leading to a surge in disaster occurrences [9,10]. The report “Climate Change 2022: Impacts, Adaptation, and Vulnerability”, released by the Intergovernmental Panel on Climate Change (IPCC), highlights the complex trends of climate change risks, where multiple hazards intersect and impact various systems [11]. These risks result in immeasurable and severe losses to agricultural production. The role of comprehensive risk assessments in disaster prevention and mitigation has become increasingly prominent. According to a report by the Food and Agriculture Organization (FAO), from 1991 to 2021, the value of agricultural losses caused by disasters amounted to USD 38 trillion, equivalent to an average annual loss of USD 1.23 trillion, accounting for 5% of the global annual agricultural GDP. According to available data, scholars have paid more attention to disaster risk assessment in agriculture. Studies are becoming more specialized, ranging from the provincial [12] to arable land levels [13]. Research crops include rice [14], corn [15], wheat [16,17], soybean [18], and kiwifruit [19]. The research spans countries such as China [20], India [21,22], the United States [23], Thailand [24], the Philippines [25], and Nepal [26]. Risk assessments and national actions (comprehensive risk surveys) have been conducted for major grain crops, such as rice [27], wheat [28], and maize [29], in various regions of China. However, disaster risk assessments for cotton are lacking, especially in Xinjiang, China’s largest cotton-producing region. Research on multi-hazard meteorological disaster assessments for cotton is almost nonexistent, and the spatial pattern of comprehensive meteorological disaster risks for cotton remains unclear in China.
The selection of weights and indicators plays a crucial role in risk assessment. Currently, there are many methods for determining weights, with commonly used indicator weighting methods including subjective and objective weighting. Subjective weighting methods include the Delphi method, square sum method, and analytic hierarchy process (AHP) [30], whereas objective weighting methods include entropy weighting (EWM), principal component analysis, and gray relational analysis. The analytic hierarchy process can reduce the complexity of decision problems [31], whereas objective weighting methods can reflect the information content of each indicator, but they cannot benefit from the knowledge and experience of decision-makers [32]. Conversely, composite weighting methods combine the advantages of both approaches to yield scientifically reasonable results [33]. In existing studies, a combination of the analytic hierarchy process and entropy weighting methods has been widely applied to meteorological disaster risk prediction and assessment [33,34,35,36,37].
We aimed to construct spatial distribution data for disaster-bearing bodies and the exposure levels of cotton through high-precision remote sensing data interpretation and GIS-supervised classification. By leveraging the Google Earth Engine (GEE) platform, this study aims to establish the hazard levels of the primary causative factors of cotton disasters (meteorological disaster factors: rainstorms, gales, and hail). A comprehensive risk assessment model for meteorological disasters in cotton was developed using an analytic hierarchy process and entropy weighting methods. Finally, maps depicting the comprehensive risk levels of meteorological disasters in cotton were generated to provide decision-making support for precise regional disaster prevention and mitigation strategies. This scientific approach aims to guide regional investments, mitigate disaster risks, and enhance disaster reduction capabilities.

2. Study Area and Data Sources

2.1. Study Area

The topographic outline of Xinjiang illustrates three mountains and two basins (Figure 2). The Altai Mountains lie to the north, and the Kunlun Mountains are distributed along the southern edge of the Tarim Basin. The Tianshan Mountains span the central part of Xinjiang, serving as a dividing line between what are known as Southern Xinjiang and Northern Xinjiang. Northern Xinjiang includes the Altay Administrative Offices (Altay region), Ili Kazakh Autonomous Prefecture (Ilizhou), Tacheng Administrative Offices (Tacheng region), Bortala Mongol Autonomous Prefecture (Bozhou), Changji Hui Autonomous Prefecture (Changjizhou), Turpan City, Hami City, Karamay City, and Urumqi City. Southern Xinjiang is comprised of the Bayangol Mongol Autonomous Prefecture (Bazhou), Kizilsu Kirgiz Autonomous Prefecture (Kezhou), Aksu Administrative Offices (Aksu region), Hotan Administrative Offices (Hotan region), and Kashgar Administrative Offices (Kashgar region). Xinjiang is located deep within the Eurasian continent and is characterized by a typical temperate continental arid and semi-arid climate, experiencing a year-round influence from continental air masses and westerlies. It is affected by temperate, polar North Atlantic, and subtropical weather systems, resulting in low precipitation and arid conditions [38]. Xinjiang has an average annual temperature of 8 °C, annual precipitation of 170 mm, and 2832 annual sunshine hours. It is characterized by long durations of clear skies and sunshine and intense UV. The region experiences low rainfall and high evaporation rates, which contribute to arid conditions. Over the past 60 years, there has been a clear trend towards warming and increased humidity in Xinjiang. The average temperature across Xinjiang has risen by 0.4 °C, and the average precipitation has increased by 8% during this period. The frequency and intensity of meteorological disasters, such as strong winds, heavy rainfall, and hailstorms, have also been increasing. According to meteorological disaster alert data from 2019 to 2021 in Xinjiang, there were 9597 alerts for strong winds, 2271 alerts for heavy rainfall, and 1605 alerts for hailstorms, showing a yearly increasing trend. As the largest cotton-producing region in China, the northern Xinjiang cotton-growing area, particularly the Tacheng region, has the largest cultivation area. In 2020, the planting area reached 245 thousand hectares with a yield of 249 kilotons. In the cotton-growing area of southern Xinjiang, the largest planting area is in the Aksu region. In 2020, the planting area reached 504 thousand hectares with a yield of 568 kilotons.

2.2. Data Sources

Meteorological data, including daily CHIRPS rainfall, hourly gales, instantaneous wind speed, and hail data, were obtained from the ERA5 dataset in the GEE. The study period was 1981–2020. Land use data for 2020 were downloaded from the 30 m annual land cover dataset (CLCD) [39]. Cotton production data were obtained from the Xinjiang Statistical Yearbook and the Xinjiang Production and Construction Corps Statistical Yearbook from 2001 to 2020. Cotton sample and classification index data were selected from the Sentinel-2 and MOD13Q1 data for 2020. The spatial resolution of the digital elevation model (DEM) is 90 m, and it was obtained from the Data Center of Resources and Environmental Sciences, Chinese Academy of Sciences (https://www.resdc.cn (accessed on 2 April 2024)). The spatial scope of all research data covers Xinjiang, China. The data types, sources, times, and resolutions used in this study are presented in Table 1.
Considering the large extent of our study area, we emphasized the practicality and efficiency of data processing when choosing the spatial resolution. Based on the regular distribution and large planting area of croplands in the study area, we opted for a spatial resolution of 500 m. This decision aims to balance the efficiency and quality of data processing to ensure the accuracy of our research findings. Therefore, we used a resolution of 500 m for the calculation of all driving factors and derived models.

3. Methods

3.1. Indicator System for Evaluating Meteorological Disaster Risks in Cotton

Considering the hazards of disaster-causing factors (H), exposure of disaster-bearing bodies (E), and vulnerability of disaster-bearing bodies (V), a comprehensive assessment system for meteorological disasters in cotton cultivation was established. This system comprises target, factor, and indicator layers with the meanings of each indicator, as shown in Table 2.

3.1.1. Definition of Hazard Indicators of Disaster-Causing Factors

According to the classification of Xinjiang precipitation level standards, a daily precipitation ≥ 24.1 mm is deemed a rainstorm. Rainfall amount and frequency are pivotal factors influencing rainstorm disasters [40]. Therefore, the number of annual rainstorm days (d), yearly rainstorm amount (mm), and yearly rainstorm maximum (mm) were selected to evaluate rainstorm risk. According to the wind speed classification standards in the study area, a wind speed greater than 17.2 m/s at a 10 m height is considered a gale, and a day featuring such conditions is labeled a gale day. The annual number of gale days (d), annual instantaneous maximum gale wind speed (m/s), and annual hourly maximum gale wind speed (m/s) were selected to evaluate the risk of gales. If a hail event occurred on any day of the year, it was considered a hail day. The annual number of hail days (d) was selected as an indicator to assess hail risk.

3.1.2. Definition of Exposure Indicators of Disaster-Bearing Bodies

The exposure of disaster-bearing bodies of cotton is typically reflected in the cotton planting area [41]. The larger the disaster area, the greater the risk during a disaster. In this study, cotton exposure was defined as the ratio of the cotton-planting area to the total cultivated land area of each region. In this study, croplands were extracted based on the CLCD data of the study area in 2020. Within the cropland extent, the cotton and non-cotton samples were visually interpreted using Sentinel-2 data. A total of 5299 cotton and 5478 non-cotton sample points were selected, resulting in 10,777 sample points, as illustrated in Figure 2. Subsequently, the EVI data were utilized as features for random forest classification. Finally, a random forest classifier was constructed to obtain the spatial distribution of the cotton planting areas. The specific definition of exposure used in this study is the ratio of cotton planting area to cropland area (Fa), and the formula is as follows:
F a = A m A
where  A m  is the cotton planting area in Xinjiang county, extracted from the spatial distribution of cotton in Xinjiang;  A  is the cultivated area in Xinjiang county, extracted from the CLCD China land cover dataset.

3.1.3. Definition of Vulnerability Indicators of Disaster-Bearing Body

The vulnerability of disaster-bearing cotton bodies can be measured using the yield reduction rate [42]. This study employed the average yield reduction rate in the lean years from 2001 to 2020 to indicate cotton vulnerability. Cotton actual yield per unit area  ( Y )  can be decomposed into trend yield   ( Y t ) , meteorological yield  ( Y w )  and random noise ( ε ) by the following formula:
Y = Y t + Y w + ε
where  Y  is the cotton yield per unit area and  Y t  is the long-term yield component reflecting the development level of productivity in the historical period, which is called the trend yield.  Y w  is the yield component influenced by short-term changes in meteorological factors; referred to as the meteorological yield.  ε  is the yield component affected by stochastic factors such as pests and diseases, social unrest, etc. This was not considered in the actual calculation because of its small proportion. The trend yield was simulated using a linear sliding average simulation with a sliding step size of 5. After determining the trend yield, the meteorological yield formula is as follows:
Y w = Y Y t
Relative meteorological yield ( Y r )  can be calculated as follows:
Y r = Y w Y t
The relative meteorological yield ( Y r ) was not affected by the different agricultural technology levels during the historical period, and its physical significance indicates the amplitude of fluctuations in cotton. Relative meteorological yield is the relative variability of changes in yield that deviate from the trend, and negative relative variability is the yield reduction rate.
The average yield reduction ( P ) in lean years can be calculated as follows:
P = ( i = 1 n Y r i ) / n
For relative meteorological yield sequences  { Y ri } Y rj = 0  is the critical value for crop failure, and when  Y ri < Y rj  and  n  is the number of lean years, the average yield reduction in lean years is obtained.

3.2. Standardized Treatment

The indicator data must be subjected to a standardization process to standardize the dimensions of the evaluation indicators. The formula used for data standardization in this study is as follows:
Y i j = X i j X m i n X m a x X m i n
where  X ij   and  Y ij  are the original index value and standardized value of the ith index (i = 1, 2, …, m) and the jth evaluation object (j = 1, 2, …, n), respectively.  X max  and  X min  are the maximum and minimum values of m evaluation indicators, respectively.
All the data were resampled to a spatial resolution of 500 m for comparative analyses. This study employed the Jenks natural break classification method to individually illustrate the distribution maps of the hazards of disaster-causing factors, exposure of disaster-bearing bodies, and vulnerability of disaster-bearing bodies. These maps were classified into five levels: very high, high, medium, low, and very low.

3.3. Weight Calculation Method

AHP [43] was used to obtain the subjective weight, and EWM [44] was used to obtain the objective weight. The weights obtained from the two methods were combined to obtain a comprehensive weight for the subsequent evaluation of the total risk of cotton. Determine the weight vectors of each evaluation indicator through AHP  w i =   w 1 ,   w 2 ,   w 3 , ,   w m ; and the weight vector of each evaluation index determined by EWM  w i =   w 1 ,   w 2 ,   w 3 , ,   w m . The comprehensive weight [45] of each evaluation index is
  w i = ( w i · w i ) 0.5 i = 1 n ( w i · w i ) 0.5

3.4. Meteorological Disaster Risk Assessment Model

Establish a risk assessment model for meteorological disasters (rainstorms, gales, and hail).
R = H w h · E w e · V w v
where  R  is the meteorological disaster risk index and  H E  and  V  represent the total evaluation index values of the hazard of disaster-causing factors, exposure of disaster-bearing bodies, and vulnerability of disaster-bearing bodies, respectively.  w h w e  and  w v  represent their comprehensive weights, respectively.
The hazard index consists of the rainstorm hazard index, gale hazard index, and hail hazard index using the following formulas:
The rainstorm hazard index formula:
H r = i = 1 m C i · w i
The gale hazard index formula:
H g = i = 1 m C i · w i
The hail hazard index formula:
H h = i = 1 m C i · w i
Comprehensive hazard index formula:
H = H r · w r + H g · w g + H h · w h
where  m  is the number of indicators corresponding to the corresponding guideline layer,  C i ( 0 C i 1 ) is the standardized quantitative value of the ith indicator, and  w i  is the weight value of the ith indicator,  w r w g ,   w h , are the comprehensive weights of the hazard indices of rainstorms, gales, and hail.

3.5. Technology Roadmap

The main purpose of this study is to evaluate the meteorological disaster risk of cotton in Xinjiang by combining AHP and EWM to calculate the weights. We established a comprehensive evaluation index system for cotton meteorological disaster risk assessment, including hazard, exposure, and vulnerability. Moreover, we constructed a risk assessment model and determined the comprehensive risk level of cotton meteorological disasters in Xinjiang. The technical flowchart of this study is shown in Figure 3 below.

4. Results

4.1. Assessment Indicator Thresholds Determination and Weight Calculation

The natural breakpoint method is used in this study to determine the classification points for each indicator threshold, and the specific thresholds are shown in Table 3. The accuracy of the indicators is crucial for the accuracy of the evaluation results. The AHP utilized in this study has passed the consistency test. The weights of each indicator are listed in Table 4. The hazard weight of the disaster-causing factor was 30%, with rainstorms contributing the most at 59%. The exposure weight of the disaster-bearing body was 58%, and the vulnerability weight of the disaster-bearing body was 12%. The annual number of rainstorm days contributed the most to rainstorm weights (59%). High wind days contributed the most to high wind weights (75%).

4.2. Hazard Evaluation of Disaster-Causing Factors

The main meteorological disaster-causing factors for cotton include rainstorms, gales, and hail. The spatial distribution of the hazard levels of rainstorm disaster-causing factors is shown in Figure 4a. The Tianshan region exhibits high and middle hazard levels, with the closer to the mountainous area, the higher the hazard level, and the very high hazard level at the junction of the three regions of Ilizhou, Bozhou, and Tacheng. Low hazard levels were primarily found in the Altay region, Tacheng regions of northern Xinjiang, and the northern part of Changjizhou, while deficient hazard levels were present in southern Xinjiang and Hami city, with the most extensive distribution area accounting for 58% of the entire Xinjiang province.
The overall distribution of hazard levels of gale disaster-causing factors in Xinjiang shows that the eastern part is greater than the western part, and the southern part is greater than the northern part (Figure 4b). The very high hazard level of gales was mainly distributed in Hami City, Turpan City, and the Kunlun Mountains. The high-hazard areas were primarily located around the very high-hazard areas. The middle-hazard area was mainly around the high-hazard area and the Tacheng region. The low- or very low-hazard gale regions were mainly located far from the wind areas in the west, with the most extensive distribution area accounting for 71% of Xinjiang.
The main distribution characteristics of hailstorm risk in the research area were higher in the western region than in the eastern region, and higher in mountainous areas than in basins and plains (Figure 4c). Areas with high or very high hazard levels were mainly distributed in the Aksu, Kashgar, Kezhou, and Kunlun Mountains. The Altay region and Hami City in northern Xinjiang, as well as the Taklimakan Desert, are areas with low and deficient hazard levels. The low-hazard level area was the largest, accounting for 45% of the Xinjiang area.
Figure 4d shows the spatial distribution of comprehensive hazard levels for rainstorms, gales, and hail. In the Gurbantunggut and Taklimakan deserts, the hazard levels for these disasters and their causative factors are low. The low comprehensive hazard level for disasters predominantly covers the Gurbantunggut Desert in Northern Xinjiang and the Taklimakan Desert in Southern Xinjiang. In Hami City, despite the high hazard level from gales, their low weight results in an overall low comprehensive hazard. The largest areas are those with the lowest hazard levels, notably in Altay and northern Tacheng. Ilizhou, although a low-risk area for gales, has a high rainstorm hazard weight, leading to a very high overall hazard level. High-risk areas are mainly in northern Bazhou, western Kashgar, and around Kunlun Mountain, while medium-hazard levels are typically found along the fringes of the Tianshan and Kunlun Mountains.

4.3. Exposure of Disaster-Bearing Bodies

Based on the aforementioned calculations and remote sensing extraction methods, the spatial distribution pattern of cotton in the study area depicted in Figure 5 was obtained. The Kappa accuracy of cotton in all counties of Xinjiang was above 73%, and both the user and extraction accuracies were above 75%. The overall accuracy exceeded 85%. The accuracy of the cotton-producing regions in Xinjiang was 91%, which can be used for the subsequent analysis of cotton exposure risks.
The cotton planting area is an essential indicator for assessing the risk of meteorological disasters. The greater the proportion of the cotton planting area to the cropland area, the higher the exposure risk. The risk of exposure of cotton in Xinjiang was higher in the west than in the east. It was more significant in southern Xinjiang than in northern Xinjiang, with concentrations in central Xinjiang (Figure 5). The areas with high exposure were mainly the Aksu, northern Kashgar, northern Bazhou, Bozhou, Tacheng, and Changjizhou regions, which are consistent with the optimal latitude and longitude range of cotton planting areas [7]. The high-exposure areas were scattered in Bachu County, Alar City, Aksu City, northern Xayar County, Korla City, Usu City, Shawan, and Manas County. Very low exposure risks were mainly distributed in the Altay region without cotton planting and in Turpan City, Hami City, and the Hotan region with little cotton planting. Low-exposure-risk areas are mainly located in southern Bazhou.

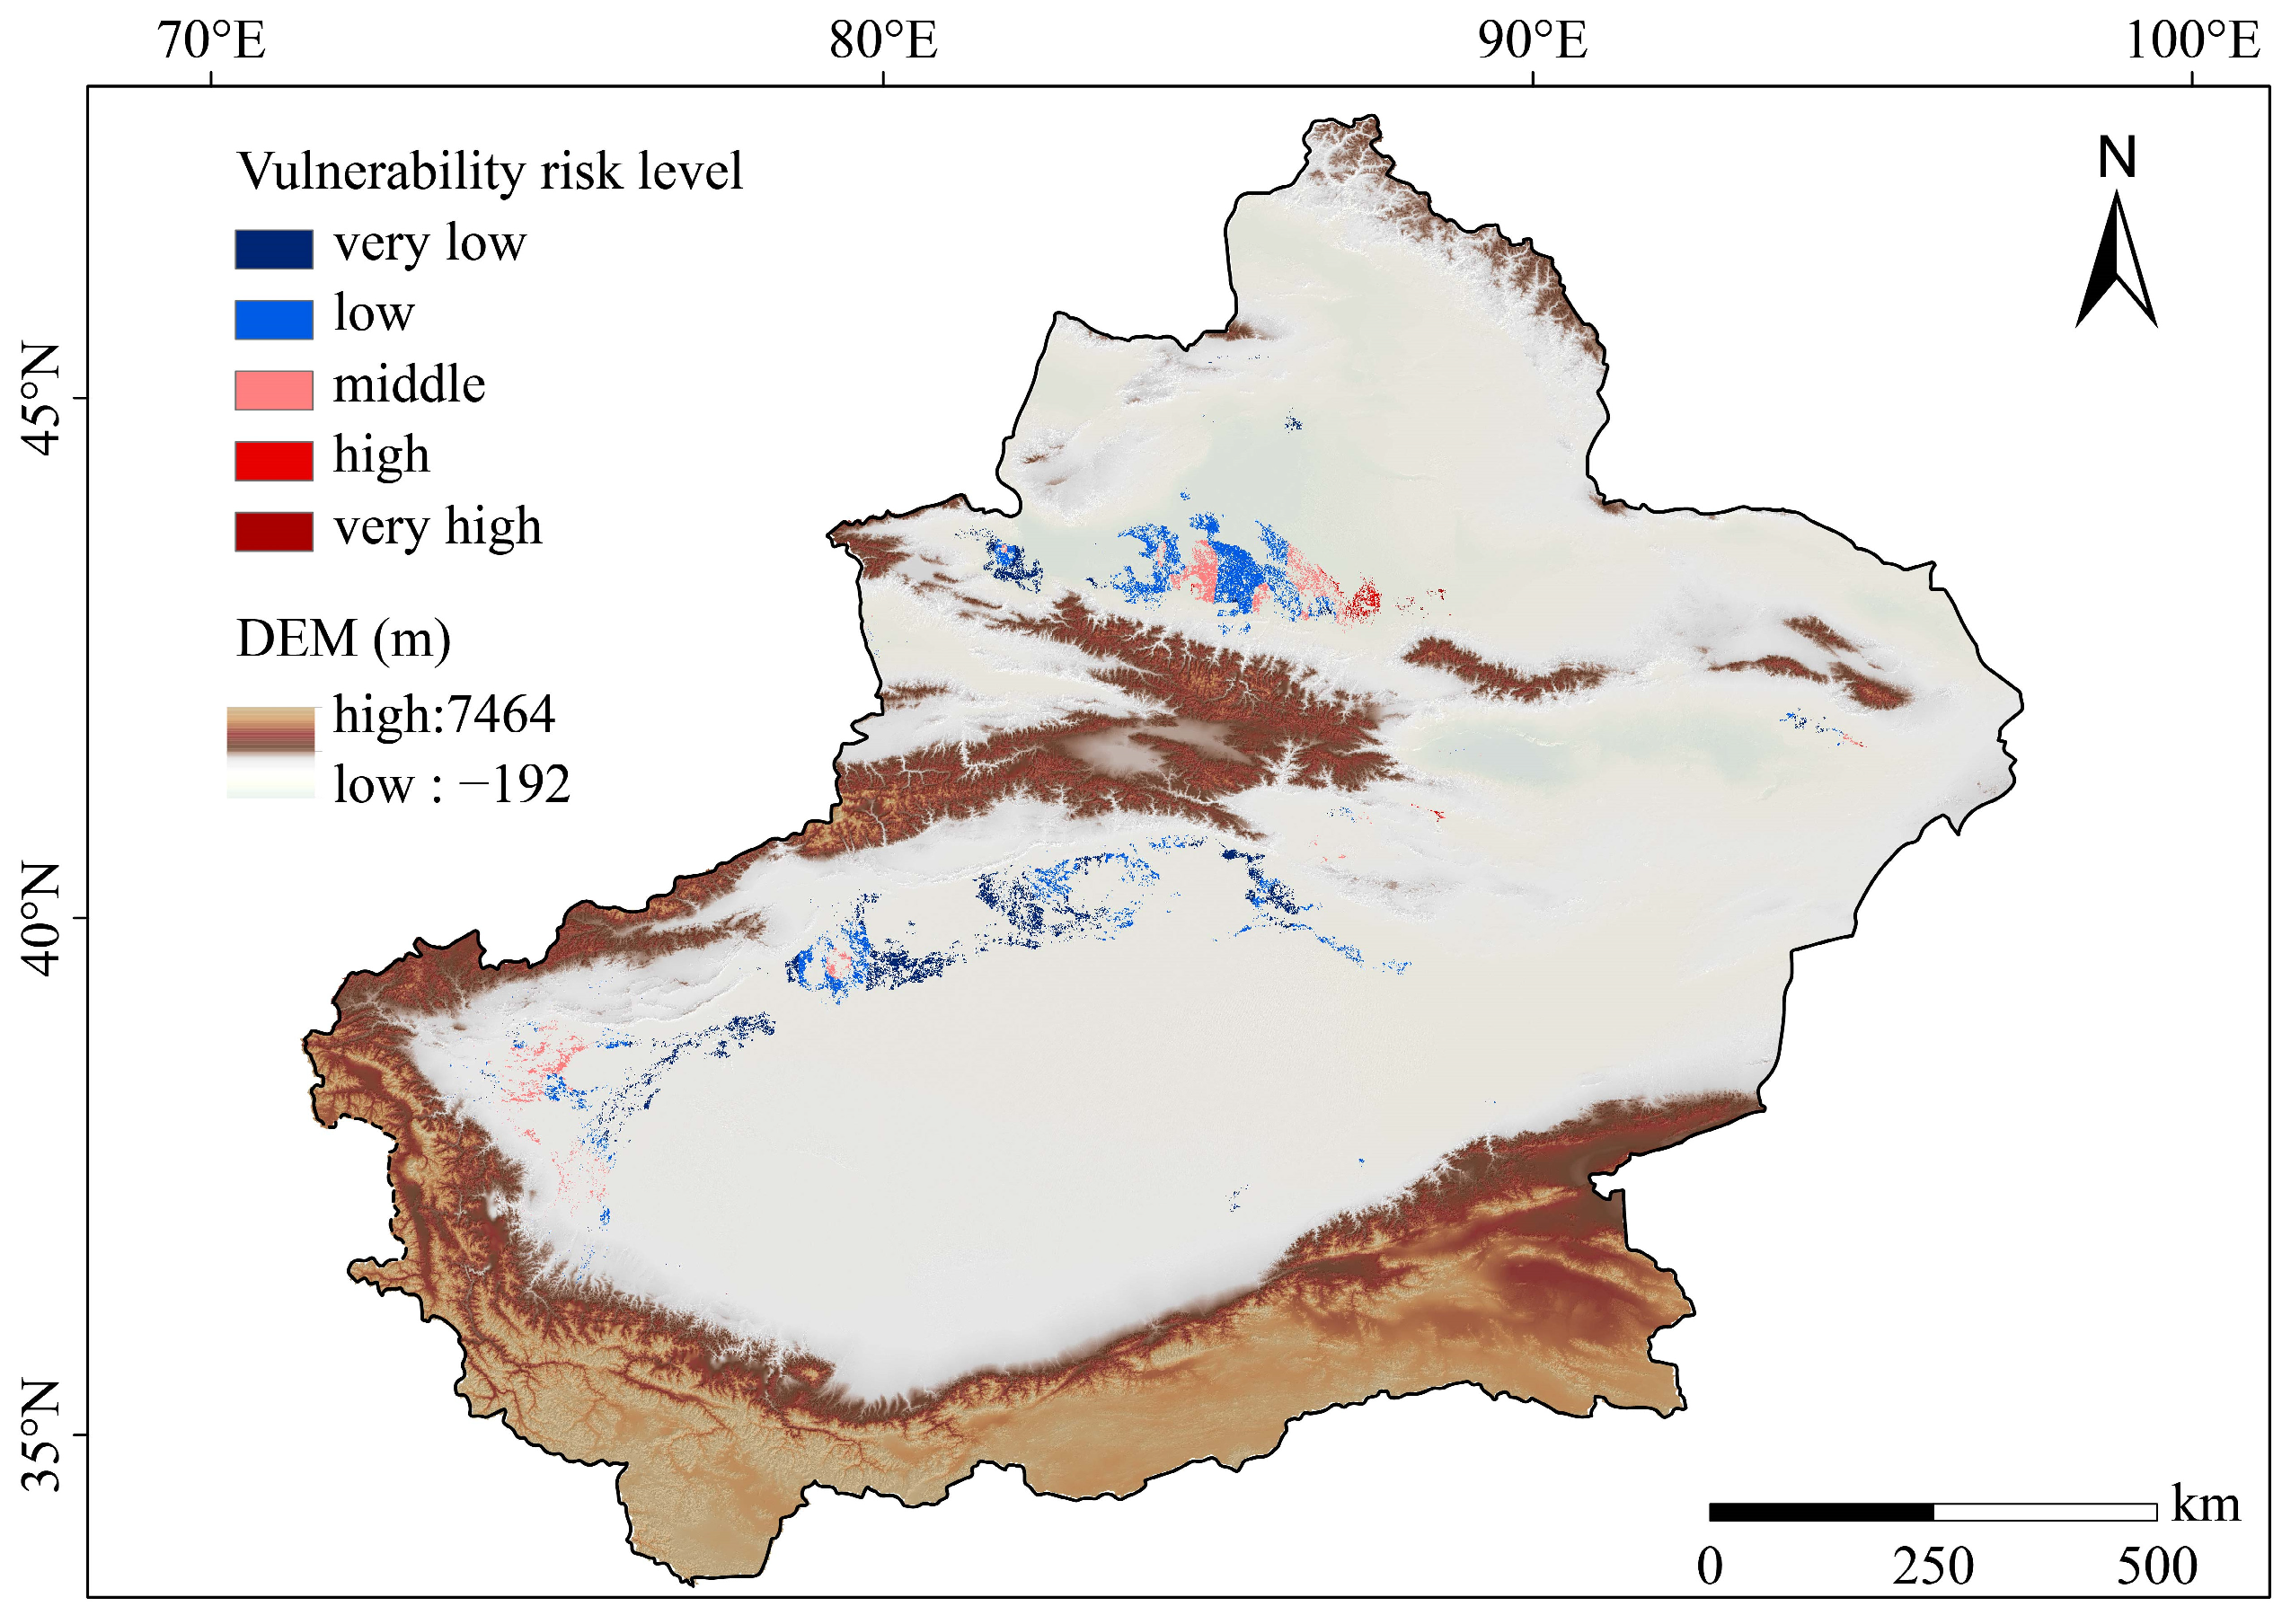
4.4. Vulnerability of Disaster-Bearing Bodies

The yield reduction rate was used to assess the vulnerability risk level of cotton. The higher the vulnerability of the cotton, the more susceptible it is to meteorological disasters. The high/very high vulnerability areas of cotton in Xinjiang are mainly in Changjizhou and the eastern part of Hami city (Figure 6), with Fukang having the highest average yield reduction rate from 2001 to 2020, reaching 15%, followed by Yiwu County with a yield reduction rate of 13%. The area with low vulnerability was the most widely distributed, with cotton planting accounting for 46% of the area with low vulnerability. The low vulnerability areas were mainly in the Aksu, Bozhou, and Tacheng regions. Moderate vulnerable areas are less distributed, mainly in the Kashgar and Tacheng regions.

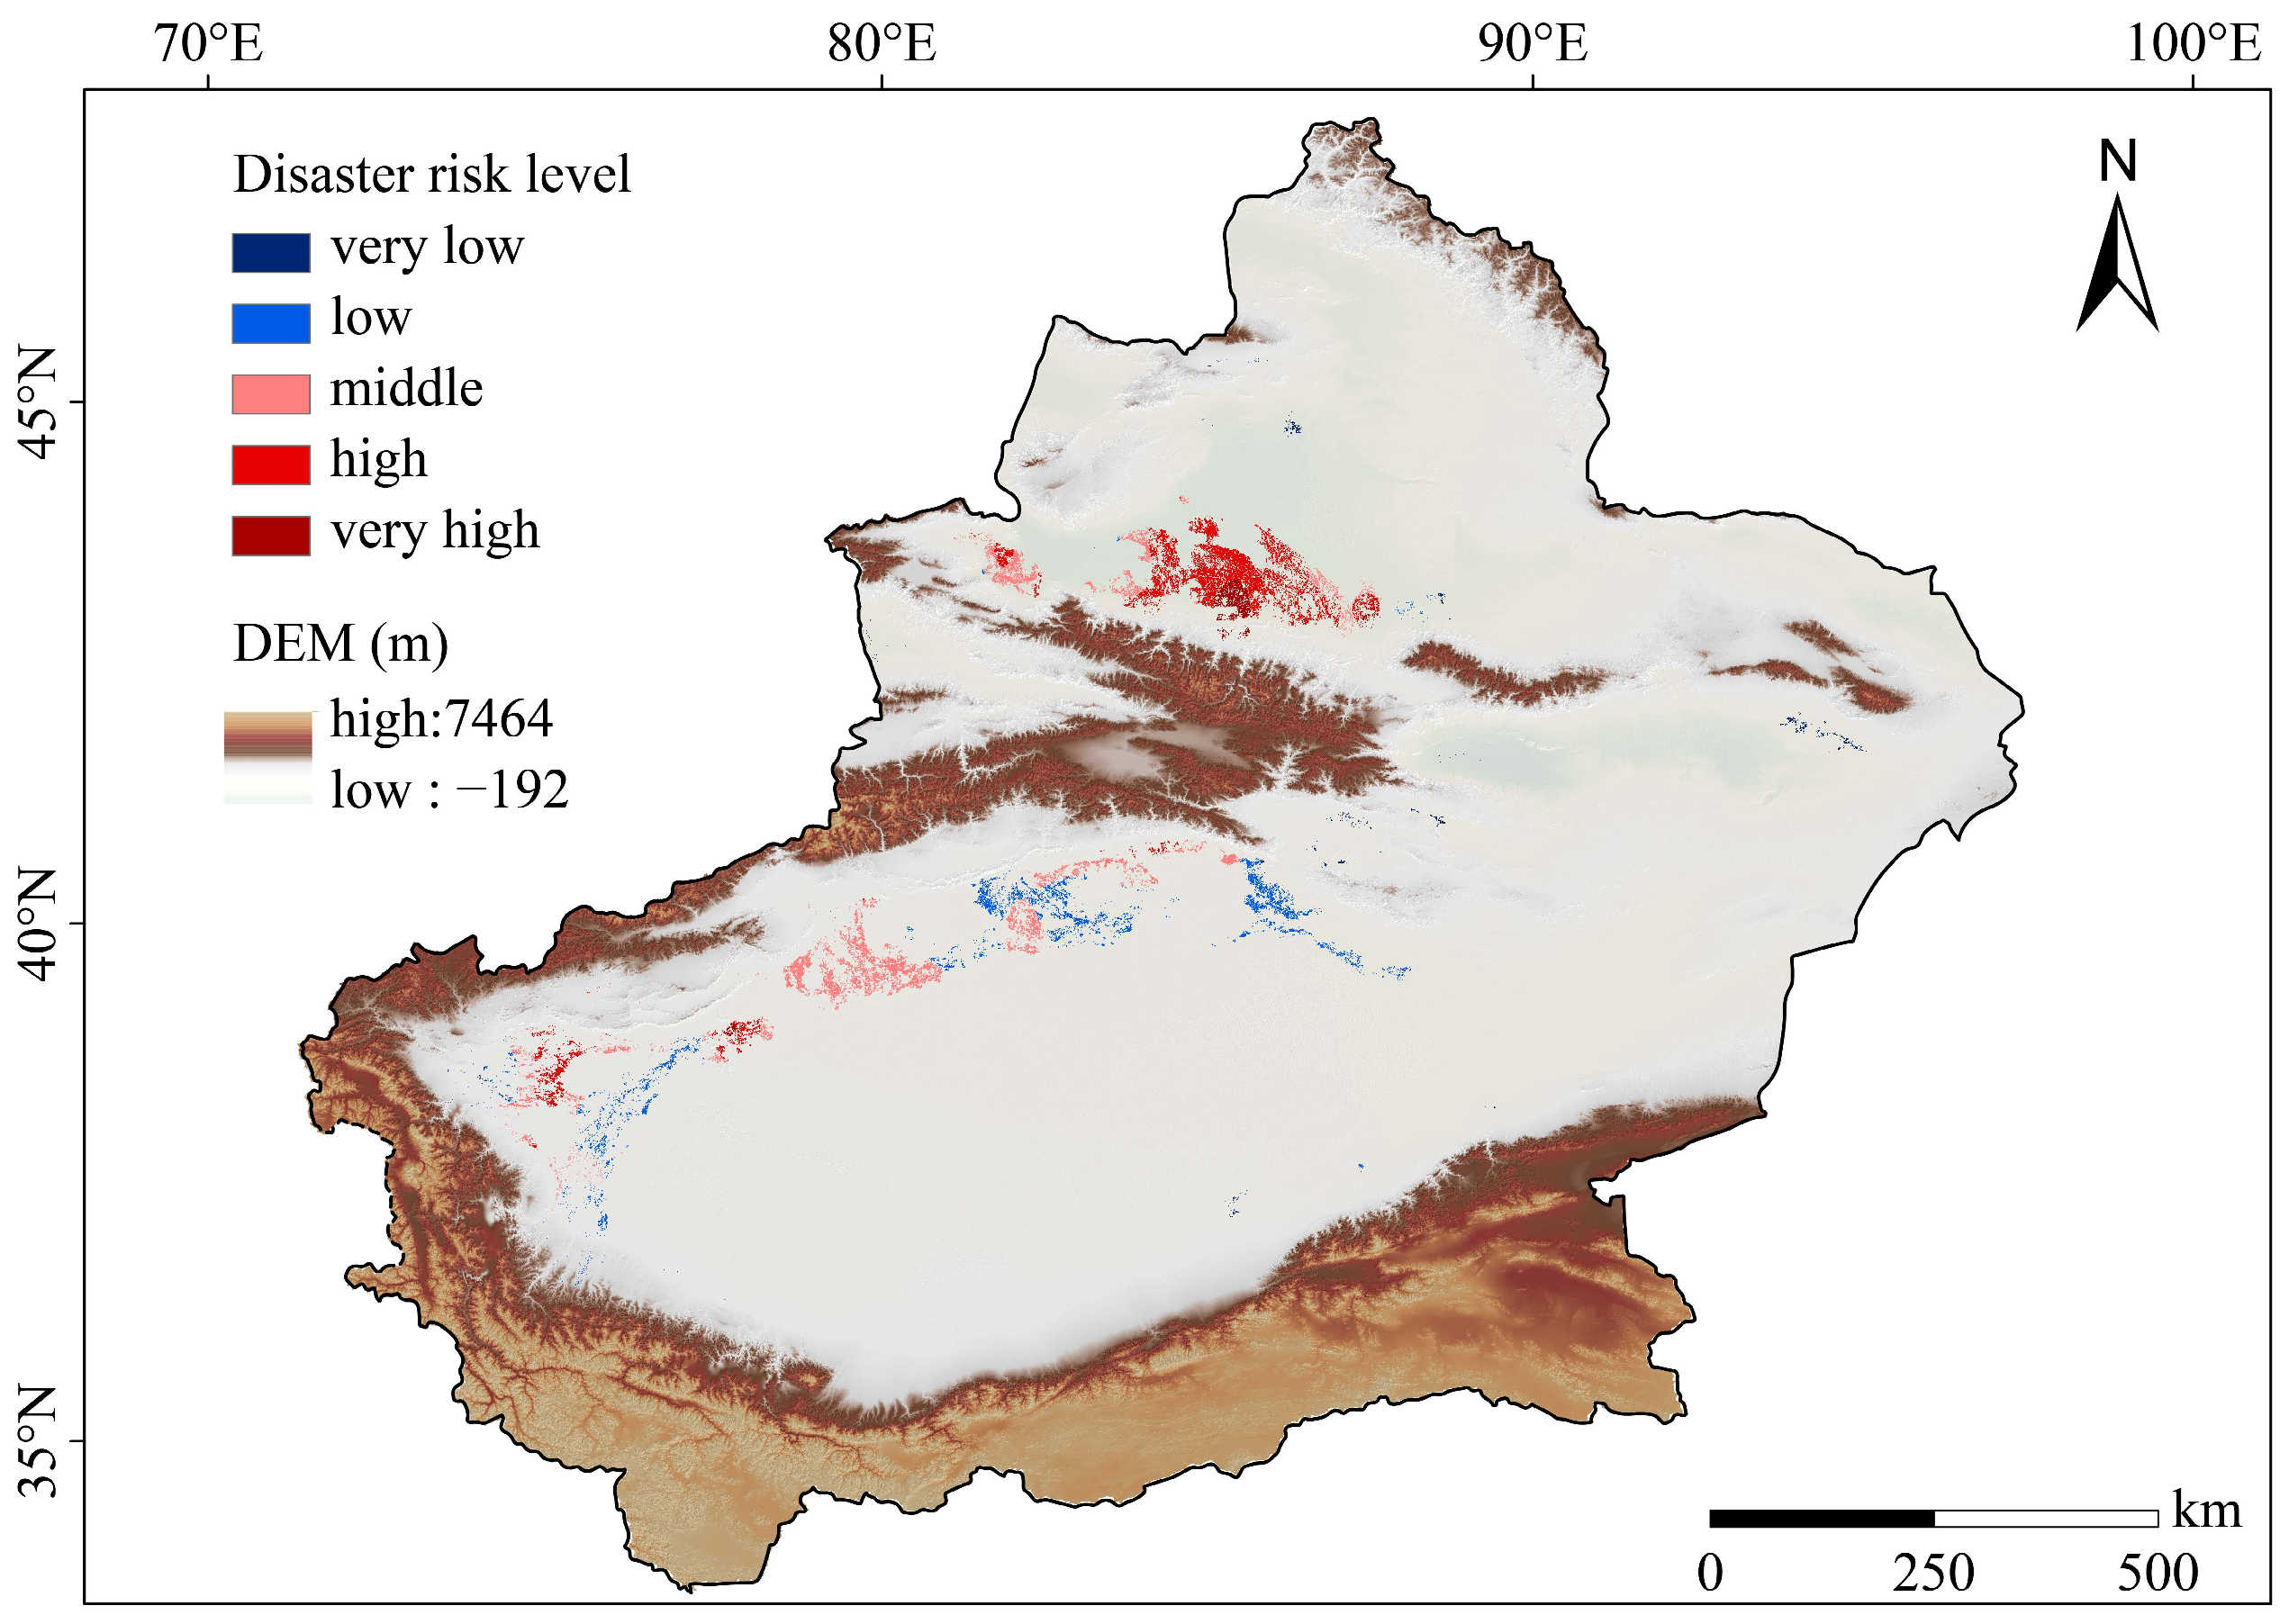
4.5. Meteorological Disaster Risk for Cotton

Cotton yield is affected by rainstorms, gales, and hail. The risk of meteorological disasters for cotton is higher in the west than in the east and more significant in the north than in the south (Figure 7). The meteorological disaster level was dominated by high risk, accounting for 37% of all levels, and was mainly distributed in the Changjizhou, Karamay, Tacheng, Ilizhou, Kezhou, and Kashgar regions. This very high-risk area accounted for 5% of the total and was mainly distributed in the Tacheng, Kashgar, and Changjizhou regions. The middle-risk areas accounted for 36% of the total area and are primarily located in the Bozhou, Aksu, Ilizhou, and Kashgar regions. Low-risk areas accounted for 19% of the total area, mainly in the Bazhou and Ashgar regions. The low-risk area accounted for 2%, mainly in Hami City, Turpan City, and the Hotan region. Xinjiang cotton in very high-risk areas accounted for 5% of the cotton planting area, high-risk areas accounted for 37%, middle-risk areas accounted for 36%, low-risk areas accounted for 19%, and very low-risk areas accounted for 2% of the total (Table 5).

5. Discussion

The Xinjiang region has been threatened by multiple meteorological disasters that have severely challenged the region’s agricultural output and socioeconomic stability. Consequently, investigating meteorological disaster risks in Xinjiang is of significant academic and practical value.
The accuracy of indicators is crucial for the accuracy of assessment results. The selected indicators in this study, including Hr1, Hr2, Hg1, Hh1, Fa, and P, are among the most commonly used indicators in meteorological disaster risk assessment [7,41,42,46,47,48]. For rainstorm indicators, Hr1 and Hr2 are typically chosen as they represent the primary characteristics of rainfall events [49]. Many scholars have used these two indicators to assess rainfall disaster risk [50,51]. However, to better characterize the risk of rainstorm-causing factors, we also included the Hr3 indicator. The Hr3 indicator can measure the intensity of precipitation events and the potential risk of flooding. Previous studies have also applied this indicator, demonstrating its effectiveness in assessing rainfall risk [52,53,54]. For gale disasters, some scholars have only considered Hg1 as the indicator of gale hazard risk [55]. However, research has shown a significant correlation between crop disasters and instantaneous wind speed [56,57]. Sudden increases in instantaneous wind speed can lead to serious damage such as lodging, breaking, and fruit damage in crops, making Hg2 an important hazard risk indicator. The Hg3 indicator can characterize the cumulative impact of wind on cotton, aiding in the planning of shelterbelt construction. Therefore, this study also includes Hg2 and Hg3 indicators as indicators of gale disaster risk.
Research in the Xinjiang region has shown that the risk distribution of rainstorm disasters exhibits significant regional differences, particularly between northern and southern Xinjiang. Our rainstorm hazard mapping aligns with the findings of Wang [58]. Numerous studies have highlighted the distinct spatiotemporal pattern of rainfall distribution in Xinjiang, with rainfall in northern Xinjiang significantly exceeding rainfall in the south [59]. This rainfall disparity extends beyond totals to include variations in rainstorm frequency, intensity, and peak precipitation levels [60]. Researchers conducting a detailed analysis of the summer rainstorm characteristics in Xinjiang found that the number of rainstorm days in northern Xinjiang generally exceeded those in the south, and in mountainous areas, the number of rainstorm days was also significantly higher than that in the plains [61]. The Ili Kazakh Autonomous Prefecture, particularly prone to rainstorms, faces the highest risk in its Tianshan Mountain areas. According to research [62,63,64], terrain is a significant factor in triggering rainstorms, with frequent occurrences in mountainous areas and windward slopes in front of the mountains in Xinjiang. This phenomenon highlights the impact of terrain on precipitation distribution, particularly in mountainous areas with complex terrain, where the lifting effect of the terrain can increase upward air movement, thereby triggering more precipitation events. The study also pointed out that areas at a very high risk of gales are located in the eastern parts of Xinjiang, Turpan City, and Hami City, which is consistent with previous research findings [65,66]. The spatial pattern of gale risk aligns with both ground station wind speed observations and ERA5 remote sensing data. Terrain significantly affects hail frequency, typically occurring in low-lying plains and river valleys with funnel-shaped topography. This topographic feature results in a higher risk of hail on the southern slopes of the Tianshan Mountains [67].
Additionally, research by Huang Yan et al. indicated that the Kashgar and Aksu regions suffer from severe hail disasters [68,69]. The study by Lin Wang [70] clarified that the area in Xinjiang where cotton is most affected by hail is the Aksu region. It emphasized that Xinjiang is China’s largest cotton-producing region, and the impact of hail on cotton should be highlighted. The results of this study also reiterate the urgency of risk management in the case of major meteorological disasters involving cotton in the Aksu region. In addition, a survey by Jiang [71] evaluated the comprehensive risk of urban natural disasters in Kashgar, noting that the main meteorological disasters included rainstorms, floods, gales, and hail. This is consistent with the leading meteorological hazard indicators selected for this study and highlights the potential threat of natural disasters in the region. However, the results of this study are different from those of Meihua Wu [72], who identified Turpan City, Aksu region, Hami region, and Bozhou region in Xinjiang as the areas with the highest comprehensive risk of agro-meteorological disasters, while the results of the study indicate that Hami region and Turpan city are in the lower risk areas. This difference is primarily because the study focused on a specific crop, cotton, rather than on all crops. This difference highlights the importance of studying different crops and regions and their associated disaster risks in order to devise appropriate risk management strategies. Although these studies have filled the research gap in meteorological disaster risk assessment in Xinjiang, further discussion on the meteorological disaster risk of specific crop disaster-bearing bodies in Xinjiang is needed in future studies. For example, the analyses of Lin Wang [70] and Kalibier [42] conducted risk assessments for cotton with specific disaster-bearing bodies; however, these studies only focused on a single meteorological catastrophe.
In summary, these studies provide essential data and insights for a better understanding of the risk of meteorological disasters in Xinjiang and provide a valuable reference for future research and policy development. However, the assessment of meteorological disaster risk in Xinjiang can be further explored in future studies, particularly in the area of meteorological disaster risk assessment for specific agriculture and crops, which still need to be studied in depth.
Regarding the selection of meteorological disasters, this study considered the impacts of heavy rain, strong winds, and hail but did not encompass all possible meteorological disasters that could affect cotton production, such as cold damage from low temperatures. The limited selection of meteorological disaster types may have led to an incomplete assessment of the risk of cotton meteorological disasters, thereby affecting the accuracy and practicality of the assessment results. Future assessments of cotton meteorological disaster risks should include a wider range of meteorological disasters to construct a more comprehensive model. By comprehensively analyzing the impacts of various meteorological disasters on cotton production, it is possible to assess the risks to cotton production more accurately, thereby providing a scientific basis for cotton cultivation management and disaster prevention.

6. Conclusions

We developed a comprehensive risk assessment model for meteorological disasters affecting cotton cultivation in Xinjiang, focusing on rainstorms, gales, and hail. The study highlights the importance of assessing risks for specific disaster-bearing bodies and stresses the necessity of considering the combined impacts of various meteorological hazards on cotton crops. We discovered that 42% of the cotton planting areas face very high to high risks, with higher risks observed in northern Xinjiang compared to the southern region, predominantly concentrated in Changjizhou, Karamay, Tacheng, and Ilizhou. These findings underscore the critical need for precise disaster prevention and mitigation strategies tailored to the unique risks of different regions. By informing differentiated policy-making and strengthening disaster warning systems in high-risk areas, this research significantly contributes to the sustainable development of the cotton industry. This will safeguard the sustainable development and stability of Xinjiang’s cotton industry. Future research should further consider the limitations of the current study and expand the scope of meteorological disaster risk assessment for cotton cultivation to include a wider range of meteorological hazards. Additionally, employing multiple methodologies for comparison can facilitate the construction of a more comprehensive meteorological disaster risk assessment model.

Author Contributions

Conceptualization, P.Z. and Z.C.; Methodology, P.Z.; Formal analysis, P.Z. and Z.C.; Data curation, G.D.; Writing—original draft, P.Z.; Writing—review & editing, P.Z., Z.C., J.F. (Jiaqi Fang), J.F. (Jinglong Fan) and S.L.; Supervision, G.D.; Project administration, J.F. (Jinglong Fan) and S.L.; Funding acquisition, J.F. (Jinglong Fan) and S.L. All authors have read and agreed to the published version of the manuscript.

Funding

This study was supported by the Third Xinjiang Scientific Expedition Program (Grant No.2021xjkk0305).

Institutional Review Board Statement

Not applicable.

Informed Consent Statement

Not applicable.

Data Availability Statement

The authors confirm that the data supporting the study’s findings are accessible within the articles. The corresponding author will provide the raw data supporting the study’s findings upon a reasonable request.

Conflicts of Interest

The authors declare that they have no conflicts of interest. We have read and understood your journal’s policies and believe that neither the manuscript nor the study violates any of them.

References

  1. National of Bureau of Statistics of China. China Statistical Yearbook; National of Bureau of Statistics of China: Beijing, China, 2022; pp. 4–5.
  2. Yao, J.; Zhao, Y.; Chen, Y.; Yu, X.; Zhang, R. Multi-scale assessments of droughts: A case study in Xinjiang, China. Sci. Total Environ. 2018, 630, 444–452. [Google Scholar] [CrossRef] [PubMed]
  3. Editorial Department of this Journal. Build a strong security line and build a better home. Disaster Reduct. China 2022, 09, 30–33. [Google Scholar]
  4. Chen, B.; Chen, K.; Wang, X.; Wang, X. Spatial and Temporal Distribution Characteristics of Rainstorm and Flood Disasters around Tarim Basin. Pol. J. Environ. Stud. 2022, 31, 2029–2037. [Google Scholar] [CrossRef] [PubMed]
  5. Chen, Y.; Ma, Y. Spatial and temporal characteristics of flood and rainstorm disaster in Xinjiang. Arid Land Geogr. 2021, 44, 1515–1524. [Google Scholar]
  6. Wang, X.; Wang, X. Spatial distribution and temporal variation characteristics of rainstorm flood disasters with different intensities in southern Xinjiang from 1980 to 2019. J. Glaciol. Geocryol. 2021, 43, 1818–1828. [Google Scholar]
  7. Zhang, T.; Wang, H.; Yu, X. Spatial-temporal distribution of wind disasters in Xinjiang. Arid Land Geogr. 2021, 44, 1281–1289. [Google Scholar]
  8. Shi, L.M.; Li, B.; Li, Y.Y.; Kong, L.W.; Liu, W.P. Study on economic loss assessment and risk division of hail disaster in Xinjiang. J. Glaciol. Geocryol. 2017, 39, 299–307. [Google Scholar]
  9. Roxburgh, N.; Guan, D.; Shin, K.J.; Rand, W.; Managi, S.; Lovelace, R.; Meng, J. Characterising climate change discourse on social media during extreme weather events. Glob. Environ. Chang.-Hum. Policy Dimens. 2019, 54, 50–60. [Google Scholar] [CrossRef]
  10. Liu, K.; Harrison, M.T.; Yan, H.; Liu, D.L.; Meinke, H.; Hoogenboom, G.; Wang, B.; Peng, B.; Guan, K.; Jaegermeyr, J.; et al. Silver lining to a climate crisis in multiple prospects for alleviating crop waterlogging under future climates. Nat. Commun. 2023, 14, 765. [Google Scholar] [CrossRef]
  11. Impacts, Adaptation and Vulnerability, IPCC AR6 Working Group II report. Weather 2022, 77, 115.
  12. Zhang, Y.; Qu, H.; Yang, X.; Wang, M.; Qin, N.; Zou, Y. Cropping system optimization for drought prevention and disaster reduction with a risk assessment model in Sichuan Province. Glob. Ecol. Conserv. 2020, 23, e01095. [Google Scholar] [CrossRef]
  13. Xu, X.; Tang, Q. Spatiotemporal variations in damages to cropland from agrometeorological disasters in mainland China during 1978–2018. Sci. Total Environ. 2021, 785, 147247. [Google Scholar] [CrossRef] [PubMed]
  14. Zinat, M.R.M.; Salam, R.; Badhan, M.A.; Islam, A.R.M.T. Appraising drought hazard during Boro rice growing period in western Bangladesh. Int. J. Biometeorol. 2020, 64, 1687–1697. [Google Scholar] [CrossRef] [PubMed]
  15. Wang, Y.; Lv, J.; Sun, H.; Zuo, H.; Gao, H.; Qu, Y.; Su, Z.; Yang, X.; Yin, J. Dynamic agricultural drought risk assessment for maize using weather generator and APSIM crop models. Nat. Hazards 2022, 114, 3083–3100. [Google Scholar] [CrossRef]
  16. Xiang, K.; Wang, B.; Liu, D.L.; Chen, C.; Waters, C.; Huete, A.; Yu, Q. Probabilistic assessment of drought impacts on wheat yield in south-eastern Australia. Agric. Water Manag. 2023, 284, 108359. [Google Scholar] [CrossRef]
  17. Li, S.; Wang, B.; Feng, P.; Liu, D.L.; Li, L.; Shi, L.; Yu, Q. Assessing climate vulnerability of historical wheat yield in south-eastern Australia’s wheat belt. Agric. Syst. 2022, 196, 103340. [Google Scholar] [CrossRef]
  18. Wei, Y.; Jin, J.; Cui, Y.; Ning, S.; Fei, Z.; Wu, C.; Zhou, Y.; Zhang, L.; Liu, L.; Tong, F. Quantitative assessment of soybean drought risk in Bengbu city based on disaster loss risk curve and DSSAT. Int. J. Disaster Risk Reduct. 2021, 56, 102126. [Google Scholar] [CrossRef]
  19. Ma, Y.; Guga, S.; Xu, J.; Zhang, J.; Tong, Z.; Liu, X. Comprehensive Risk Assessment of High Temperature Disaster to Kiwifruit in Shaanxi Province, China. Int. J. Environ. Res. Public Health 2021, 18, 10437. [Google Scholar] [CrossRef]
  20. Chen, Y.; Han, X.; Si, W.; Wu, Z.; Chien, H.; Okamoto, K. An assessment of climate change impacts on maize yields in Hebei Province of China. Sci. Total Environ. 2017, 581, 507–517. [Google Scholar] [CrossRef]
  21. Sharma, T.; Vittal, H.; Karmakar, S.; Ghosh, S. Increasing agricultural risk to hydro-climatic extremes in India. Environ. Res. Lett. 2020, 15, 034010. [Google Scholar] [CrossRef]
  22. Pathak, H.; Wassmann, R. Quantitative evaluation of climatic variability and risks for wheat yield in India. Clim. Chang. 2009, 93, 157–175. [Google Scholar] [CrossRef]
  23. Wu, H.; Wilhite, D.A. An operational agricultural drought risk assessment model for Nebraska, USA. Nat. Hazards 2004, 33, 1–21. [Google Scholar] [CrossRef]
  24. Prabnakorn, S.; Maskey, S.; Suryadi, F.X.; de Fraiture, C. Assessment of drought hazard, exposure, vulnerability, and risk for rice cultivation in the Mun River Basin in Thailand. Nat. Hazards 2019, 97, 891–911. [Google Scholar] [CrossRef]
  25. Alonzo, C.A.; Galabay, J.M.; Macatangay, M.N.; Magpayo, M.B.; Ramirez, R. Drought Risk Assessment and Monitoring of Ilocos Norte Province in the Philippines Using Satellite Remote Sensing and Meteorological Data. Agriengineering 2023, 5, 720–739. [Google Scholar] [CrossRef]
  26. Song, W.; Cao, S.; Du, M.; Mo, Y.; Li, S. Investigation of compound drought risk and driving factors in Nepal. Nat. Hazards 2022, 114, 1365–1391. [Google Scholar] [CrossRef]
  27. Guo, H.; Wang, R.; Garfin, G.M.; Zhang, A.; Lin, D.; Liang, Q.; Wang, J. Rice drought risk assessment under climate change: Based on physical vulnerability a quantitative assessment method. Sci. Total Environ. 2021, 751, 141481. [Google Scholar] [CrossRef] [PubMed]
  28. Zhao, M.; Shi, X.; Sun, X.; Jin, K.; Duan, Z.; Gao, C. Risk assessment for comprehensive meteorological disaster of winter wheat based on multisource gridded data: A case study in the upper Huaihe River basin, China. Int. J. Climatol. 2022, 42, 9595–9611. [Google Scholar] [CrossRef]
  29. Fang, F.; Wang, J.; Lin, J.; Xu, Y.; Lu, G.; Wang, X.; Huang, P.; Huang, Y.; Yin, F. Risk Assessment of Maize Yield Losses in Gansu Province Based on Spatial Econometric Analysis. Agriculture 2023, 13, 1280. [Google Scholar] [CrossRef]
  30. Yuan, X.-C.; Wang, Q.; Wang, K.; Wang, B.; Jin, J.-L.; Wei, Y.-M. China’s regional vulnerability to drought and its mitigation strategies under climate change: Data envelopment analysis and analytic hierarchy process integrated approach. Mitig. Adapt. Strateg. Glob. Chang. 2015, 20, 341–359. [Google Scholar] [CrossRef]
  31. Pant, S.; Kumar, A.; Ram, M.; Klochkov, Y.; Sharma, H.K. Consistency Indices in Analytic Hierarchy Process: A Review. Mathematics 2022, 10, 1206. [Google Scholar] [CrossRef]
  32. Sahoo, M.; Sahoo, S.; Dhar, A.; Pradhan, B. Effectiveness evaluation of objective and subjective weighting methods for aquifer vulnerability assessment in urban context. J. Hydrol. 2016, 541, 1303–1315. [Google Scholar] [CrossRef]
  33. Wu, J.; Lin, X.; Wang, M.; Peng, J.; Tu, Y. Assessing Agricultural Drought Vulnerability by a VSD Model: A Case Study in Yunnan Province, China. Sustainability 2017, 9, 918. [Google Scholar] [CrossRef]
  34. Rahmati, O.; Zeinivand, H.; Besharat, M. Flood hazard zoning in Yasooj region, Iran, using GIS and multi-criteria decision analysis. Geomat. Nat. Hazards Risk 2016, 7, 1000–1017. [Google Scholar] [CrossRef]
  35. Yang, Z.; Gao, X.; Lei, J. Fuzzy comprehensive risk evaluation of aeolian disasters in Xinjiang, Northwest China. Aeolian Res. 2021, 48, 100647. [Google Scholar] [CrossRef]
  36. Pei, H.J.; Chen, J.; Li, W.; Sun, Y.P.; Chen, W.K. Spatiotemporal pattern and risk assessment of storm flood in Gansu Province. J. Nat. Disasters 2017, 26, 167–175. [Google Scholar] [CrossRef]
  37. Wang, Z.; Xia, N.; Zhao, X.; Ji, X.; Wang, J. Comprehensive risk assessment of typhoon disasters in China’s coastal areas based on multi-source geographic big data. Sci. Total Environ. 2024, 926, 171815. [Google Scholar] [CrossRef] [PubMed]
  38. Zhang, S.; Pu, Z.; Li, J. The spatial-temporal variation of sunshine duration in Xinjiang during 1961–2010. Acta Geogr. Sin. 2013, 68, 1481–1492. [Google Scholar] [CrossRef]
  39. Yang, J.; Huang, X. The 30 m annual land cover dataset and its dynamics in China from 1990 to 2019. Earth Syst. Sci. Data 2021, 13, 3907–3925. [Google Scholar] [CrossRef]
  40. Brooks, H.E.; Stensrud, D.J. Climatology of heavy rain events in the United States from hourly precipitation observations. Mon. Weather Rev. 2000, 128, 1194–1201. [Google Scholar] [CrossRef]
  41. Hou, Q.; Yang, L.; Zhang, X.; Xie, S.; Feng, W.; Zou, Y.; Zhang, Y. GIS-Based Risk Evaluation of Meteorological Disasters for Rice—A Case Study of Wangcang County, Guangyuan Sichuan. J. Southwest Univ. Nat. Sci. Ed. 2021, 43, 35–45. [Google Scholar] [CrossRef]
  42. Memeti, K. Risk Assessment of Cotton Drought Disaster in Northern Xinjiang; Xinjiang Agricultural University: Urumqi, China, 2022. [Google Scholar]
  43. Saaty, T.L. A scaling method for priorities in hierarchical structures. J. Math. Psychol. 1977, 15, 234–281. [Google Scholar] [CrossRef]
  44. Zhang, X.; Liang, C. Application of fuzzy matter-element model based on coefficients of entropy in comprehensive evaluation of water quality. J. Hydraul. Eng. 2005, 36, 1057–1061. [Google Scholar]
  45. Song, D.; Liu, C.; Shen, C.; Shi, X.; Zang, L.; Feng, W. Multiple objective and attribute decision making based on the subjective and objective weighting. J. Shandong Univ. Eng. Sci. 2015, 45, 1–9. [Google Scholar] [CrossRef]
  46. Cheng, C.; Fang, X.; Li, M.; Yang, Y.; Gao, Y.; Zhang, S.; Yu, Y.; Liu, Y.; Du, W. Rainstorm and high-temperature disaster risk assessment of territorial space in Beijing, China. Meteorol. Appl. 2023, 30, e2140. [Google Scholar] [CrossRef]
  47. Qing, Q.; Xu, J.; Zhou, B.; Xu, Y.; Deng, G.; Zhong, Y.; Zhang, Y. Refined risk zoning of storm and flood disasters for single cropping rice of Sichuan. J. Northwest A F Univ. Nat. Sci. Ed. 2021, 49, 31–41. [Google Scholar]
  48. Pei, Z. Study on Drought Disaster Monitoring and Risk Assessment of Spring Maize in Songnen Plain of Northeast China. Ph.D. Thesis, Chengdu University of Technology, Chengdu, China, 2022. [Google Scholar]
  49. Wang, C.; Ren, X.; Li, Y. Analysis of extreme precipitation characteristics in low mountain areas based on three-dimensional copulas-taking Kuandian County as an example. Theor. Appl. Climatol. 2017, 128, 169–179. [Google Scholar] [CrossRef]
  50. Wang, C.; Wu, J.; Wang, X.; He, X. Application of the hidden Markov model in a dynamic risk assessment of rainstorms in Dalian, China. Stoch. Environ. Res. Risk Assess. 2018, 32, 2045–2056. [Google Scholar] [CrossRef]
  51. Wu, J.; Chen, X.; Lu, J. Assessment of long and short-term flood risk using the multi-criteria analysis model with the AHP-Entropy method in Poyang Lake basin. Int. J. Disaster Risk Reduct. 2022, 75, 102968. [Google Scholar] [CrossRef]
  52. Chen, J.; Liu, L.; Pei, J.; Deng, M. An ensemble risk assessment model for urban rainstorm disasters based on random forest and deep belief nets: A case study of Nanjing, China. Nat. Hazards 2021, 107, 2671–2692. [Google Scholar] [CrossRef]
  53. Xu, Y.; Chen, L.; Liu, Y.; Li, S.; Zhou, X.; Na, R. Comparative Analysis of Natural Disaster Risk Assessment Based on Different Spatial Resolution DataTaking Rainstorm and Flood Disaster as an Example. J. Catast. 2022, 37, 61–68. [Google Scholar]
  54. Deng, M.; Li, Z.; Tao, F. Rainstorm Disaster Risk Assessment and Influence Factors Analysis in the Yangtze River Delta, China. Int. J. Environ. Res. Public Health 2022, 19, 9497. [Google Scholar] [CrossRef] [PubMed]
  55. Chen, N. Study on Meteorological Disaster Risk Assessment and Climatic Zoning in Heze City. J. Shandong Agric. Univ. Nat. Sci. 2018, 49, 257–261. [Google Scholar]
  56. Dai, X.; Chen, S.; Jia, K.; Jiang, H.; Sun, Y.; Li, D.; Zheng, Q.; Huang, J. A Decision-Tree Approach to Identifying Paddy Rice Lodging with Multiple Pieces of Polarization Information Derived from Sentinel-1. Remote Sens. 2023, 15, 240. [Google Scholar] [CrossRef]
  57. Niu, L.; Feng, S.; Ding, W.; Li, G. Influence of Speed and Rainfall on Large-Scale Wheat Lodging from 2007 to 2014 in China. PLoS ONE 2017, 11, e0157677. [Google Scholar] [CrossRef] [PubMed]
  58. Wang, H.; Mao, W.Y.; Li, Y.P.; Yu, X.J.; Bai, S.Q. Risk Zoning of Torrential Rain Which Easily Causes Damage in Xinjiang Region. J. Glaciol. Geocryol. 2011, 33, 1407–1413. [Google Scholar] [CrossRef]
  59. Lv, X.; Zhou, Y.; Yu, X.; Yu, B.; Wang, X. Temporal and spatial variation characteristics of rainstorm torrential flood disaster loss in Xinjiang during 1961–2019. Desert Oasis Meteorol. 2021, 15, 42–49. [Google Scholar]
  60. Tian, Y.; Yan, Z.; Li, Z. Spatial and Temporal Variations of Extreme Precipitation in Central Asia during 1982–2020. Atmosphere 2022, 13, 60. [Google Scholar] [CrossRef]
  61. Yang, X.; Zhou, H.; Zhao, Y.; Tang, Z.; Zhao, K. Analysis on Fine-Scale Characteristics of Summer Rainstorm in Xinjiang. Meteorol. Mon. 2021, 47, 1501–1511. [Google Scholar] [CrossRef]
  62. Yang, Y.; Shen, L.; Wang, B. How is the precipitation distributed vertically in arid mountain region of Northwest China? J. Geogr. Sci. 2022, 32, 241–258. [Google Scholar] [CrossRef]
  63. Min, Y.; Huang, W.; Ma, M.; Zhang, Y. Simulations in the Topography Effects of Tianshan Mountains on an Extreme Precipitation Event in the Ili River Valley, China. Atmosphere 2021, 12, 750. [Google Scholar] [CrossRef]
  64. Ye, L.; Wu, N.; Zhang, H.; Cai, J.; Wu, Z. Analysis of the influence of sea-land breeze and topography on the extraordinary heavy rain in warm sector under a weak weather background. Torrential Rain Disasters 2019, 38, 597–605. [Google Scholar]
  65. Li, Z.; Xiao, Z.-N.; Zheng, C.-W. Observation analysis of wind climate in China for 1971-2017 under the demand of wind energy evaluation and utilization. Energy Rep. 2021, 7, 3535–3546. [Google Scholar] [CrossRef]
  66. Wu, M.; Chen, Y.; Xu, C. Assessment of meteorological disasters based on information diffusion theory in Xinjiang, Northwest China. J. Geogr. Sci. 2015, 25, 69–84. [Google Scholar] [CrossRef]
  67. Jun, Y.; Leikai, M.; Ren, C. The overview of study on hailstorm in Xinjiang. Desert Oasis Meteorol. 2023, 17, 10–17. [Google Scholar]
  68. Shi, L.; Zhao, Z.; Wang, X. Temporal and spatial distribution features of hail disaster in Xinjiang from 1961 to 2014. J. Glaciol. Geocryol. 2015, 37, 898–904. [Google Scholar]
  69. Huang, Y.; Pei, J. Hail Climate Characteristics and Atmospheric Environment Background in Kashi Region, Xinjiang. Arid Zone Res. 2015, 32, 526–532. [Google Scholar]
  70. Wang, L.; Hu, G.; Yue, Y.; Ye, X.; Li, M.; Zhao, J.; Wan, J. GIS-Based Risk Assessment of Hail Disasters Affecting Cotton and Its Spatiotemporal Evolution in China. Sustainability 2016, 8, 218. [Google Scholar] [CrossRef]
  71. Tayierjiang, T.; Anwaer, M. Study of comprehensive risk evaluation of urban natural disasters in Kashgar Prefecture, Xinjiang. J. Glaciol. Geocryol. 2014, 36, 1321–1327. [Google Scholar]
  72. Wu, M.H.; Wang, H.J.; Sun, G.L.; Xu, C.C. Formation and risk analysis of meteorological disasters in Xinjiang. Arid Land Geogr. 2016, 39, 1212–1220. [Google Scholar]
Figure 1. (a) Three major cotton regions in China; (b) cotton planting area in China and Xinjiang, 1949–2022; (c) cotton production in China and Xinjiang, 1949–2022. The map is based on standard map no. GS(2022)4304 downloaded from the Ministry of Natural Resources standard map service website without modification of base map boundary.
Sustainability 16 04938 g001
Figure 2. Location map of Xinjiang. Red and blue dots represent cotton and non-cotton growing areas, respectively. Note: maps in this article are based on standard map no. XinS(2021)023 downloaded from the Ministry of Natural Resources standard map service website without modification of base map boundary.
Sustainability 16 04938 g002
Figure 3. Technology roadmap.
Sustainability 16 04938 g003
Figure 4. Hazard maps of the disaster-causing factors in Xinjiang.
Sustainability 16 04938 g004
Figure 5. Exposure map of disaster-bearing bodies in Xinjiang.
Sustainability 16 04938 g005
Figure 6. Map of the vulnerability of disaster-bearing bodies in Xinjiang.
Sustainability 16 04938 g006
Figure 7. Maps of meteorological disaster risk for cotton in Xinjiang.
Sustainability 16 04938 g007
Table 1. Data description.
ParameterTypeTimeSourcesResolution
Rainstorm dataMeteorological data1981–2020GEE: CHIRPS Daily: Climate Hazards Group InfraRed Precipitation with Station Data (Version 2.0 Fina)0.05°
Gale dataMeteorological data1981–2020GEE: ERA5-Land Hourly—ECMWF Climate Reanalysis11,132 m
ERA5 hourly data on single levels from 1940 to present——Instantaneous 10 m wind gust0.25°
Hail dataMeteorological data1981–2020ERA5 hourly data on single levels from 1940 to present——Precipitation type0.25°
Land use/Land cover changeRemote sensing product data2020The 30 m annual land cover dataset and its dynamics in China from 1990 to 201930 m
Sentinel-2Remote sensing product data2020GEE: Sentinel-2 MSI: MultiSpectral Instrument, Level-2A10 m
MOD13Q1Remote sensing product data2020GEE: MOD13Q1.061 Terra Vegetation Indices 16-Day Global 250 m250 m
Cotton yieldSocioeconomic data2001–2020Xinjiang Statistical YearbookCounty-level
Xinjiang Production and Construction Corps Statistical Yearbook
Digital elevation model (DEM)Remote sensing product data2000Resource and Environment Data Cloud Platform90 m
Table 2. Indicator system for evaluating meteorological disaster risks in cotton.
Target LayerFactor LayerSub-Factor LayerIndicator Layer
Comprehensive risk assessment of meteorological disasters of cotton in XinjiangHazard of disaster-causing factors (H)Rainstorm (Hr)Annual number of rainstorm days (Hr1)
Annual rainstorm amount (Hr2)
Annual rainstorm maximum (Hr3)
Gale (Hg)Annual number of gale days (Hg1)
Annual hourly maximum gale wind speed (Hg2)
Annual instantaneous maximum gale wind speed (Hg3)
Hail (Hh)Annual number of hail days (Hh1)
Exposure of disaster-bearing bodies (E) Cotton distribution (cotton planting area)/cropland area (Fa)
Vulnerability of disaster-bearing bodies (V) Yield reduction rate (P)
Table 3. Classification standards for meteorological disaster risk assessment of cotton.
Factor LayerIndicator LayerVery LowLowMediumHighVery High
HHr1(0, 1](1, 2](2, 4](4, 7](7, 12]
Hr2(24.1, 48.38](48.38, 92.89](92.89, 165.73](165.73, 291.17](291.17, 540.02]
Hr3(0.37, 25.41](25.41, 46.88](46.88, 74.30](74.30, 116.03](116.03, 304.43]
Hg1(0, 9](9, 23](23, 42](42, 64](64, 93]
Hg2(1.73, 5.89](5.89, 9.25](9.25, 12.36](12.36, 14.92](14.92, 22.11]
Hg3(11.56, 17.21](17.21, 20.15](20.15, 22.51](22.51, 25.12](25.12, 33.04]
Hh1(0, 9](9, 21](21, 34](34, 48](48, 85]
EFa(0, 0.07](0.07, 0.18](0.18, 0.3](0.3, 0.44](0.44, 0.88]
VP(0, 2.21](2.21, 3.97](3.97, 5.79](5.79, 8.51](8.51, 14.47]
Table 4. Weights of risk evaluation system.
Factor LayerAHPEWMComprehensive WeightSub-Factor LayerAHPEWMComprehensive WeightIndicator LayerAHPEWMComprehensive Weight
H26%34%30%Hr64%54%59%Hr164%53%59%
Hr226%40%33%
Hr310%7%8%
Hg10%15%12%Hg173%77%75%
Hg219%16%18%
Hg38%7%7%
Hh26%31%29%Hh1111
E64%53%58% Fa111
V10%13%12% P111
Table 5. Proportion of disaster risk levels by state.
NameVery LowLowHighVery High
Aksu Administrative Offices0%28%0%0%
Bayangol Mongol Autonomous Prefecture6%68%4%0%
Kashgar Administrative Offices0%33%34%2%
Hotan Administrative Offices100%0%0%0%
Kizilsu Kirgiz Autonomous Prefecture8%18%50%0%
Bortala Mongol Autonomous Prefecture0%0%22%0%
Changji Hui Autonomous Prefecture1%2%78%3%
Hami City100%0%0%0%
Ili Kazak Autonomous Prefecture0%0%61%0%
Karamay City0%0%94%1%
Tachen Administrative Offices1%0%68%19%
Turpan City100%0%0%0%
XinJiang/Total2%19%37%5%
Disclaimer/Publisher’s Note: The statements, opinions and data contained in all publications are solely those of the individual author(s) and contributor(s) and not of MDPI and/or the editor(s). MDPI and/or the editor(s) disclaim responsibility for any injury to people or property resulting from any ideas, methods, instructions or products referred to in the content.

