Abstract
The energy consumption profiles of conventional fuelled and electric vehicles are different due to the fundamental differences in the driving characteristics of these vehicles, which have been actively researched elsewhere but mostly on the basis of uncommon geographical contexts. This study, therefore, collected driving data on electric and conventional diesel buses running along exactly the same set of bus routes in Hong Kong during normal daily revenue operations. This enabled a fair comparison of driving characteristics for both types of bus under identical real-life, on-road driving conditions, which highlighted the originality and contributions of this study. A three-step approach was adopted to carry out detailed driving pattern analyses, which included key driving parameters, speed–acceleration probability distributions (SAPDs), and vehicle-specific power (VSP) distributions. Results found that route-based comparisons did highlight important differences in driving patterns between electric and diesel buses that might have been smoothed out by analyses with mixed-route datasets. In particular, the spread, intensity, and directions of these differences were found to be exaggerated at the route-based level. The differences in driving patterns varied across different routes, which has significant implications on vehicle energy consumption. Government agencies and/or bus operators should make references to these results in formulating electric bus deployment plans.
1. Introduction
Given the automotive industry’s influence on air pollution and CO2 emissions, effort have been made to mitigate these impacts [1]. The automotive sector has consistently worked to reduce fuel consumption and emissions over the years [2,3]. To combat global warming and achieve a reduction in greenhouse gas emissions from the automotive sector, more stringent global standards and regulations are being implemented, with a significant focus on transitioning to electric vehicles [4].
Public transportation plays a pivotal role and poses numerous challenges, with transportation contributing around 45% of greenhouse gas emissions [5]. Public buses make up more than 80% of global public transportation passenger journeys [6]. Diesel-powered buses have been a major source of vehicle emissions [7], impacting the urban quality of life. Consequently, the global shift towards bus electrification is rapidly growing. Electric buses are often superior to internal combustion vehicles in terms of energy consumption and emissions [8,9]. For estimating vehicle emissions and energy consumption, driving cycles have been developed [10]. Numerous studies highlight substantial distinctions between driving cycles for electric vehicles and conventional vehicles, including power characteristics, transmission efficiency, energy recovery braking systems, and more [11]. Nevertheless, there are limited published studies comparing driving cycles designed for electric buses and those for diesel-powered buses. Relying on driving cycles developed for conventional diesel-powered buses to evaluate the performance of electric buses could result in substantial inaccuracies [12].
Over the past few years, driving cycles specific to franchised bus services have been synthesized to discern their driving characteristics concerning bus route structure and traffic conditions in Hong Kong [13]. By the end of 2027, the government aim to introduce approximately 700 electric buses [14]. Given the escalating demand for electric buses, there is an urgent need for an investigation into the driving characteristics of electric buses as compared to conventional diesel-powered buses. In particular, previous trial programmes have highlighted that electric buses are different from conventional diesel buses in terms of vehicle operation and characteristics under the unique driving environment in Hong Kong (e.g., relatively high ambient temperature, congested traffic, and hilly and mountainous driving environment) [10], which reduces the actual driving range to become far lower than what is specified (primarily for other places) as well as the daily milage requirement of general public buses [15]. Therefore, government agencies bus operators and manufacturers have been exploring ways to identify routes with operational conditions that might be more suitable to couple with the characteristics of these electric buses. This study aimed to identify the differences in driving characteristics between electric buses and conventional diesel-powered buses operating along the same route during regular daily bus operations. The findings from this study are expected to offer valuable insights for government authorities and bus operators in devising strategies for the deployment of electric buses in Hong Kong and other comparable regions.
In short, the significance of the current study can be summarised as follows:
- Characterising the operational characteristics of diesel and electric buses under the same driving environment as reflected in the evaluation metrics adopted.
- Identifying how electric buses might differ from conventional diesel buses during normal bus operations along the same set of routes (which is rare in the literature).
- Evaluating the extent and direction of differences between electric and diesel buses derived for route-based datasets versus those derived from mixed-route datasets.
- Providing evidence and insight for government agencies and/or bus operators in terms of the impact of route-specific characteristics on the deployment of electric buses, which would be helpful when it comes to making the decision to deploy electric buses on specific routes.
2. Bus Electrification Status in Hong Kong
The exploration of electric bus technologies in Hong Kong began in 2010. The government set aside HKD 180 million to enable franchised bus companies to acquire 36 single-deck electric buses, comprising 28 battery electric buses and 8 supercapacitor buses. These buses were procured for trial purposes, aimed at evaluating their operational efficiency and performance within the specific local conditions [15].
The results from the trial program indicated that, apart from the average driving range constraint due to the additional load resulting from the high temperatures and hilly terrain in Hong Kong, battery electric buses performed quite similarly to conventional diesel buses. Electric bus technologies showed promise in reducing fuel costs. However, electric buses are different from conventional diesel buses in terms of vehicle operations and characteristics. Subsequent policy studies examined global electric bus experiences and identified the major challenges hindering the adoption of electric buses in Hong Kong, along with offering policy recommendations [16].
In March 2021, Hong Kong unveiled its inaugural Roadmap for the Proliferation of Electric Vehicles, outlining well-defined strategies to work toward the ultimate objective of eliminating vehicular emissions by 2035 or even sooner [17]. Notably, franchised bus companies are actively collaborating with the government to explore the viability of introducing new energy buses in Hong Kong. Kowloon Motor Bus (KMB) and CityBus (CTB), for instance, are slated to conduct trials of double-deck electric buses supported by the New Energy Transport Fund [18]. They intend to introduce additional single-deck and double-deck electric buses along with the necessary charging infrastructure to assess the operational efficiency and technical feasibility of electric buses. CTB will also partner with the government to investigate the potential use of other new-energy buses, including hydrogen fuel cell buses, in Hong Kong. In November 2023, the government set its sights on attaining the objective of introducing around 700 electric buses by the end of 2027 [14].
In alignment with government policy objectives and the uncertainties revealed by the trial programs, further investigations into the performance of various electric bus technologies under Hong Kong’s unique driving conditions are essential before broader deployment. To achieve this, it is crucial to develop driving cycles that accurately represent the real and distinctive bus driving environments in Hong Kong, providing an alternative means to evaluate the performance of electric buses.
3. Literature Review
The environmental advantages of electric buses have prompted cities to transition from diesel to electric. An analysis of scientific production indicated a notable surge in studies within this field, exhibiting an average annual growth rate of 26% [19]. The research is primarily concentrated in China, the United States, and the European Union. From 2010 to 2016, the Chinese electric vehicle industry witnessed an impressive 360% growth in both sales and production [20,21]. Chinese cities are home to roughly 98% of the globally deployed electric buses [22]. In the United States, diverse programs, including financial incentives such as tax credits, exemptions, and subsidies, have been introduced to encourage research and production in the electric bus sector [23,24]. The European Parliament adopted new regulations in 2019 to encourage investment in clean buses [25]. The implementation of electric buses in Hong Kong remains relatively limited in scale.
Upon reviewing the literature on electric bus adoption, a substantial and growing body of literature was found focusing on (i) technical aspects; (ii) battery technology; and (iii) sustainability. Studies have explored operational constraints, including service optimisation and system performance [26,27,28]. Battery technology, encompassing issues related to energy content and storage, has also been investigated [29]. Other studies have delved into environmental and energy consumption models, exploring GHG emission reductions and energy efficiency from electric buses [30,31,32,33,34]. However, these studies primarily concentrate on the review of electric buses without a direct comparison with conventional diesel buses.
Several studies have undertaken comparisons between electric buses and conventional diesel buses. A summary of relevant articles comparing conventional buses and electric buses is provided in Table 1. Similarly, these comparisons predominantly focus on vehicle technology and life cycle reviews. Vehicle performance reviews have been undertaken in Canada, Singapore, and Taiwan [35,36]. The electric bus could emerge as the most viable alternative if the electric bus’s cruising distance reaches an acceptable range. Studies comparing fuel consumption have been conducted in Germany, China, and the USA [37,38,39]. Electric buses are categorised as environmentally friendly and energy-saving transportation systems. They are locally emission-free due to electric drive, exhibit low noise, and are both gentle and powerful during start and stop. Evaluations of the life cycle assessment of electric buses and diesel buses have been explored in Spain, Macau, China, Finland, the USA, and Germany [29,40,41,42,43,44]. These studies examined crucial data regarding obstacles to the integration of electric buses on a global scale. Consequently, valuable information has been derived that can assist in decision-making for more secure planning in the adoption of e-buses. Comparisons of energy performances between electric buses and diesel buses have been studied in Argentina, Chile, and Brazil [45,46]. The findings indicated that among zero-emission vehicles, electric vehicle technology is the most efficient alternative for short ranges. Additionally, research on CO2 emissions has been carried out in Singapore, China, and West Virginia [4,47,48]. The most significant reduction in CO2 emissions enables a potential decrease of approximately 61% in annual emissions. Analysing the life cycle and optimising performance based on actual data play a crucial role in identifying factors for technological innovation and achieving further cost reductions for electric buses.

Table 1.
Summary of relevant articles in comparison between conventional buses and electric buses.
Direct comparisons of driving characteristics between electric buses and conventional diesel buses have been uncommon, especially in the Asian region, as highlighted in studies by Tong and Ng [13,49,50]. A study [51], closely aligned with our research question and methodology, pointed out that existing electric vehicle driving cycle studies lacked comparisons with internal combustion engine vehicle driving cycles in the same geographical locations. These comparisons provide supporting evidence for the electrification of public transportation, contributing to an overarching decrease in transportation emissions by advocating for the electrification of public transportation systems. Hence, this study seeks to bridge this gap by directly comparing electric buses and conventional buses deployed on the same routes during regular daily operations. This approach guarantees a comparison of driving characteristics under identical actual driving conditions.
4. Data Collection
In Hong Kong, there are five franchised bus operators responsible for managing six franchises overseen by the Transport Bureau. The franchised bus network encompasses an extensive network comprising over 600 routes and a fleet of more than 6000 buses [52].
Kowloon Motor Bus (1933) Co., Ltd. (KMB) (Hong Kong), with a rich history as the longest-serving public bus service provider in Hong Kong, primarily operates routes in Kowloon Peninsula (Kln) and New Territories (NT). In contrast, City Bus (CTB) and New World First Bus (NWFB) are more focused on expanding their bus networks on Hong Kong Island (HKI). Additionally, New Lantau Bus (1973) Co., Ltd. (NLB) (Hong Kong), Long Win Bus Company (LWB) (Hong Kong), and the second franchise of CTB handle Tung Chung and airport routes. Tung Chung is a newly developed district situated on Lantau Island. This information underscores the complexity and comprehensiveness of the franchised bus network in Hong Kong. To accurately represent the characteristics of the electric bus network, it is essential to gather data covering various route structures.
As a result of the previous electric bus trial programmes, only a few routes are retained for deployment with electric buses in daily operations [10]. This study conducted site visits to each of these routes to confirm the actual electric bus deployment status and schedules, and eventually identified four routes to carry out data collection. These routes were selected to ensure (i) a good coverage of different districts and typical driving conditions in Hong Kong; and (ii) a balanced mix of electric and diesel buses was deployed to operate the routes. The entire data collection campaign was conducted from January to June 2021 during normal daily bus operations. The bus drivers were not aware of the study, which made sure their driving would be impartial.
A total of 135 bus trip data points were finally collected, covering the four bus routes (7M, 203C, 11, and S65) by three franchised buses (KMB, LWB, and CTB) across different districts in Hong Kong. The maps of these four bus routes are shown in Figure 1. Route 7M and 203C operate in Kln. Route 7M is a circulatory route running between Wong Tai Sin and Chuk Yuen Estate with 10 stops. The total length and estimated travel time of this route are approximately 4.5 km and 20 min, respectively. Route 203C travels the crowded district from Sham Shui Po to Tsum Sha Tsui with 25 stops. The route’s overall length spans around 8.8 km, with an estimated travel time of approximately 45 min. Route 11 and route S65 provide service on HKI and on Island, respectively. Route 11 is a circular route that operates between Central and Jardine. It covers a total of 32 stops and has the lengthiest travel time of 51 min, spanning 15.7 km. The final route, S65, connects Mun Tung and the airport, covering a substantial distance of 17 km with 21 stops and an approximate duration of 45 min (Table 2).
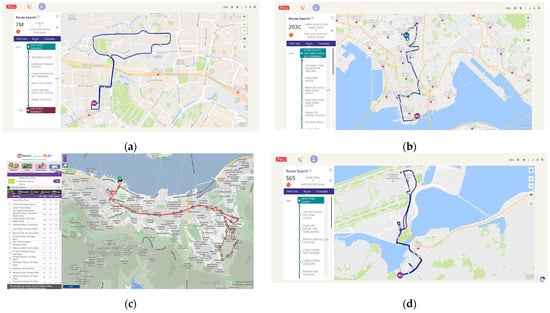
Figure 1.
Maps of bus routes for data collection. (a) Route 7M (a circular route); (b) Route 203C; (c) Route 11 (a circular route); and (d) Route S65 (a circular route).
Table 2.
Information collected on the bus routes.
This study utilised battery electric buses primarily manufactured by BYD Auto Industry Company Limited (BYD), with the model being K9R. In contrast, the diesel bus used in this study was provided by Alexander Dennis. The physical characteristics, such as dimensions, weight, and passenger capacity, are comparable between these two bus types. BYD’s batteries are environmentally friendly, non-toxic, and recyclable. A fully charged bus with a battery capacity of 324 kWh can sustain continuous travel for approximately 250 km. Detailed specifications for these two bus types can be found in Table 3.
Table 3.
Specifications of bus types investigated.
Data were gathered using an iTrail GPS Data Logger supplied by KJB Security, a company based in the United States. As outlined in the literature review, GPS devices have become the preferred method for collecting on-road data worldwide. In recent times, with the growing acceptance of electric vehicles as an alternative to conventional fuel-powered vehicles, GPS data loggers have found increased utility in developing driving patterns for electric vehicles [53,54,55]. This portable and waterproof iTrail GPS Data Logger provides tracking capabilities at no additional cost, capturing latitude, longitude, altitude, location, speed, and time information for each journey at 1 s intervals.
Upon installing the GPS logger on board the bus, the surveyors initiated the recording process as the bus commenced its journey from the starting point of the route. The recording ceased when the bus had completed the trip and arrived at a full stop at the terminal. Throughout the bus journey, the logger meticulously captured the previously mentioned data at the highest sensitivity setting. Concurrently, the surveyors manually noted the precise times for the initiation and conclusion of each trip, a step taken to facilitate cross-verification of actual stopping locations and time intervals. This methodology resulted in the collection of data from 110 journeys of battery electric buses and 25 journeys of conventional diesel buses (Table 4), covering different time periods of a day and days of a week. The resultant dataset consists of nearly 300,000 second-by-second on-road bus driving speed data points during the normal daily bus operations. It is important to note that, given the sizable sample obtained (i.e., a total of 135 bus trips) with a certain level of imbalanced split between electric and diesel buses, it is believed that this dataset will still be able to capture important bus driving characteristics because:
Table 4.
Bus journey data collection statistics.
- The data collection campaign and methodology were consistent with the common practices that have been used in many other studies.
- The amount of data collected (in terms of the number of selected bus routes and the number of trips) was unarguably sizable when compared to many previous studies. In fact, many public transport driving cycle studies were based on data from only one or two routes, or just a few trips [13].
- The distribution of trips for diesel and electric buses collected was due to and thus reflected the actual split and bus deployment status during daily operations of those selected bus routes.
- Normally, only a few distinct drivers would be deployed to run a specific route to ensure that they are familiar with the features of the route. Given the relatively sizable number of trips collected for each route, variations across drivers deployed for a specific route should have been largely captured in the collected dataset.
Therefore, this study collected bus driving data in the same city along the same set of bus routes, which largely eliminated the interference of different driving conditions, and could allow for a fair and direct comparison of driving characteristics between electric and conventional diesel buses under the same driving environment.
5. Data Analysis
To analyse the collected data, a three-step approach was adopted, i.e., driving parameters, speed–acceleration probability distribution (SAPD), and vehicle-specific power (VSP) distributions, to characterise and compare the driving characteristics in this study. Driving parameters have been widely used elsewhere and were derived for the survey data as shown in Table 5.
Table 5.
Definitions of the 13 driving parameters.
A total of 13 parameters were adopted for analysis in this study, including most of the commonly used quantitative driving indicators such as speed- and acceleration-related metrics and vehicle operating mode distributions. This list has been widely used in driving pattern descriptions [10,13,49,50]. In particular, the “Creep” mode is considered in the vehicle operating mode distribution analysis. This has been relatively uncommon, but is definitely useful for this study. The “Creep” mode is normally used to describe short acceleration and deceleration driving behaviours, which mostly occur in slow stop-and-go situations such as at urban junctions, under traffic congestions, or bus dwell activities. It helps to appropriately portray vehicle queuing behaviours, which is particularly useful in reflecting urban driving conditions.
In addition to these parameters, SAPDs were also used to illustrate the greater details of a bus trip’s speed and acceleration characteristics. They are obtained by first dividing the speed and acceleration ranges into equal portions (called resolutions), and the data occurrence frequency and then probability for each combination of speed and acceleration are then computed. The resultant SAPD (also called the speed–acceleration map) can be shown in matrix form with each cell showing as a percentage frequency of occurrence. SAPD is useful for comparing driving characteristics between two trip-based speed datasets by finding the differences between the SAPDs derived from them. The smaller the differences across different cells, the more commonalities the two datasets share. This comparison has been widely employed elsewhere for vehicle dynamic analysis as well as driving cycle development activities [10,13,49,50].
To further enhance the analysis of vehicle operating characteristics, VSP distributions between datasets were also derived and compared. The formula for calculating VSP for buses (a type of heavy-duty vehicle) is as follows [56,57], where v is the speed (in m/s) and a is the acceleration (m/s2).
VSP = v (1.1 × a + 0.132) + 0.0000745 v3
VSP is a very important variable for estimating vehicle emissions and energy consumption, as well as for evaluating eco-driving behaviours [58]. The VSP distribution is defined as the proportion of time spent in each VSP bin for a specific traffic condition. The USEPA defined 23 vehicle operating modes for energy consumption estimations based on different VSP ranges. Many studies have confirmed the close relationship of instantaneous vehicle emissions and energy (or fuel) consumption with VSP distributions [56,57,59]. Therefore, analysing bus driving VSP distributions would be of great interest to enhance understandings on the implication for bus tailpipe emissions and energy consumption characteristics.
Based on this three-step approach, the speed–time profiles of bus journeys were analysed first as a whole to characterise the overall battery electric bus driving characteristics as compared to those derived from conventional diesel buses. Then, the analyses looked at different groupings of bus journey data, such as route-based comparison, which is the primary objective of this study. This was able to provide solid evidence based upon a direct comparison of driving characteristics between battery electric buses and conventional diesel buses over the same geographical setup. Results from these analyses help to better highlight the key areas of differences between the electric and diesel buses, and possibly profile them.
6. Results and Findings
This section presents the results from analysis, including the findings on the set of driving parameters, SAPDs, and VSP distributions.
6.1. Overall Driving Patterns
This section starts by looking at the results, in terms of driving characteristics, derived for the entire set of 135 bus trips as well as separately for all diesel only (35 trips) and electric only (110 trips) bus journeys. The mean values of the 13 driving parameters for these three groupings of datasets are presented in Table 6. Mean values for different days of a week (i.e., weekdays versus weekends) and time periods (peaks vs. off-peaks) were also generated. Traffic conditions and bus operating patterns are the two observable factors affecting the variations.
Table 6.
Driving pattern characterisation and comparison (overall).
Generally, weekends exhibited smoother traffic conditions than weekdays, resulting in a shorter time spend idling (Pidle) and longer time spent cruising (Pcruise), longer micro-trips (the c value) and thus faster driving (higher v1 and v2) and less aggressive acceleration behaviours (smaller RMS, PKE, a, and d values). The time spent in acceleration and deceleration modes was similar between weekends and weekdays. Unexpectedly, the values of Pcreep are insignificant, which indicate that creeping movements were not common along these selected bus routes. Comparing peaks and off-peaks, intuitively, driving during peak periods should be slower, with more idling and less cruising, and should experience more stop-and-go conditions due to traffic congestions. The reason for the generally opposite results observed in this study is most likely because of the bus operating characteristics. During off-peak periods, buses usually have spare capacities to carry passengers, and thus have to stop for every (or most of the) bus stop(s). However, during peak periods, buses may get fully loaded with passengers quickly and thus do not need to stop for passengers throughout the rest of the journey. The significantly longer micro-trip, as reflected in the value of the parameter c, was very strong evidence supporting this argument. This agreed well with the shorter time spent in idling mode but longer time spent cruising, as well as the relatively higher v1 and v2 values.
6.2. Differences in Overall Driving Characteristics between Electric and Diesel Buses
To analyse the differences in the overall driving patterns between the diesel and electric bus journeys, the mean values of the 13 driving parameters derived for diesel bus trips only (as well as for weekday, weekend, peak, and off-peak trips) were directly compared with their counterparts for electric bus trips only results. In short, the analysis procedure is described as follows:
- Calculate the percentage differences for each parameter (as shown in Table 6d). A positive percentage means the electric bus has a higher value than the diesel bus counterpart.
- Classify the percentage differences, according to its direction and magnitude, into three categories: above +5%, within ±5%, and below −5%.
- Highlight the percentage differences in (i) Red (if above +5%); (ii) Yellow (if within ±5%); or (iii) Green (if below −5%).
- Plot the percentage differences as a radar map (Figure 2) for visual interpretation.
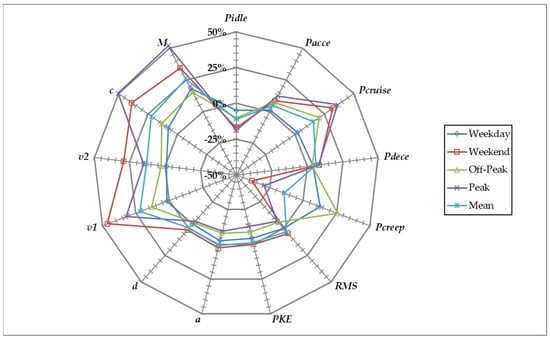 Figure 2. Radar map illustrating percentage differences between electric and diesel Buses.
 - Compute SAPDs for the electric and diesel bus datasets separately and then directly compare more detailed speed and acceleration characteristics (Figure 3).
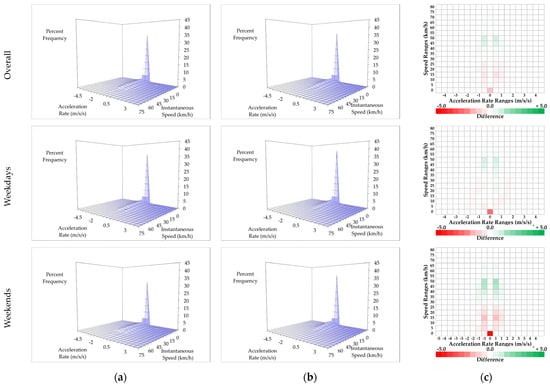 Figure 3. SAPDs for electric and diesel bus. (a) SAPD (electric); (b) SAPD (diesel); and (c) heat map of the differences.
 - Derive and compare the VSP distributions for the electric and diesel bus datasets (Figure 4).
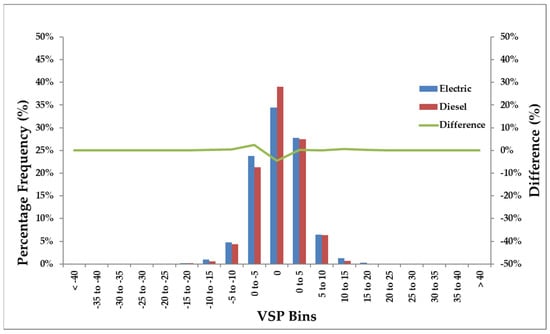 Figure 4. VSP distributions for electric and diesel buses (all data).
6.2.1. Driving Parameters
This analysis was based on characteristics observed from Table 6c,d, and Figure 2. The purpose was to highlight the key differences in the overall traffic characteristics as reflected in the driving parameters. Driving patterns were interpreted with due considerations to not only the behaviour of individual parameter but also the collective effects across multiple inter-related parameters as well.
First, electric bus trips along the selected routes spent much shorter time in idling (a reduction of 5% to 19%) but more time in other modes. Creeping has been kept at a very low proportion. Secondly, electric buses operated significantly faster (up to 46.4%) than diesel buses along these routes, with much longer micro-trips (up to 50%). Thirdly, acceleration-related parameters were generally similar for both types of bus along the selected routes. However, when looking at peaks and off-peaks separately, electric buses appeared to have smaller values, reflecting relatively less aggressive and smoother driving behaviours even though the number of acceleration/deceleration changes (i.e., M) was higher. These observations were generally consistent across all the five scenarios studied (i.e., weekends, weekdays, peaks, and off-peaks, and mean). Relatively more significant differences could be observed for the weekend and the peak period bus operations.
6.2.2. Speed–Acceleration Probability Distributions (SAPDs)
The SAPD illustrates the speed and acceleration distributions of the bus journeys which complement the driving parameters discussed earlier. It is a probability distribution of the bus driving data obtained for each unique combination of speed and acceleration classes. Separate SAPDs were developed for the entire electric bus only and diesel bus only datasets (Figure 3a and Figure 3b, respectively), as well as for the further subdivided weekday only and weekend only datasets. The SAPDs were obtained using a resolution of 5 km/h and 0.5 m/s2 with speed that ranged from 0 to 80 km/h, whilst acceleration ranged from −3 m/s2 to 3 m/s2. Eventually, each cell in the SAPD (representing each combination of speed and acceleration ranges) carried a probability value (between 0 and 1, or 0% and 100%) reflecting its likelihood of occurrence throughout the entire bus trip. It provides additional driving pattern details focusing on the bus trips’ speed and acceleration behaviours, such as the spread of speed and acceleration ranges, and the areas where there may be higher intensities, etc.
To evaluate how the SAPDs developed for the two types of bus differ from each other, two measures were introduced. First, the differences between corresponding cells in the electric and diesel bus SAPDs were computed and then expressed in the form of a heat map showing the direction and intensity of differences at each cell (Figure 3c). It was found that these differences ranged roughly within ±5% (i.e., a difference in a cell probability of ±0.05), with slight variations across different groups of comparisons made. For consistency reasons, a common scale was employed (using the identified ±5% as the basis) for all the SAPD comparisons. As illustrated in the legend below each heat map, “Red” represents the electric bus SAPD value being smaller than the corresponding diesel bus counterpart, and vice versa for “Green”. The darker the colour is, the bigger the magnitude of the difference is. “White” means no or just a very small difference was observed. These heat maps are very useful tools to visually present the areas where the two SAPDs have relatively bigger contrasts. In addition to this visual evaluation, the sum square differences (SSD) between the two SAPDs was also calculated. The SSD represents the overall similarity (or dissimilarity) between two matrices. Smaller SSD values imply that the two SAPDs are more similar to each other and vice versa.
The basic pattern identified for the SAPDs is fairly consistent across all three cases analysed in this section. First, the presence of an idle peak is very clear. A significantly large proportion of the time is in the speed range of 0 to 5 km/h (around 35% to 40% of the entire bus trip). The speed essentially ranges from 0 to around 50 km/h, which is reasonable for bus operations, whilst acceleration mainly fluctuates within ±2 m/s2. When looking at the SSDs, weekends exhibit the biggest difference (SSD = 42.0) between the SAPDs developed for the two types of bus as compared to the weekdays counterpart (SSD = 11.2). The SSD obtained for the entire dataset is the smallest (SSD = 5.2), which may represent a potential smoothing effect of combining weekdays and weekends data as a whole. Taking a closer look at the heat maps, it can be consistently observed that the largest difference is due to the idle peak, and the differences for other cells were generally within 1% (as reflected in the intensity of the colours), spreading mainly across a narrow acceleration range between −0.5 m/s2 and +0.5 m/s2. Electric buses generally involve slightly more high-speed driving at around 40–55 km/h (i.e., the Green areas on the heat maps) and thus less low-speed driving (i.e., the Red areas on the heat maps), as well as a clearly smaller idle peak. The pattern is even more obvious in the case of the weekend.
6.2.3. VSP Distributions
VSP provides an estimate of the power mass unit considering vehicle dynamic conditions such as speed, acceleration, and road grades. It is commonly used for conventional vehicle emission and energy consumption estimation according to a set of well-defined VSP modes. For electric vehicles’ energy consumption estimation, the VSP modes have been further modified to improve the estimation accuracy [60]. For the case of battery electric vehicles, there is a strong positive correlation between energy consumption and VSP [60]. Higher energy consumption is expected for higher VSP modes. Using distributions to describe power data is crucial for electric buses’ energy consumption estimation [61]. Therefore, the purpose of this analysis was to get a better understanding about electric buses’ power distribution and how it compared with that of the diesel buses.
The VSP derived for the electric and diesel buses are shown in Figure 4. The green line in the middle shows the differences in bin frequencies between the VSPs developed for the two types of bus. A negative difference here means the electric bus has a lower frequency. Figure 4 indicates that the VSP for both types of bus varied mainly within ±10 kW/ton. The buses run more in the positive than negative VSP intervals for both types of bus, indicating that the buses have more running time within low acceleration ranges but less running time under deceleration conditions. The observed pattern echoes the findings from Section 6.2.2, where there is a peak at the zero VSP bin. This pattern is also consistent across both types of bus, except that the electric buses appear to have a lower peak at the zero VSP bin and a slightly flatter distribution than that of the diesel buses.
6.3. Route-Based Comparison
This section looks at route-based assessment of bus driving patterns. It starts by investigating the overall driving patterns for each selected route, disregarding the effect of bus types. This will be achieved by visually examining the idle vs. average speed plot, as shown in Figure 5. Each data point in Figure 5 represents one trip classified according to one of the four selected routes. The purpose of this analysis is to get a better understanding about any route-specific features in profiling bus driving characteristics.
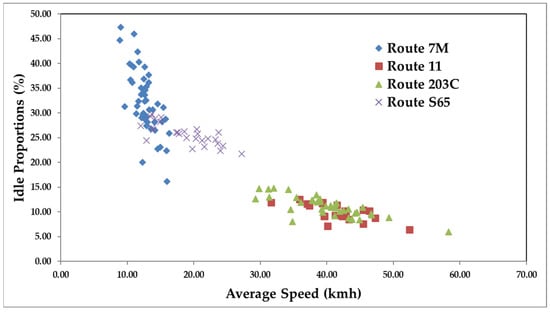
Figure 5.
Average speed vs. idle proportions plot characterising bus route characteristics.
First, the trip pattern looks reasonable where idle proportion and trip average speed are negatively correlated. From Figure 5, it is clear that Route 7M is the slowest route, with an average operating speed generally well below 20 km/h. Route S65 is also a slow route, but relatively faster than Route 7M, and can be up to nearly 30 km/h. On the other hand, Routes 11 and 203C look very similar, with average speed ranging from around 30 km/h to above 50 km/h. To summarise, these four routes differ significantly in terms of driving patterns, and thus necessitate the need for a route-based analysis of bus driving data to uncover more details about the differences between electric and diesel bus driving activities. This analysis also demonstrates that the collected dataset has captured a wide range of driving characteristics, as reflected in the key driving parameters presented in Figure 5. This serves as a reliable basis for the route-based analysis in the next sections.
6.3.1. Route-Based Driving Parameters
The route-based analysis first classified the collected bus driving data by the four selected routes. Then, the same three-step approach was applied to each of the four route-specific datasets. The detailed analysis procedure was basically the same as described in Section 6.1. Mean values of the 13 driving parameters were first derived for each route, but separately for electric and diesel buses. However, the selected routes were mainly served by electric buses. Conventional diesel buses were only scheduled for operation at a few specific timeslots, which limited the variety of data collected. Therefore, separate calculation of driving parameters for weekdays and weekends was not possible for diesel buses, and thus only overall averages for each route were computed in this case. For the electric bus cases, averages of the driving parameters for each route were derived for the whole dataset as well as for weekdays and weekends. These route-based driving parameter results are summarised in Table 7. Shaded in light blue are the diesel bus parameters which served as the baseline for comparison across all cases (i.e., overall mean, weekdays, and weekends) in the electric bus datasets. The same (Red, Yellow, and Green) colour scheme as described in Section 6.1 was adopted to highlight the magnitude and direction of differences for each electric bus driving parameters as compared to the baseline. Radar maps were also derived for each route as shown in Figure 6, which enabled an easier visual assessment of the differences. The purpose for the analysis in this section is two-fold. (1) To conduct a fair and direct comparison of route-specific differences in driving parameters between the two types of bus using data collected over exactly the same geographical setup; and (2) to investigate how these route-specific differences compare to the results obtained using mixed route datasets as described in Section 6.2. These analyses have been rare in the literature, as discussed earlier in the introduction and literature review sections, and thus highlight the originality and contributions of this study.
Table 7.
Driving pattern characterisation and comparison (route-based).
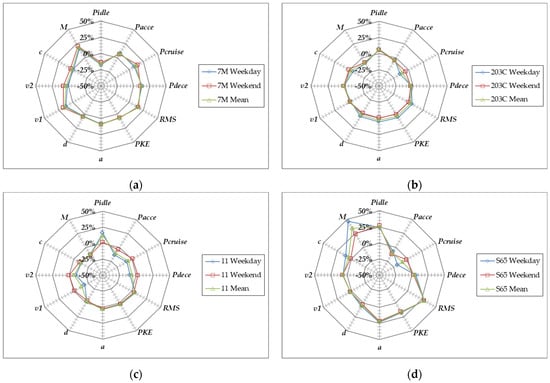
Figure 6.
Radar map illustrating the route-based percentage differences in driving parameters for electric buses as compared to the conventional diesel bus counterparts. (a) Route 7M (a circular route); (b) Route 203C; (c) Route 11 (a circular route); (d) Route S65 (a circular route).
As can be seen from Table 7 and Figure 6, the two types of bus exhibited more distinguished patterns when they were operating on Routes 7M and S65, whilst their operations along Routes 203C and 11 were relatively stable and similar. In the cases of Route 7M, nearly all parameters exhibited notable differences, except for the deceleration rates (d) and length of a driving cycle (c). The electric bus operations were faster (v1 and v2) and more aggressive (larger RMS, PKE, M and a), with a significant shift from time spent idling to other modes. In the cases of Routes 11 and 203C, the driving parameters of both types of bus did not differ a lot. The more obvious difference observed between electric and diesel buses was more time spent in idling than other modes and thus slower driving (v1 and v2). In the case of S65, there were significant increases in acceleration activities and their aggressiveness (RMS, PKE, a, d, and M). This observation particularly stood out in Figure 6. There were also considerable increases in the time spent in idling mode. These differences were obviously due to the route-specific features as described in Section 4 (Figure 1 and Table 2).
6.3.2. Route-Based Speed–Acceleration Probability Distributions
As for the SAPDs, the basic pattern is also consistent with the pattern observed in Section 6.2.2, where there is a significant idle peak. However, in some cases (Route S65, for example), the idle peak is much lower, and more time is observed spreading through to higher speed ranges. From the heat maps (Figure 7), more significant and varied differences are observed along Route S65 than any other route. The possible reason is that Route S65 serves a relatively newly developed district on Lantau Island of Hong Kong, where traffic conditions are less busy than the regions served by the other three selected routes. This presents more room for Route S65 to accommodate improved and more efficient driving behaviours using electric buses. The acceleration classes for which more notable differences can be observed between the electric and diesel SAPDs are also spread a bit wider (roughly from −2.0 m/s2 to +2.0 m/s2) than in the mixed-route analysis in Section 6.2.2 (−0.5 m/s2 to +0.5 m/s2). The intensities of the route-based differences between electric and diesel buses are also stronger (for example a bigger difference can easily be identified for the idle peak than in the mixed-route analysis from Section 6.2.2). The SSDs derived for comparing electric and diesel SAPDs are 41.6, 24.4, 12.8, and 33.3, respectively, for routes 7M, 11, 203C, and S65, which indicate generally bigger differences than in the mixed-route cases.
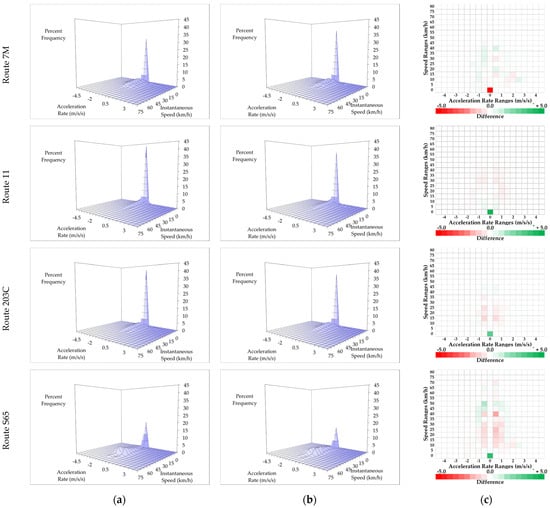
Figure 7.
SAPDs for electric and diesel buses (route-based). (a) SAPD (electric); (b) SAPD (diesel); and (c) heat map of the differences.
6.3.3. Route-Based VSP Distributions
The differences between electric and diesel buses also can be observed from the comparisons of VSP distributions in Figure 8 as well. These differences vary quite a lot across different routes. One important observation is that there is a general decreasing trend in frequencies across the positive VSP bins for the electric bus operations, which essentially implies reductions in vehicle energy consumption. Similar to the route-based SAPD analysis, the differences between electric and diesel VSP distributions for routes 11 and 203C are small, with an increase in frequency in the zero VSP bin shifting from other bins. For Route 7M, the zero VSP bin has a drop in frequency which moves towards the negative VSP bins. The pattern of VSP distributions for Route S65 is again very distinct from other routes, where the 0–5 kW/ton bin records the highest frequency, and the distribution for electric buses is also flatter than the diesel buses. Again, these differences can be attributed to the route-specific features.
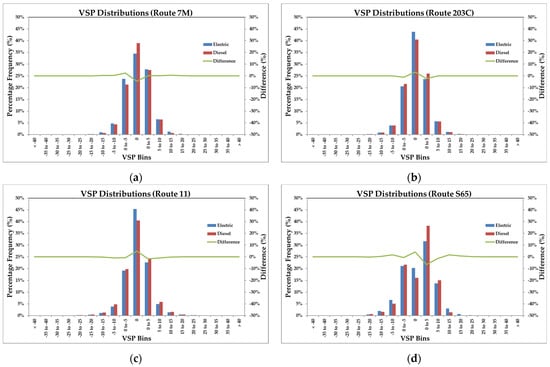
Figure 8.
VSP distributions (route-based) for electric buses as compared to the conventional diesel bus counterparts. (a) Route 7M (a circular route); (b) Route 203C; (c) Route 11 (a circular route); (d) Route S65 (a circular route).
7. Discussions and Implications on Vehicle Energy Consumption
It is well researched that electric vehicles’ energy consumption heavily depends on driving characteristics. However, direct comparison of driving characteristics between electric and diesel buses have been rare in the literature, and thus their differences in driving characteristics have not been fully pursued. Results from this study, as summarised in Table 8, have uncovered important findings that previously were unclear. This provides important references for electric bus energy consumption estimation and vehicle optimisation, as well as bus deployment plans. Section 6.1 characterised the basic driving patterns of the selected routes. It was found that weekend driving was smoother and faster, but less aggressive (i.e., more stable) than on weekdays. Off-peak driving was surprisingly slower than during peak periods due to the routes’ normal passenger demand characteristics.
Table 8.
Summary of analyses and key findings from this study.
Section 6.2 performed a mixed-route analysis to identify the key differences between electric and diesel buses, considering primarily the collective effect across all the selected routes. Notable differences between the two types of buses were observed, where electric buses were faster and smoother, with longer micro-trip lengths. The difference was the most significant around the idle periods, and small differences were observed across a relatively narrow acceleration rate of ±0.5 m/s2. These differences were more obvious during weekends, which uncovered strong evidence that combined (weekend and weekdays) analysis would possibly smooth out the differences. Differences in VSP distributions were similar to this pattern as well.
Section 6.3 investigated the intensity and direction of these differences at a route-based level. Results from this kind of analysis have been rare and are thus crucial to the literature. In general, the differences between electric and diesel buses became more obvious at the route-based level, spread across a wider speed and acceleration range, and the intensities and directions of these differences varied across different routes according to their route-specific features. In particular, electric buses were found to be generally more aggressive than diesel buses. This implies that route-based consideration is important for a better and more accurate electric bus deployment. These route-based analysis results were consistent with other studies such as Ye et al. [51], which contributed to the significant differences between driving distances and energy usage of electric buses following different driving cycles.
However, Ye et al.’s study was based on only one single test route, which might potentially smooth out the impact of route-based characteristics on the variations in driving characteristics. It is clear from our results that route-based analysis of bus driving characteristics has highlighted even greater variations in the direction and intensity of differences between electric and diesel buses across different bus routes, which might be related to the route-specific features and background traffic conditions. This could have significant implication on electric buses’ energy consumption levels [62,63]. Therefore, electric bus trial, optimisation, and deployment programmes should consider the route-specific driving conditions in which the bus is expected to be deployed. This is particularly important under the unique driving and background traffic conditions in Hong Kong.
8. Conclusions
This work carried out a fair and reasonable comparison of driving patterns between electric and conventional diesel buses under identical traffic conditions during normal daily bus operations. A three-step approach was employed to study and profile the driving characteristics along four selected routes in Hong Kong, covering different temporal and geographical features. This approach involved using the collected bus operating speed data to derive (i) a comprehensive set of driving parameters; (ii) speed–acceleration probability distributions; and (iii) vehicle-specific power distributions. Whilst the nature of this study is investigative and observational (instead of using complicated modelling), the approach adopted for data collection and analysis have been widely used and are consistent with similar studies in the literature. This approach of analysis and the metrics employed are standard and well accepted in the field, and have been widely used in similar studies. The sample size obtained (i.e., a total of 135 bus trips) was also considered sizable when compared to many previous similar studies, which substantiated the reliability of the collected dataset.
The significance of the current study lies in the investigation of driving characteristics in electric and conventional diesel buses under the same driving environment, as reflected in their operations along exactly the same set of bus routes. This provides solid evidence and insight on how electric buses might differ from conventional diesel buses during normal bus operations. This fair and reasonable comparison has been rare in the literature, which helps uncover important characteristics and differences between the operations of the two types of buses. The results obtained could be good references for government agencies and/or bus operators when it comes to making the decision to deploy electric buses on routes bearing specific driving characteristics.
The results of this study demonstrated significant differences in driving characteristics between electric buses and conventional diesel buses. Electric buses can generally operate faster and smoother than diesel buses, with a relatively longer duration of micro-trips and shorter time spent in idling mode. The patterns and intensities of these differences in driving characteristics are even more exaggerated when it comes to route-specific analysis. It highlights the fact that pooling mixed-route speed data together can potentially smooth out the differences and distinct patterns specific to a particular bus route. Therefore, there is a concrete need to consider route-specific features in determining electric bus evaluation and deployment strategies.
Author Contributions
Conceptualization, K.-W.N. and H.-Y.T.; methodology, K.-W.N. and H.-Y.T.; software, K.-W.N. and H.-Y.T.; validation, K.-W.N. and H.-Y.T.; formal analysis, H.-Y.T.; investigation, K.-W.N. and H.-Y.T.; resources, K.-W.N. and H.-Y.T.; data curation, K.-W.N.; writing—original draft preparation, K.-W.N. and H.-Y.T.; writing—review and editing, K.-W.N. and H.-Y.T.; visualization, K.-W.N. and H.-Y.T.; supervision, K.-W.N. and H.-Y.T.; project administration, K.-W.N. and H.-Y.T.; funding acquisition, H.-Y.T. and K.-W.N. All authors have read and agreed to the published version of the manuscript.
Funding
This research received no external funding.
Institutional Review Board Statement
Not applicable.
Informed Consent Statement
Not applicable.
Data Availability Statement
The driving speed data will be available upon reasonable request.
Conflicts of Interest
The authors declare no conflicts of interest. The funders had no role in the design of the study; in the collection, analyses, or interpretation of data; in the writing of the manuscript; or in the decision to publish the results.
References
- Kalghatgi, G. Is it really the end of internal combustion engines and petroleum in transport? Appl. Energy 2018, 225, 965–974. [Google Scholar] [CrossRef]
- García, A.; Monsalve-Serrano, J.; Martinez-Boggio, S.; Gaillard, P.; Poussin, O.; Amer, A.A. Dual fuel combustion and hybrid electric powertrains as potential solution to achieve 2025 emissions targets in medium duty trucks sector. Energy Convers. Manag. 2020, 224, 113320. [Google Scholar]
- Luj’an, J.M.; García, A.; Monsalve-Serrano, J.; Martínez-Boggio, S. Effectiveness of hybrid powertrains to reduce the fuel consumption and NOx emissions of a Euro 6d-temp diesel engine under real-life driving conditions. Energy Convers. Manag. 2019, 199, 111987. [Google Scholar] [CrossRef]
- Stempien, J.P.; Chan, S.H. Comparative study of fuel cell, battery and hybrid buses for renewable energy constrained areas. J. Power Sources 2017, 340, 347–355. [Google Scholar] [CrossRef]
- Ritchie, H.; Roser, M. CO2 and Greenhouse Gas Emissions, Our World in Data. May 2020. Available online: https://ourworldindata.org/co2-and-greenhouse-gas-emissions (accessed on 30 April 2024).
- Kumares, C.; Sinha, F. Sustainability and Urban Public Transportation. ASCE J. Transp. Eng. 2003, 129, 331–341. [Google Scholar]
- Csuzi, I.; Csuzi, B. The urban electric bus, a sustainable solution to increase energy efficiency of public transport and reduce atmospheric pollution in the cities. In Proceedings of the 2017 Electric Vehicles International Conference, EV 2017, Bucharest, Romania, 5–6 October 2017; pp. 1–6. [Google Scholar]
- Ercan, T.; Onat, N.C.; Tatari, O. Investigating carbon footprint reduction potential of public transportation in United States: A system dynamics approach. J. Clean. Prod. 2016, 133, 1260–1276. [Google Scholar] [CrossRef]
- Wu, Y.; Zhang, S.; Li, M. The challenge to NOx emission control for heavy-duty diesel vehicles in China. Atmos. Chem. Phys. 2012, 12, 9365–9379. [Google Scholar] [CrossRef]
- Tong, H.Y.; Ng, K.W. Developing electric bus driving cycles with significant road gradient changes: A case study in Hong Kong. Sustain. Cities Soc. 2023, 98, 104819. [Google Scholar] [CrossRef]
- Das, D.; Ramesha, P.A.; Jana, M.; Basu, S. Generation of driving cycles for electric vehicles. In Proceedings of the IEEE Transportation Electrification Conference (ITEC-India), New Delhi, India, 16–19 December 2021; pp. 1–5. [Google Scholar]
- Wang, X.X.; Ye, P.L.; Deng, Y.L.; Yuan, Y.N.; Zhu, Y.; Ni, H.J. Influence of different data interpolation methods for sparse data on the construction accuracy of electric bus driving cycle. Electronics 2023, 12, 1377. [Google Scholar] [CrossRef]
- Tong, H.Y.; Ng, K.W. Development of bus driving cycles using a cost effective data collection approach. Sustain. Cities Soc. 2021, 69, 102854. [Google Scholar] [CrossRef]
- LCQ18. Electric Public Transport. 2023. Available online: https://www.info.gov.hk/gia/general/202311/08/P2023110800364.htm (accessed on 30 April 2024).
- LC Paper No. CB(1)949//16-17(03); Legislative Council Panel on Environmental Affair: Improvement on Roadside Air Quality. (For Discussion on 22 May 2017). Available online: https://www.legco.gov.hk/yr16-17/english/panels/ea/papers/ea20170522cb1-949-3-e.pdf (accessed on 30 April 2024).
- Hung, W.T.; Cheung, C.S.; Lo, E.W.C.; Shum, K.Y.H.; Hui, H.H.T. Electrification of Single-Deck Bus and Minibus in Hong Kong: Final Report. Public Policy Research Funding Scheme (Project Number: 2015.A6.058.15D). 2016. Available online: https://www.cepu.gov.hk/doc/en/research_report(PDF)/2015_A6_058_15D_Final_Report_Dr_Hung.pdf (accessed on 30 April 2024).
- Roadmap for the Proliferation of Electric Vehicles. 2021. Available online: https://www.epd.gov.hk/epd/english/resources_pub/policy_documents/index.html (accessed on 30 April 2024).
- New Energy Transport Fund. 2021. Available online: https://www.eeb.gov.hk/en/new-energy-transport-fund.html (accessed on 30 April 2024).
- Manzolli, J.A.; Trovão, J.P.; Antunes, C.H. A review of electric bus vehicles research topics—Methods and trends. Renew. Sustain. Energy Rev. 2022, 159, 112211. [Google Scholar] [CrossRef]
- Zhang, L.; Qin, Q. China’s new energy vehicle policies: Evolution, comparison and recommendation. Transp. Res. Pol. Pract. 2018, 110, 57–72. [Google Scholar] [CrossRef]
- Wang, S.; Li, J.; Zhao, D. The impact of policy measures on consumer intention to adopt electric vehicles: Evidence from China. Transp. Res. Pol. Pract. 2017, 105, 14–26. [Google Scholar] [CrossRef]
- Du, J.; Li, F.Q.; Li, J.Q.; Wu, X.G.; Song, Z.Y.; Zou, Y.F.; Ouyang, M.G. Evaluating the technological evolution of battery electric buses: China as a case. Energy 2019, 176, 309–319. [Google Scholar] [CrossRef]
- Jenn, A.; Springel, K.; Gopal, A.R. Effectiveness of electric vehicle incentives in the United States. Energy Pol. 2018, 119, 349–356. [Google Scholar] [CrossRef]
- Shaheen, S.; Martin, E.; Totte, H. Zero-emission vehicle exposure within U.S. carsharing fleets and impacts on sentiment toward electric-drive vehicles. Transp. Pol. 2020, 85, A23–A32. [Google Scholar] [CrossRef]
- Brdulak, A.; Chaberek, G.; Jagodzinski, J. Development forecasts for the zero-emission bus fleet in servicing public transport in chosen EU member countries. Energies 2020, 13, 4239. [Google Scholar] [CrossRef]
- Miles, J.; Potter, S. Developing a viable electric bus service: The Milton Keynes demonstration project. Res. Transp. Econ. 2014, 48, 357–363. [Google Scholar] [CrossRef]
- Chao, Z.; Xiaohong, C. Optimizing battery electric bus transit vehicle scheduling with battery exchanging: Model and case study. Procedia-Soc. Behav. Sci. 2013, 96, 2725–2736. [Google Scholar] [CrossRef]
- Zivanovic, Z.; Nikolic, Z. The application of electric drive technologies in city buses. In New Generation of Electric Vehicles; Zeditor, S., Ed.; 2012; Available online: https://www.intechopen.com/chapters/41487 (accessed on 30 April 2024).
- Lajunen, A.; Lipman, T. Lifecycle cost assessment and carbon dioxide emissions of diesel, natural gas, hybrid electric, fuel cell hybrid and electric transit buses. Energy 2016, 106, 329–342. [Google Scholar] [CrossRef]
- Ribau, J.P.; Silva, C.M.; Sousa, J.M.C. Efficiency, cost and life cycle CO2 optimization of fuel cell hybrid and plug-in hybrid urban buses. Appl. Energy 2014, 129, 320–335. [Google Scholar] [CrossRef]
- Lajunen, A. Energy consumption and cost-benefit analysis of hybrid and electric city buses. Transp. Res. Part C Emerg. Technol. 2014, 38, 1–15. [Google Scholar] [CrossRef]
- McKenzie, E.C.; Durango-Cohen, P.L. Environmental life-cycle assessment of transit buses with alternative fuel technology. Transp. Res. Part D Transp. Environ. 2012, 17, 39–47. [Google Scholar] [CrossRef]
- Ou, X.M.; Zhang, X.L.; Chang, S.Y. Alternative fuel buses currently in use in China: Life-cycle fossil energy use, GHG emissions and policy recommendations. Energy Policy 2010, 38, 406–418. [Google Scholar] [CrossRef]
- García Sánchez, J.A.; López Martínez, J.M.; Lumbreras Martín, J.; Flores Holgado, M.N.; Aguilar Morales, H. Impact of Spanish electricity mix, over the period 2008–2030, on the life Cycle energy consumption and GHG emissions of electric, hybrid diesel-electric, fuel cell hybrid and diesel bus of the Madrid transportation system. Energy Convers. Manag. 2013, 74, 332–343. [Google Scholar] [CrossRef]
- Mahmouda, M.; Garnett, R.; Ferguson, M.; Kanaroglou, P. Electric buses: A review of alternative powertrains. Renew. Sustain. Energy Rev. 2016, 62, 673–684. [Google Scholar] [CrossRef]
- Tzenga, G.H.; Lina, C.W.; Opricovicb, S. Multi-criteria analysis of alternative-fuel buses for public transportation. Energy Policy 2005, 33, 1373–1383. [Google Scholar] [CrossRef]
- Reinhart Kühne. Electric buses—An energy efficient urban transportation means. Energy 2010, 35, 4510–4513. [Google Scholar] [CrossRef]
- Gao, D.W.; Jin, Z.H.; Zhang, J.Z.; Li, J.Q.; Ouyang, M.G. Comparative study of two different powertrains for a fuel cell hybrid bus. J. Power Sources 2016, 319, 9–18. [Google Scholar] [CrossRef]
- Sun, R.R.; Chen, Y.C.; Dubey, A.; Pugliese, P. Hybrid electric buses fuel consumption prediction based on real-world driving data. Transp. Res. Part D Transp. Environ. 2021, 91, 102637. [Google Scholar] [CrossRef]
- García, A.; Monsalve-Serrano, J.; Lago Sari, R.; Tripathi, S. Life cycle CO₂ footprint reduction comparison of hybrid and electric buses for bus transit networks. Appl. Energy 2022, 308, 118354. [Google Scholar]
- Song, Q.B.; Wang, Z.S.; Wu, Y.; Li, J.H.; Yu, D.F.; Duan, H.B.; Yuan, W.Y. Could urban electric public bus really reduce the GHG emissions: A case study in Macau? J. Clean. Prod. 2018, 172, 2133–2142. [Google Scholar] [CrossRef]
- Zhou, B.Y.; Wu, Y.; Zhou, B.; Wang, R.J.; Ke, W.W.; Zhang, S.J. Real-world performance of battery electric buses and their life-cycle benefits with respect to energy consumption and carbon dioxide emissions. Energy 2016, 96, 603–613. [Google Scholar] [CrossRef]
- Alyson, L.P.; Rodrigues, S.; Seixas, R.C. Battery-electric buses and their implementation barriers: Analysis and prospects for sustainability. Sustain. Energy Technol. Assess. 2022, 51, 101896. [Google Scholar]
- Rupp, M.; Handschuh, N.; Rieke, C.; Kuperjans, I. Contribution of country-specific electricity mix and charging time to environmental impact of battery electric vehicles: A case study of electric buses in Germany. Appl. Energy 2019, 237, 618–634. [Google Scholar] [CrossRef]
- Correa, G.; Muñoz, P.M.; Rodriguez, C.R. A comparative energy and environmental analysis of a diesel, hybrid, hydrogen and electric urban bus. Energy 2019, 187, 115906. [Google Scholar] [CrossRef]
- Correa, G.; Muñoz, P.; Falaguerra, T.; Rodriguez, C.R. Performance comparison of conventional, hybrid, hydrogen and electric urban buses using well to wheel analysis. Energy 2017, 141, 537–549. [Google Scholar] [CrossRef]
- Mao, F.; Li, Z.H.; Zhang, K. Carbon dioxide emissions estimation of conventional diesel buses electrification: A well-to-well analysis in Shenzhen, China. J. Clean. Prod. 2020, 277, 123048. [Google Scholar] [CrossRef]
- Wayne, W.S.; Clark, N.N.; Nine, R.D.; Elefante, D. A Comparison of Emissions and Fuel Economy from Hybrid-Electric and Conventional-Drive Transit Buses. Energy Fuels 2004, 18, 257–270. [Google Scholar] [CrossRef]
- Tong, H.Y.; Ng, K.W. A bottom-up clustering approach to identify bus driving patterns and to develop bus driving cycles for Hong Kong. Environ. Sci. Pollut. Res. 2021, 28, 14343–14357. [Google Scholar] [CrossRef]
- Tong, H.Y.; Ng, K.W. A cost effective data collection approach to investigating driving patterns for franchised bus services in Hong Kong. In Proceedings of the 25th International Conference of the Hong Kong Society for Transportation Studies, Hong Kong, 9 December 2021. [Google Scholar]
- Ye, Y.; Zhao, X.; Zhang, J.F. Driving cycle electrification and comparison. Transp. Res. Part D 2023, 123, 103900. [Google Scholar] [CrossRef]
- Transport Department. September Monthly Transport Digests; Transport Department of the Hong Kong SAR Government: Hong Kong, 2019.
- Wang, H.; Zhang, X.; Wu, L.; Hou, C.; Gong, H.; Zhang, Q.; Ouyang, M. Beijing passenger car travel survey: Implications for alternative fuel vehicle deployment. Mitig. Adapt. Strateg. Glob. Change 2014, 20, 817–835. [Google Scholar] [CrossRef]
- Mansour, C.; Zgheib, E.; Saba, S. Evaluating impact of electrified vehicles on fuel consumption and CO2 emissions reduction in Lebanese driving conditions using onboard GPS survey. Energy Procedia 2011, 6, 261–276. [Google Scholar] [CrossRef]
- Panchal, S.; Mcgrory, J.; Kong, J.; Fraser, R.; Fowler, M.; Dincer, I.; Agelin-Chaab, M. Cycling degradation testing and analysis of a LiFePO4 battery at actual conditions. Int. J. Energy Res. 2017, 41, 2565–2575. [Google Scholar] [CrossRef]
- Chen, T.; Li, M.X.; Feng, H.J.; Chen, B.; Gao, Y. Statistical vehicle specific power profiling of heavy-duty vehicles for mountainous highways. Green intelligent transportation systems. In Proceedings of the 8th International Conference on Green Intelligent Transportation Systems and Safety, Beijing, China, 1–2 July 2019; pp. 229–236. [Google Scholar]
- Yao, Z.; Wei, H.; Liu, H.; Li, Z.X. Statistical vehicle specific power profiling for urban freeways. Procedia Soc. Behav. Sci. 2013, 96, 2927–2938. [Google Scholar] [CrossRef][Green Version]
- Zang, J.R.; Song, G.H.; Wu, Y.Z.; Yu, L. Method for Evaluating Eco-Driving Behaviours Based on Vehicle Specific Power Distributions. Transp. Res. Rec. 2019, 2673, 409–419. [Google Scholar] [CrossRef]
- Xu, D.D.; Gao, Z.M.; Guo, Y.; Yan, Y.; Wang, F.B.; Shi, F.L. Study on Fuel Consumption and Emission Characteristics of China VI Heavy Duty Vehicle Based on Vehicle Specific Power. E3S Web Conf. 2021, 268, 01055. [Google Scholar] [CrossRef]
- Alves, J.; Baptista, P.C.; Goncalves, G.A.; Duarte, G.O. Indirect methodologies to estimate energy use in vehicles: Application to battery electric vehicles. Energy Convers. Manag. 2016, 124, 116–129. [Google Scholar] [CrossRef]
- Wu, X.K.; Freese, D.; Cabrera, A.; Kitch, W.A. Electric vehicles’ energy consumption measurement and estimation. Transp. Res. Part D Transp. Environ. 2015, 34, 52–67. [Google Scholar] [CrossRef]
- Lin, R.; Wang, P. Intention to perform eco-driving and acceptance of eco-driving system. Transp. Res. Part A 2022, 166, 444–459. [Google Scholar] [CrossRef]
- Wang, G.J.; Makino, K.; Harmandayan, A.; Wu, X.K. Eco-driving behaviours of electric vehicle users: A survey study. Transp. Res. Part D 2020, 78, 102188. [Google Scholar] [CrossRef]


Disclaimer/Publisher’s Note: The statements, opinions and data contained in all publications are solely those of the individual author(s) and contributor(s) and not of MDPI and/or the editor(s). MDPI and/or the editor(s) disclaim responsibility for any injury to people or property resulting from any ideas, methods, instructions or products referred to in the content. |
© 2024 by the authors. Licensee MDPI, Basel, Switzerland. This article is an open access article distributed under the terms and conditions of the Creative Commons Attribution (CC BY) license (https://creativecommons.org/licenses/by/4.0/).