Article

Long-Term Forecast of Energy Demand towards a Sustainable Future in Renewable Energies Focused on Geothermal Energy in Peru (2020–2050): A LEAP Model Application

by
Diego G. De la Cruz Torres
,
Luis F. Mazadiego
*,
David Bolonio
and
Ramón Rodríguez Pons-Esparver
School of Mining and Energy Engineering, Universidad Politécnica de Madrid, 28003 Madrid, Spain
*
Author to whom correspondence should be addressed.
Sustainability 2024, 16(12), 4964; https://doi.org/10.3390/su16124964
Submission received: 17 April 2024 / Revised: 27 May 2024 / Accepted: 7 June 2024 / Published: 11 June 2024
(This article belongs to the Special Issue Energy Management System and Sustainability)

Abstract

:
The present study aims to describe the potential sources of energy in Peru with the purpose of implementing them to achieve a sustainable system, taking advantage of the natural resources in the Peruvian land. To achieve this, three alternative scenarios have been defined and analyzed using the LEAP (Long-range Energy Alternatives Planning) software [Software Version: 2020.1.112]. The scenarios are as follows: the first one, the Business-as-Usual scenario, is based on normal trends according to historical data and referencing projections made by Peruvian state entities; the second one is focused on Energy Efficiency, the highlighted characteristic is taking into consideration the efficient conditions in transmission and distribution of electric energy; and the third one, centered on Geothermal Energy, focused on the development of this type of energy source and prioritizing it. The primary purpose of this analysis is to identify the advantages and disadvantages inherent in each scenario in order to obtain the best out of each one. In this way, the intention is to propose solutions based on Peru’s national reality or possible uses of the country’s energy potential to supply its energy demand. Currently, Peru’s energy demand relies on fossil fuels, hydraulic, and thermal energy. However, there is the possibility of transforming this system into a sustainable one by strengthening existing and growing energy sources such as solar and wind energy and new technologies for hydraulic and thermal energy, in addition to considering geothermal energy as the main energy source in the third scenario. The new system mentioned satisfactorily indicates that the CO2 equivalent emissions decrease significantly in the third scenario, with a 15.8% reduction compared to the first scenario and a 9.7% reduction in comparison to the second. On the other hand, the second scenario shows a 5.6% decrease in CO2 emissions compared to the first, resulting from improvements in technology and energy efficiency without requiring significant modifications or considerable investments, as in the third scenario.

1. Introduction

The variations in temperature and climate patterns, also known as climate change, can be natural; an example of this is the variation in solar. However, since the 19th century, human activities have been the main driver of climate change, primarily attributed to the burning of fossil fuels, which generate greenhouse gases (GHGs) that trap heat from the sun, thereby raising temperatures.
The main greenhouse gas emissions are methane and carbon dioxide, primarily stemming from activities related to the energy industry, transportation, construction, and agriculture. As a consequence of climate change, the Earth’s temperature has risen by approximately 1.1 °C since the last recorded temperature in the 19th century. Additionally, it has been documented that the last decade was the warmest on record (2011–2020) [1].
Ironically, studies demonstrate that the energy supply for sectors, such as households and commercial buildings, is responsible for 35% of global emissions, as many countries rely on fossil fuels for energy supply, with the population using this energy for cooling and heating systems. Therefore, there is a concerted effort to transition to renewable energy sources for these energy needs [2].
Figure 1 reflects that global electricity demand growth experienced a decrease in the year 2023, while an increase is expected for the year 2024. The increase in electricity demand was slightly less than 2% in 2023, whereas in the previous year, 2022, a growth of 2.3% was recorded. However, both of these values for the past two years are lower than the average annual growth rate during the period 2015–2019, which stood at 2.4%.
These data are mainly due to the decrease in electricity demand in the world’s major economies, which are experiencing slower economic growth due to the global energy crisis. Three scenarios have been projected in the Energy Outlook [4], all of which maintain the trend shown in Figure 2. Here, we can observe the impact that the integration of renewable energies would have on global energy consumption. By 2050, considering a conservative scenario, the percentage of hydrocarbons would decrease from 72% to 30%, while the share of renewable energies would increase from 4% to 42%.
On the other hand, for the current year, 2024, global electricity demand growth is expected to reach 3.3% [3]. Currently, the energy industry no longer only focuses on producing and distributing energy. Through state policies, campaigns are promoted to ensure that energy companies carry out their activities efficiently utilizing natural resources. Thus, there is an expectation to implement a sustainable strategy so that resource utilization is both responsible and profitable [5]. For this reason, private companies, in collaboration with the responsible state entity, have undertaken various projects related to the planning and modeling of electrical consumption [6], based on scenarios of electrical demand and production [7,8,9], consumption of fossil fuels for use in industrial electrical generation [10], sustainable energy generation, and application in the industrial sector [11,12] and its performance [13]. The main motivation behind the mentioned commitments is due to international treaties. The Paris Agreement, an internationally legally binding treaty on climate change, was adopted by 196 parties at the COP21 convention in Paris. Where its primary objective is to limit global warming, and so far, solutions with low carbon emissions have been found, leading to openness to new markets. It is important to note that the main trend is in the energy and transportation sectors [14]. On the other hand, there is the Kyoto Protocol, which operationalizes the United Nations Framework Convention on Climate Change, committing industrialized countries to limit and reduce greenhouse gas emissions. Financing has been achieved for adaptation projects and programs for developing countries that are parties to the Kyoto Protocol [15]. In Latin America, from 2007 to 2013, there has been an annual increase in electricity demand of 2.8%. During this period, Peru experienced the highest growth rate, at 6.6%, primarily due to the utilization of natural gas (see Figure 3) [16].
However, Peru ranks among the five Latin American countries with the lowest per capita electricity consumption in the year 2020, namely Peru, Colombia, Ecuador, Guyana, and Bolivia, respectively [17] (see Figure 4).
In Peru, as well as throughout South America, electricity production is primarily generated by conventional renewable energy sources, such as hydroelectric power. However, in order to improve the quality of life for the population and protect the environment, there is a proposal to develop non-conventional renewable energies.
As a result, auctions related to Renewable Energy Resources (RER) technologies have been carried out for the National Interconnected Electric System (SEIN by its initials in Spanish), as well as one for areas not connected to the grid [18].
An important point to highlight is that Lima has a high population density, with 10,556,000 inhabitants in an area of 891 square kilometers, resulting in an urban population density of 11,848 inhabitants per square kilometer in 2023 [19]; despite the high population density, by the year 2021 was recorded that 2.4% of households were without access to electricity through the public grid [20].
In terms of primary energy production, Peru is a hydrocarbon-producing country on the northern coast. In 2022, 87 development wells were drilled in this geographic area. Additionally, in the Peruvian jungle, four development wells were drilled in the same year. Unfortunately, the last exploratory wells drilled in recent years were one in 2020 and one in 2021. In 2022, there was an average production of 40 thousand barrels of oil per day, an average production of 80 thousand barrels of natural gas liquids per day, and 1300 million cubic feet of natural gas per day [21].
On the other hand, concerning the distribution of electrical energy, renewable energy resources (RER) represent 8.1% of electricity production as of December 2022, composed of hydroelectric, wind, solar, bagasse, and biogas [22]. Similarly, geothermal energy in Peru is an important point to consider because, in the southern region of Peru, there are volcanic chains with a high potential for the development of this type of energy [23]. Currently, the Philippine company Energy Development Corporation (EDC) is developing two major projects, Achumani in Arequipa and Quello Apacheta in Moquegua [24].
The present study of energy cases developed for Peru would serve as an indicator of the importance of focusing on the energy chain. Although different energy sources are considered, efficiency in transformation and distribution is also being taken into account. This would allow attention not only to the types of energy sources, capacity, or the electrical grid but also to losses and the importance of investing in the implementation of new technologies in transmission and distribution. On the other hand, this approach would incentivize and fulfill some of the United Nations’ objectives, primarily those related to clean and accessible energy for all, as well as innovation in industry and infrastructure [25].
In general terms, based on all the information collected, the aim is to evaluate all possibilities and bridge the gap of energy demand shortages while utilizing more renewable resources. This would positively affect not only the environmental impact but also directly contribute to making Peru a self-sustaining country, reducing the need for hydrocarbon imports for electricity generation and instead using the produced resources for these purposes. Geothermal energy is considered a very important source of energy. Despite the limited studies on this in Peru, projects have been proposed in certain areas for future development. Nevertheless, the positive impact of implementing this energy source will be taken into consideration.
The LEAP software has been utilized with the purpose of projecting energy demand until the year 2050. Due to the large amount of information required to supply the software for this purpose, it is not feasible to depict all the information in detail. However, in summary, the energy demand was divided into three principal sectors: households, industry, and transport. Households were further subdivided into urban and rural areas; industry into iron, paper, cement, fishing, food, and retail; transport by road, rail, air, and maritime. To perform an accurate simulation, important factors such as population and its growth, the type of fuel utilized in households, power supply for industries, and fuel consumption by transport were considered.

2. Electric Power Generation in Peru

For sustained economic growth, it is vital to have a secure and continuous electricity supply. According to the Central Reserve Bank of Peru (BCRP by its initials in Spanish), the available supply of the National Interconnected Electric System (SEIN) was 10,867 MW in 2020. It is also worth noting that the available supply is always less than the effective capacity, which was 12,708 MW. On the other hand, the energy demand in that same year was 6960 MW [26].

2.1. Structure of Peruvian Electricity Generation

Electric power generation in Peru is divided into two groups: (a) Renewable Energy Resources or RER technologies, which refer to hydroelectric, wind, solar, and biomass resources [27], where hydroelectric power has the highest percentage of participation among all energy sources in Peru, with a share of around 56% [28], and (b) Non-renewables or fossil fuels, which correspond to the use of thermal energy for electricity generation, with natural gas being the main energy source, followed by diesel [29] and coal. This last energy source was allocated for the country’s only coal-fired power plant, which closed in December 2022, with the energy potential produced being replaced by renewable resource sources [30,31,32].

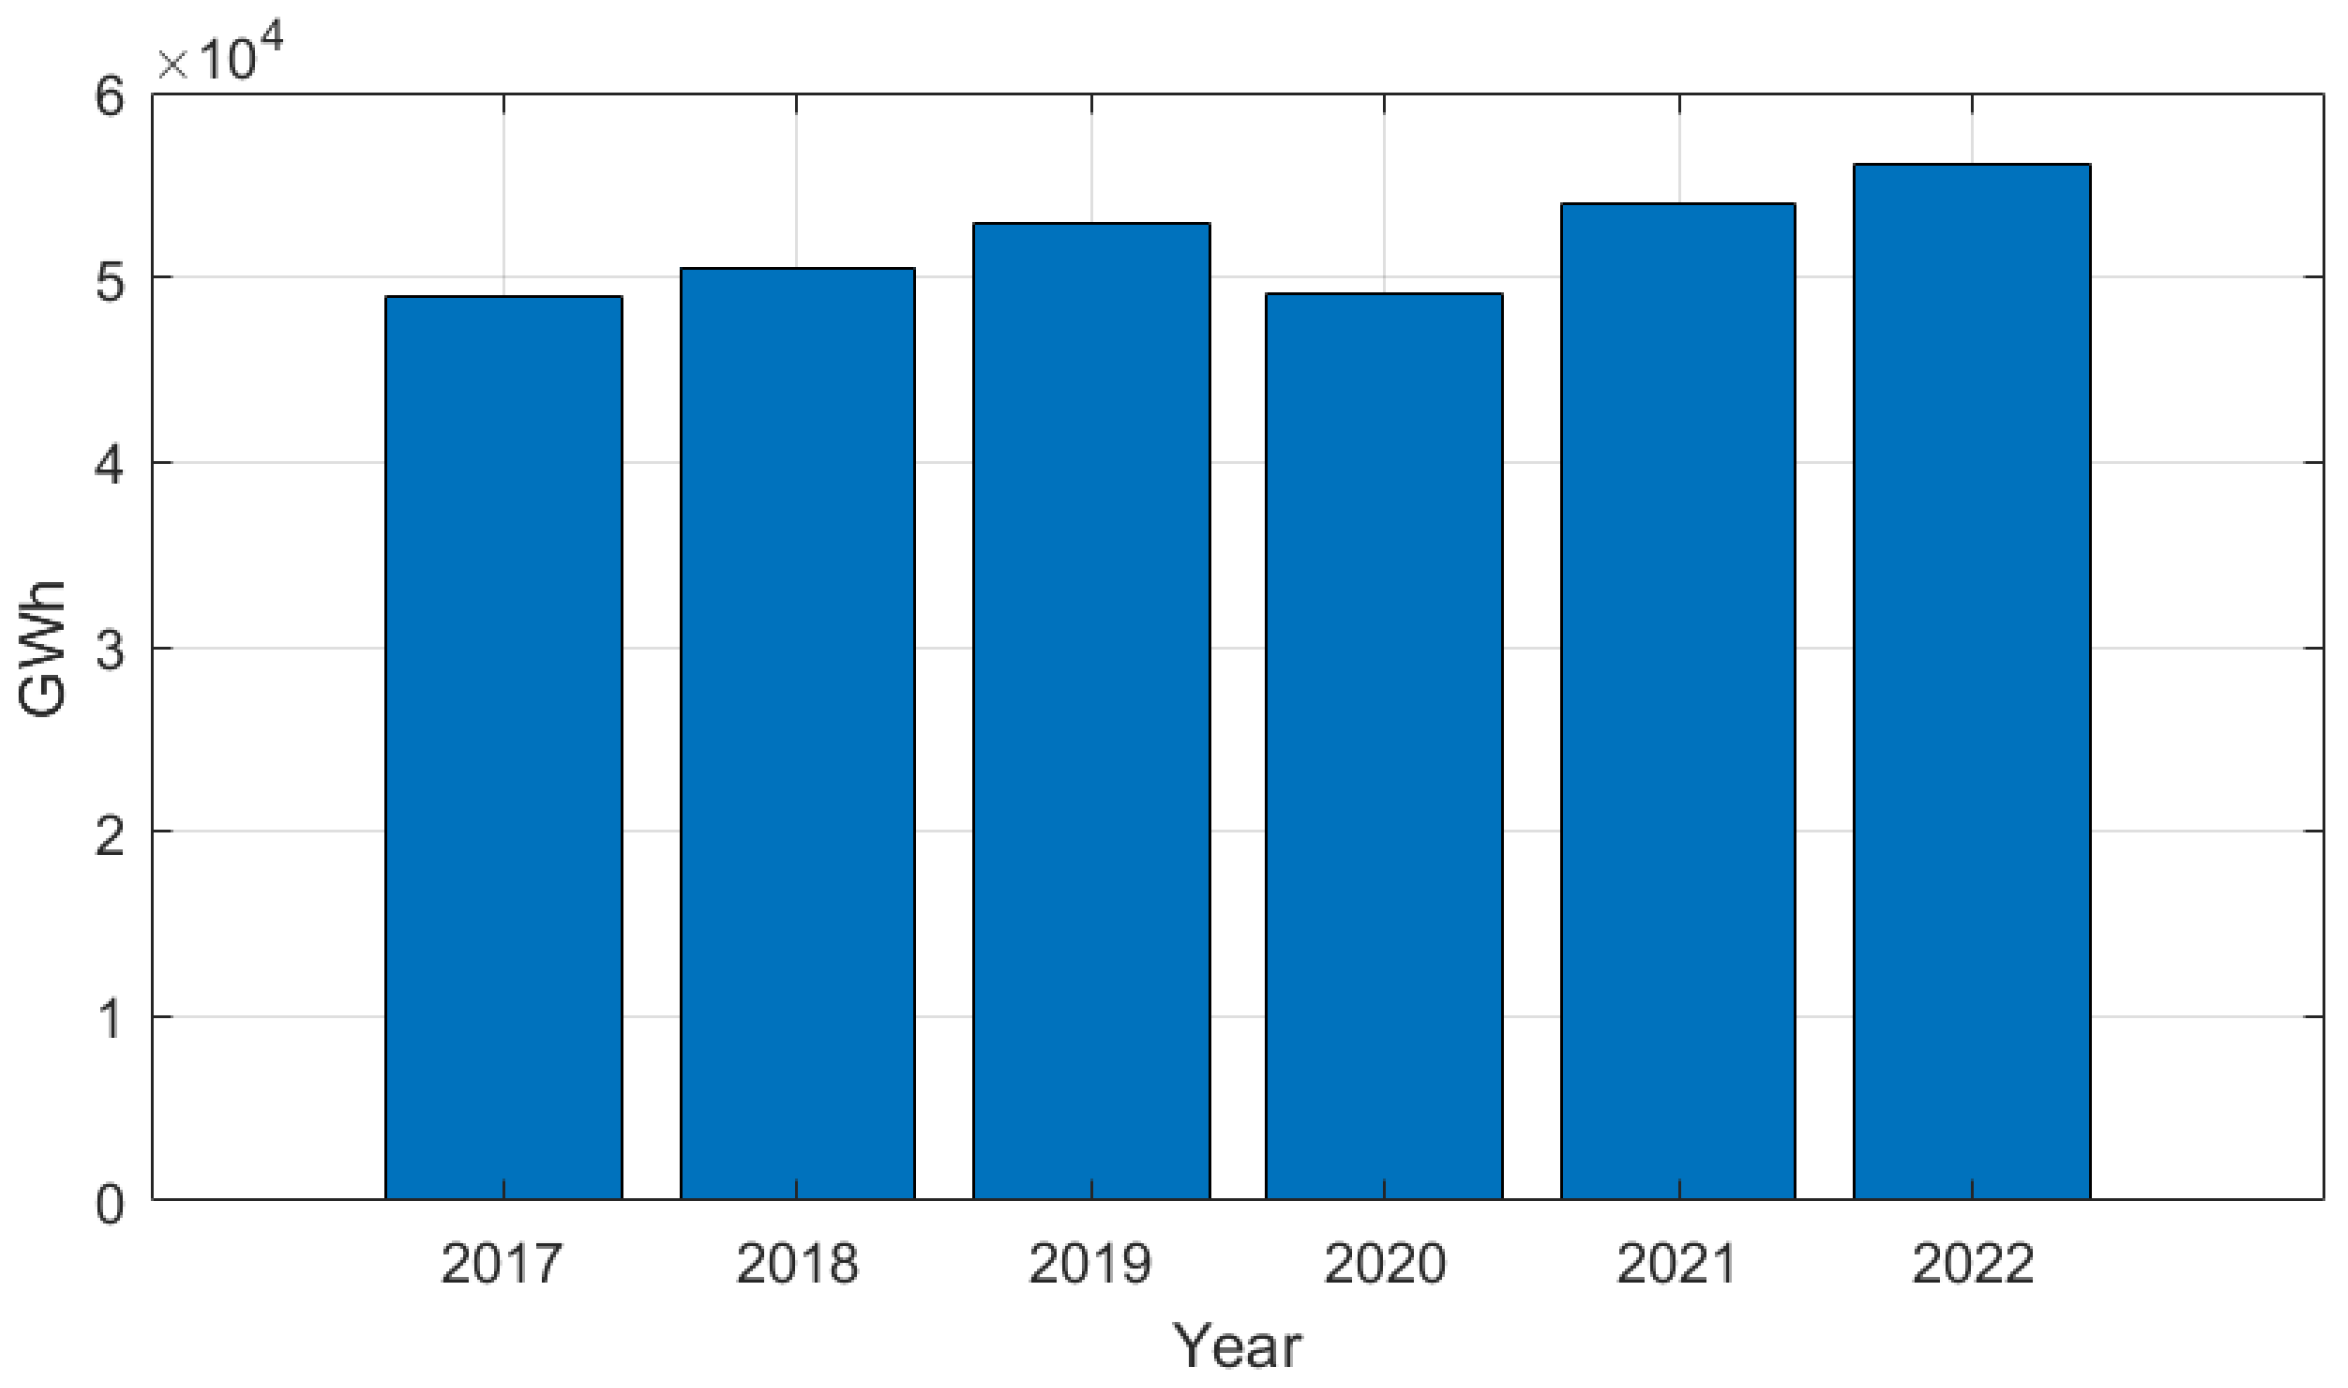
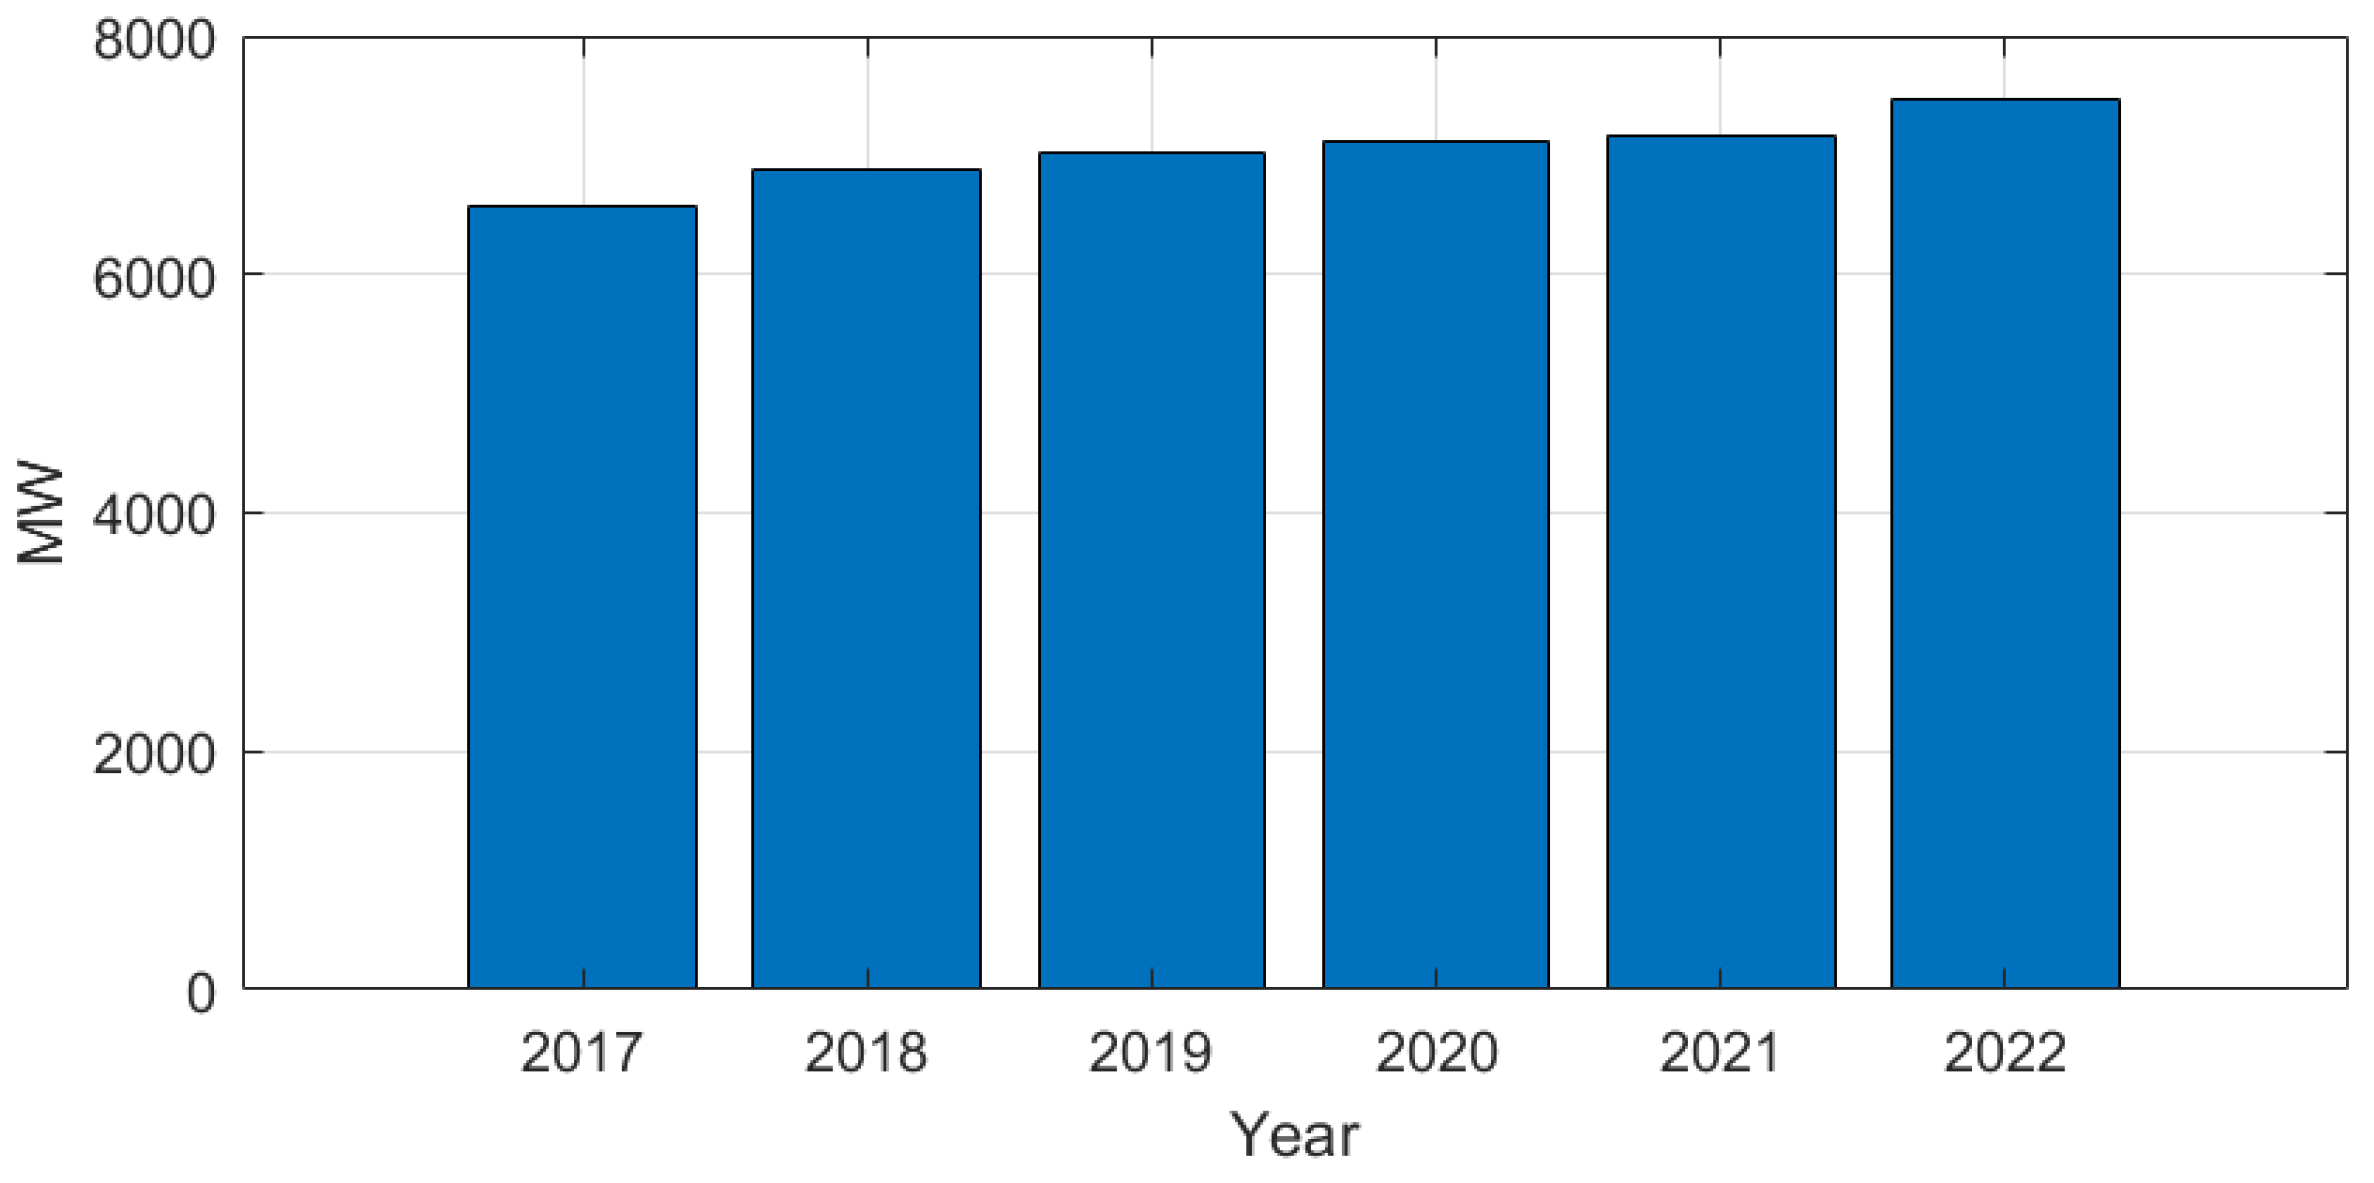
2.2. Analysis of Electric Power Generation

Nowadays, according to the Ministry of Energy and Mines (MINEM by its initials in Spanish), electric power produced at the national level in gigawatt-hours (GWh) is predominantly distributed by hydroelectric power and to a lesser extent by solar power [33] (see Figure 5).
The Peruvian economy continues to be affected by various factors, both external and internal. The most notable and significant of these has been internal due to political uncertainty in the latter months of 2022. Nevertheless, there was a growth in GDP of 2.7%. One result of this is the increase in national electricity generation, which increased by 3.9% between 2021 and 2022 [34] (see Figure 6).
Furthermore, in the years 2020, 2021, and 2022, the effective power of electric power plants at the national level was 14.4 MW, 14.6 MW, and 15 MW, respectively. On the other hand, the installed power capacity in electric power plants at the national level was 15.2 MW, 15.3 MW, and 15.7 MW, respectively [33].

2.3. Analysis of Electric Power Demand

The total electricity production in 2021 was 57,370.5 GWh [33]. Therefore, the per capita electricity production would be 1616.3 kWh [35]. The demand recorded a significant increase in the last year, 4.1% in 2022 compared to the previous year [33]. Additionally, there was a peak in electricity demand in March 2023, reaching 7583.4 MW, resulting in a 1.6% increase compared to the peak recorded in 2022 [34] (see Figure 7).

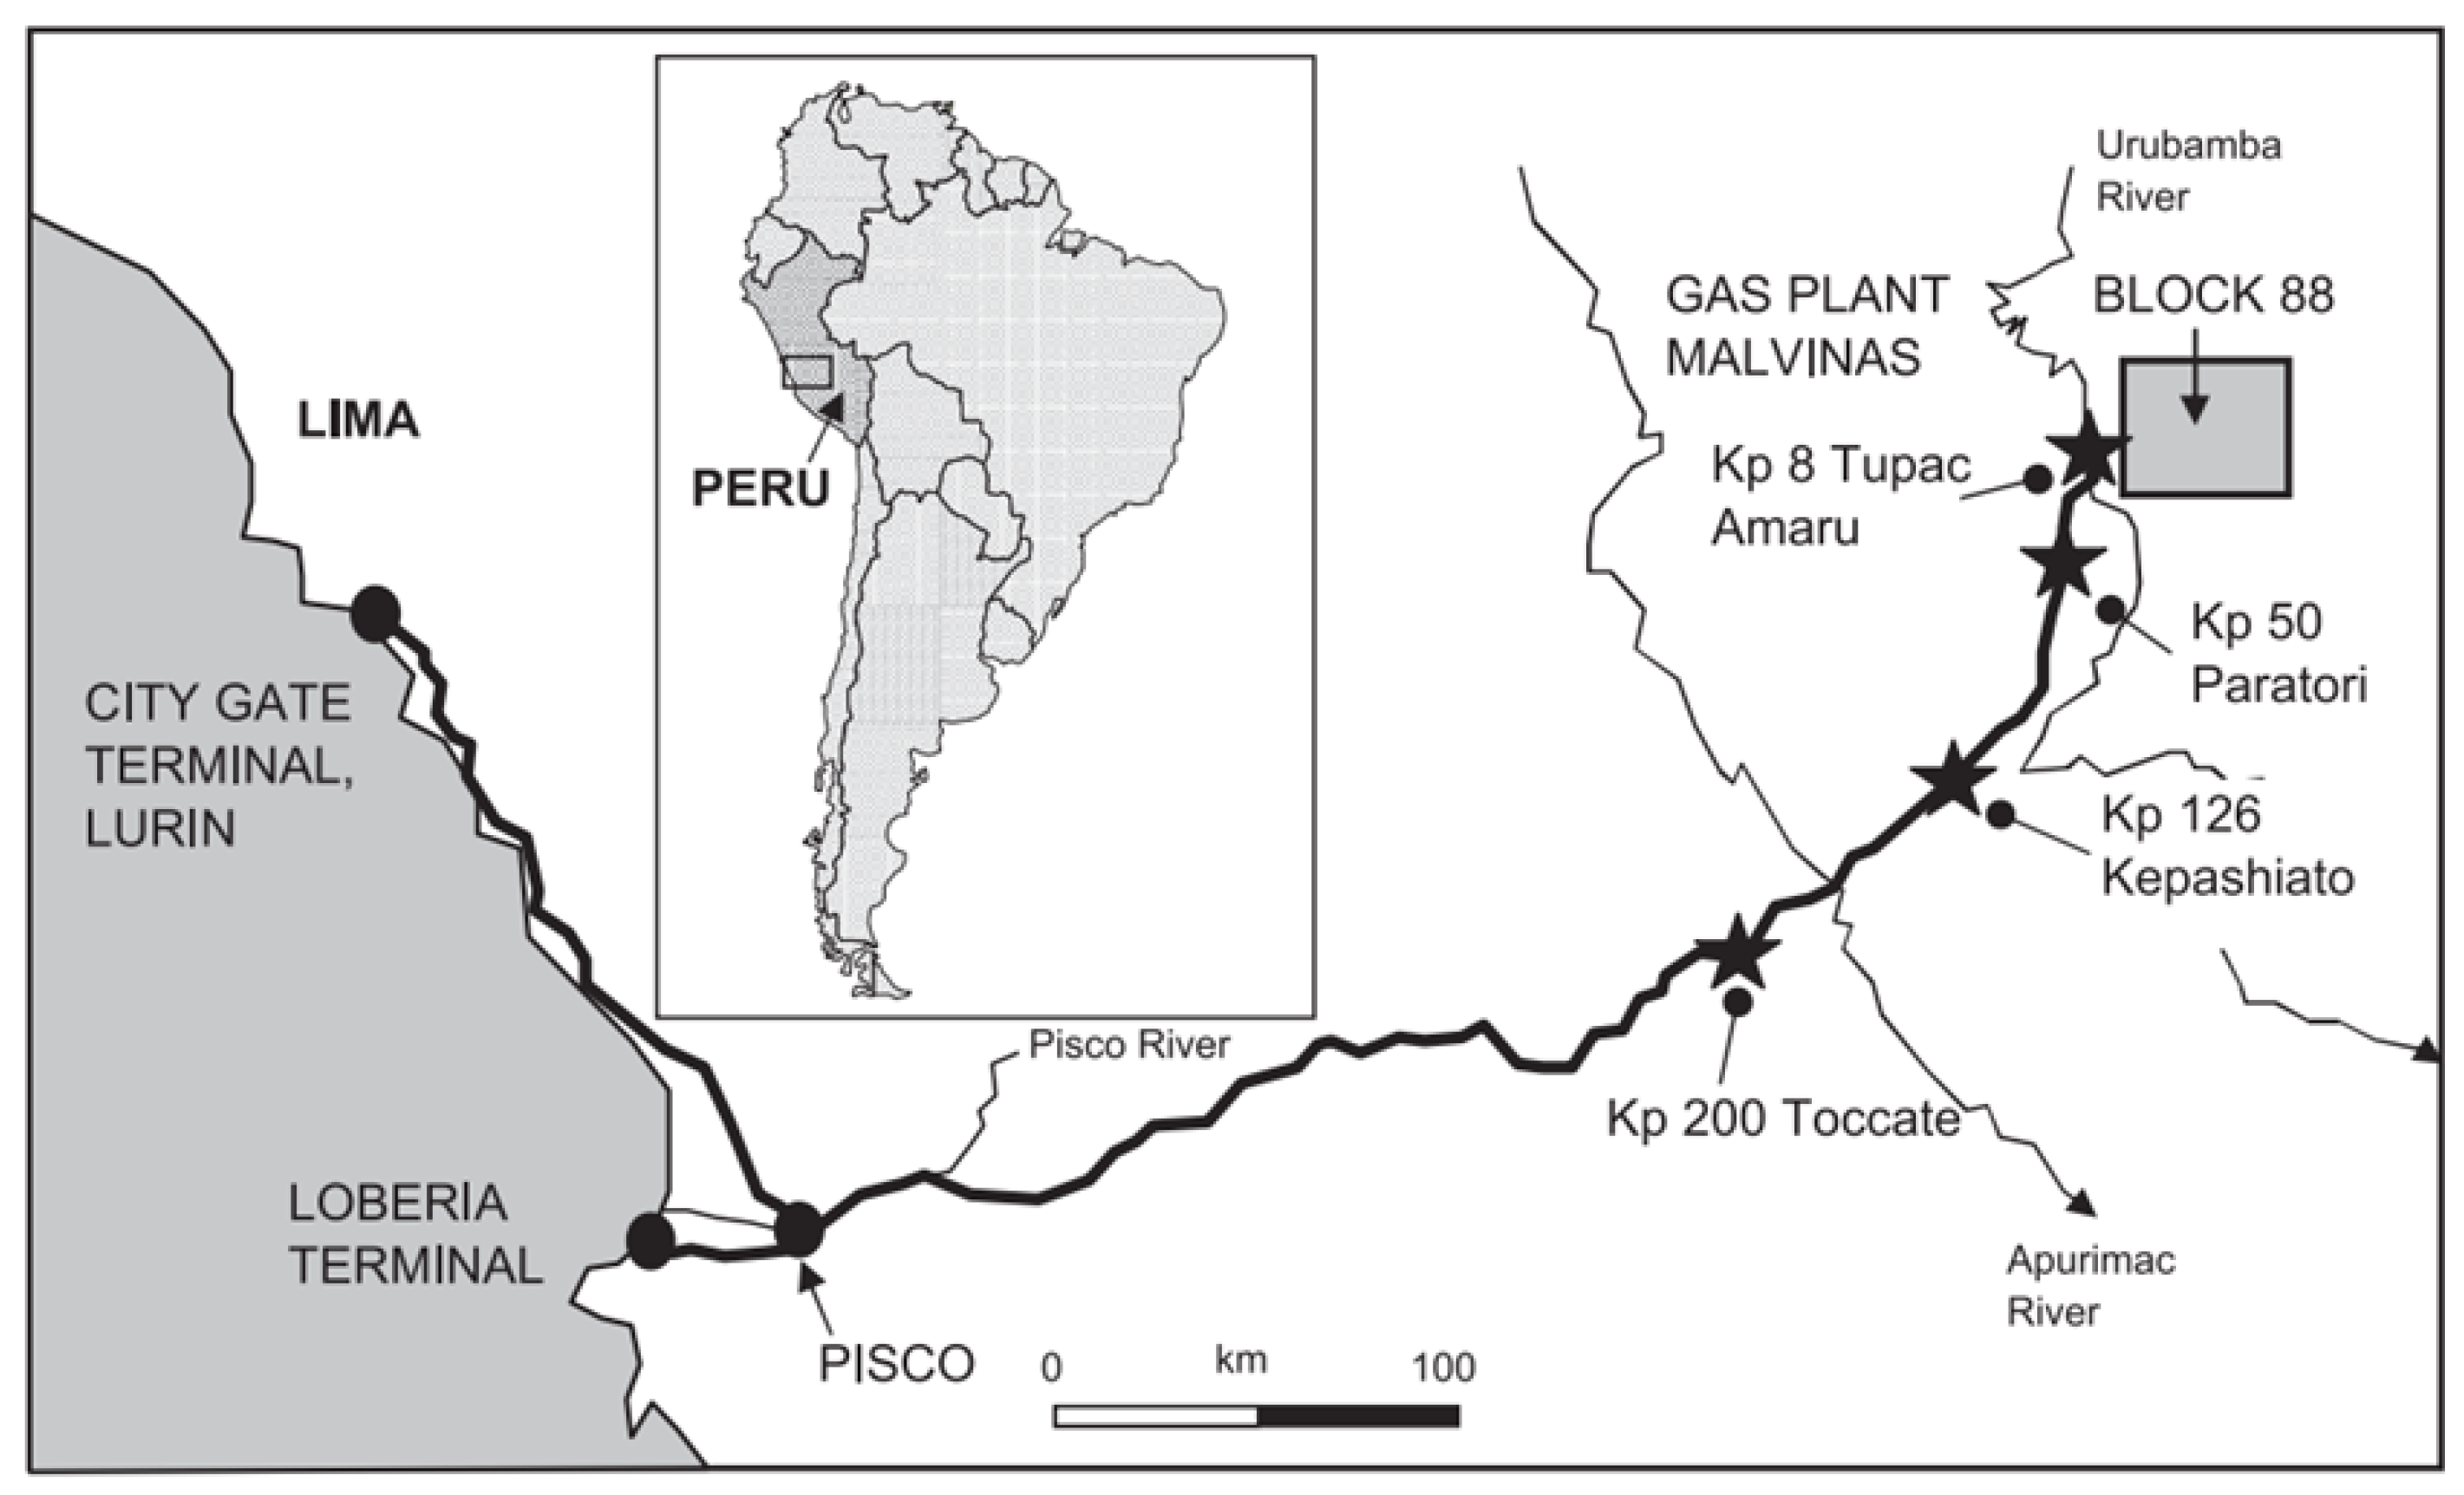
2.4. Relevant Information about the Energy Sector in Peru

A sustainable energy system entails a diversified energy matrix with a focus on energy efficiency and renewable energies. Regarding the electricity sub-sector, various projects are highlighted within the approvals of Environmental Management Instruments (IGA by its initials in Spanish). These projects include hydroelectric power plants, photovoltaic power plants, and distribution systems using photovoltaic technologies or wind power. Among them, significant projects are the Duna and Huambos wind farms in Cajamarca, the Callao Biomass Plant in Lima, the Manta Hydroelectric Plant in Ancash, and the San Gabán III Hydroelectric Plant in Puno. Additionally, the operation of the Aguaytía-Pucallpa transmission line in Ucayali is mentioned, which is part of a larger project involving developments in Huánuco, Áncash, Cerro de Pasco, Junín, Huancavelica, and Puno [36] These efforts have promoted the advancement in the use of clean energies and technologies with reduced emissions, thus contributing to avoiding environmental degradation of resources. Between 2017 and 2022, investments allocated to these projects reached USD 1,287,500,000, representing 86.7% of the investments committed during this period [37]. Regarding the hydrocarbon subsector, the objective is to discover, increase reserves, and produce hydrocarbons. By the end of 2020, the investment executed for these activities reached USD 245.65 million. As for the total investment carried out in the hydrocarbons sector during 2020, it reached the sum of USD 1515 million. This amount was allocated to a variety of operations, spanning from exploration and exploitation to processing, distribution, storage, and refining of fuels throughout the country [37].
Peru is home to Camisea, the country’s largest gas field and one of the most significant in Latin America. This project exemplifies a remarkable achievement in engineering, logistics development, and infrastructure, all within an environment characterized by high social and environmental sensitivity, located in the heart of the Amazon region in Cuzco. The operation carried out in this area resembles an “offshore in land” modality, which involves conducting operations on land similar to offshore production. This is achieved through logistics that include air and river transportation without the need for road construction. This gas field is located in Block 88 and Block 56 (see Figure 8), which produce natural gas and condensate [38].
Among the plans to be developed in Peru’s energy policy is the massification of natural gas, incentives for converting vehicles engines to use natural gas as a fuel (GNV by its initials in Spanish), residential gas service, and promoting the safe and efficient use of liquefied petroleum gas (LPG). According to the National Energy Balance for the year 2019, the total energy demand amounted to 921.8 petajoules (PJ). In this context, the transportation sector stood out, representing 41% of the demand, followed by the industry and mining sector with 27.2%, and the residential sector with 17.5%. Various measures can be identified in these sectors to reduce energy consumption, which would, in turn, contribute to reducing greenhouse gas emissions. It is worth noting that the land transportation mode is the main contributor to the highest energy consumption within the transportation sector, with participation of 83.1% [37].
The energy policy of Peru is primarily based on having a diversified energy matrix, emphasizing renewable sources and energy efficiency, competitive energy supply, as well as universal access to energy supply, efficient production chains, and efficient use of energy. It aims to contribute to low carbon emissions, leading to minimal environmental impact, thereby promoting sustainable development. Additionally, it aims to continue diversifying the efficient use of natural gas [37].

3. Methodology

Long-range Energy Alternatives Planning (LEAP) is a software developed by the Stockholm Environment Institute (SEI); it is used as a comprehensive tool for conducting energy policy analysis. It is widely used in planning and evaluating energy policies, as well as in assessing climate change and cost analysis during a specific period. This process involves creating alternative scenarios, each with its own distinctive information. These combined features enable the development of an analysis of energy demand based on demographic and macroeconomic data from the study area [40]. According to the calculation of the demand analysis, the total energy consumption is defined by Equation (1)
E C n = i j A L n , j , i E I n , j , i
where EC represents the total energy consumed in a specific sector; AL represents the activity level of the specified sector; for instance, in the case of the residential sector, this variable would be the growth percentage in millions of households, or in the case of the transportation sector, it would be the number of kilometers per passenger; while EI represents the final energy intensity per year for each activity level, n is the type of fuel, and finally, i and j are the sector and the device, respectively [41].

3.1. Structure of the LEAP Model in Peru

The LEAP software was used to analyze electricity generation and energy demand in Peru during the study period 2020–2050. The historical information considered starts from 2017 to 2022, where the base year is 2020, although this study is based on others conducted such as (a) the analysis of Pakistan [42], (b) the case of cities in China [43] and (c) the assessment of the energy sector in Ecuador [44]. It is very different for the study country (Peru), and since alternative scenarios are being considered, they are completely different from the base scenario. The Business-as-Usual scenario (S1) follows the trend of energy consumption, considering Peru’s trend of gradually incorporating renewable energies such as solar and wind. This proposal for a slight transition is due to the existence of hydrocarbon basins currently in development and oil and natural gas extraction. On the other hand, the Energy Efficiency scenario (S2) aims to focus on energy efficiency in transmission and distribution while also developing renewable energies, mainly solar and wind. The importance of implementing more sources of energy is not only to increase the installed capacity but also to improve the electric system (SEIN) and/or use energy storage methods, topics which are not part of this study. However, taking this improvement into account, a slight reduction of the peak load was considered, with a rough estimation of a 15–20% reduction by 2050. Finally, the Geothermal Energy scenario (S3) does not consider energy efficiency, which means the peak load is the same as the first scenario (S1) but does focus on the use of geothermal energy, followed by solar and wind energy.

3.2. Base Values and Assumptions for the Peruvian LEAP Model

The demand for each scenario varies according to its requirements; however, in the starting year, 2020, all three scenarios have the same values because they serve as the starting point for the development of each scenario (see Table 1).

3.3. Description of the Scenario Design

The LEAP model for projecting future energy demand scenarios does not have a defined criterion or theory for the optimal number of scenarios for the model to be useful. Therefore, each developed scenario aims to have the systems of electricity generation somewhat related to establish certain criteria and combinations from which to start [40].
Therefore, in the present research, it has been decided to analyze three scenarios related to electrical demand.

3.3.1. S1: Business-as-Usual

This scenario is based on the behavior of the Peruvian electrical sector considering projections and estimates from the Ministry of Energy and Mines, where it is expected that the national economy will grow between 4.5% and 6.5% until 2025 [45]. Additionally, no significant energy policy measures would be implemented. Although the same growth trend of solar and wind technologies is considered, there would be no consideration for new equipment with higher energy efficiency.

3.3.2. S2: Energy Efficiency

The energy efficiency scenario primarily involves the implementation of modern technologies to reduce losses and increase energy efficiency, with projects like the Wayra Extensión [46] wind project in Ica and the Clemesí [47] solar project in Moquegua serving as examples. Furthermore, there are plans to implement a solar laboratory in the Junín department to study three new photovoltaic technologies in Peru, with the goal of assessing the performance of solar panels in extreme geographic conditions [48]. The improvements considered in this scenario are related to electricity generation from photovoltaic sources and wind turbines. This increase in energy efficiency will be reflected in the reduction of losses in transmission and distribution, as improvements are planned in conjunction with the National Interconnected Electric System (SEIN).

3.3.3. S3: Geothermal Energy

The geothermal energy scenario is based on the geothermal potential that Peru possesses. It is estimated that utilizing the entire geothermal potential could satisfy 50% of Peru’s total energy demand [49]. Additionally, geothermal energy could have various applications, including the development of geothermal and green hydrogen. This is because green hydrogen can be obtained not only through electrolysis powered by wind and solar energy but also from geothermal energy. An example of this is the work being undertaken by the Meager Creek Development Corp, a Canadian company adopting a novel approach by harnessing Earth’s energy for green hydrogen production [50,51].

4. Results and Discussions

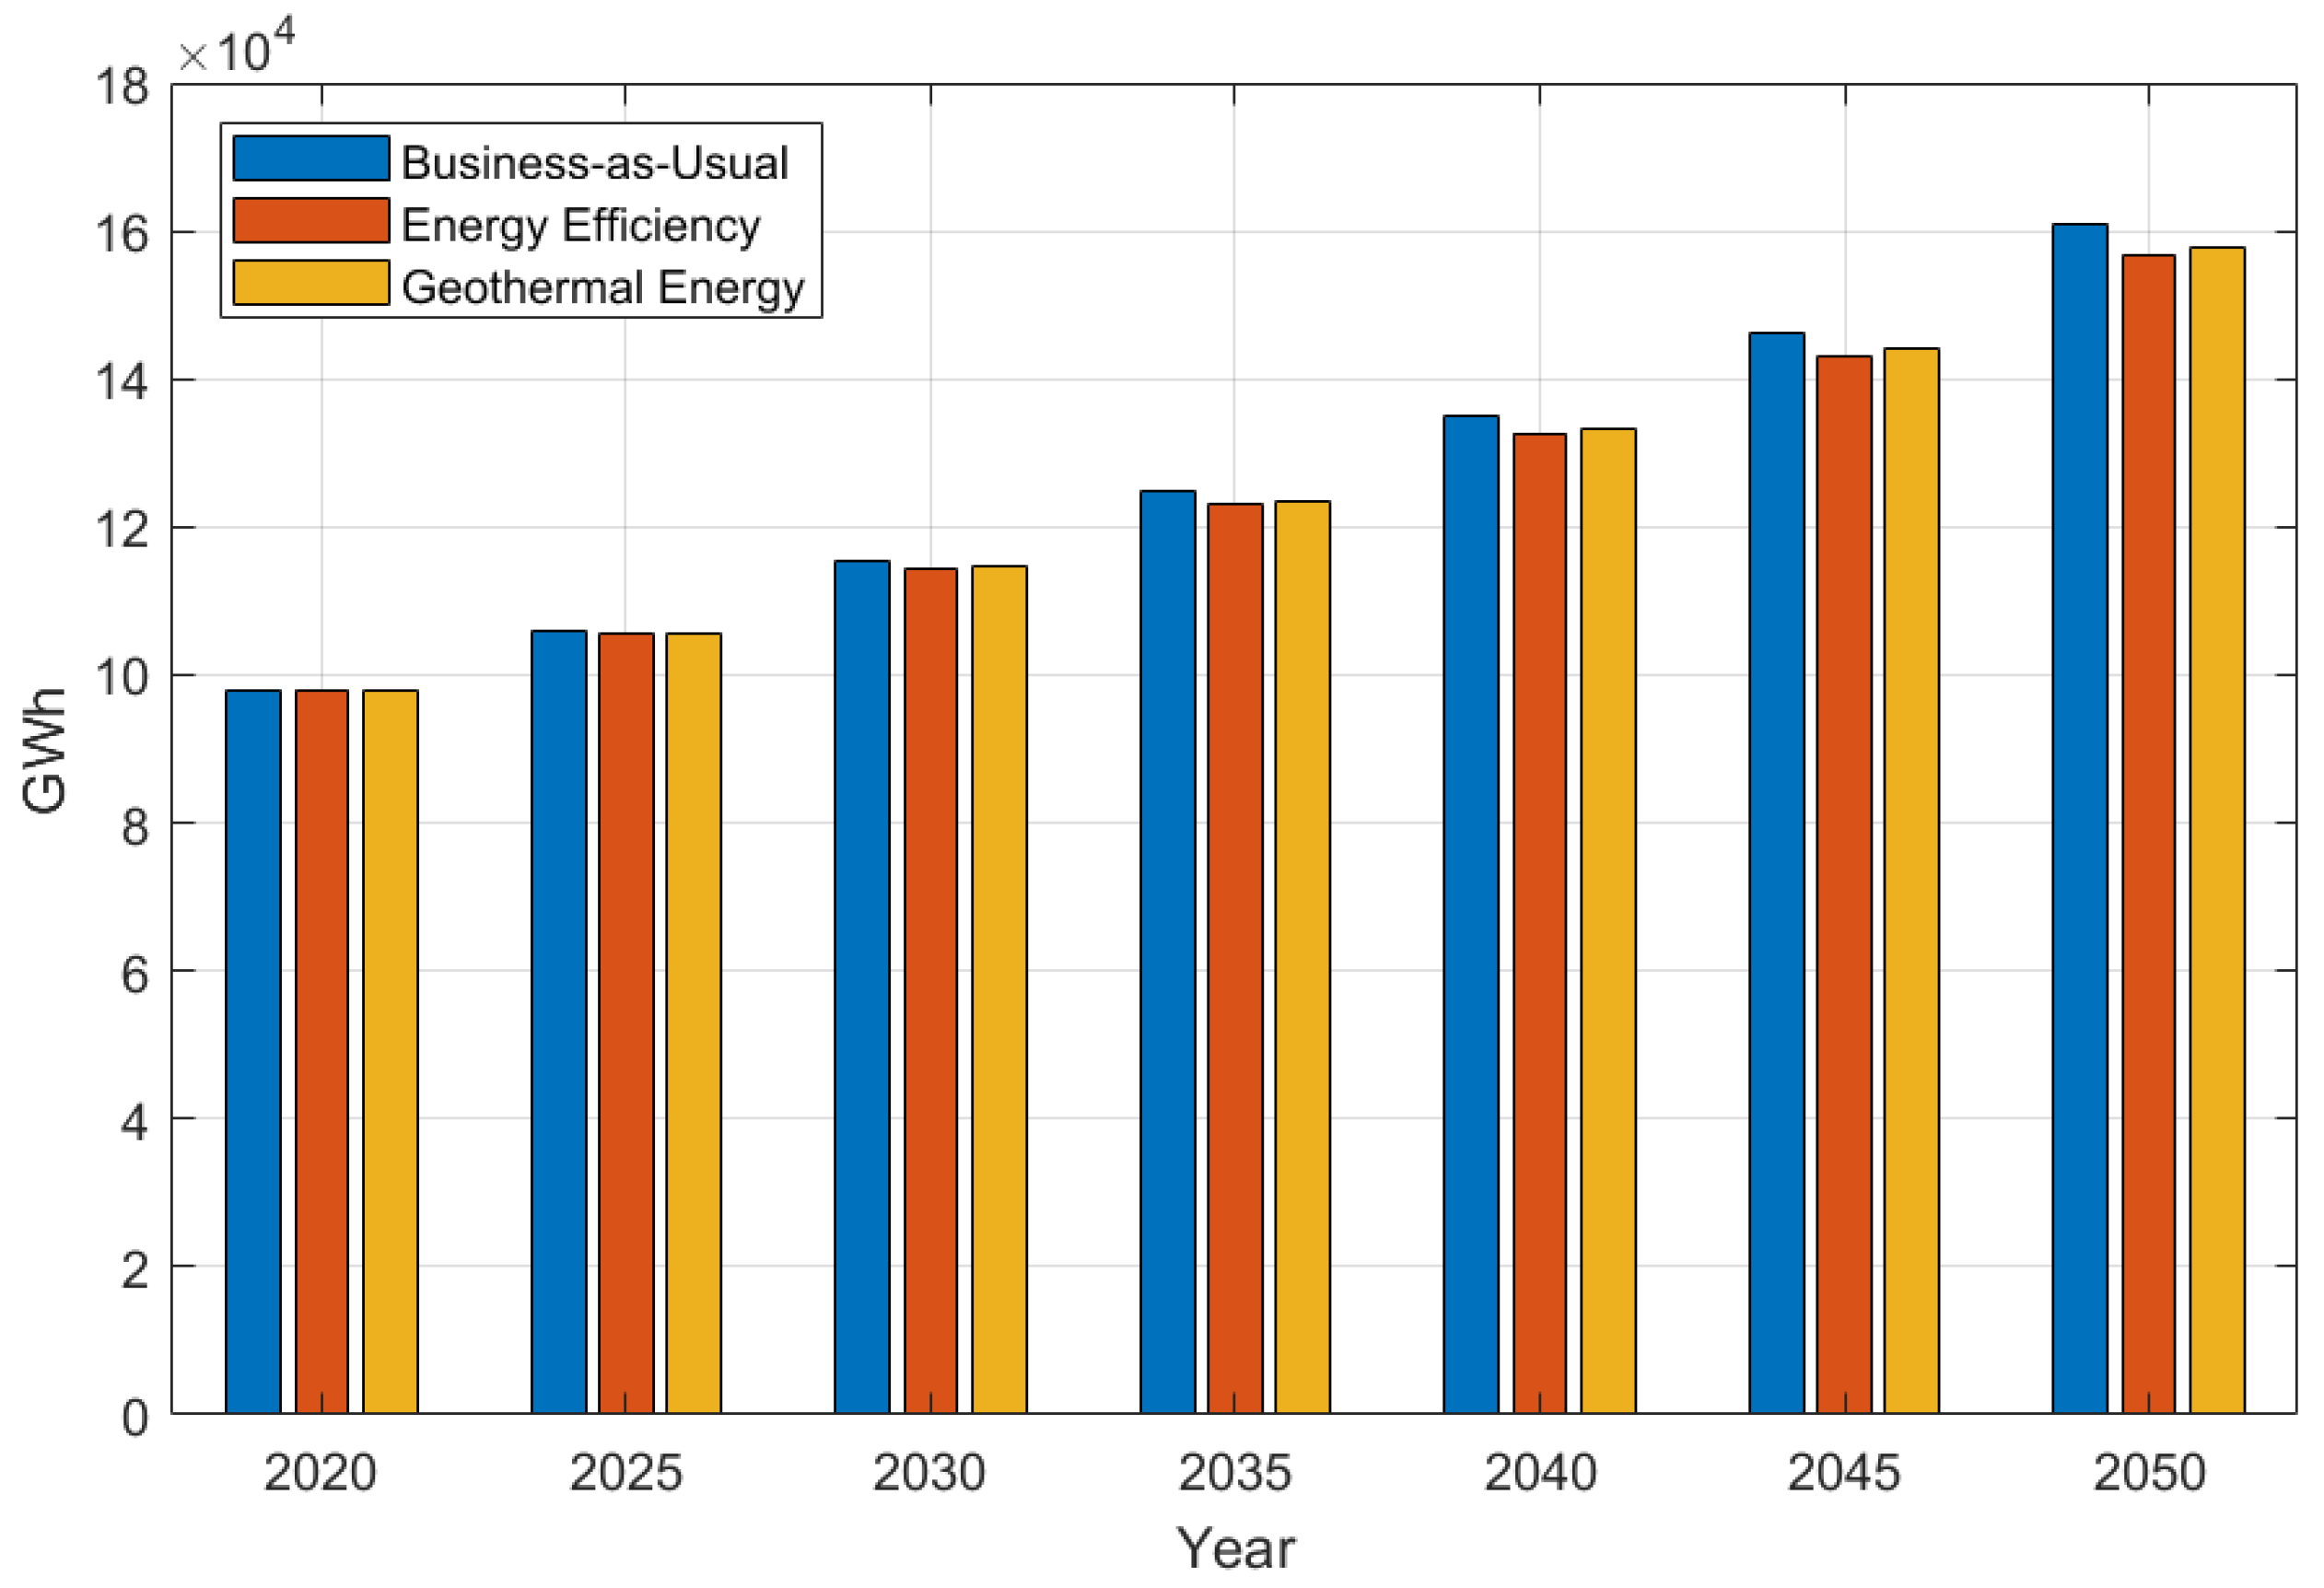
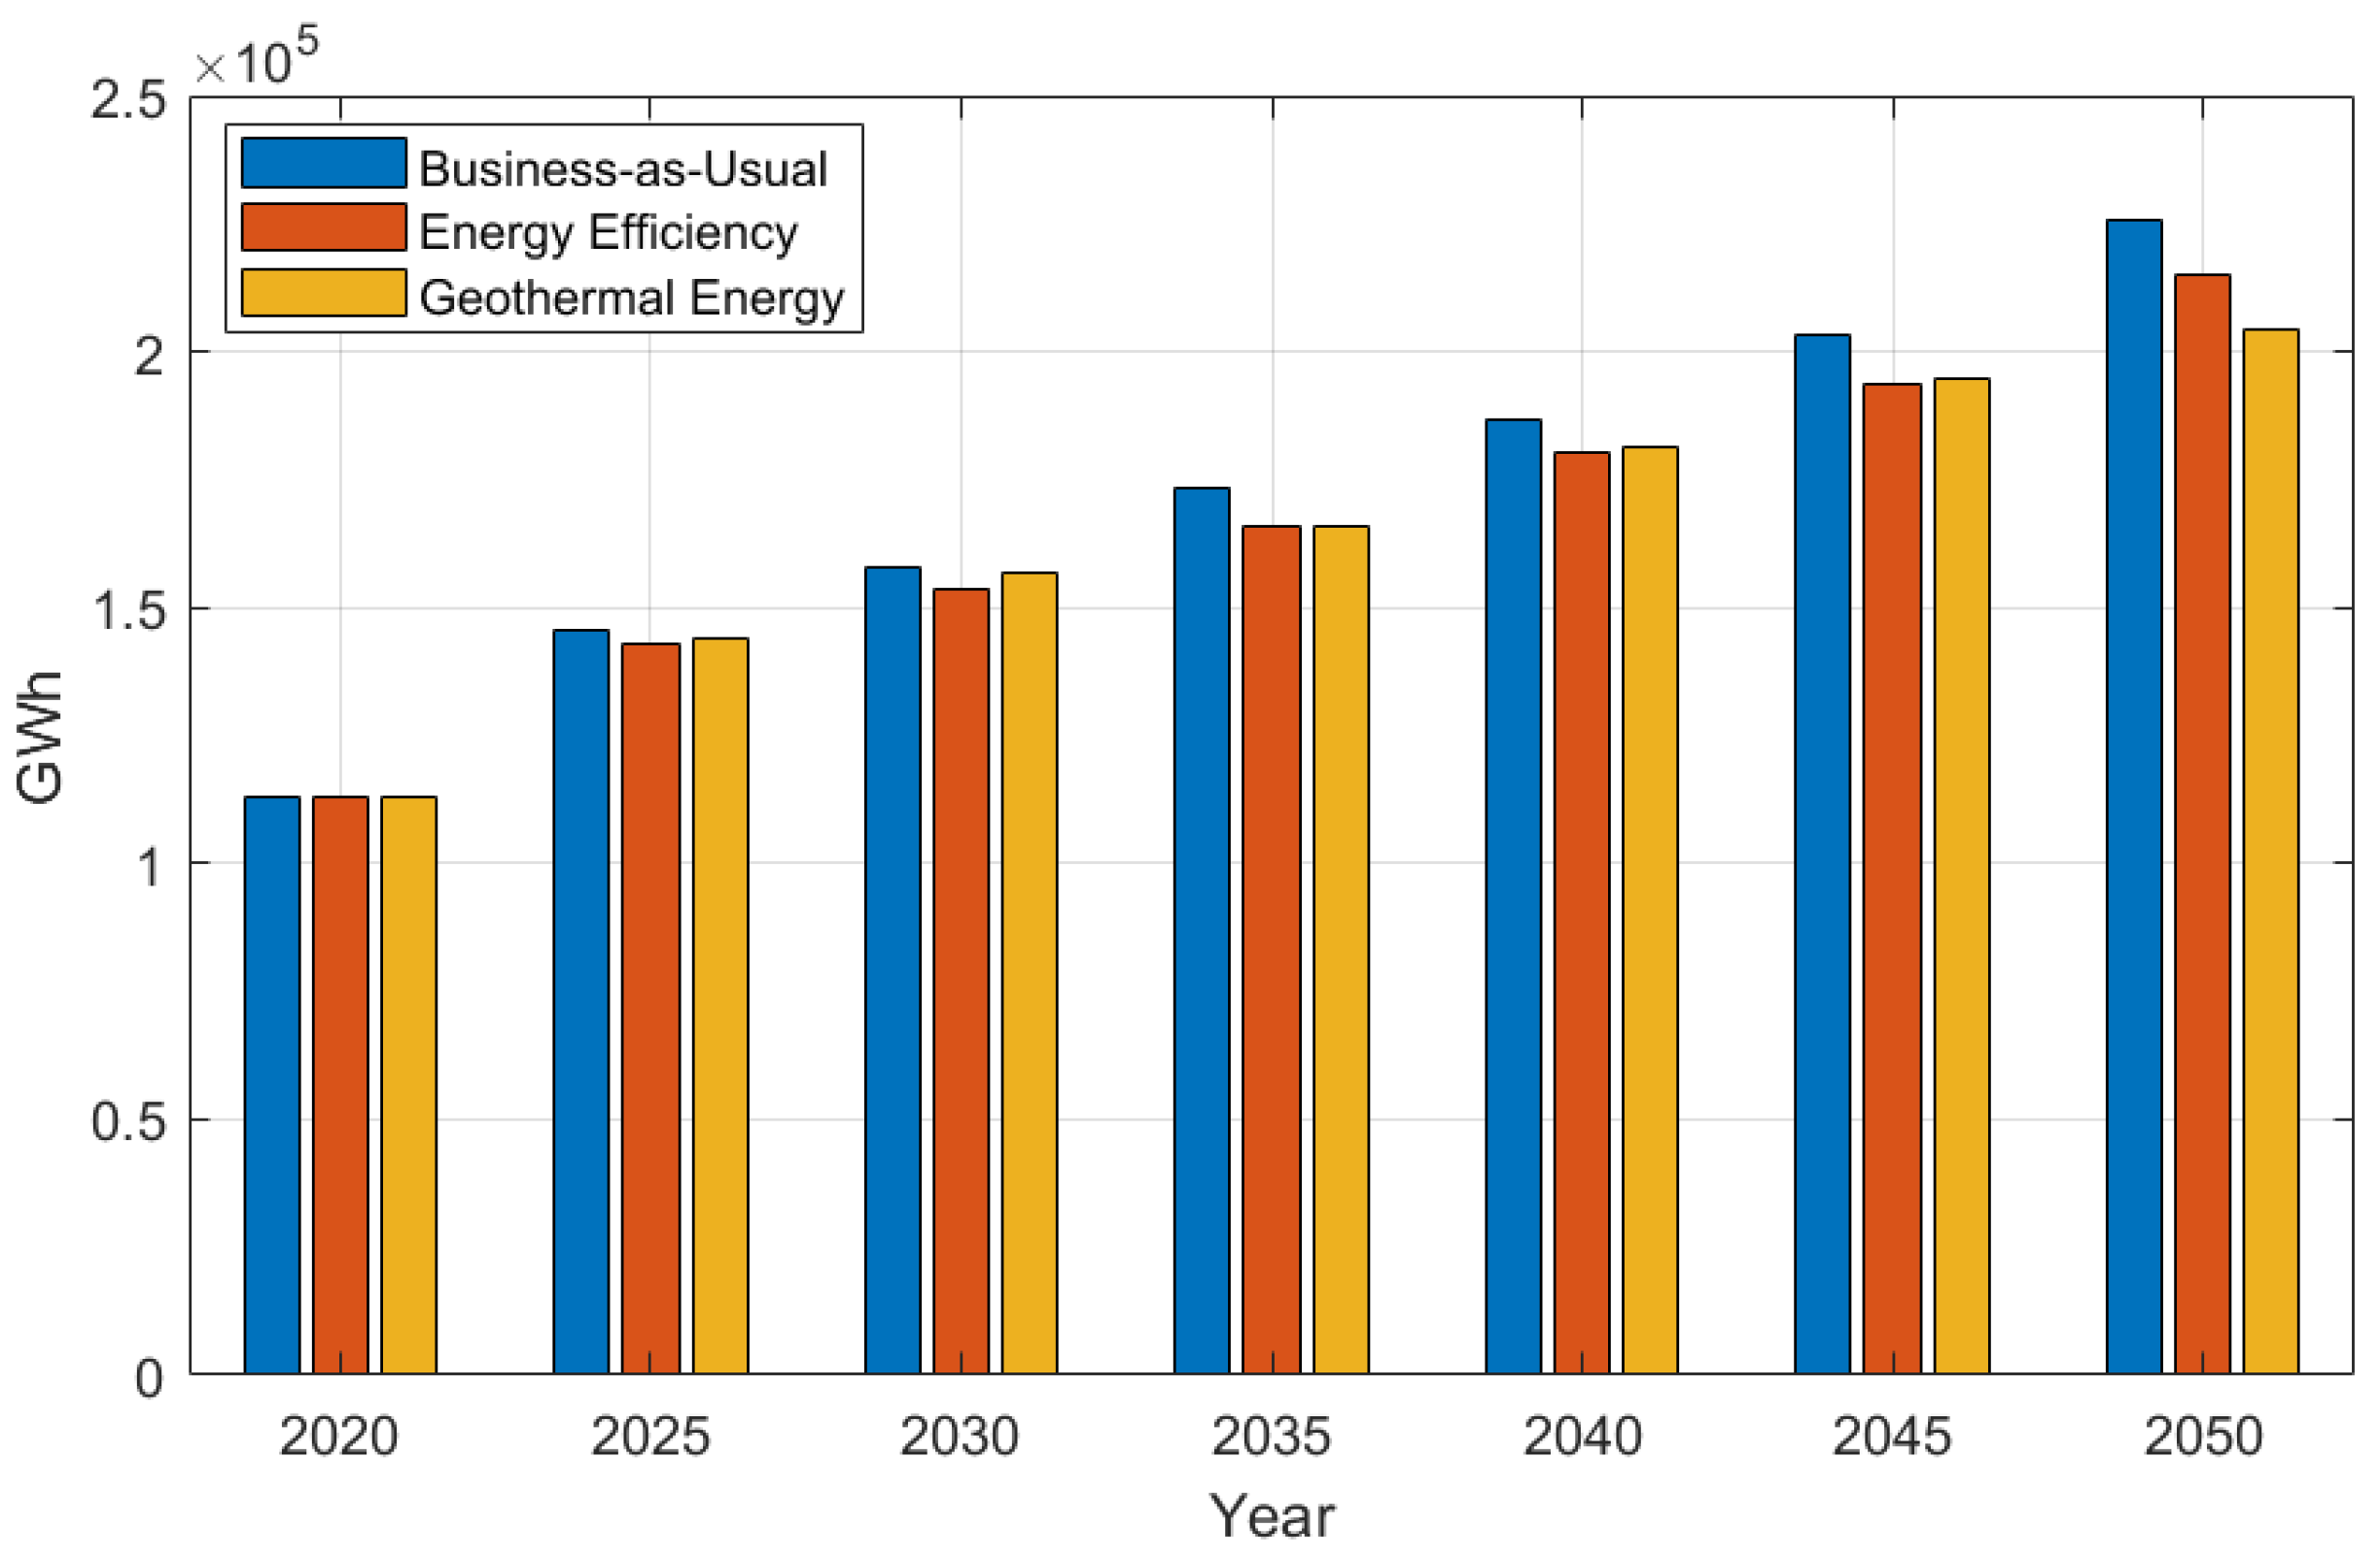
4.1. Projection of the Total Demand for Electrical Energy

When defining net electricity demand, one must first consider gross electricity demand, from which self-consumption energy and losses in transmission and distribution are subtracted. It is worth noting that the analysis conducted by the LEAP software includes energy expenditure from fossil fuels, which is why there is a higher electrical demand in the results. This is because the software models the production of fossil fuels and their use as electrical energy. At the same time, Peru’s historical electrical demand considers thermal, hydraulic, solar, and wind energy sources. Thus, only a small portion of fossil fuels would be used for electricity generation in thermal power plants. Additionally, it is important to highlight that due to informality and areas with limited coverage, different types of resources are used to generate their own energy sources, and these data are not recorded. On the other hand, regarding the results obtained in the simulations, it is observed that, at the beginning of the analysis, in the year 2020, there is an electrical demand of 97,969 GWh in the three scenarios, S1, S2, and S3, because, as understood, the energy demand is the same for all three scenarios. For the year 2050, it is found that the electrical demand in scenarios S1, S2, and S3 is 160,921 GWh, 156,839 GWh, and 157,867 GWh, respectively, in the mentioned order, corresponding to an increase of 64.2%, 60.0%, and 61.1%, respectively, considering year 2020 as the base (see Figure 9).
According to the figure shown, information from the Business-as-Usual scenario is represented in blue, the Energy Efficiency scenario in green, and the Geothermal Energy scenario in orange. It is observed that contrary to expectations, energy demand would not decrease with the implementation of renewable energies, and for our case study, with greater implementation of geothermal energy, but rather with efficient investment in energy efficiency. Investment in energy efficiency would lead to a reduction in losses in transmission and distribution. On the other hand, implementing new renewable energy technologies without considering an investment in transmission and distribution would not be ideal and could even lead to higher energy demand.

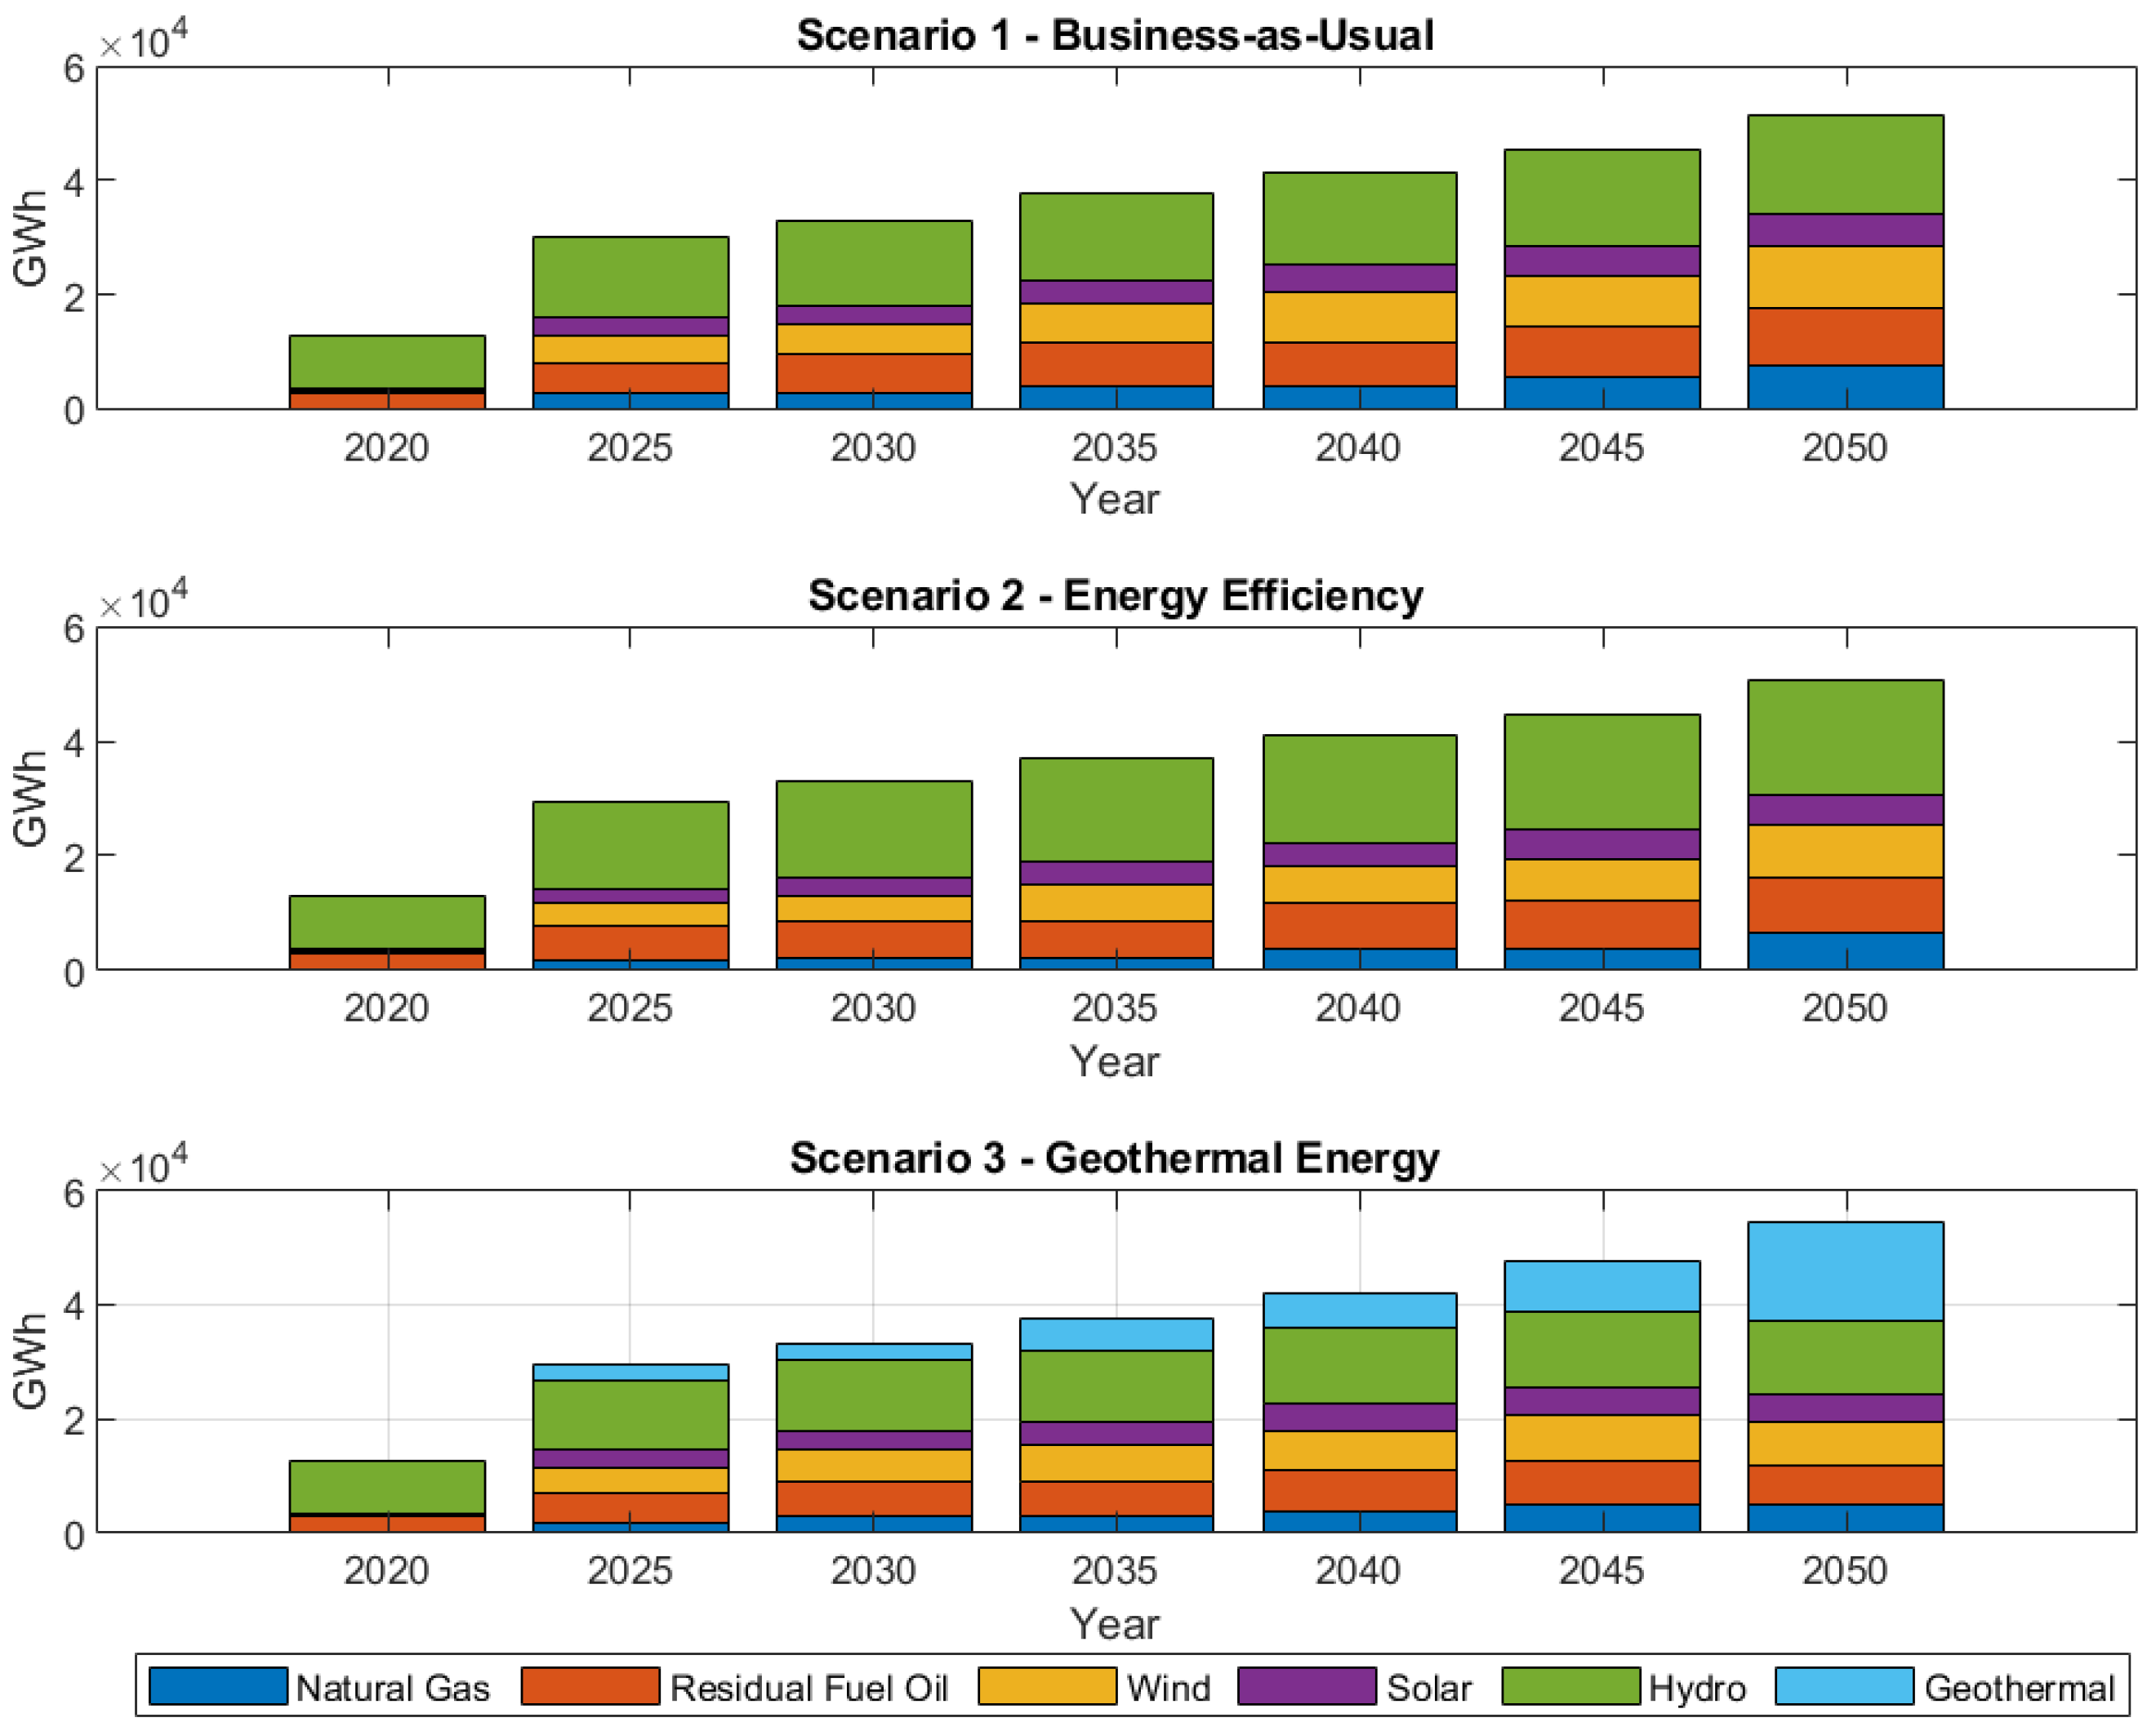
4.2. Projection of Installed Capacity for Demand

The Business-as-Usual scenario requires a higher proportion of installed capacity because it does not consider equipment improvements, resulting in no increase in efficiency (see Figure 10). Concurrently, in the Energy Efficiency scenario, there is a lower requirement for installed capacity compared to scenario Business-as-Usual and scenario Geothermal Energy, except for the last years, from 2045 to 2050, in which the Geothermal Energy scenario has a lower requirement for installed capacity than Business-as-Usual scenario and Energy Efficiency scenario. This is mainly because geothermal energy does not require large spaces, and with the same installed capacity, more energy can be generated [52].
It can be observed that for a long-term projection (year 2050), considering geothermal energy would indeed be a good option. This is because, at this stage, the growth of installed capacity in scenarios S1, S2, and S3 is 11.2%, 10.9%, and 5.0%, respectively, compared to the year 2045. This is quite promising, considering that the energy demand will be almost the same by the year 2050. This is closely related to the type of electricity produced. The contribution of geothermal energy in scenario S3 will have long-term repercussions because it is still a developing energy source. At the same time, the implementation of more efficient technology for electricity production in scenario S2 has effects from the first year of evaluation, in 2025.
It is clearly observed in Figure 11 that the Business-as-Usual and Energy Efficiency scenarios utilize the same energy sources, with the difference lying in production. This is because the Energy Efficiency scenario is more efficient. On the other hand, in the Geothermal Energy scenario, geothermal energy predominates. Although it requires higher consumption, this is because energy efficiency is not being considered. Now, considering that geothermal potential in Peru currently accounts for 50% of the electrical demand and electrical demand increases over time, it should be considered that depleted wells in the northern jungle region of the country could be useful for dual-play considerations and to increase the recovery factor. Additionally, direct utilization of geothermal energy from the area could be beneficial [53].

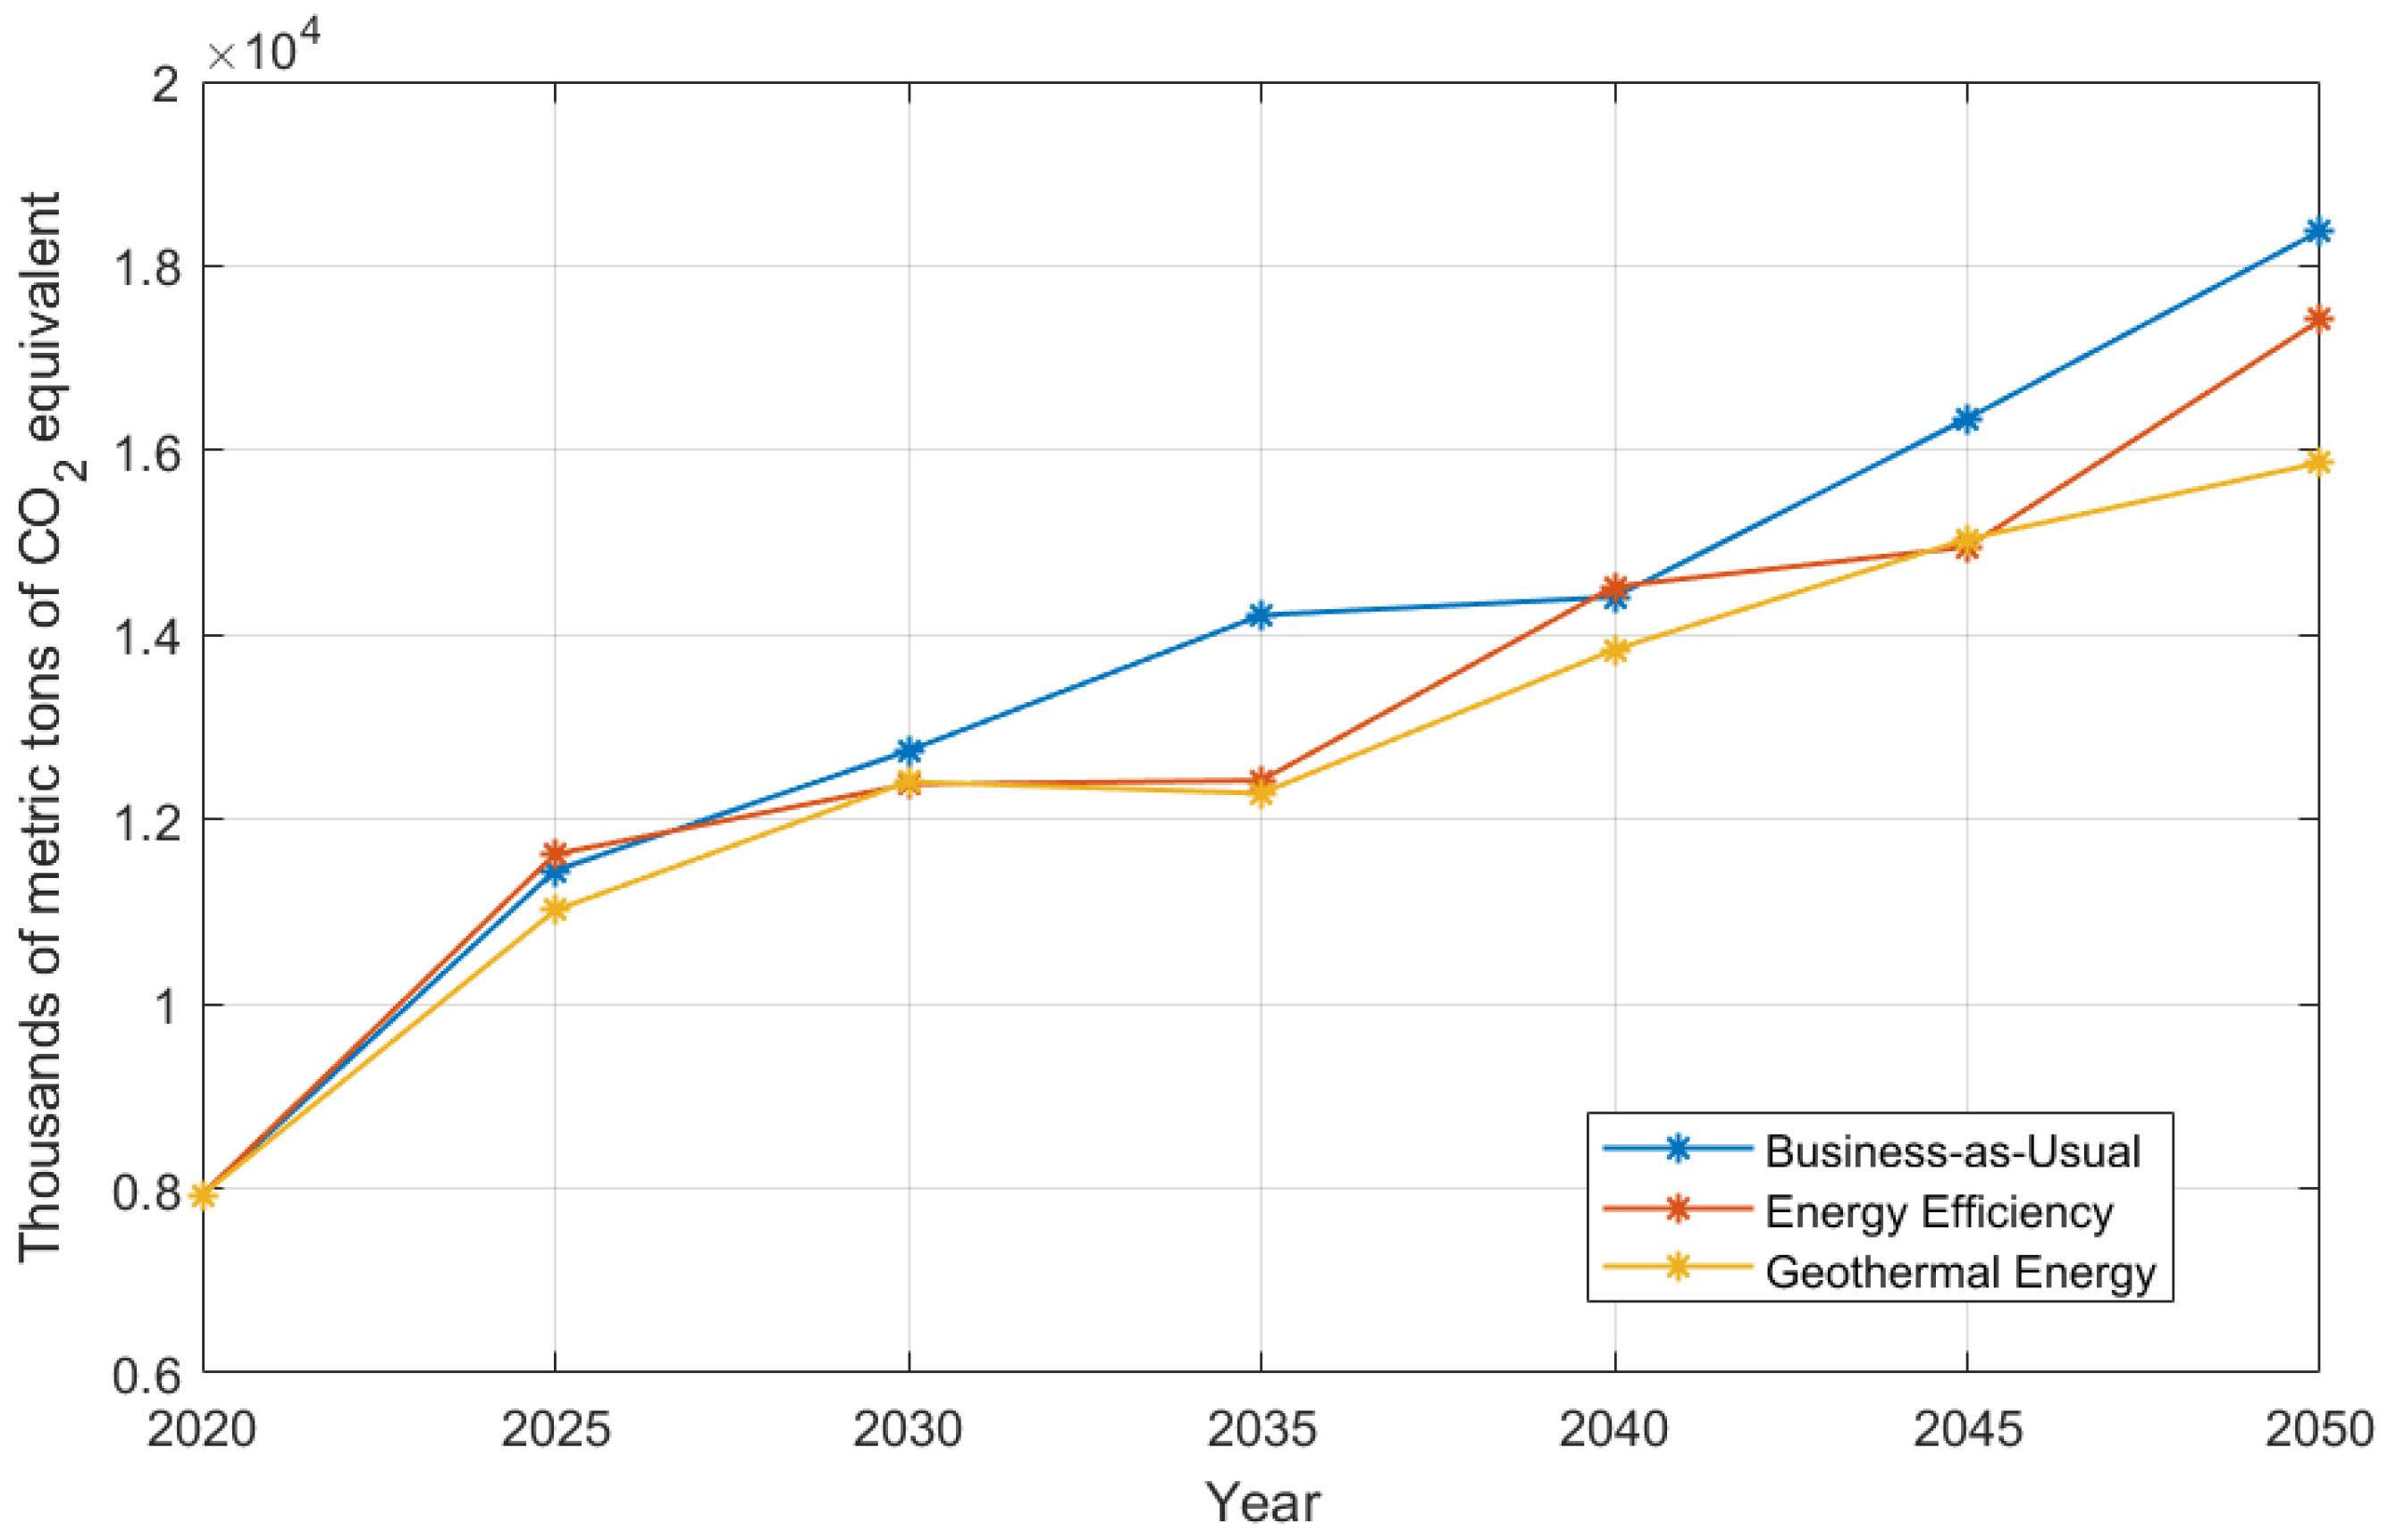
4.3. Projection of Carbon Dioxide Equivalent Emissions CO2e

An important factor for energy planning is carbon dioxide equivalent (CO2e) emissions. The three scenarios were analyzed (see Figure 12). Scenario S2 produced fewer emissions compared to S1 due to the actions taken and the emphasis on energy efficiency. However, it is observed that in the last segment of the analysis, from 2045 to 2050, scenario S3 reflects the lowest emissions.
Now, in general terms, wind energy produces an average of 11 gCO2e/kWh, photovoltaic energy produces an average of 45 gCO2e/kWh, while geothermal energy produces an average of 38 gCO2e/kWh. However, the advantage lies in the use of natural gas, which produces an average of 490 gCO2e/kWh, and fossil fuels used in industrial plants, produce an average of 820 gCO2e/kWh [54]. The importance of these data lies in the fact that by modeling scenario S3, the focus would be on using geothermal energy in households and industry. The distribution carried out by the software resulted in less use of natural gas and fossil fuels. This variation can be observed in Figure 10. The factor considered as fuel in Process Heat in industries is fossil fuels, and due to its greater reduction, the calculation has varied in such a way in the last years that geothermal energy is implemented to a greater extent.

5. Conclusions

  • The study analyzes the energy demand, installed capacity, and emissions (CO2e) of the electric mix in Peru through three scenarios defined as the Business-as-Usual scenario, denoted as S1, the Energy Efficiency scenario, denoted as S2, and the Geothermal Energy scenario, denoted as S3. This result shows a very similar total production of energy expressed in GWh, even considering that for S3, the installed capacity is significantly lower than the others. As shown, right after the year 2045, S3 is projected to start showing good results.
  • Scenario S2, developed considering energy efficiency, builds upon scenario S1 but includes investment in technology and reduction of transformation and distribution losses. To represent this, the peak load has been reduced to reflect this efficiency over the years. The details of this consideration are not expressed extensively because they are not within the scope of this article. However, the improvement of the SEIN and/or the application of energy storage methods could be considered at this stage.
  • The results of scenario S2 reveal that the country would experience lower energy demand over time, highlighting its efficiency compared to scenario S3. The latter proposed the implementation of geothermal energy as the main strategy without specifically considering energy efficiency. Scenario S2 stands out by focusing on technological improvements and energy efficiency, resulting in an optimization of energy consumption over time. In contrast, scenario S3, by focusing on the introduction of geothermal energy as the main innovation, could face challenges in terms of the overall efficiency of the system.
  • Under a more detailed evaluation, it is observed that scenario S3, despite expectations, presented long-term results that are lower in terms of installed capacity. This result becomes evident when analyzing the last 5 years (2045–2050), a period in which scenario S3 demonstrated requiring a lower amount of energy compared to scenarios S1 and S2. Additionally, scenario S3 reflects not only superior energy efficiency but also a substantial reduction in greenhouse gas emissions during the same period of 2045–2050, compared to scenarios S1 and S2.
  • Finally, the exclusion of energy efficiency considerations in the evaluation of scenario S3 aims to analyze its advantages and disadvantages impartially. Although scenario S2 highlights improvements by focusing on technological investments and energy efficiency without incorporating new energy sources, the idea is raised that optimal implementation could arise from combining both strategies. Furthermore, the inclusion of geothermal energy as a new energy source is presented as a viable option that can complement and enhance improvements derived from energy efficiency technologies.
  • These results underscore the importance of considering not only new energy sources, such as geothermal but also strategies that improve energy efficiency at all levels of the system.

Author Contributions

Conceptualization D.G.D.l.C.T.; methodology, D.G.D.l.C.T.; software, D.G.D.l.C.T.; formal analysis, D.G.D.l.C.T.; investigation, D.G.D.l.C.T.; resources, D.G.D.l.C.T.; writing—original draft preparation, D.G.D.l.C.T.; writing—review and editing, D.B. and L.F.M.; supervision, D.B. and L.F.M.; project administration, L.F.M. and R.R.P.-E. All authors have read and agreed to the published version of the manuscript.

Funding

This research received no external funding.

Institutional Review Board Statement

Not applicable.

Informed Consent Statement

Not applicable.

Data Availability Statement

No new data were created or analyzed in this study. Data sharing is not applicable to this article.

Conflicts of Interest

The authors declare no conflict of interest.

References

  1. United Nations. What Is Climate Change? Available online: https://www.un.org/en/climatechange/what-is-climate-change (accessed on 30 January 2024).
  2. United Nations. Your Guide to Climate Action: Home Energy. Available online: https://www.un.org/en/actnow/home-energy (accessed on 30 January 2024).
  3. International Energy Agency. Electricity Market Report Update: Outlook for 2023 and 2024; IEA: Paris, France, 2023. [Google Scholar]
  4. British Petroleum. bp Energy Outlook 2023 Edition. 2023. Available online: https://www.bp.com/content/dam/bp/business-sites/en/global/corporate/pdfs/energy-economics/energy-outlook/bp-energy-outlook-2023.pdf (accessed on 25 May 2024).
  5. Streimikiene, D.; Simanaviciene, Z.; Kovaliov, R. Corporate social responsibility for implementation of sustainable energy development in Baltic States. Renew. Sustain. Energy Rev. 2009, 13, 813–824. [Google Scholar] [CrossRef]
  6. Yoo, S.-H.; Kwak, S.-Y. Electricity consumption and economic growth in seven South American countries. Energy Policy 2010, 38, 181–188. [Google Scholar] [CrossRef]
  7. Kale, R.V.; Pohekar, S.D. Electricity demand and supply scenarios for Maharashtra (India) for 2030: An application of long range energy alternatives planning. Energy Policy 2014, 72, 1–13. [Google Scholar] [CrossRef]
  8. McPherson, M.; Karney, B. Long-term scenario alternatives and their implications: LEAP model application of Panama’s electricity sector. Energy Policy 2014, 68, 146–157. [Google Scholar] [CrossRef]
  9. Perwez, U.; Sohail, A.; Hassan, S.F.; Zia, U. The long-term forecast of Pakistan’s electricity supply and demand: An application of long range energy alternatives planning. Energy 2015, 93, 2423–2435. [Google Scholar] [CrossRef]
  10. Vidoza, J.A.; Gallo, W.L. Projection of fossil fuels consumption in the Venezuelan electricity generation industry. Energy 2016, 104, 237–249. [Google Scholar] [CrossRef]
  11. Bautista, S. A sustainable scenario for Venezuelan power generation sector in 2050 and its costs. Energy Policy 2012, 44, 331–340. [Google Scholar] [CrossRef]
  12. Pirker, G.; Wimmer, A. Sustainable power generation with large gas engines. Energy Convers. Manag. 2017, 149, 1048–1065. [Google Scholar] [CrossRef]
  13. Vandewalle, J.; Bruninx, K.; D’haeseleer, W. Effects of large-scale power to gas conversion on the power, gas and carbon sectors and their interactions. Energy Convers. Manag. 2015, 94, 28–39. [Google Scholar] [CrossRef]
  14. United Nations. Paris Agreement. 2015. Available online: https://unfccc.int/sites/default/files/english_paris_agreement.pdf (accessed on 25 May 2024).
  15. United Nations. Kyoto Protocol to the United Nations Framework Convention on Climate Change. 1997. Available online: https://unfccc.int/kyoto_protocol (accessed on 25 May 2024).
  16. International Renewable Energy Agency. Renewable Energy Market Analysis—Latin America; IRENA: Masdar City, United Arab Emirates, 2016. [Google Scholar]
  17. CIA World Factbook. Consumption of Electricity per Capita by Country-Comparative Map of Countries-South. 2020. Available online: https://www.indexmundi.com/map/?t=0&v=81000&r=sa&l=es (accessed on 7 December 2023).
  18. Tamayo, J.; Salvador, J.; Vásquez, A.; Vilches, C. La Industria de la Electricidad en el Perú: 25 Años de Aportes al Crecimiento Económico del País; Osinergmin: Lima, Peru, 2017. [Google Scholar]
  19. Cox, W. Demographia World Urban Areas 19th Annual Edition. 2023. Available online: http://www.demographia.com/db-worldua.pdf (accessed on 7 December 2023).
  20. Instituto Nacional de Estadística e Informática. Electrificación: Acceso a los Servicios Básicos en el Perú; INEI: Lima, Peru, 2021. [Google Scholar]
  21. Perupetro S.A. Estadística Anual de Hidrocarburos; Perupetro S.A.: Lima, Peru, 2022. [Google Scholar]
  22. Ministerio de Energía y Minas. Revista Estadística “En cifras”—Electricidad. 2022. Available online: https://www.gob.pe/institucion/minem/colecciones/1486-revista-en-cifras (accessed on 1 December 2023).
  23. Revista Energía. Energías Renovables: El Futuro de la Electricidad. 2023. Available online: https://revistaenergia.pe/wp-content/uploads/2023/05/REVISTA-32-.pdf (accessed on 20 October 2023).
  24. Energia Estratégica. Aseguran que Perú Cuenta con un Potencial Geotérmico de 3.000 MW, que no es Aprovechado. 2020. Available online: https://www.energiaestrategica.com/aseguran-que-peru-cuenta-con-un-potencial-geotermico-de-3-000-mw-que-no-es-aprovechado/ (accessed on 25 May 2024).
  25. United Nations. Sustainable Development Goals. Available online: https://www.un.org/sustainabledevelopment/energy/ (accessed on 25 May 2024).
  26. Banco Central de Reserva del Perú. Estimaciones del Balance Oferta—Demanda en el Sector Eléctrico 2021–2024. 2021. Available online: https://www.bcrp.gob.pe/docs/Publicaciones/Reporte-Inflacion/2021/junio/ri-junio-2021-recuadro-1.pdf (accessed on 1 December 2023).
  27. Schmerler, D.; Velarde, J.C.; Rodríguez, A.; Solís, B. Energías Renovables: Experiencia y Perspectivas en la Ruta del Perú Hacia la Transición Energética; Osinergmin: Lima, Peru, 2019. [Google Scholar]
  28. Vásquez, A.; Tamayo, J.; Vilches, C. La Industria de la Energía Renovable en el Perú: 10 Años de Contribuciones a la Mitigación del Cambio Climático; Osinergmin: Lima, Peru, 2017. [Google Scholar]
  29. Apoyo & Asociados. ENGIE Energía Perú S.A. Reporte de Clasificación. 2023. Available online: https://engie-energia.pe/wp-content/uploads/2023/11/Engie-0923.pdf (accessed on 25 May 2024).
  30. ENGIE. ENGIE to Replace 1 GW of Coal Assets with 1 GW of Renewables. 2019. Available online: https://www.engie.com/sites/default/files/assets/documents/2020-01/10dec-2-pr-chile-en-v6_VA.pdf (accessed on 1 December 2023).
  31. WSP. Plan de Abandono Parcial de la Central Termoeléctrica Ilo 21. 2023. Available online: https://www.wsp.com/es-pe/proyectos/plan-de-abandono-parcial-de-la-central-termoelectrica-ilo-21 (accessed on 25 May 2024).
  32. ENGIE. Memoria Anual. 2019. Available online: https://engie-energia.pe/wp-content/uploads/2020/10/Memoria-Anual-2019-vweb.pdf (accessed on 25 May 2024).
  33. Ministerio de Energía y Minas. Anuarios Estadísticos; MINEM: Lima, Peru, 2020–2022. [Google Scholar]
  34. Apoyo & Asociados. Sector Eléctrico Peruano 2022: Reporte Sectorial. 2022. Available online: https://www.aai.com.pe/wp-content/uploads/2023/06/Sectorial-Sector-El%C3%A9ctrico-Dic-2022.pdf (accessed on 25 May 2024).
  35. Instituto Nacional de Estadística e Informática. Estado de la Población Peruana; INEI: Lima, Peru, 2020. [Google Scholar]
  36. Ministerio de Energía y Minas. Tres Proyectos de Generación Eléctrica con Energía Renovables Entran en Fase de Operación Comercial Durante el 2020. 2020. Available online: https://www.gob.pe/institucion/minem/noticias/86946-tres-proyectos-de-generacion-electrica-con-energia-renovables-entran-en-fase-de-operacion-comercial-durante-el-2020 (accessed on 25 May 2024).
  37. Ministerio de Energía y Minas. Política Energética Nacional del Perú 2010–2040; MINEM: Lima, Peru, 2020. [Google Scholar]
  38. Camisea. ¿Qué es Camisea? Available online: https://camiseaesenergia.pe/que-es-camisea/ (accessed on 25 May 2024).
  39. Lee, E.; Hengesh, J.; Nyman, D. Landslide-related ruptures of the Camisea pipeline system, Peru. Q. J. Eng. Geol. Hydrogeol. 2009, 42, 251–259. [Google Scholar] [CrossRef]
  40. Heaps, C.G. LEAP: The Low Emissions Analysis Platform; [Software Version: 2020.1.112]; Stockholm Environment Institute: Somerville, MA, USA, 2020; Available online: https://leap.sei.org (accessed on 3 April 2024).
  41. Nieves, J.A.; Aristizábal, A.J.; Dyner, I.; Báez, O.; Ospina, D.H. Energy demand and greenhouse gas emissions analysis in Colombia: A LEAP model application. Energy 2019, 169, 380–397. [Google Scholar] [CrossRef]
  42. Mirjat, N.H.; Uqaili, M.A.; Harijan, K.; Walasai, G.D.; Mondal, M.A.H.; Sahin, H. Long-term electricity demand forecast and supply side scenarios for Pakistan (2015–2050): A LEAP model application for policy analysis. Energy 2018, 165, 512–526. [Google Scholar] [CrossRef]
  43. Chen, R.; Rao, Z.; Liu, G.; Chen, Y.; Liao, S. The long-term forecast of energy demand and uncertainty evaluation with limited data for energy-imported cities in China: A case study in Hunan. Energy Procedia 2019, 160, 396–403. [Google Scholar] [CrossRef]
  44. Rivera-González, L.; Bolonio, D.; Mazadiego, L.F.; Naranjo-Silva, S.; Escobar-Segovia, K. Long-Term Forecast of Energy and Fuels Demand Towards a Sustainable Road Transport Sector in Ecuador (2016–2035): A LEAP Model Application. Sustainability 2020, 12, 472. [Google Scholar] [CrossRef]
  45. Ministerio de Energía y Minas. Plan Energético Nacional 2014–2025; MINEM: Lima, Peru, 2021. [Google Scholar]
  46. ENEL. Wayra I: La Energía del Viento Impulsando una Nueva Era. Available online: https://www.enel.pe/es/sostenibilidad/wayra-i-la-primera-central-eolica-de-enel-en-peru.html (accessed on 25 May 2024).
  47. ENEL. Central Solar Clemesí: Proyecto ya se Encuentra al 60 % de Avance. Available online: https://www.enel.pe/es/conoce-enel/prensa/press/d202303-central-solar-clemesi--proyecto-ya-se-encuentra-al-60---de-avanc.html (accessed on 25 May 2024).
  48. Statkraft. Solar Lab en Junín Permitirá Evaluar Tres Nuevas Tecnologías Fotovoltaicas en Zona Alta del Perú. 2021. Available online: https://www.statkraft.com.pe/comunicaciones/noticias/solarlab-en-junin-permitira-evaluar-el-comportamiento-de-cuatro-nuevas-tecnologias-en-zona-alta-del-peru/ (accessed on 25 May 2024).
  49. Cordova, E.V.; Aquino, L.T.; Cordova, E.V.; Hinostroza, S.C. Project to Develop a Geothermal System to Generate Electricity in Peru. Int. J. Energy Econ. Policy 2022, 12, 311–322. [Google Scholar] [CrossRef]
  50. Revista Energía. La Energía Geotérmica es una Oportunidad de oro para el Perú. 2022. Available online: https://revistaenergia.pe/la-energia-geotermica-es-una-oportunidad-de-oro-para-el-peru/ (accessed on 25 May 2024).
  51. Seequent. Combustible Verde a Partir de Energía verde: Cómo la Energía geotérmica Puede Producir Hidrógeno. 2022. Available online: https://www.seequent.com/es/combustible-verde-a-partir-de-energia-verde-como-la-energia-geotermica-puede-producir-hidrogeno/ (accessed on 13 January 2024).
  52. ENEL Green Power. Todas las Ventajas de la Energía Geotérmica. Available online: https://www.enelgreenpower.com/es/learning-hub/energias-renovables/energia-geotermica/ventajas (accessed on 13 January 2024).
  53. van der Molen, J.; Peters, E.; Jedari-Eyvazi, F.; van Gessel, S.F. Dual hydrocarbon–geothermal energy exploitation: Potential synergy between the production of natural gas and warm water from the subsurface. Neth. J. Geosci. 2019, 98, e12. [Google Scholar] [CrossRef]
  54. Schlömer, S.; Bruckner, T.; Fulton, L.; Hertwich, E.; McKinnon, A.; Perczyk, D.; Roy, J.; Schaeffer, R.; Sims, R.; Smith, P.; et al. Annex III: Technology-Specific Cost and Performance Parameters: Climate Change 2014: Mitigation of Climate Change. Contribution of Working Group III to the Fifth Assessment Report of the Intergovernmental Panel on Climate Change; Cambridge University Press: Cambridge, UK; New York, NY, USA, 2014. [Google Scholar]
Figure 1. Changes in electrical world demand and by regions (2019–2024) [3].
Sustainability 16 04964 g001
Figure 2. Shares of primary energy [4].
Sustainability 16 04964 g002
Figure 3. Electric generation by source in Latin America (1990–2013) [16].
Sustainability 16 04964 g003
Figure 4. Electricity consumption per capita (kWh) [17].
Sustainability 16 04964 g004
Figure 5. Electric power generation by source in percentage.
Sustainability 16 04964 g005
Figure 6. Electric power generation in the National Interconnected Electric System (SEIN).
Sustainability 16 04964 g006
Figure 7. Electric power demand in the National Interconnected Electric System (SEIN).
Sustainability 16 04964 g007
Figure 8. The Camisea pipeline system and the four landslide incident sites [39].
Sustainability 16 04964 g008
Figure 9. Energy demand final units.
Sustainability 16 04964 g009
Figure 10. Allocated to demand.
Sustainability 16 04964 g010
Figure 11. Electricity production by type of resource.
Sustainability 16 04964 g011
Figure 12. Global Warming Potential (GWP).
Sustainability 16 04964 g012
Table 1. Considerations for scenarios S1, S2, and S3 in the base year.
ParametersDescription
Population in 2020–205032.6–39.7 million people [35]
Gross Electricity Generation (GEG)52,743.71 (GWh) [22]
Gross Electricity per capita Consumption1616.3 (kWh/hab) [22]
Gross Electricity per capita Generation1404.9 (kWh/hab) [22]
Losses in Distribution Systems9.6% [22]
Environmental DirectivesPeruvian Energy Policy [37]
Disclaimer/Publisher’s Note: The statements, opinions and data contained in all publications are solely those of the individual author(s) and contributor(s) and not of MDPI and/or the editor(s). MDPI and/or the editor(s) disclaim responsibility for any injury to people or property resulting from any ideas, methods, instructions or products referred to in the content.

