Abstract
Mangrove forests are considered to be the most productive ecosystems on the planet due to the multiple ecosystem services they offer, both environmental economic, and social; however, their area in recent years has been decreasing due to anthropogenic activities such as urbanization and deforestation. These activities alter the normal cycle of carbon stored in sediments, which is considered their main function to counteract climate change. Therefore, the objective of this research was to compare the carbon storage capacity and coverage in forested and non-forested sites of two tropical wetlands located in Colombia (the Caimanera) and Mexico (the Llano). Methodologically, we began by identifying the coverages and determining the area in the wetlands with Sentinel-2A satellite images and a supervised classification; subsequently, soil cores were extracted in all the coverages to a depth of 70 cm and the apparent density (AD), the percentage of organic carbon (OC), and the density of carbon in the soil were determined. For analysis of the variables, a trend graph was constructed between carbon density and depth with descriptive statistics, using one-way ANOVA to establish which coverage and wetland were the most significant concerning carbon storage. The results of the supervised classification showed that Rhizophora mangle and Avicennia germinans are the dominant species, also finding deforested areas in both wetlands. The one-way ANOVA statistical test indicated that the Caimanera, with the percentage of organic carbon (18.4 ± 1.19%), is 1.57 times greater than of the Llano mangrove swamp with (11.7 ± 0.748 MgC/ha). Through the trend graph, it was observed that the carbon density of the forested area of the Caimanera ranged from 120 to 140 MgC/ha, which is higher than in the deforested areas of the same wetland between 40 and 60 MgC/ha, and the homologous areas of the Llano wetland. The results suggest that deforested areas are sources of greenhouse gas emissions because they contain less carbon than forested areas. Therefore, it is concluded that the Caimanera and the Llano wetlands have the same mangrove species and that the average organic carbon stored in their soil is below the average of other mangrove forest soils in the American continent; it is recommended that the findings of this work be considered for the carbon balances by continent and the characterization of mangrove species according to their carbon storage capacity.
1. Introduction
Natural wetlands serve as transitional ecosystems between aquatic and terrestrial environments, predominantly characterized by persistent soil moisture or water coverage, which provides conducive conditions for vegetation growth [1,2]. Wetlands can be marine (coral reefs, shallow marine waters, marine aquatic beds), continental (permanent or seasonal freshwater lakes, shrub-dominated swamps, ponds, and marshes, among others), or coastal (mangroves, intertidal marshes, estuarine waters, coastal rivers, and streams, among others). According to their hydrological conditions, wetlands can be classified as lacustrine, estuarine, riparian, or depressional [3].
Mangrove forests are very common in coastal wetlands and grow in brackish water conditions. The importance of such ecosystems lies in the multiple environmental services they provide, one of which is to supply food to coastal communities through artisanal fishing. In addition, they provide shelter to wildlife [4]. Mangroves also stop extreme winds and control the rise in sea levels, with their high biomass that functions as a living barrier and with their roots, which allow the accumulation of sediment quantities, controlling the sea level and coastal erosion [5]. Additionally, their paramount function lies in the sequestration and storage of carbon, primarily through the gradual decomposition of organic matter. Although such ecosystems occupy a small global area, they help counteract climate change by capturing atmospheric carbon dioxide through photosynthesis in biomass and subsequently being stored or sequestered in the soil or sediment [6]. This type of carbon is also called blue carbon, as it is found in marine coastal areas [7]. This stored carbon can last thousands of years if sediments are not altered [8], which helps mitigate global warming.
The rate of carbon storage in mangroves ranges from 1.0 to 9.2 Megagrams of carbon per year (MgC/year); it depends on the content of organic matter in the sediments, the aerial biomass, and the leaf litter [9]. It has been documented that mangrove forests can store up to 1023 MgC/ha, capturing three to five times more carbon than terrestrial forests, thereby serving as critical carbon sinks [10].
Although mangroves cover merely 0.7% of the Earth’s surface, they account for 25% of carbon stored in coastal zones, with only 10% of carbon naturally lost in gaseous form, emitted primarily through global deforestation [11]. Nonetheless, the perpetual threat of habitat loss due to land-use change and deforestation poses a significant concern, resulting in global emissions of up to 0.3 PgC/year in the mangrove forest, equivalent to approximately 6% of annual global emissions attributed to land-use change [12]. Transitioning from freshwater wetland forests to grazing sites has been reported to escalate carbon loss in the form of methane by up to tenfold [13].
Concerning research on carbon storage the different types of wetlands that have been studied are forested marshes (11.3%), non-forested peatlands (14.3%), freshwater marshes (19.1%), coastal marshes (43.7%), and mangroves only (7.7%); These studies were distributed by areas as follows: (35.4%) in temperate climates, (40.5%) in boreal climates and with little research, tropical climates representing (22.2%) of the 333 capture rates investigated to date in 2018 [14,15].
According to Jennerjahn, T. C. [16], the carbon stored by continent in mangrove soils is ordered as follows: Oceania 360 Mg/ha, America 320 Mg/ha, Asia 295 Mg/ha, and finally Africa 250 Mg/ha; however, other research shows different results to these, such as the study carried out by Kauffman et al. [17], in the mangrove forests in Palau, Micronesia, where they obtained data of 479 Mg/ha in the areas closest to the sea and the most distant, that is, towards the continent with an approximate value of 1068 MgC/ha. Specifically, at the site called Yap, an interval in the same direction of 853 to 1385 MgC/ha was obtained.
Not only anthropogenic activities affect mangroves in relation to carbon sequestration, but also climate change with strong cyclones that flood the coasts of these ecosystems with high concentrations of salt, altering soil conditions. Chowdhury et al. [18] found, in the mangroves of Sundarbans, India, between 2017 and 2021, that an increase in salinity by 31% can reduce the organic carbon stored in the soil by up to 46%, as well as reducing available phosphorus and available nitrogen by 33% and 30%, respectively. Some sensitive mangroves have disappeared with these saline concentrations, so the actions of climate change must be counteracted so as not to affect these carbon sinks.
Globally, studies conducted on the comparative analysis of carbon sequestration in sediments are important. One such study was carried out by Kusumaningtyas et al. [19] in Indonesia, where a natural mangrove and a rehabilitated mangrove, which had been altered by aquaculture, were taken as examples. The results showed that, up to 1 m in depth, the carbon sequestered in the rehabilitated mangrove was greater than in the natural one, with 364 MgC/ha and 126 MgC/ha, respectively.
On the American continent, a study was conducted in Brazil, a country that has the second largest area of mangroves globally. Given the limited number of studies on carbon sequestration in its mangrove forests, Rovai et al. [20] decided to evaluate this ecosystem function. They found that Brazil holds 8.5% of the world’s carbon reserves in sediments and aerial biomass. Additionally, they discovered that the upper meter of Brazilian mangroves contains 4.3 times more carbon than other Brazilian ecosystems, with a sequestration rate in sediments between 15% and 30%, which is higher than recent global estimates. Despite the American continent exhibiting relatively high carbon storage rates in mangrove forest soils, limited data are available for Latin American coastal zones, consequently impeding their inclusion in global carbon assessments. This scarcity of data underscores the critical need for comprehensive studies on carbon storage, particularly in mangrove sites in Colombia and Mexico. Furthermore, few studies have investigated the impact of deforestation on carbon storage in mangrove forests in those countries. Thus, conducting such studies in mangrove ecosystems in Colombia and Mexico is imperative to assess soil carbon content in both vegetated and deforested areas, facilitating comparison and informing rehabilitation strategies to mitigate climate change.
Ballut-Dajud et al. [2] developed a review by continent, finding the factors that most affect the loss of wetlands were agriculture (25%), urbanization (16.8%), aquaculture (10.7%), and industry (7.6%) affecting mangroves (25.7%), lagoons (19.11%), and marine waters (11.7%), which are among the sites most deteriorated by anthropogenic activities, hence the importance of this study.
At the local Colombian level, in the Gulf of Urabá, mangrove forests have been deforested since 2003 due to agricultural and pastoral activities. An approximate carbon storage of 89.3 MgC/ha was found in Colombia in general. Between approximately 0.69 and 1.18% of mangrove forests have been lost between the years 1980–1990 and 2000–2005, a representative rate in South America [21].
In México, Marin-Muñiz et al. [3] compared five herbaceous and arboreal freshwater wetlands with different geomorphic characteristics (estuarine, depressional, and perilacustrine) and found that all wetlands are located on the coastal plains of the Gulf of Mexico in the state of Veracruz, Mexico, and showed that the range of average carbon concentration in the soil was greater in wetlands with tree vegetation (50 to 225 gC/kg) than in those with herbaceous vegetation (50 to 150 gC/kg), without detecting significant differences in the carbon accumulated in the soil.
In that sense, Colombia and Mexico are among the megadiverse countries with a large number of wetlands on their coasts, and where studies on carbon storage are scarce, despite the constant annual loss of these forests, which is why was the proposed objective of this research was to compare the carbon storage and coverage in forested and non-forested sites of two tropical wetlands located in Colombia (the Caimanera) and Mexico (the Llano). Remote sensing techniques with Sentinel-2A images were used to identify the existing coverage, followed of a field verification, also estimating the areas of each coverage; the possible anthropogenic activities that affect them were identified; and, finally, the percentage of organic carbon in the soil in the forested and deforested areas of each site was determined.
The rationale for this study stems from the direct impact of human activities on these ecosystems and their crucial role in mitigating climate change. It is imperative for the scientific community and the entities responsible for monitoring, managing, and controlling wetlands to have access to valuable information for future studies. This understanding is essential to comprehend the true extent of their contribution to climate change mitigation, facilitating swift and effective conservation efforts. Moreover, there has been a growing awareness of the significance of these ecosystems.
The function of carbon sequestration in mangroves has become relevant in recent years, which is why studying these ecosystems is a focus of interest. Although research has increased in this decade, there are still gaps in knowledge about these data. At least 50% of the countries that have mangroves lack data on the carbon stored in their biomass and soil [22]. On the other hand, Arifanti et al. [23], state that it is important to quantify the dynamics of soil carbon sequestration in intact and degraded mangroves in such a way that it allows a better analysis of their behavior under anthropogenic activities that affect their land cover.
The present work contributes to the field of knowledge through the analysis of mixed methodologies of tropical wetlands to monitor their evolution and propose sustainable management actions.
2. Materials and Methods
2.1. Study Areas
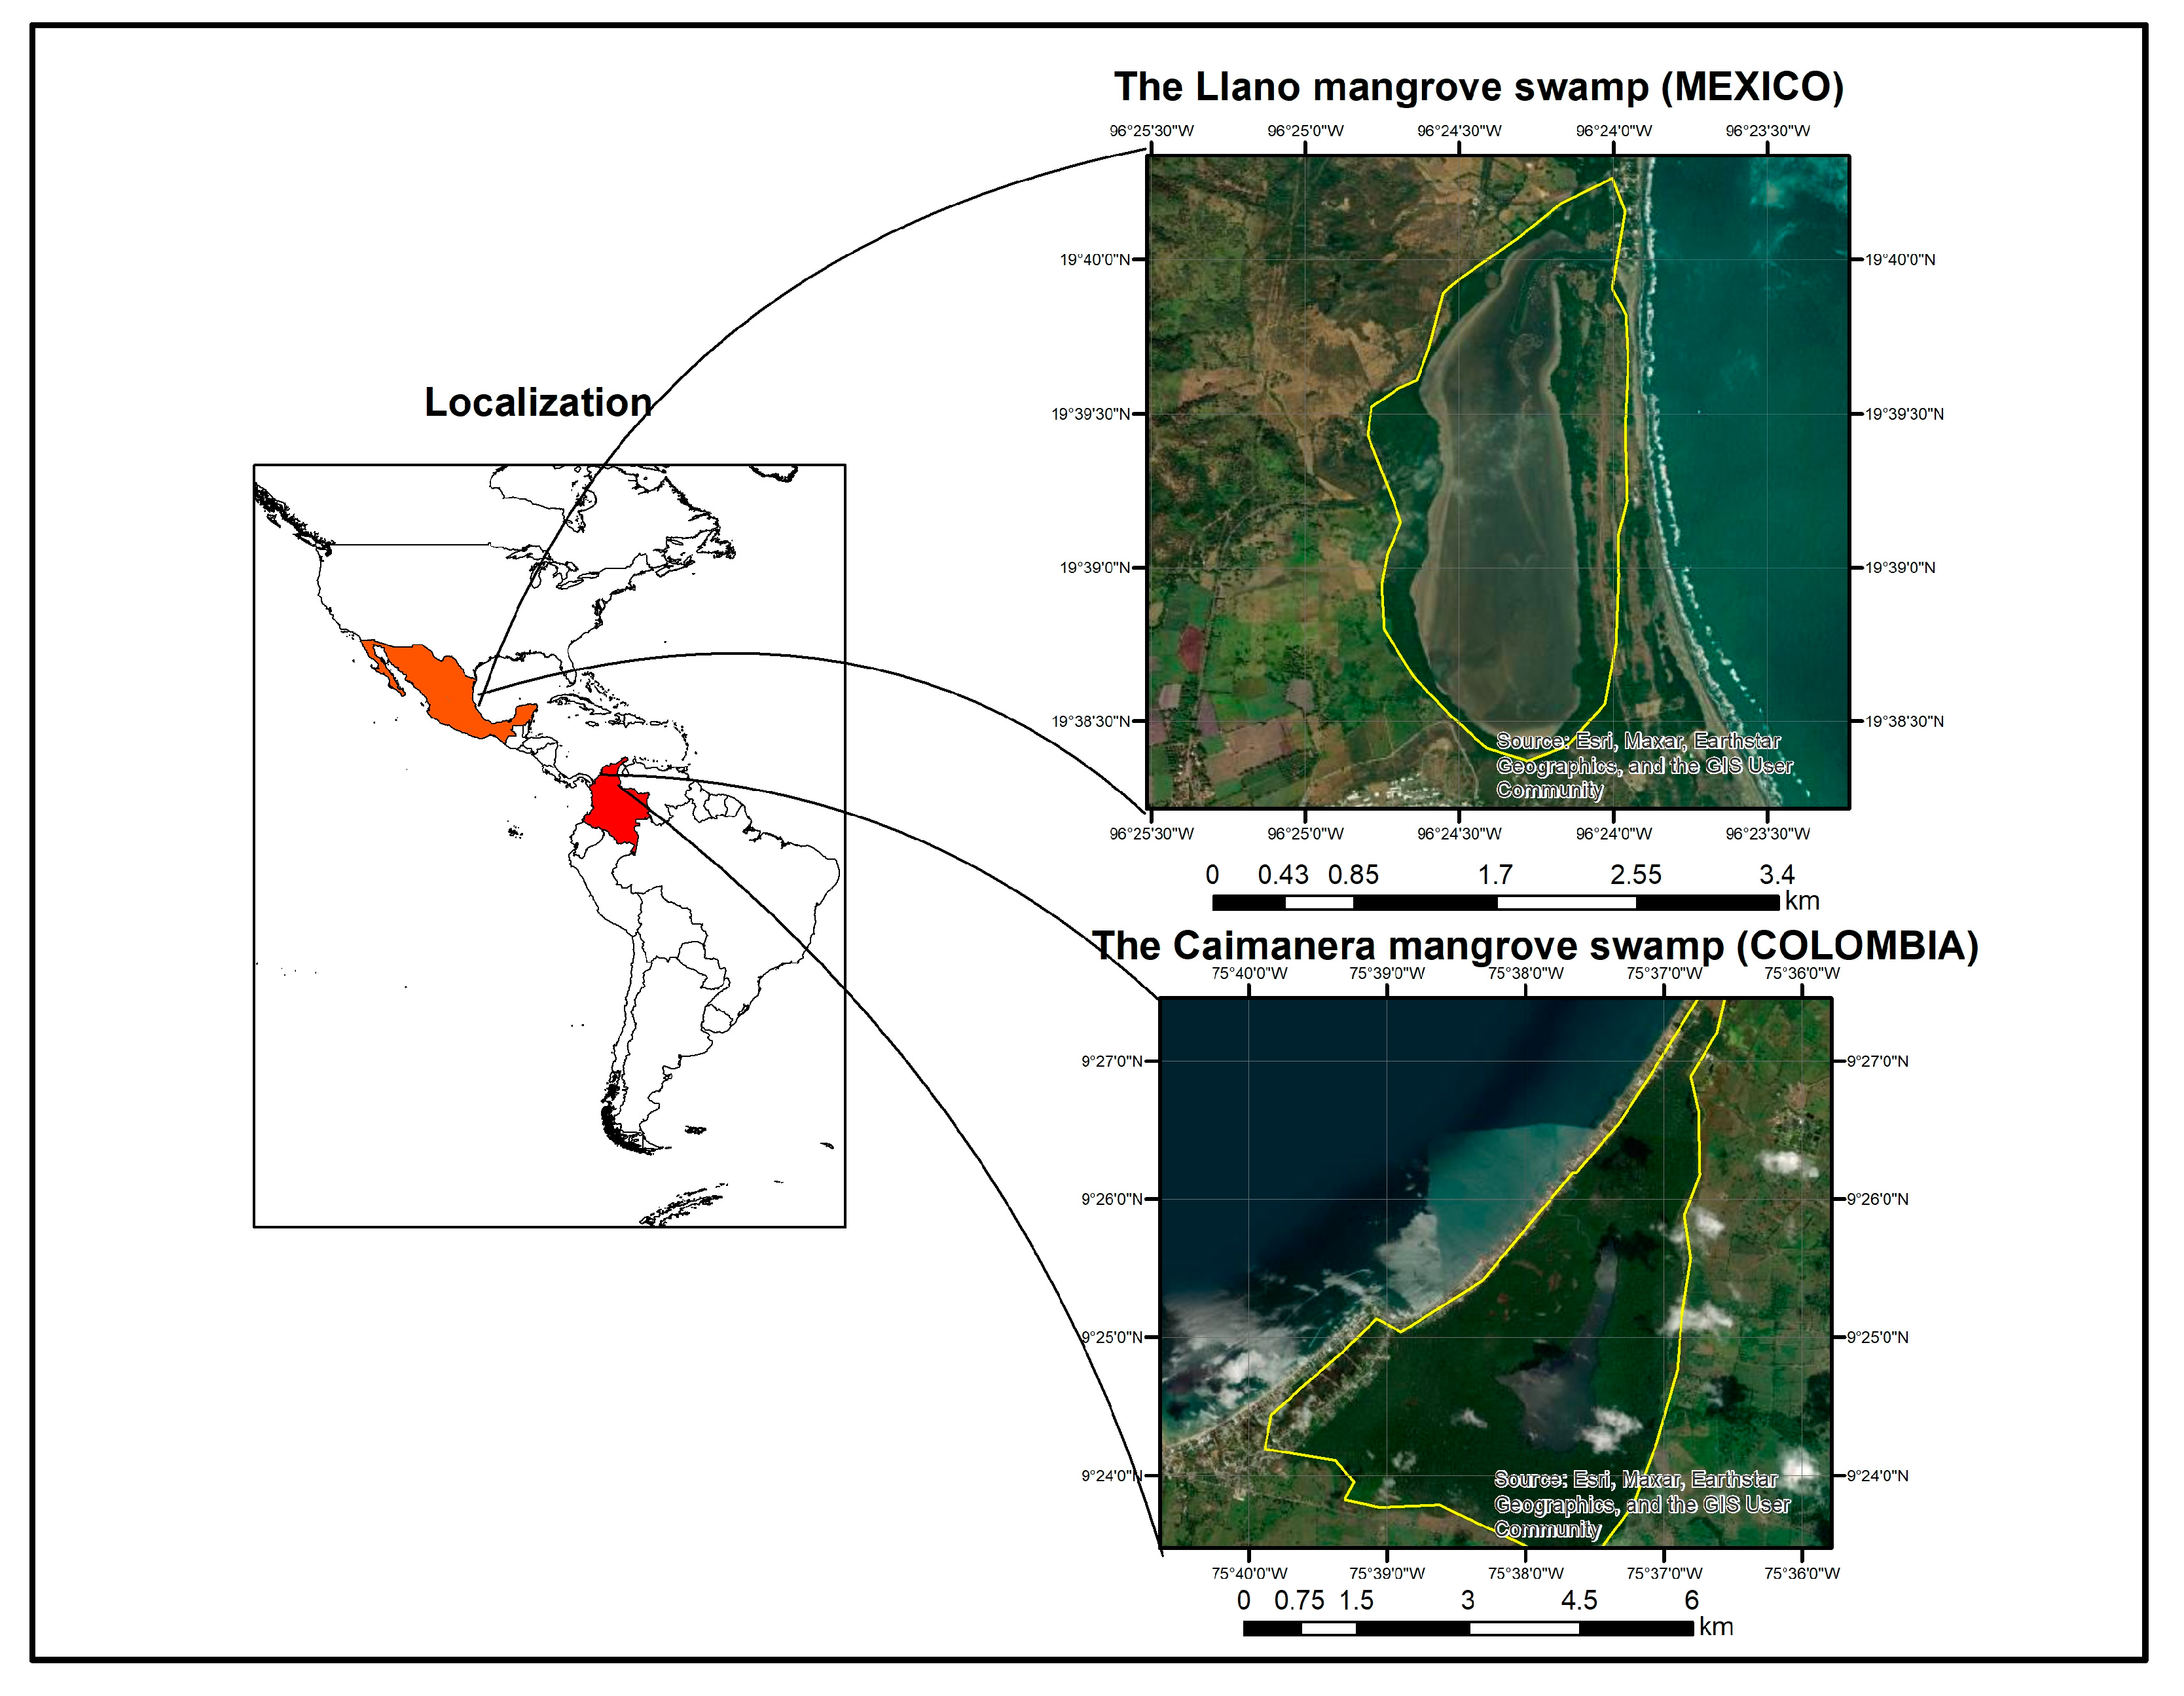
(A) In the Gulf of Morrosquillo–Sucre, Colombia, between latitude 9°27′00″ and 9°23′24″ N with longitudes 75°39′45″ and 75°36′40″ W, is located ‘The Caimanera’ mangrove swamp, with an approximate area of 1800 Ha.
(B) In the Gulf of Mexico Veracruz, Mexico, between latitudes 19°40′4.07″ and 19°38′23.29″ N with longitudes 96°24′38.66″ and 96°23′56.61″ W, is located ‘The Llano’ mangrove swamp with an approximate area of 320 ha (Figure 1).
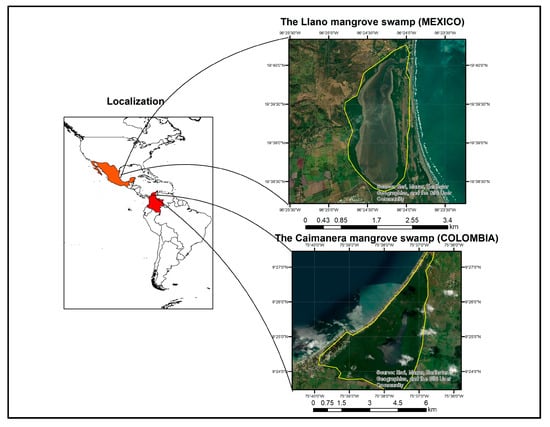
Figure 1.
Location of wetlands.
Both wetlands have different climatological characteristics with average temperatures between 22 °C and 30 °C for the Llano, the coldest season being between November and February and the warmest from March to June. In the other wetland, average temperatures are 30–37 °C for the Caimanera, the coldest season is November to December and the warmest from January to April. Table 1 shows some variables such as temperature, precipitation, humidity. (Table 1). According to the World Reference Base for Soil Resources (WRB), the types of soils found are histosols (sandy loam), with high organic matter content and slow decomposition rates.

Table 1.
Climatological characteristics of the study sites.
Both wetlands are situated along the Atlantic coast, each featuring a central body of saltwater. In the Caimanera, the body of water is deeper, reaching 2 m in depth, while in the Llano, it measures only 1 m. Surrounding these bodies of water are red mangroves (Rhizophora mangle) and black mangroves (Avicennia germinans). On a socioeconomic level, field interviews revealed that the Caimanera is home to over 100 families whose livelihoods depend on fishing, tourism, and the mangroves. Similarly, the Llano supports approximately 20 families whose main sources of income are fishing and mangrove-related activities.
2.2. Sampling Area
The reviewed literature on research related to carbon storage in sediments revealed a variety of criteria regarding the number of sampling points and plots to be established, as well as the sampling depth. Similarly, methods for subsampling wetlands varied, possibly due to challenges associated with wetland access, such as its characteristics or the cost of processing samples [26,27,28,29,30,31,32].
This research was a methodological guide that was first proposed by Howard et al. [33]: first, the type of plots is determined, second, their quantity, and finally, their location; both in areas with vegetation (forested) and in areas without vegetation (deforested) to evaluate and compare results. Establishing at least a minimum number of plots determines the level of the research; however, the economic limitation and the scope of our objective delimited such criteria, being framed within level 2, which according to the manual are reliable results that will serve as inputs for future research.
The manual specifies that plots can be either permanent or temporary. In this study, temporary plots were selected due to their practicality and cost-effectiveness compared to permanent ones, as they allow for the observation of short-term changes over time and require constant review. In a study conducted in Mexico’s Izta-Popo National Park, nine permanent plots were established in three zones to determine basal area, biomass, and carbon content. The findings of this study suggested that permanent plots are preferable over temporary ones only when continuous, long-term studies are needed, despite the higher initial cost involved [34]. It is important to note that in this research, the intention was not to estimate carbon levels at the same site years later.
Despite the availability of tools to determine the optimal number of plots, certain limitations prevented their implementation. Firstly, as this is a transnational investigation, logistical challenges arose. Secondly, time constraints and financial costs posed additional limitations.
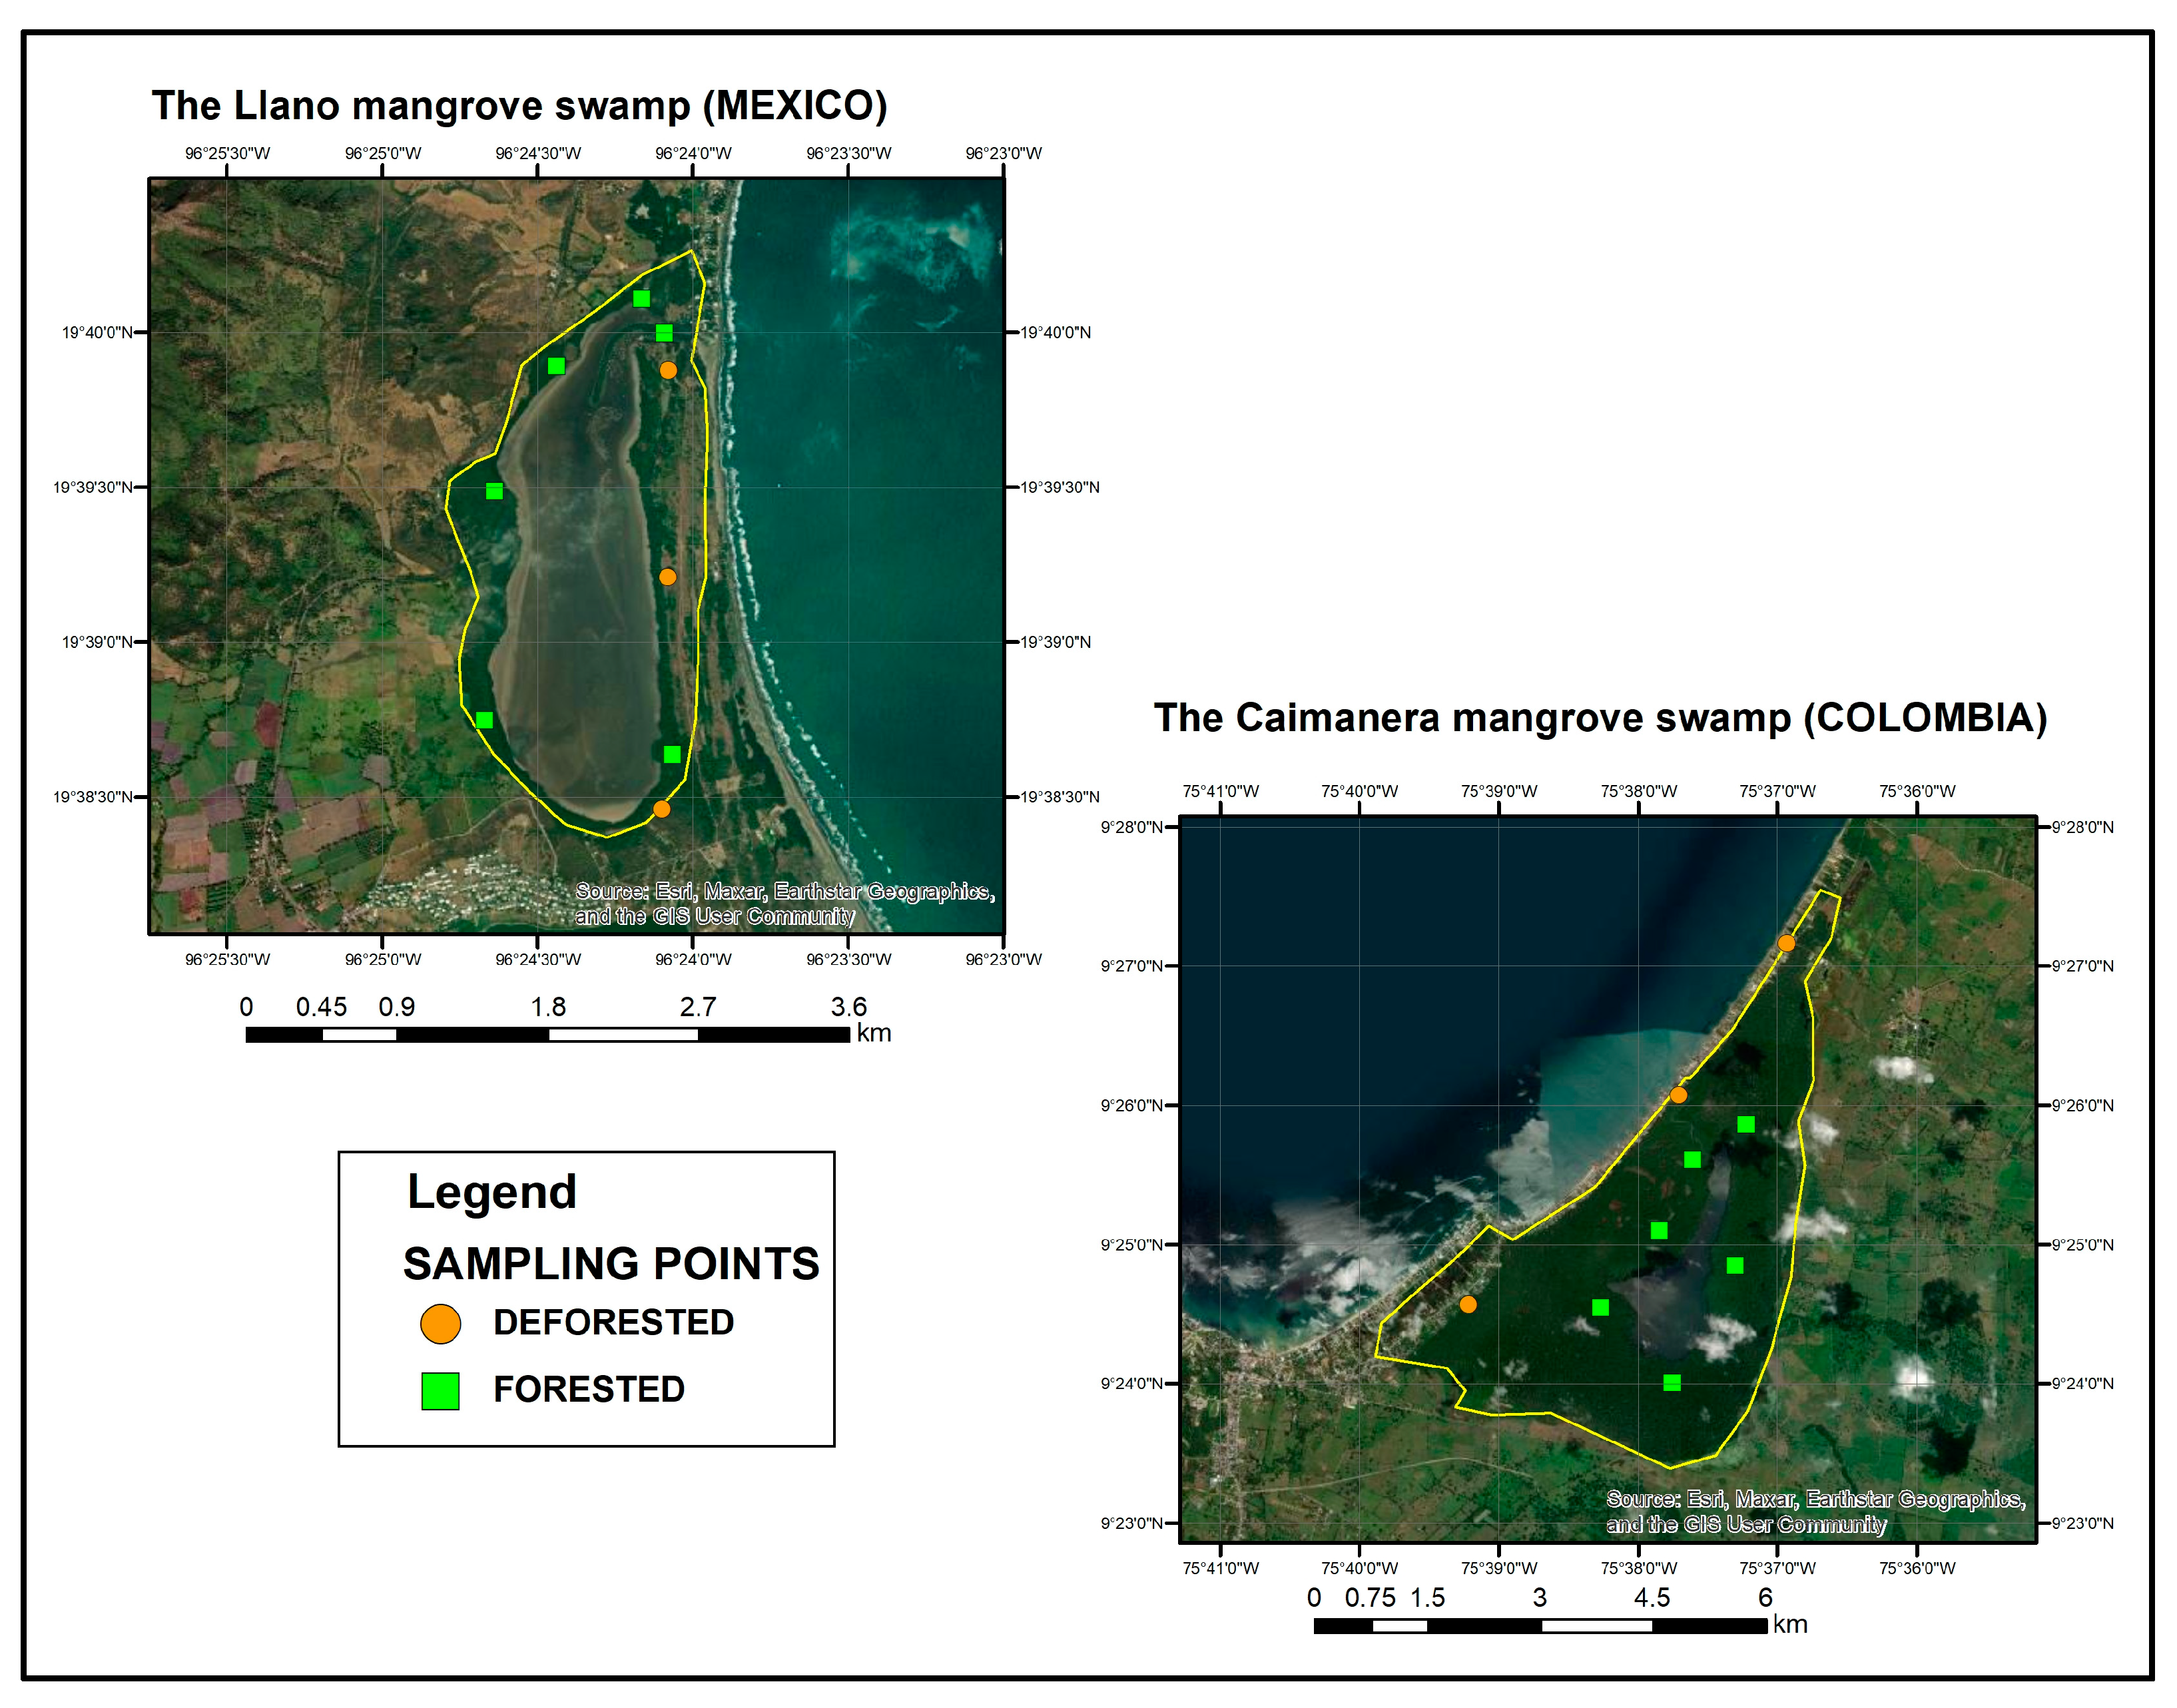
Regarding the location of the plots, a numbered grid was established around the bodies of water to enhance accessibility within the wetlands. Sampling points were then randomly selected using the “AppLife Team” random number generator application, ensuring a probabilistic approach in point selection.
Subsequently, the points were geolocated using Google Earth within the forested area, with six points designated in each wetland. However, in the deforested areas, there was a modification. In the Caimanera, only three points were allocated due to the construction of buildings, resulting in limited areas of bare soil. Similarly, in the Llano, three points were designated in areas devoid of mangrove vegetation to maintain consistency with the Caimanera.
A total of 9 plots were located in each wetland, 6 in a forested area and 3 in a non-forested area. In each plot, 3 sampling points were carried out, and the soil core reached a depth of 70 cm which was subsampled every 5 cm. A total of 378 subsamples were processed in the laboratory for each wetland, 252 for the forested area distributed among the mangrove species and 126 for the non-forested area. Each point was strategically located around the saltwater body, as depicted in Figure 2.

Figure 2.
Location of sampling points.
2.3. Identification of Coverage and Areas
The use of remote sensors makes it possible to study coverage because of the electromagnetic energy emitted by the sun, when reflected by land coverage, is captured by satellite sensors, which facilitate the study of plant communities and can help us understand the dynamics, processes, and functions of these ecosystems [35]. Sentinel-2A 2022 images with a spatial resolution of 10 m obtained from Copernicus [36] were used, to which atmospheric and radiometric corrections were applied and the supervised classification algorithm was developed for the identification of the vegetation cover and its areas. ArcMap 10.8® software Esri, Redlands, CA, USA, licensed by the University of Sucre, was used to create the maps with their respective area tables. Finally, precision was evaluated using the confusion matrix and the Kappa coefficient.
2.4. Soil Profile Sampling
Soil cores were extracted between December 2022 and March 2023 at each site, capitalizing on the dry season and conducting sampling during morning hours at low tide. In the wetlands, 5 × 5 m plots were delineated, with three replicates taken at each a designated point. A 2-inch diameter, 1.5 m long PVC corer was utilized, and inserted to a depth of 1.2 m to extract 70 cm long cores, as illustrated in Figure 3. Upon retrieval of the corer, plugs were inserted and sealed to prevent moisture loss and ensure accurate estimation of organic carbon percentage and apparent density. The soil cores were transported to the laboratory and stored under consistent temperature conditions to maintain the integrity of the chain of custody, as outlined in [33].
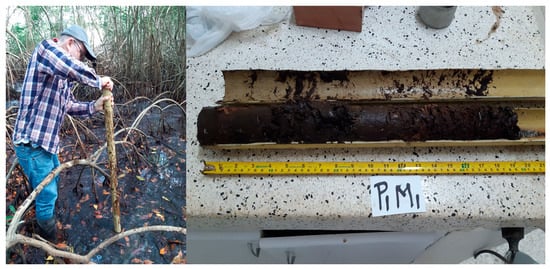
Figure 3.
Sampling and sediment core.
2.5. Soil Analysis
In the soil laboratory of the Universidad de Sucre, Colombia, and in the laboratory of the Instituto Tecnológico Superior de Misantla, México, all 378 subsamples from each wetland were processed; 252 subsamples for the forested area and 126 subsamples for the non-forested area; cutting the tubes and sectioning the cores in ranges of (0–10 cm), (10–20 cm), (20–30 cm), (30–40 cm), (40–50 cm), (50–60 cm), and (60–70 cm). The apparent density (AD) was determined following the formula [37]:
The percentage of organic carbon (OC) was calculated using the Walkey and Black method, this is a chromic acid wet oxidation method, as also used in their research [38,39,40]. Finally, the density of organic carbon (DOC) was determined by multiplying (AD) and (OC).
To determine the percentage of organic carbon (OC), with the Walkey–Black method, the following formula is used:
where B = the volume of ferrous solution spent on the target; M = the volume of ferrous solution spent on the sample; N = the dichromate volume/B.
2.6. Estimation of Organic Carbon in Soil
Following finding the percentage of organic carbon in the samples with Equation (2), the data were grouped statistically in a descriptive way, by wetlands and by forested and deforested areas, and represented in a table.
2.7. Estimation of Soil Carbon Density
Initially, a graph was constructed to analyze the carbon density trends with respect to depth in both wetlands, considering both deforested and forested areas. Descriptive statistics were then employed to calculate the mean and standard error for each coverage in both wetlands, presented in a tabular format. The carbon density of each core was summed and multiplied by the segment thickness (10 cm) and further multiplied by a conversion factor to translate the values into units consistent with carbon stocks. This approach yielded the total core carbon, as detailed in reference [33].
2.8. Statistical Analysis
The data were grouped into three nominal variables: wetlands (Caimanera, Llano), coverage (forested and non-forested), and depth; and two numerical variables (the carbon density and the percentage of organic carbon in soil), and assumptions were checked using the normality test (Shapiro–Wilk) and the homogeneity of variance test (Levene’s test). When the variances were not equal, Welch’s single-factor ANOVA was applied, otherwise Fisher’s single-factor ANOVA was applied, as proposed by Fox and Weisberg [41]; here null and alternative hypotheses related to homoscedasticity and heteroscedasticity were raised, respectively.
A trend graph illustrating the behavior of carbon density in relation to depth was generated for both forested and non-forested coverage in both wetlands. Finally, a one-way ANOVA and the Games–Howell post hoc test were conducted to determine the significance of differences in the carbon density between the groups. Significance levels were denoted by (*), (**), and (***), with the latter indicating the highest degree of significance.
For the percentage of organic carbon, descriptive statistics were initially computed to determine the respective organic carbon percentages in each wetland for both forested and non-forested areas. The data, accompanied by the averages, were presented in a table format. Subsequently, and based on the results, a single Welch factor ANOVA was applied, and a post hoc test (Games–Howell) was performed to test the significance because the variances were not equal between the areas with vegetation (forested) and the areas without vegetation (deforested) with the organic carbon variable to interpret in which coverage and wetland more carbon is stored.
For all statistical analyses, Jamovi version 2.4.8 Stats Open Now Sydney, Australia [42,43], software was utilized.
3. Results and Discussion
3.1. Determination of Coverage and Areas
With the field visit to both wetlands, the different types of coverage were identified, especially those of mangrove species (Figure 4), corroborating what was found in the supervised classification. This method has been effective in mapping mangroves, as demonstrated by Nguyen et al. [44], in Thanh Hoa province in north-central Vietnam, where 102 km of coastline was accurately mapped with an accuracy of 90%.
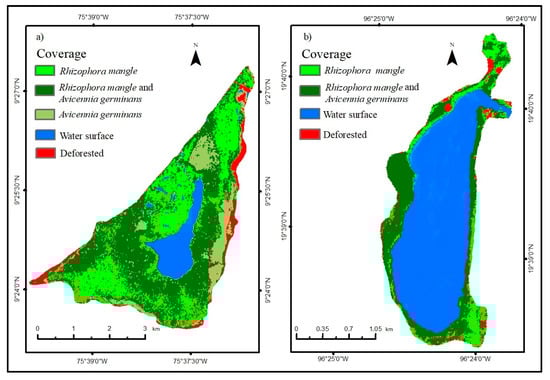
Figure 4.
Sentinel-2A 2022 supervised classification in the Caimanera (a) and the Llano (b).
After evaluating the accuracy using the confusion matrix and the Kappa coefficient, employed to assess the effectiveness of algorithms or their validity in the supervised classifications using Sentinel-2A images for both wetlands, the results indicated percentages ranging from 92% to 94% for the Caimanera and the Llano, respectively. These figures are comparable to those reported by Chowdhury et al. [45] in the expansive mangrove forest in the Sundarbans, Indonesia, situated between latitudes 21° and 22° north, which demonstrated accuracies between 86% and 92%, confirming their validity within an acceptable margin.
Table 2 shows the areas of each coverage in the wetlands after quantifying the supervised classification. In the Llano, the Avicennia germinans mangrove does not exist, which is why it has a symbol (----); the deforested areas in the Caimanera and the Llano were 100.35 ha and 9.18 ha, respectively.
Table 2.
Extension of the coverage present in the wetlands.
The first thing to highlight is that, in the Llano mangrove, the deforested area of 9.18 ha is due to the felling of forests and in the Caimanera, the 100.35 ha is due to the increase in the population by 8186 people in 15 years, due to having been declared the Coveñas municipality in 2002, according to the census of the National Department of Statistics of Colombia; and, on the other hand, to livestock activity.
The issue of wetland loss in Colombia and Mexico extends beyond the immediate locations of these wetlands. Notably, in Colombia, around 40,000 hectares of mangroves have been lost in the past three decades due to various human activities, including infrastructure development such as roads, urbanization, tourism facilities, hydrocarbon contamination, and agricultural expansion [46]. Similarly, in Mexico, particularly in the Gulf of Mexico, this ecosystem has decreased in area by up to 50% since the 20th century. These challenges significantly impact blue carbon storage, which is sequestered at shallow depths for extended periods, predominantly within mangroves. The rapid anthropogenic development in the Gulf region has led to the release of this stored carbon, exacerbating the situation [47].
Based on the problem of surface loss in wetlands, both mangroves and water surface, Gillis et al. [48] proposed that more research be carried out on the carbon cycle in deforested areas of mangroves. However, Soper et al. [9] stated that it is important to quantify the compensation in mangroves for the impact of climate change. These impacts are attributed to anthropogenic activities.
To address wetland decline, Navarro et al. [49] highlighted the importance of the international chapter of the Society of Wetland Scientists including volunteer scientists, students, and early-career professionals, focusing on enhancing the science and conservation of wetlands in Latin America and the Caribbean (LAC). This region is rich in ecosystem services, yet it has experienced a significant loss of 60% of its wetlands over the past four decades. With 46 countries in LAC boasting diverse flora and fauna, crucial and endangered ecosystems necessitate extensive conservation efforts. Research areas including hydrogeology, climate change, carbon storage, and biodiversity are vital. Notably, countries like Brazil, Colombia, Costa Rica, Ecuador, Mexico, Peru, and Venezuela harbor substantial biodiversity within their territories.
3.2. Organic Carbon in Mangrove Soils
The percentage of organic carbon in the soil was also determined. Table 3 groups these average values by study site and according to the two coverages (forested and deforested) because these areas are an integral part of the wetlands. In the Caimanera mangrove swamp, the average value (18.4 ± 1.19) is 1.57 times greater than that of the Llano mangrove swamp (11.7 ± 0.748), although the difference is evident. Later, with other tests, the significance between these values was shown because it is logical to launch a trial with this result.
Table 3.
Descriptive statistics of organic carbon by coverage.
Table 4 as the p-value (p-0.00531) was less than 0.05, it determined that the values were not normal; and the homogeneity test found that the variances were not equal. Then, when applying one-way ANOVA using Welch’s method, a significant difference was found between the percentage of organic carbon and the forested and non-forested areas.
Table 4.
One-Way ANOVA (Welch’s).
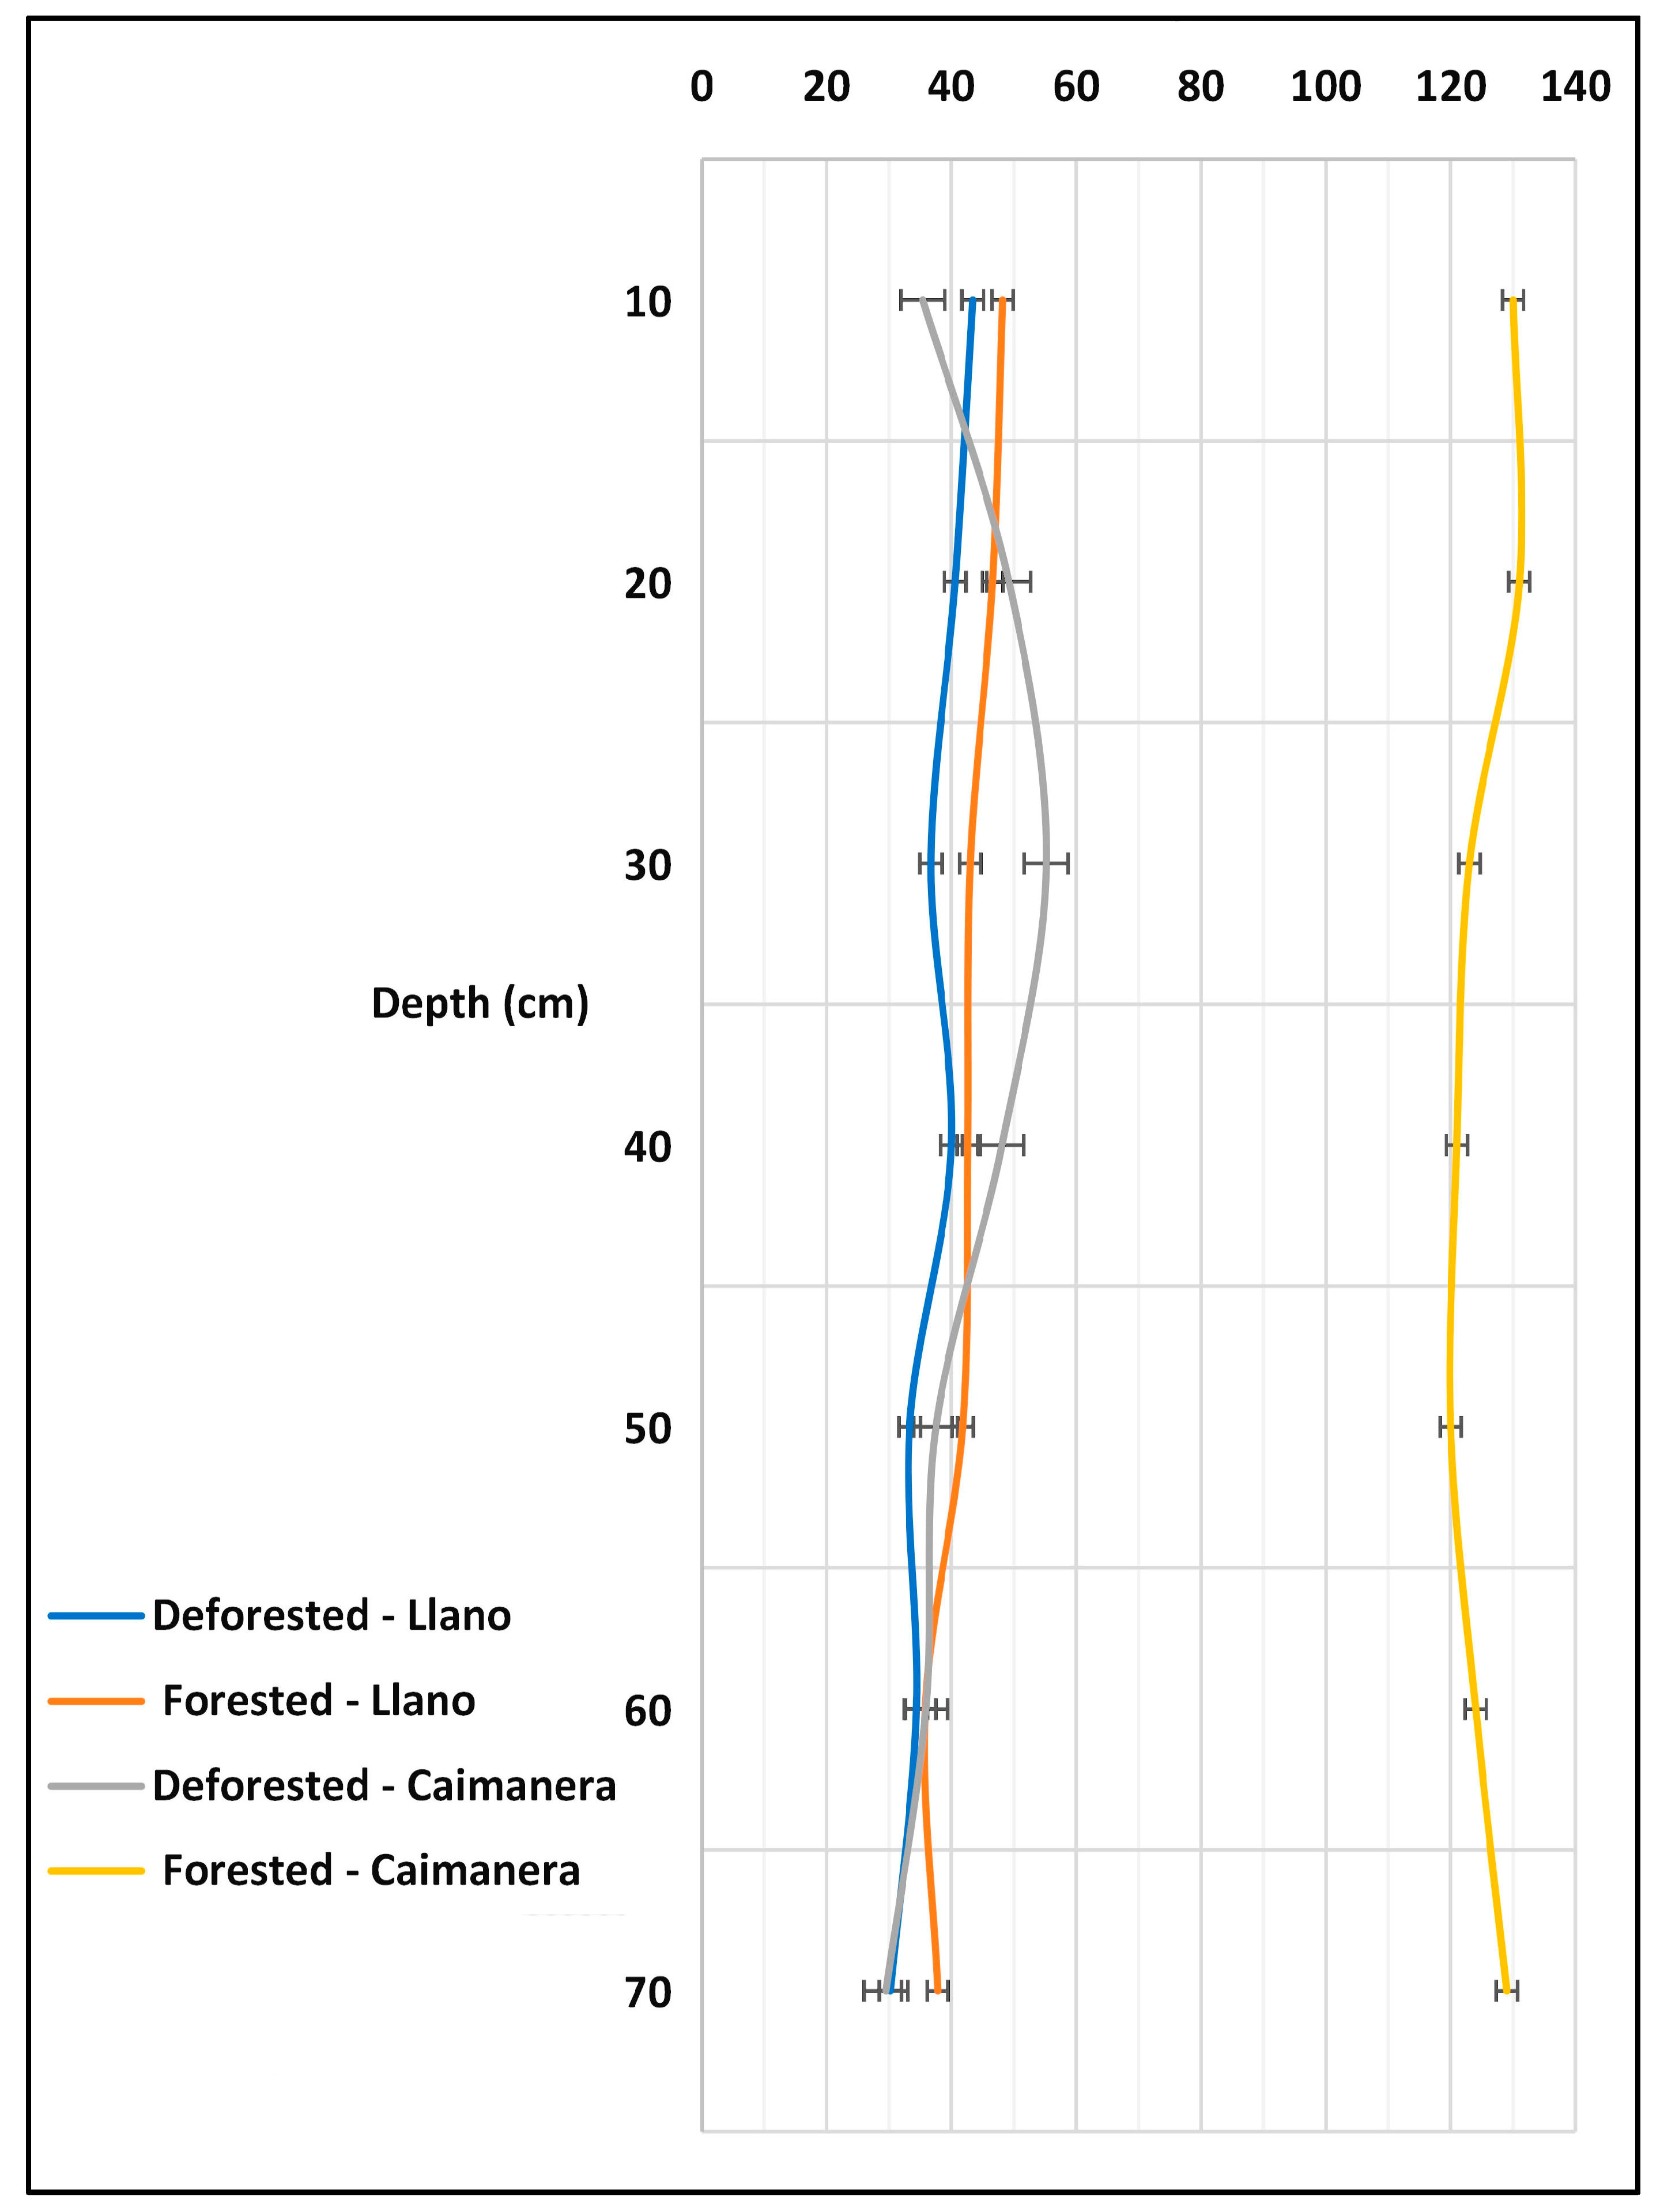
3.3. Carbon Density in Mangrove Soils
The carbon densities in the studied ecosystems were compared across various depth ranges within the wetlands (Figure 5). In the forested sites of the Caimanera, carbon density ranged from 120 to 140 MgC/ha, whereas in the non-forested sites of the Caimanera, and the forested and non-forested Llano, it varied between 40 and 60 MgC/ha. Across all locations, it was observed that the carbon density decreased with depth; Table 4. the statistical test of normality determined that the values were not normal because the p value (p-0.00531) was less than 0.05. Likewise, after applying the homogeneity test, it was found that the variances are not equal and, finally, when applying one-way ANOVA by the Welch’s method, a significant difference was found between carbon density and depth.
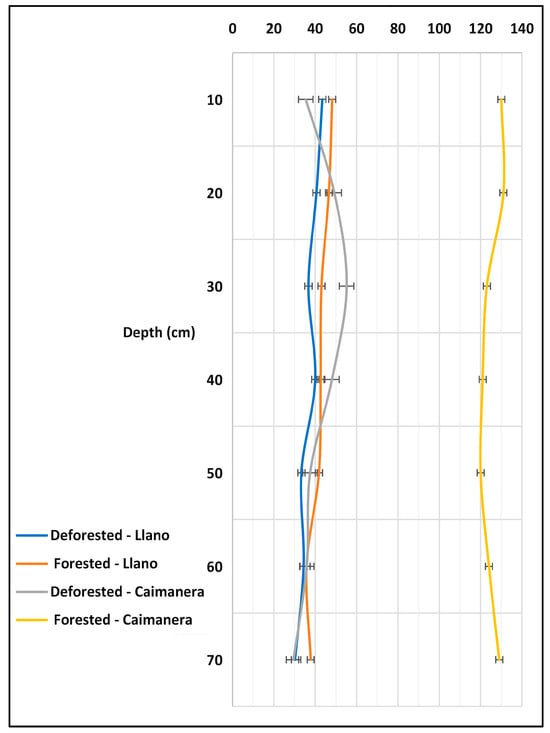
Figure 5.
Behavior of carbon density according to wetland depth.
These results are compared with those found in the Farasan Islands, Saudi Arabia, where carbon reserves in Avicennia marina and Rhizophora mucronata exhibited a similar depth-dependent decline due to reduced organic matter content [50]. This is because as we go deeper, the organic matter decreases and, therefore, so does the carbon content as the mineral material increases [51,52]. The conditions observed in these wetlands play a crucial role in climate change mitigation by promoting carbon storage within soil/sediment, preventing its release into the atmosphere as greenhouse gases. Marin-Muñiz et al. [53] advocated that maintaining a net carbon balance—balancing what wetlands store versus what is emitted as greenhouse gases—illustrates the pivotal role of wetlands in carbon storage.
In the introduction, it was stated that Brazil contains reserves of 8.5% of the world’s stored carbon, Hatje et al. [54]. In a study of the upper meter in the mangroves of Bahia Santos in eastern Brazil, they found stocks of approximately the density of carbon (263 ± 14 MgC/ha). This value represents double that found in Caimanera and five times more than that of Llano.
In Figure 5, notably, a correlation exists between decreasing carbon density and depth, a relationship to be elaborated upon subsequently. The forested area of the Caimanera harbors more significant carbon reserves compared to the other three areas, and the loss of forest results in a decline in these reserves.
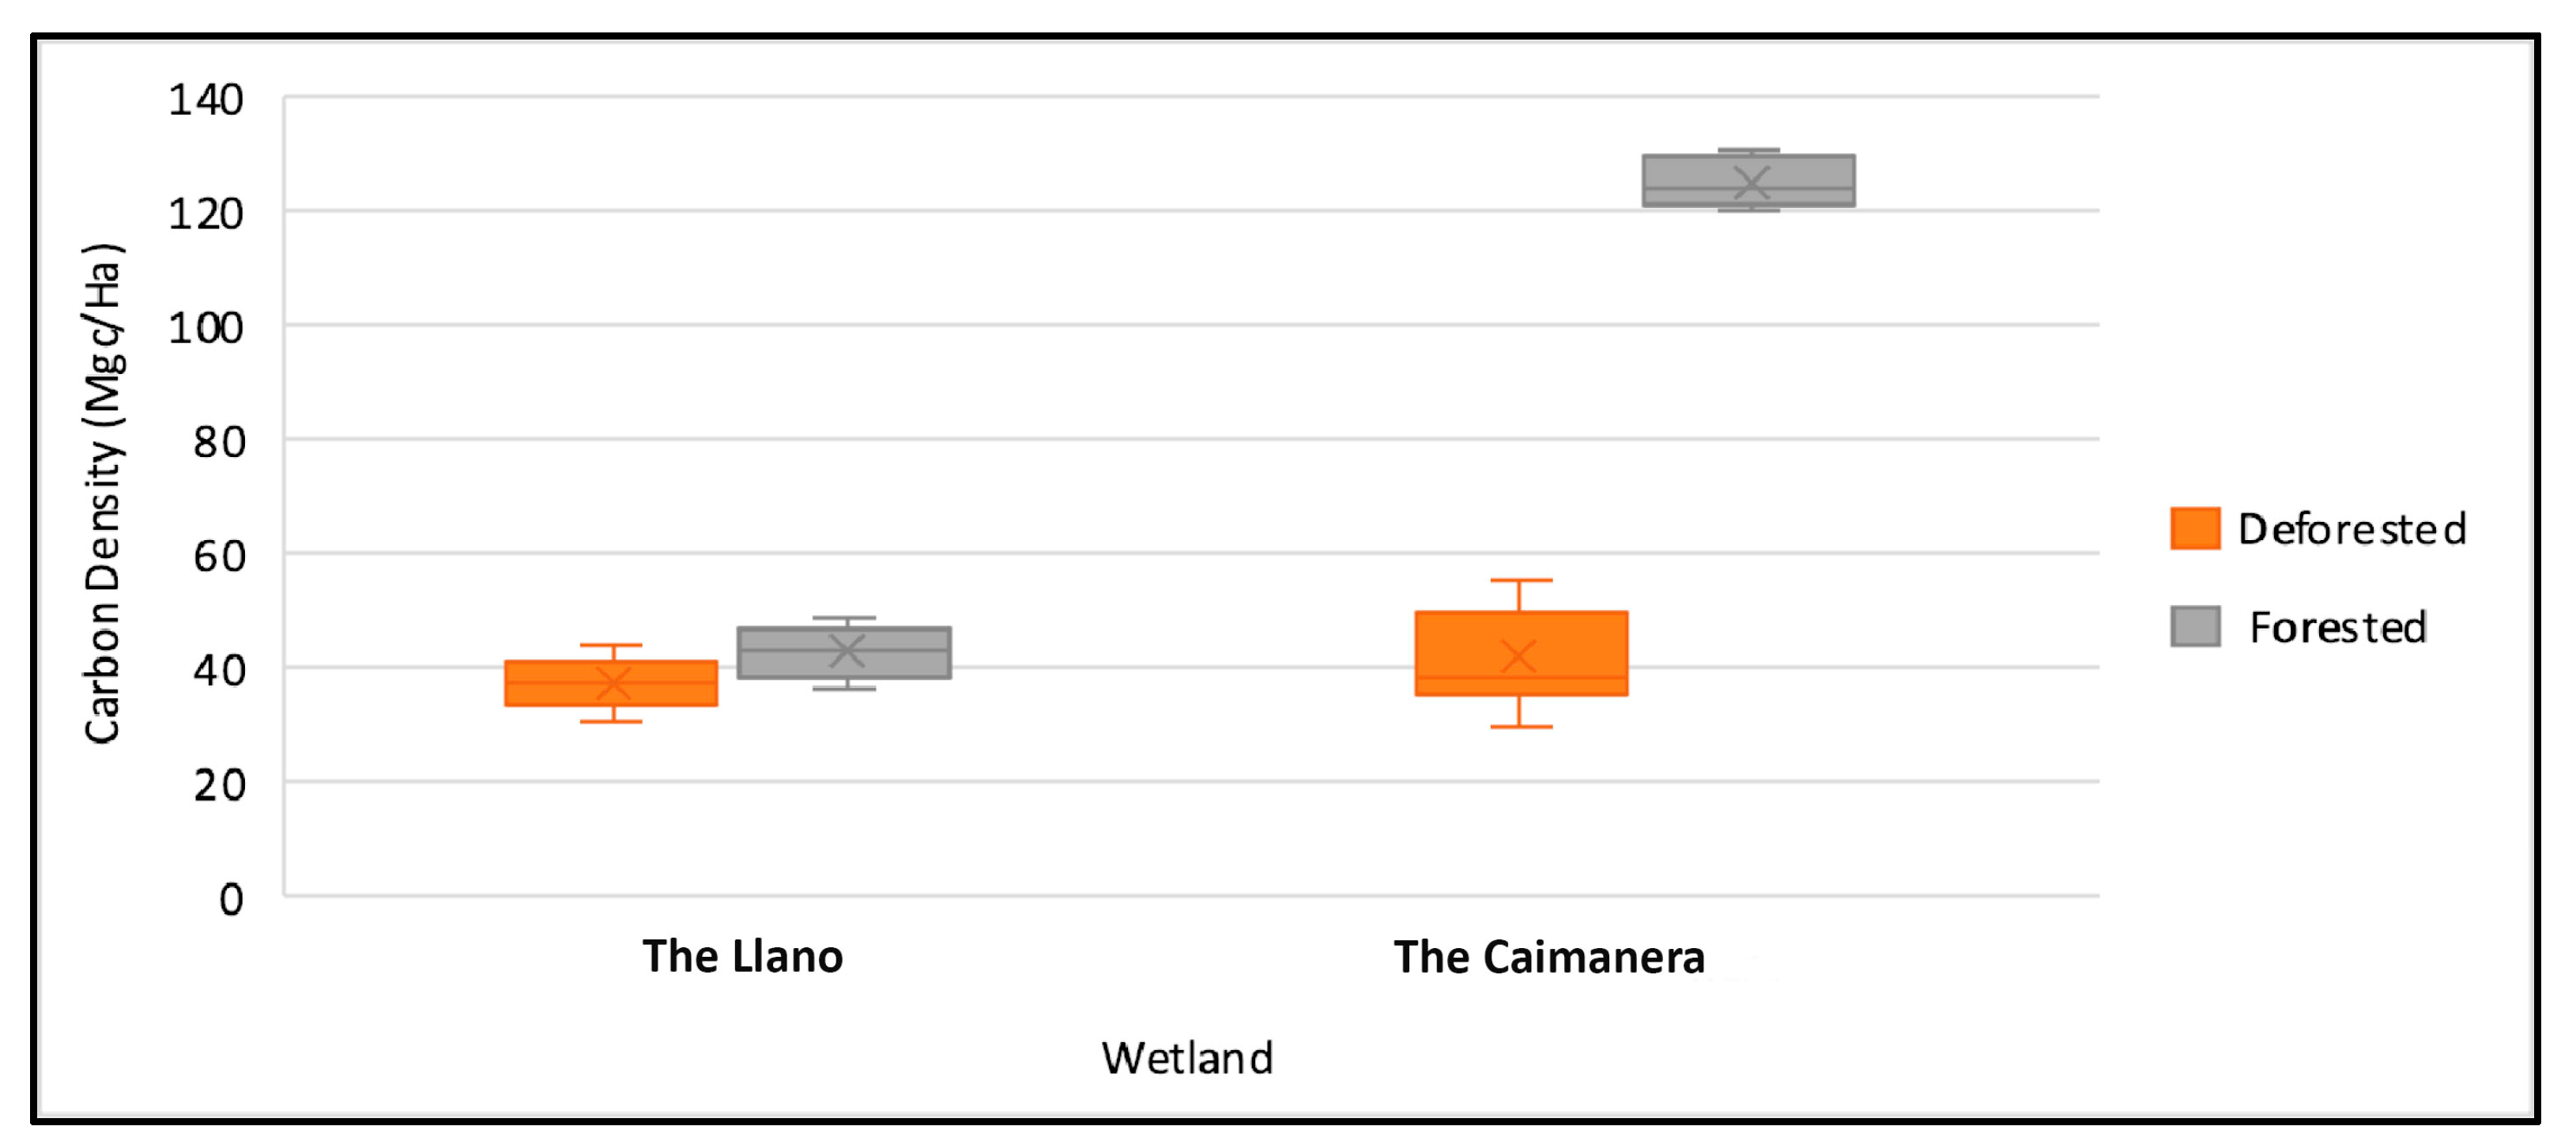
In Figure 6, seen in another way, a significant difference is evident between the coverage of the Caimanera compared to the Llano, then the statistical test will be carried out to corroborate what the data shows.

Figure 6.
Box and whisker plot for wetland carbon density.
The Caimanera is located further south of the tropics and experiences higher temperatures throughout the year, according to Simpson et al. [55], which influences greater productivity and microbial activity, favoring carbon storage. Additionally, another factor that favors carbon storage is vegetation. Although the same mangrove species were found in both wetlands, we observed that in the Caimanera there was more dead organic matter and leaf litter on the surface at the sampling points. Furthermore, the trees were denser and taller, reaching heights between 15 and 20 m, while in the Llano they did not exceed 10 m in height, indicating a younger age. These findings are consistent with those of Merecí-Guamán et al. [4], which suggest that organic matter and the type of vegetation influence carbon storage.
Among the multiple factors that can explain the growth of the mangrove, such as the type of soil and its physicochemical properties, the age of the forest, and climatological conditions, this research took into account only the geographical position and especially the temperature. According to Wu et al. [56], temperature limits the growth and expansion of mangroves at higher latitudes such as the Llano compared to the Caimanera. The vegetation in the Llano is less dense than in the Caimanera because a lower temperature inhibits the phenological and physiological processes of the plants directly or indirectly [57,58].
Organic matter can be said to be a simple compound mixed with the mineral matrix. When there is a large amount of leaf litter and root biomass in the soil, it offers high resistance to decomposition, unlike biomass. Flowers and fruits are more susceptible to decay. In other words, the stability of organic matter depends on the indigenous source, and also, an alteration of the mangrove ecosystem makes a difference in the storage and decomposition of organic matter in the soil [59].
Other factors such as benthic organisms, algae, wave characteristics (including frequency and magnitude), macroorganisms, and microorganisms should also be considered for future research.
The vegetation, dead in the form of peat, was deposited in the mangrove, occupying an area in the Caimanera (85.51%) and in the Llano (32.35%). This accumulation of peat has also been observed in some mangroves in Micronesia, where it was attributed to the rise in sea levels [60]. Regarding the sediment, it sequesters carbon according to its texture, which can be silty, clayey, or sandy, each with different sequestering capacities; for instance, silty sediments tend to sequester more carbon if found in greater proportions than others [61]. It is important to highlight that despite the results obtained, the heterogeneity of mangrove ecosystems poses a challenge for making solid and definitive comparisons regarding carbon storage, as it depends on multiple hydrogeomorphological variables [53]. Additionally, Chen et al. [62], found contrasting results for carbon reserves and the carbon storage rate at one meter depth when comparing two mangrove wetlands: one natural and the other rehabilitated. In the natural area, the carbon storage rate was greater than in the rehabilitated area; however, the accumulation rate was almost twice as high in the latter, which was attributed to hydrogeomorphological conditions.
In a more detailed way, when the percentage of organic carbon was compared by coverage within the wetlands (Table 3), it was evident that in the forested areas, more OC was found than in the deforested areas for both wetlands. In the Llano, the carbon storage in the forested area is 1.82 times greater compared to the deforested area, and in the Caimanera, the carbon detected in the forested area is 4.30 times greater than the deforested area. On another plane, comparing coverage between mangroves, the highest value in the forested areas is attributed to the accumulation of carbon in the sediments due to the live and dead aerial biomass and the leaf litter found in the vegetated sampling points and, on the opposite side, anthropogenic activities allowed the return to the atmosphere of carbon in the form of greenhouse gases, in areas devoid of vegetation, converting this area of the wetland into a source of CO2, as proposed by Aljenaid et al. [8]. This is why the value is reduced value compared with the forested areas. The result in relation to the deforested area confirms the results obtained in research carried out by Taillardat et al. [63], in mangroves, where they found that the OC was lower in the first 30 cm of depth in the sites with bare soil than in those that had vegetation.
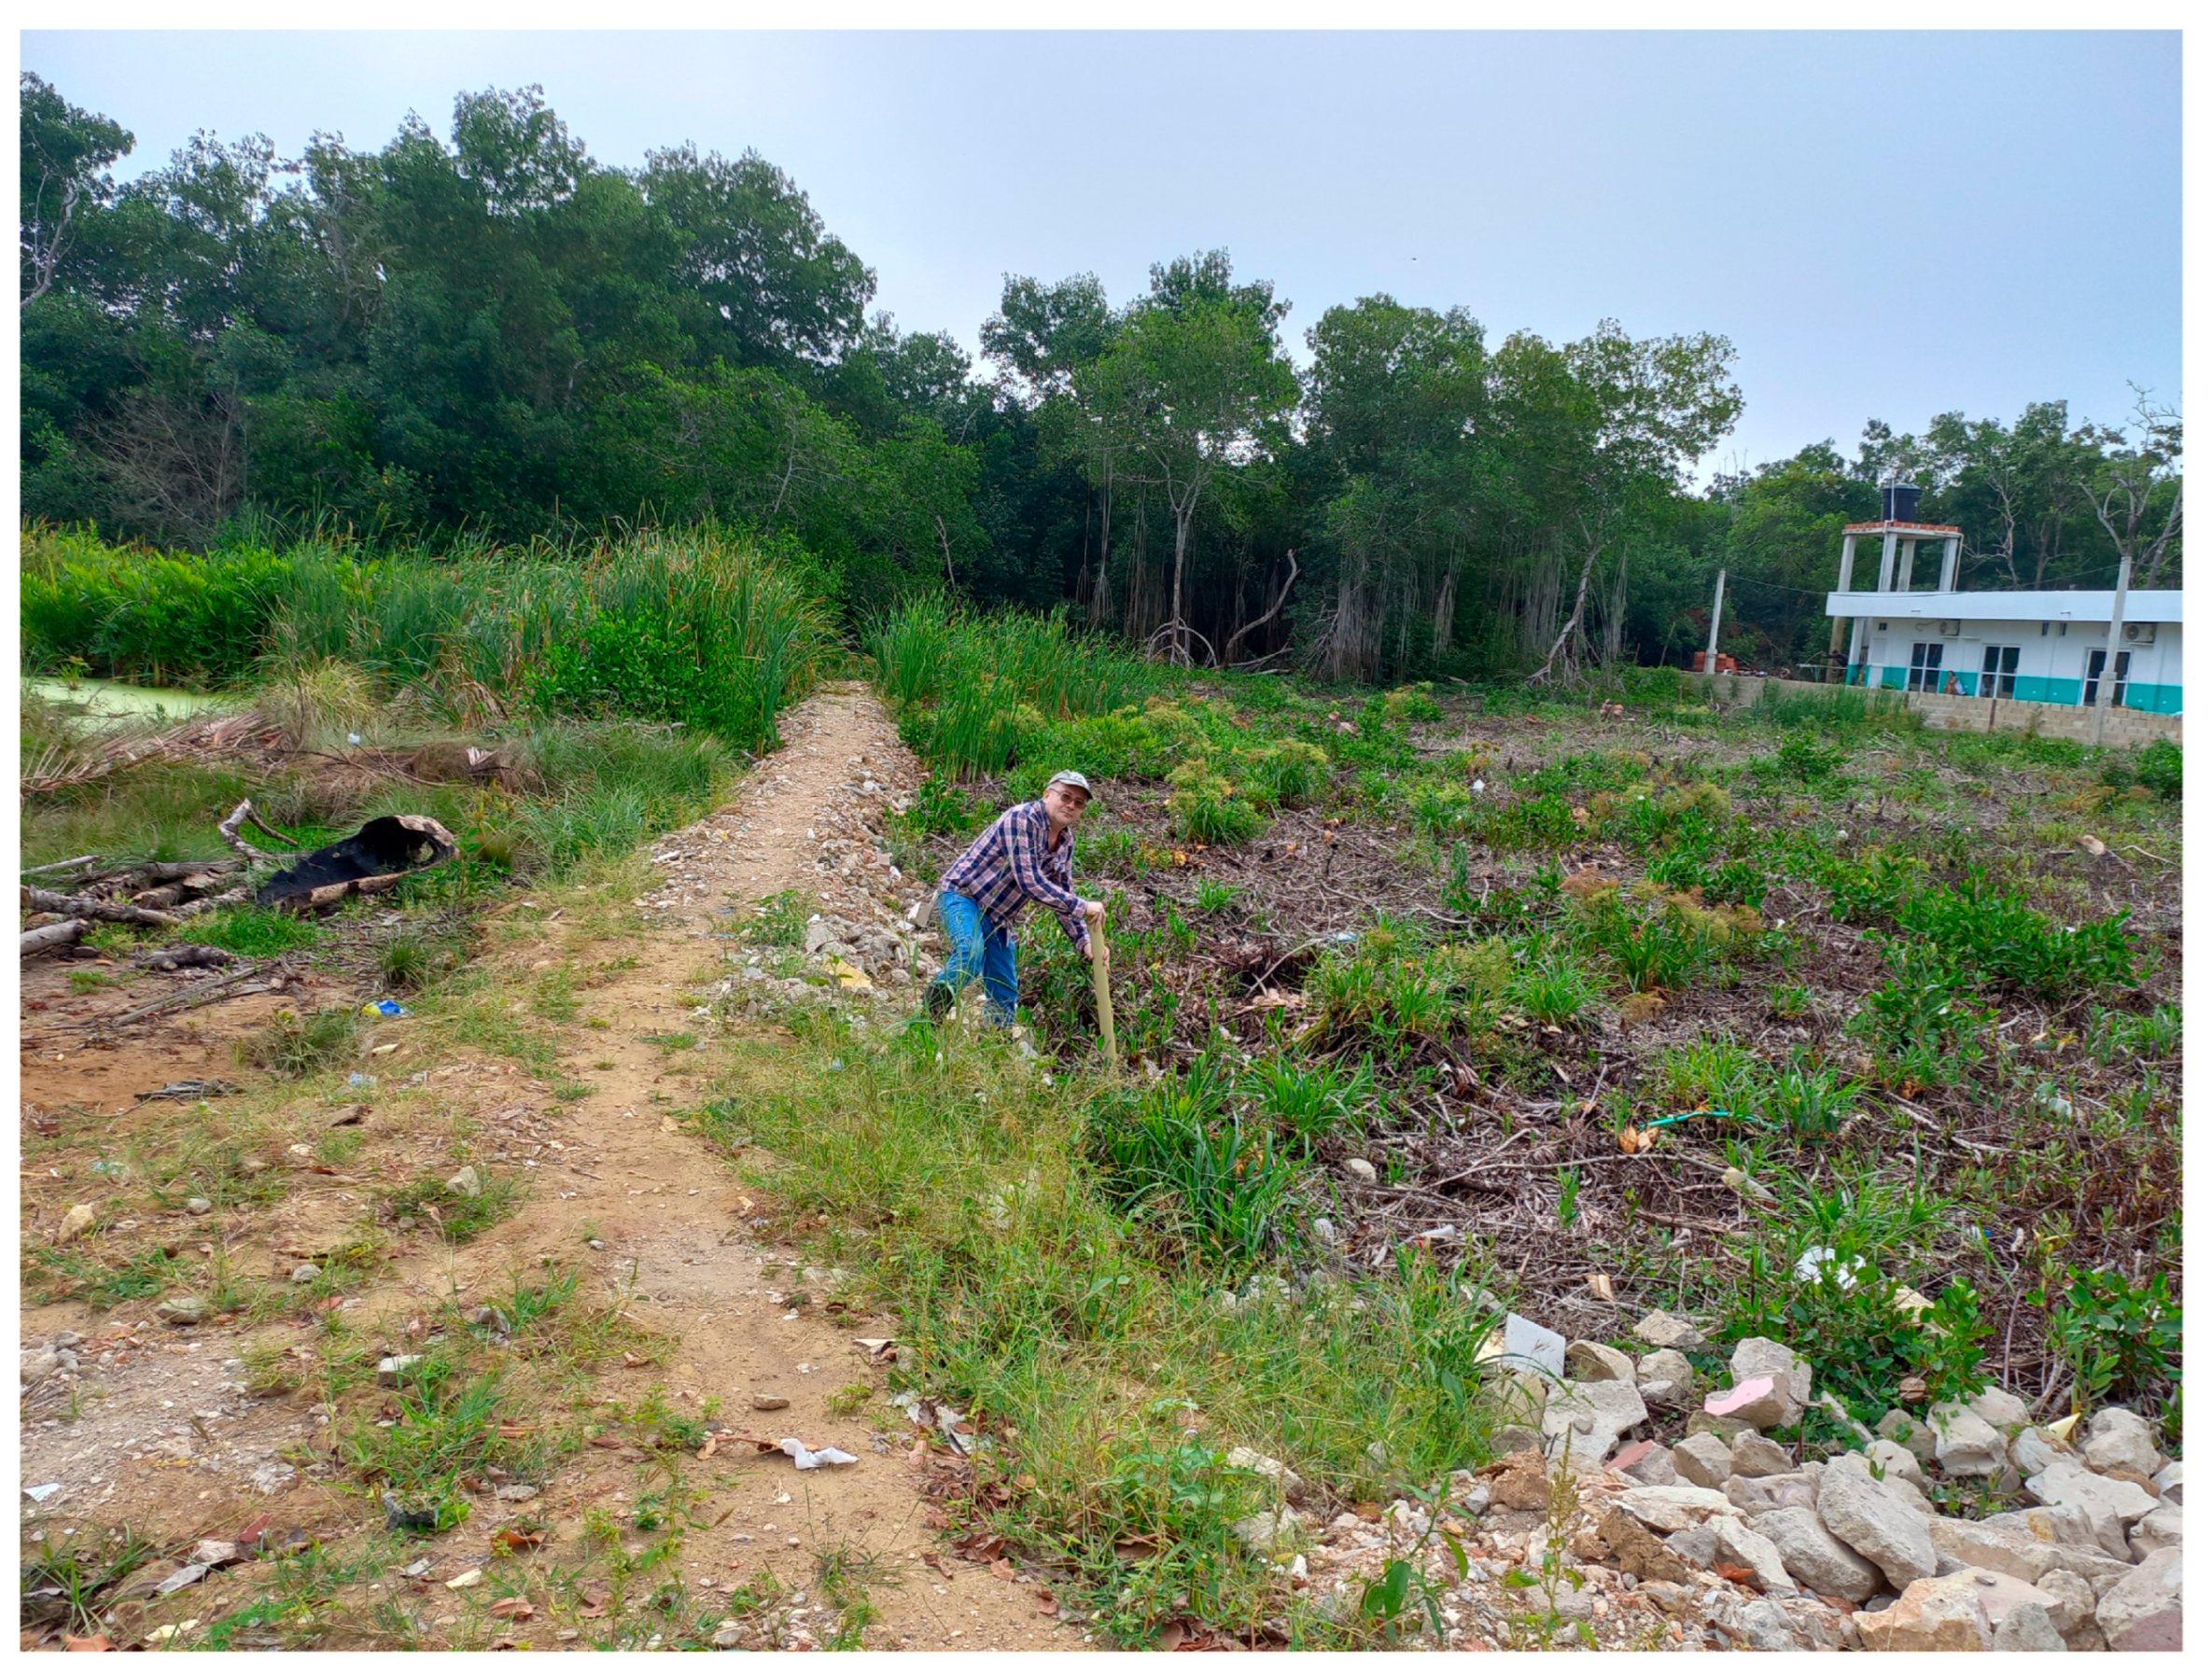
The decrease in organic carbon in deforested areas is due to the lack of vegetation cover (Figure 7) and the oxygenation of the surface layer that allows the stored carbon to return to the atmosphere as a greenhouse gas. When the mangrove soil is deforested, the surface layer is exposed to the sun, temperature, and erosion, which leads to weathering from the chemical point of view of the sediment, consequently generating higher decomposition rates, and resulting in variability in the stored carbon [64].

Figure 7.
Current appearance of non-forested areas.
In the Caimanera, approximately 23.20% of the carbon stored in non-forested areas was lost, while in the Llano region, the loss amounted to 54%. These findings are akin to the carbon loss observed in Madagascar due to mangrove deforestation, estimated at 20% within the upper meter [65].
To verify these assumptions, the normality of the data was assessed using the significance of the variables as an indicator. The results indicated that the variable per wetland site exhibited normal behavior (p = 0.1211). However, no normality of the data was detected according to the coverage (p = 0.0420). After considering the implications of data normalization, as proposed by Tukey and Placket [66,67], who cautioned that it must be carried out carefully to avoid hiding information, it was decided not to normalize the coverage.
The one-way ANOVA, conducted using the Welch method between average organic carbon levels, confirmed the non-normality of the data and unequal variances, with a p-value < 0.0001, indicating significant differences between the wetlands. It is further affirmed that, across site depths, the Caimanera mangrove swamp exhibits significantly higher carbon reserves per unit area compared to the Llano mangrove swamp, as indicated by the Games–Howell post hoc test for non-equality (Table 5).
Table 5.
Games–Howell Post Hoc Test—Carbon Density (MgC/ha).
4. Conclusions
Medium-resolution satellite imagery enabled precise mapping of both wetlands’ extents. Furthermore, empirical evidence revealed that Colombia’s Caimanera wetland sequesters a larger amount of organic carbon compared to Mexico’s Llano mangrove. Presumably, favorable topographic, hydrogeomorphological, and other conditions contribute to this disparity, providing comparative advantages between the two wetlands. Upon vegetation assessment, the Caimanera exhibited denser foliage with higher organic matter content than the Llano wetland. The evidence indicated that forested areas in both wetlands functioned as more efficient carbon sinks compared to deforested areas. This disparity can be attributed to anthropogenic activities, such as deforestation and construction, which have transformed previously forested areas into sources of carbon emissions. A significant difference in carbon storage capacity was observed between the two studied wetlands, and this trend mirrored the observed differences in wetland coverage.
Based on the conducted research, the gathered data supports the recommendation of implementing reforestation programs in wetlands to mitigate emissions in non-forested areas. This information is pertinent for global carbon budgets, underscoring the necessity for similar studies in tropical and subtropical regions of Latin America. Further investigations of this nature are crucial for maintaining accurate global carbon balances.
Author Contributions
Conceptualization, G.B.-D., L.C.S.H., W.B.-G. and E.A.B.T.; methodology J.L.M.-M., I.M.O.-M. and G.B.-D.; software, G.B.-D. and I.M.O.-M.; validation, G.B.-D. and J.L.M.-M.; formal analysis, G.B.-D., J.L.M.-M. and L.C.S.H.; investigation, G.B.-D., E.A.B.T. and L.C.S.H.; resources, G.B.-D., E.A.B.T. and L.C.S.H.; data curation, G.B.-D., E.A.B.T. and L.C.S.H.; writing—original draft preparation, G.B.-D., E.A.B.T., W.B.-G. and L.C.S.H.; writing—review and editing, E.A.B.T., L.C.S.H., W.B.-G. and J.L.M.-M.; visualization, I.M.O.-M. and W.B.-G.; supervision, L.C.S.H. and E.A.B.T.; Project administration, L.C.S.H. and E.A.B.T. All authors have read and agreed to the published version of the manuscript.
Funding
This research received no external funding.
Data Availability Statement
The data presented in this study are available upon request from the corresponding authors.
Acknowledgments
The first author (G.B.-D.) expresses his gratitude for the scholarship granted by the National Council of Humanities, Sciences and Technologies (CONAHCYT), to study in the Doctorate Program in Engineering Sciences offered by the Tecnológico Nacional de México Campus Misantla registered in the National Postgraduate System of Mexico (SNP). The author also expresses his gratitude to the Universidad de Sucre for all the support given and received for the realization of this study.
Conflicts of Interest
The authors declare no conflicts of interest.
References
- Moreno-Casasola, P.; López Rosas, H.; Infante Mata, D.; Peralta, L.A.; Travieso-Bello, A.C.; Warner, B.G. Environmental and anthropogenic factors associated with coastal wetland differentiation in La Mancha, Veracruz, México. Plant Ecol. 2009, 200, 37–52. [Google Scholar] [CrossRef]
- Ballut-Dajud, G.A.; Sandoval Herazo, L.C.; Fernández-Lambert, G.; Marín-Muñiz, J.L.; López Méndez, M.C.; Betanzo-Torres, E.A. Factors affecting wetland loss: A review. Land 2022, 11, 434. [Google Scholar] [CrossRef]
- Marín-Muñiz, J.L.; Hernández, M.E.; Moreno-Cassasola, P. Comparing soil carbon sequestration in coastal freshwater wetlands with various geomorphic features and plant communities in Veracruz, Mexico. Plant Soil 2014, 378, 189–203. [Google Scholar] [CrossRef]
- Merecí-Guamán, J.; Casanoves, F.; Delgado-Rodríguez, D.; Ochoa, P.; Cifuentes-Jara, M. Impact of shrimp ponds on mangrove blue carbon stocks in Ecuador. Forests 2021, 12, 816. [Google Scholar] [CrossRef]
- Bolívar-Anillo, H.J.; Sánchez, H.; Fernandez, R.; Villate, D.; Anfuso, G. An Overview on Mangrove Forests Distribution in Colombia: An Ecosystem at Risk. J. Aquat. Sci. Mar. Biol. 2019, 2, 16–18. [Google Scholar]
- Tanner, M.K.; Moity, N.; Costa, M.T.; Jarrin, J.R.M.; Aburto-Oropeza, O.; Salinas-de-León, P. Mangroves in the Galapagos: Ecosystem services and their valuation. Ecol. Econ. 2019, 160, 12–24. [Google Scholar] [CrossRef]
- Sasmito, S.D.; Taillardat, P.; Clendenning, J.N.; Cameron, C.; Friess, D.A.; Murdiyarso, D.; Hutley, L.B. Effect of land-use and land-cover change on mangrove blue carbon: A systematic review. Glob. Chang. Biol. Bioenergy 2019, 25, 4291–4302. [Google Scholar] [CrossRef] [PubMed]
- Aljenaid, S.; Abido, M.; Redha, G.K.; AlKhuzaei, M.; Marsan, Y.; Khamis, A.Q.; Alsabbagh, M. Assessing the spatiotemporal changes, associated carbon stock, and potential emissions of mangroves in Bahrain using GIS and remote sensing data. Reg. Stud. Mar. Sci. 2022, 52, 102282. [Google Scholar] [CrossRef]
- Soper, F.M.; MacKenzie, R.A.; Sharma, S.; Cole, T.G.; Litton, C.M.; Sparks, J.P. Non-native mangroves support carbon storage, sediment carbon burial, and accretion of coastal ecosystems. Glob. Chang. Biol. Bioenergy 2019, 25, 4315–4326. [Google Scholar] [CrossRef]
- Ahmed, S.; Sarker, S.K.; Kamruzzaman, M.; Ema, J.A.; Naabeh, C.S.S.; Cudjoe, E.; Pretzsch, H. How biotic, abiotic, and functional variables drive belowground soil carbon stocks along stress gradient in the Sundarbans Mangrove Forest? J. Environ. Manag. 2023, 337, 117772. [Google Scholar] [CrossRef]
- Shedage, S.; Shrivastava, P.K.; Behara, L.K. Carbon rich mangrove forests: An overview for strategic management and climate change mitigation. AIR 2019, 18, 1–9. [Google Scholar] [CrossRef]
- Le Quéré, C.; Andrew, R.M.; Friedlingstein, P.; Sitch, S.; Pongratz, J.; Manning, A.C.; Zhu, D. Global carbon budget 2017. ESSD 2018, 10, 405–448. [Google Scholar] [CrossRef]
- Hernández, M.E.; Moreno-Casasola Barceló, P. Almacenes y flujos de carbono en humedales de agua dulce en México. MyB 2018, 24, e2401881. [Google Scholar] [CrossRef]
- Roychowdhury, T.; Bramer, L.; Hoyt, D.W.; Kim, Y.-M.; Metz, T.O.; McCue, L.A.; Diefenderfer, H.L.; Jansson, J.K.; Bailey, V. Temporal dynamics of CO2 and CH4 loss potentials in response to rapid hydrological shifts in tidal freshwater wetland soils. Ecol. Eng. 2018, 114, 104–114. [Google Scholar] [CrossRef]
- Mitsch, W.J.; Mander, Ü. Wetlands and carbon revisited. Ecol. Eng. 2018, 114, 1–6. [Google Scholar] [CrossRef]
- Jennerjahn, T.C. Relevance and magnitude of ‘Blue Carbon’ storage in mangrove sediments: Carbon accumulation rates vs. stocks, sources vs. sinks. Estuar. Coast. Shelf Sci. 2020, 247, 107027. [Google Scholar] [CrossRef]
- Kauffman, J.B.; Heider, C.; Cole, T.G. Ecosystem Carbon Stocks of Micronesian Mangrove Forests. Wetlands 2011, 31, 343–352. [Google Scholar] [CrossRef]
- Chowdhury, A.; Naz, A.; Sharma, S.B.; Dasgupta, R. Changes in salinity, mangrove community ecology, and organic blue carbon stock in response to cyclones at Indian Sundarbans. Life 2023, 13, 1539. [Google Scholar] [CrossRef]
- Kusumaningtyas, M.A.; Kepel, T.L.; Solihuddin, T.; Lubis, A.A.; Putra, A.D.P.; Sugiharto, U.; Rustam, A. Carbon sequestration potential in the rehabilitated mangroves in Indonesia. Ecol. Res. 2022, 37, 80–91. [Google Scholar] [CrossRef]
- Rovai, A.S.; Twilley, R.R.; Worthington, T.A.; Riul, P. Brazilian mangroves: Blue carbon hotspots of national and global relevance to natural climate solutions. Front. For. Glob. Chang. 2022, 4, 787533. [Google Scholar] [CrossRef]
- Blanco, J.F.; Estrada, E.A.; Ortiz, L.F.; Urrego, L.E. Ecosystem-wide impacts of deforestation in mangroves: The Urabá Gulf (Colombian Caribbean) case study. Int. Sch. Res. Not. 2012, 2012, 2–3. [Google Scholar] [CrossRef]
- Rovai, A.S.; Twilley, R.R. Gaps, challenges, and opportunities in mangrove blue carbon research: A biogeographic perspective. In Dynamic Sedimentary Environments of Mangrove Coasts; Elsevier: Amsterdam, The Netherlands, 2021; pp. 295–334. [Google Scholar] [CrossRef]
- Arifanti, V.B.; Kauffman, J.B.; Ilman, M.; Tosiani, A.; Novita, N. Contributions of mangrove conservation and restoration to climate change mitigation in Indonesia. Glob. Chang. Biol. 2022, 28, 4523–4538. [Google Scholar] [CrossRef] [PubMed]
- Soto, M.; Gama, L.; Gómez, M. Los climas cálidos subhúmedos del estado de Veracruz, México. Foresta Veracruzana 2001, 32, 31–40. [Google Scholar]
- Aguilera, M. La Economía de las Ciénagas del Caribe Colombiano; Banco de la República de Colombia: Bogotá, Colombia, 2011.
- He, N.; Yu, Q.; Wang, R.; Zhang, Y.; Gao, Y.; Yu, G. Enhancement of carbon sequestration in soil in the temperature grasslands of northern China by addition of nitrogen and phosphorus. PLoS ONE 2013, 8, e77241. [Google Scholar] [CrossRef] [PubMed]
- Xiao, Y.; Huang, Z.; Lu, X. Changes of soil labile organic carbon fractions and their relation to soil microbial characteristics in four typical wetlands of Sanjiang Plain, Northeast China. Ecol. Eng. 2015, 82, 381–389. [Google Scholar] [CrossRef]
- Nam, V.N.; Sasmito, S.D.; Murdiyarso, D.; Purbopuspito, J.; MacKenzie, R.A. Carbon stocks in artificially and naturally regenerated mangrove ecosystems in the Mekong Delta. Wetlands Ecol. Manag. 2016, 24, 231–244. [Google Scholar] [CrossRef]
- Kauffman, J.B.; Bhomia, R.K. Ecosystem carbon stocks of mangroves across broad environmental gradients in West-Central Africa: Global and regional comparisons. PLoS ONE 2017, 12, e0187749. [Google Scholar] [CrossRef] [PubMed]
- Yavitt, J.B.; Burtis, J.C.; Smemo, K.A.; Welsch, M. Plot-scale spatial variability of methane, respiration, and net nitrogen mineralization in muck-soil wetlands across a land use gradient. Geoderma 2018, 315, 11–19. [Google Scholar] [CrossRef]
- Harishma, K.M.; Sandeep, S.; Sreekumar, V.B. Biomass and carbon stocks in mangrove ecosystems of Kerala, southwest coast of India. Ecolog. Process. 2020, 9, 1–9. [Google Scholar] [CrossRef]
- Ahmed, S.; Kamruzzaman, M.; Rahman, M.S.; Sakib, N.; Azad, M.S.; Dey, T. Stand structure and carbon storage of a young mangrove plantation forest in coastal area of Bangladesh: The promise of a natural solution. Nat.-Based Solut. 2022, 2, 100025. [Google Scholar] [CrossRef]
- Howard, J.; Hoyt, S.; Isensee, K.; Pidgeon, E.; Telszewski, M. Coastal Blue Carbon: Methods for Assessing Carbon Stocks and Emissions Factors in Mangroves, Tidal Salt Marshes, and Seagrass Meadows; Conservation International, Intergovernmental Oceanographic Commission of UNESCO, International Union for Conservation of Nature: Arlington, VA, USA, 2014; 186p, Available online: https://www.thebluecarboninitiative.org/manual/ (accessed on 10 April 2024).
- Acosta Mireles, M.; Carrillo Anzures, F.; Delgado, D.; Velasco Bautista, E. Establecimiento de parcelas permanentes para evaluar impactos del cambio climático en el Parque Nacional Izta-Popo. Rev. Mex. Cienc. For. 2014, 5, 06–29. [Google Scholar]
- Thakur, S.; Mondal, I.; Ghosh, P.B.; Das, P.; De, T.K. A review of the application of multispectral remote sensing in the study of mangrove ecosystems with special emphasis on image processing techniques. Spat. Inf. Res. 2020, 28, 39–51. [Google Scholar] [CrossRef]
- Copernicus. Available online: https://dataspace.copernicus.eu/ (accessed on 23 July 2022).
- Sun, H.; He, Z.; Zhang, M.; Yen, L.; Cao, Y.; Hu, Z.; Lee, S.Y. Spatial variation of soil properties impacted by aquaculture effluent in a small-scale mangrove. Mar. Pollut. Bull. 2020, 160, 111511. [Google Scholar] [CrossRef] [PubMed]
- Ha, T.H.; Marchand, C.; Aimé, J.; Dang, H.N.; Phan, N.H.; Nguyen, X.T.; Nguyen, T.K.C. Belowground carbon sequestration in a mature planted mangrove (Northern Viet Nam). For. Ecol. Manag. 2018, 407, 191–199. [Google Scholar] [CrossRef]
- Banerjee, K.; Mitra, A.; Villasante, S. Carbon cycling in mangrove ecosystem of Western Bay of Bengal (India). Sustainability 2021, 13, 6740. [Google Scholar] [CrossRef]
- Nur-Hafiza, A.H.; Rosazlin, A.; Wan-Rasidah, K.; Ajeng, A.A.; Mohamad-Fakhri, I.; Nur-Saadah, A.H. Variation in composition of organic marine deposits in sediments and their influence on the growth of Rhizophora spp. in Tanjung piai mangrove forest. JTFS 2023, 35, 82–92. [Google Scholar] [CrossRef]
- Fox, J.; Weisberg, S. Companion to Applied Regression, 3rd ed.; Sage: Newcastle upon Tyne, UK, 2020; Available online: https://socialsciences.mcmaster.ca/jfox/Books/Companion/ (accessed on 2 February 2024).
- The Jamovi Project. Jamovi (Version 2.4) [Computer Software]. 2023. Available online: https://www.jamovi.org (accessed on 7 April 2024).
- R Core Team. R: A Language and Environment for Statistical Computing. (Version 4.1) [Computer Software]. 2022. Available online: https://cran.r-project.org (accessed on 7 April 2024).
- Nguyen, H.; Nghia, N.; Nguyen, H.T.; Le, A.; Tran, L.; Duong, L.; Furniss, M. Classification methods for mapping mangrove extents and drivers of change in Thanh Hoa province, Vietnam during 2005–2018. For. Soc. 2020, 4, 225–242. [Google Scholar] [CrossRef]
- Chowdhury, M.S.; Hafsa, B. Multi-decadal Land Cover Change Analysis over Sundarbans Mangrove Forest of Bangladesh: A GIS and Remote Sensing Based Approach. Glob. Ecol. Conserv. 2022, 37, e02151. [Google Scholar] [CrossRef]
- Bolívar-Anillo, H.J.; Visbal, A.Z.; Serrano, M.C.; Moreno, H.S.; Daza, D.A.V. A Preliminary Review on the Importance of Colombian Mangroves as a Source of Endophytic Microorganisms Relevant in Pharmaceutical Industry. J. Acupun. Tradit. Med. 2020, 3, 006. [Google Scholar]
- Thorhaug, A.L.; Poulos, H.M.; López-Portillo, J.; Barr, J.; Lara-Domínguez, A.L.; Ku, T.C.; Berlyn, G.P. Gulf of Mexico estuarine blue carbon stock, extent and flux: Mangroves, marshes, and seagrasses: A North American hotspot. Sci. Total Environ. 2019, 653, 1253–1261. [Google Scholar] [CrossRef]
- Gillis, L.G.; Belshe, E.F.; Narayan, G.R. Deforested mangroves affect the potential for carbon linkages between connected ecosystems. Estuaries Coasts 2017, 40, 1207–1213. [Google Scholar] [CrossRef]
- Navarro, K.S.; Tello, A.D.O.; Aponte, H.; Lobato-de Magalhães, T. Wetland Science in Latin America and the Caribbean Region: Insights into the Andean States. Wetland Sci. Pract. 2020, 37, 232–240. Available online: https://members.sws.org/wetland-science-and-practice/Details/october-2020-wetland-science-practice-46859 (accessed on 15 January 2024). [CrossRef]
- Eid, E.M.; Khedher, K.M.; Ayed, H.; Arshad, M.; Moatamed, A.; Mouldi, A. Evaluation of carbon stock in the sediment of two mangrove species, Avicennia marina and Rhizophora mucronata, growing in the Farasan Islands, Saudi Arabia. Oceanología 2020, 62, 200–213. [Google Scholar] [CrossRef]
- Yáñez-Arancibia, A.; Twilley, R.R.; Lara-Domínguez, A.L. Los ecosistemas de manglar frente al cambio climático global. Madera Y Bosques 1998, 4, 3–19. [Google Scholar] [CrossRef]
- Cortés-Esquivel, J.L.; Herrera-Silveira, J.; Quintana-Owen, P. Organic matter content in mangrove soils from a karstic environment: Comparison between thermogravimetric and loss-on-ignition analytical techniques. Forest 2023, 14, 1469. [Google Scholar] [CrossRef]
- Marin-Muñiz, J.L.; Hernández, M.E. Carbon balance in tropical freshwater wetland on the coastal plain of the Gulf of Mexico. Limnetica 2020, 39, 653–665. Available online: https://dialnet.unirioja.es/servlet/articulo?codigo=7809315 (accessed on 3 March 2024).
- Hatje, V.; Masqué, P.; Patire, V.F.; Dórea, A.; Barros, F. Blue carbon stocks, accumulation rates, and associated spatial variability in Brazilian mangroves. Limnol. Oceanogr. 2021, 66, 321–334. [Google Scholar] [CrossRef]
- Simpson, L.T.; Stein, C.M.; Osborne, T.Z.; Feller, I.C. Mangroves dramatically increase carbon storage after 3 years of encroachment. Hydrobiologia 2019, 834, 13–26. [Google Scholar] [CrossRef]
- Wu, Y.; Ricklefs, R.E.; Huang, Z.; Zan, Q.; Yu, S. Winter temperature structures mangrove species distributions and assemblage composition in China. Glob. Ecol. Biogeogr. 2018, 27, 1492–1506. [Google Scholar] [CrossRef]
- Ximenes, A.C.; Ponsoni, L.; Lira, C.F.; Dahdouh-Guebas, F.; Koedam, N. Seasonal atmospheric and oceanographic factors influencing poleward mangrove expansion in the southeastern American coast. Estuar. Coast. Shelf Sci. 2021, 262, 107607. [Google Scholar] [CrossRef]
- Larcher, W. Physiological Plant Ecology: Ecophysiology and Stress Physiology of Functional Groups; Springer: Berlin/Heidelberg, Germany, 2003; p. 514. [Google Scholar]
- Santos-Andrade, M.; Hatje, V.; Arias-Ortiz, A.; Patire, V.F.; da Silva, L.A. Human disturbance drives loss of soil organic matter and changes its stability and sources in mangroves. Environ. Res. 2021, 202, 111663. [Google Scholar] [CrossRef] [PubMed]
- Fujimoto, K.; Ono, K.; Tabuchi, R.; Lihpai, S. Findings from long-term monitoring studies of Micronesian mangrove forests with special reference to carbon sequestration and sea-level rise. Ecol. Res. 2023, 38, 494–507. [Google Scholar] [CrossRef]
- Ward, R.; Lacerda, L.; da Silva Cerqueira, A.; Giarrizzo, T. Amazonian vegetated estuarine ecosystem as a global hotspot in carbon sequestration. Res. Sq. 2023, 1, 1–27. [Google Scholar] [CrossRef]
- Chen, S.; Chen, B.; Chen, G.; Ji, J.; Yu, W.; Liao, J.; Chen, G. Higher soil organic carbon sequestration potential at a rehabilitated mangrove comprised of Aegiceras corniculatum compared to Kandelia obovata. Sci. Total Environ. 2021, 752, 142279. [Google Scholar] [CrossRef] [PubMed]
- Taillardat, P. Going local: How coastal environmental settings can help improve global mangrove carbon storage and flux estimates. Geophys. Res Lett. 2022, 49, e2022GL101979. [Google Scholar] [CrossRef]
- Chen, S.; Chen, B.; Sastrosuwondo, P.; Dharmawan, I.W.E.; Ou, D.; Yin, X.; Chen, G. Ecosystem carbon stock of a tropical mangrove forest in North Sulawesi, Indonesia. Acta Ocean. Sin. 2018, 37, 85–91. [Google Scholar]
- Arias-Ortiz, A.; Masqué, P.; Glass, L.; Benson, L.; Kennedy, H.; Duarte, C.M.; Lovelock, C.E. Losses of soil organic carbon with deforestation in mangroves of Madagascar. Ecosystems 2021, 24, 1–19. [Google Scholar] [CrossRef]
- Tukey, J.W. Exploratory data analysis: Past, present and future. DTIC 1993, 2, 102. Available online: https://apps.dtic.mil/sti/citations/ADA266775 (accessed on 10 April 2024).
- Plackett, R.L. The analysis of categorical data. Griffin 1981, 8, 159. [Google Scholar]


Disclaimer/Publisher’s Note: The statements, opinions and data contained in all publications are solely those of the individual author(s) and contributor(s) and not of MDPI and/or the editor(s). MDPI and/or the editor(s) disclaim responsibility for any injury to people or property resulting from any ideas, methods, instructions or products referred to in the content. |
© 2024 by the authors. Licensee MDPI, Basel, Switzerland. This article is an open access article distributed under the terms and conditions of the Creative Commons Attribution (CC BY) license (https://creativecommons.org/licenses/by/4.0/).