Abstract
Adopting strategies to reduce meat consumption can help overcome environmental problems associated with meat-based diets, including water scarcity and pollution, soil erosion, and global hunger. Increasing vegetarian diets can result in significant environmental benefits and has been focused on as a way to mitigate environmental changes. Therefore, this study aimed to identify the antecedents affecting customers’ storytelling and subjective well-being in vegetarian restaurants from an eco-friendly perspective. For the surveyed vegetarian restaurants, the four most frequently used by restaurant consumers were selected through a pilot test. Data collection was conducted online through a research company, and a sample of Koreans who responded that visiting at least one of the four selected vegetarian restaurants was selected. Among the 297 questionnaires, a total of 262 valid questionnaires were used for analysis. As a result of the verification, among the respondents, the proportion of women was higher, and the number of individuals in their 20s and 30s who responded was higher than that of people in their 40s and 50s. Affective quality showed the greatest positive influence on experiential quality, followed by physical environmental quality and interaction quality. However, the effects of the outcome quality on the experiential quality were not significant. Additionally, experiential quality was found to have a positive effect on experiential satisfaction, and experiential satisfaction was found to have a positive effect on storytelling and subjective well-being. These results provide useful insights for enhancing customers’ storytelling and subjective well-being in vegetarian restaurants. The design and results of this study contribute to the literature on eco-friendly vegetarian restaurants in the food service industry through theoretical and practical implications.
1. Introduction
The importance of environmental social governance (ESG), which considers human health and the global environment, has increased. Interest in improving agricultural technology, reducing food waste, and improving vegetarian diets is also increasing [1]. The restaurant sector is a major producer of food and other resource waste, resulting in significant greenhouse gas (GHG) emissions, resource waste, and business costs [2]. Of the 88–100 million tonnes of food waste in Europe, 12%, or 10.5 million tonnes comes from food service in the hospitality sector, which includes quick-service restaurants, casual and fine-dining restaurants, and contract catering (canteens, prisons, hospitals, schools, etc.) [3]. Adopting strategies to reduce meat consumption in the hospitality sector can help overcome environmental problems associated with meat-based diets, including water scarcity and pollution, soil erosion, and global hunger [4]. Previous research has demonstrated that carbon emissions can be minimized by limiting meat consumption, which also significantly reduces the greenhouse effect caused by careless food production and consumption [5]. Excluding meat from an individual’s diet is commonly known as vegetarianism [4]. Vegetarianism has become a means to improve public health and reduce human impact on the environment (e.g., by reducing GHG emissions from livestock) [6]. Therefore, an increasing number of people are choosing to switch to a vegetarian lifestyle for various reasons, including health, ethics, and environmental concerns [7]. To accommodate this important need for vegetarian and non-vegetarian customers who prefer vegetarian menus, many restaurants have created vegetarian menus and replaced some animal proteins with plant-based sources [8]. Increasing vegetarian diets can result in significant environmental benefits and has been a focus for mitigating environmental changes [6,9].
There is criticism that it is difficult to accurately identify the quality of tourism perceived by tourists because the concept of measuring service quality is too limited or comprehensive in its attributes to reflect the diverse needs and pursuits of consumers [10]. In particular, in areas such as tourist destinations, experiential quality (EQ) has been suggested as a more appropriate concept than service quality [11]. This is because, while existing service quality reflects only the cognitive perspective of tourists, EQ can understand affective experiences, including the emotional responses of tourists who seek to satisfy their psychological desires through tourism activities [12]. Thus, EQ emerged in the tourism sector. Unlike service quality, EQ has received little attention in the hospitality industry. In particular, no research has shed light on the EQ of specific hospitality engagements, such as eating at a vegetarian restaurant. Several studies [13,14,15] argue that EQ is a prerequisite for experiential satisfaction. Because EQ is a cognitive evaluation, positive EQ perceptions lead to experiential satisfaction, which, in turn, can lead to favorable behavioral intentions [15]. Therefore, EQ plays a key role in increasing experiential satisfaction [13,16].
After the experience, service performance is remembered as an emotional response and delivered in the form of storytelling [17]. Consumers share experiences and experience pleasure through storytelling (e.g., SNS and word-of-mouth) [18]. Line, Hanks, and Dogru [19] and Chen, Law, and Yan [20] highlight that electronic word-of-mouth (eWOM) monitoring is very important for restaurants because many restaurant consumers read and share information about their experiences on social media [21]. Word of mouth (WOM) reflects the affective aspects of a customer’s experience with opinions comprising personal feelings and judgements [22]. Positive word-of-mouth (WOM) communication from tourists satisfied with their experiences has become a major source of competitive advantage [17]. According to Wu’s [13] study on EQ in the restaurant sector, the EQ of coffee shops had a positive effect on loyalty, which consists of word-of-mouth intention and revisit intention, through experience satisfaction. Satisfaction is one of the variables predicting eWOM intentions; if customers are satisfied, the outcome will be positive evaluations, including positive eWOM [23]. Experiences also influence the quality of life and improve subjective well-being [24]. Subjective well-being refers to the cognitive evaluation of an individual’s life status [25]. According to spillover theory, satisfaction contributes to subjective well-being in the long run [25,26]. Previous studies [27,28,29] also pointed out that customers’ subjective well-being is formed by satisfaction with the consumption process [30]. Therefore, to measure not only customers’ cognitive evaluations of vegetarian restaurants but also their affective responses, an in-depth investigation of the factors leading to EQ, satisfaction, storytelling, and subjective well-being is needed.
Previous EQ studies in the context of tourism and hospitality have mainly focused on heritage tourism [11,14], green hotels and lodging [31,32], cruises [15], coffee shops [13,33], and restaurants [34]. However, this study targeted vegetarian restaurants in response to consumers’ growing demands for health and the environment. Previous studies in the tourism and hospitality field have shown that EQ plays an important role in tourist and consumer behaviors. However, to date, no research has applied EQ to investigate its role as an antecedent influencing consumer behavior toward eco-friendly or vegetarian restaurants. To date, no study has examined the relationship between experiential satisfaction, storytelling, and subjective well-being in a vegetarian restaurant context. This study attempts to fill this gap by integrating EQ, experiential satisfaction, storytelling, and subjective well-being to identify the relationships between variables. The design of this study differs from those of previous studies that applied EQ to the hospitality sector [13,33,34], because it is the first study to apply EQ in the context of vegetarian restaurants. Through the analysis results, we overcome the limitations of service quality that only reflect the consumer’s cognitive perspective and provide insight into understanding the emotional experience, including the consumer’s emotional response. This study makes a theoretical contribution to the food service literature. Our study also provides strong practical implications for food service industry professionals in guiding them to develop management strategies for sustainable vegetarian restaurants. Additionally, this study provides basic data for research on the stable acceptance and spread of eco-friendliness in the food service business.
2. Literature Review and Hypotheses
2.1. Experiential Quality
SERVQUAL, a measure of service quality, has received significant criticism despite its widespread use [31]. Fick and Ritchie [35] argued that the SERVQUAL scale does not adequately address both affective and holistic factors that contribute to the overall quality of service experience [11]. Thus, EQ is proposed as an alternative concept. Crompton and Love [36] refer to EQ as encompassing “not only the attributes provided by a supplier but also the attributes brought to the opportunity by the customer”. Lemke, Clark, and Wilson [37] define EQ as the perceived judgment of the excellence or superiority of a customer’s experience. Klaus and Maklan [38] define EQ as the cognitive and emotional perception of an object linked to consumer purchasing behavior. Otto and Ritchie [39] compared service quality and EQ. According to them, service quality is objectively measured based on the attributes of external factors, such as the service environment and service provider, and the evaluation of cognitive factors, such as functional and practical benefits, is considered important. In contrast, EQ is measured subjectively based on the consumer’s overall internal factors, and the evaluation of emotional factors, such as experiential, hedonic, and symbolic factors, is considered important. Previously, EQ referred only to the attributes of the service quality that a company provided to its customers; however, today, the concept of EQ has changed to an overall judgment of customer experience regarding the service received by the customer [33].
In the tourism context, service quality refers to service performance at the attribute level, whereas EQ refers to the psychological outcomes resulting from tourists’ participation in tourism activities [11,14]. Therefore, EQ is conceptualized as tourists’ emotional responses to desired social and psychological benefits [11,14]. This assigned aspect of quality arises from the customer’s tendency to evaluate the quality of an experience based on personal emotional responses rather than on functional or utilitarian criteria [32].
Several studies in the hospitality and tourism literature have focused on EQ dimensions. De Rojas and Camarero [40] suggested that EQ in a heritage context consists of interaction, physical environment, and outcome qualities. Wu, Ai, and Cheng [31] proposed interaction quality, physical environment quality, outcome quality, access quality, and administration quality as the EQ of green hotels. Wu, Cheng, and Ai [15] used interaction, physical environment, outcome, and access quality as the primary dimensions of EQ to measure the EQ of a cruise. Wu [13] proposed interaction, physical environment, outcome, and affective qualities to measure the quality of the customer experience at strawberry coffee shops. Interaction quality is the process by which services are delivered to customers, and interpersonal interactions are the most important factors in determining customers’ positive perceptions of experience quality [41]. Physical environment quality refers to the quality of the physical environment or constructed facility within which service provision occurs [42]. Physical environmental quality includes ambience, aesthetics, food and beverages, cleanliness, temperature/lighting, facilities, design, and location [31]. Outcome quality focuses on the results of service actions, indicating what the customer actually gets from the service; that is, whether the outcome quality satisfies the customer’s needs and desires [13,43]. Affective quality is defined as the ability to bring about changes in core affect [44]. The existing literature includes happiness and excitement as affective qualities [13]. Several tourism and hospitality studies (e.g., de Rojas and Camarero [40]; Kao et al. [45]; Wu [13]; Wu and Ai [46]; Wu et al. [31]; Wu et al. [15]) have determined that EQ should be measured based on a multidimensional and hierarchical model to appropriately measure tourists’ or customers’ perceptions of EQ [15]. In this study, considering the vegan restaurant context, a multidimensional and hierarchical model was designed by applying the interaction, physical environment, outcome, and affective qualities proposed by Wu [13] for coffee shops.
Several hospitality and tourism studies have confirmed the relationship between the primary dimensions of EQ and EQ. Wu and Ai [46] confirmed the relationship with overall EQ by constructing the primary dimensions of EQ in golf tourism: interaction quality, physical environment quality, outcome quality, and access quality. All four factors had a positive effect on the EQ. Wu et al. [15] confirmed that, among the primary dimensions of cruise EQ, interaction quality and outcome quality strengthen the overall EQ. Wu et al. [31] reported that in the context of green hotels, the EQ perceived by customers is strongly positively influenced by interaction quality and physical environment quality. Wu [13] identified the perceived interaction quality, physical environment quality, outcome quality, and affective quality of strawberry coffee shops as antecedents that increased overall EQ. In this way, in previous studies, the four primary dimensions of EQ (interaction quality, physical environment quality, outcome quality, and affective quality) were identified as important antecedents that increase overall EQ. Therefore, this study proposes four primary dimensions as important predictors of overall EQ in vegetarian restaurants. Accordingly, the following hypothesis is proposed:
Hypothesis 1.
Interaction quality has a significantly positive effect on EQ.
Hypothesis 2.
Physical environment quality has a significantly positive effect on EQ.
Hypothesis 3.
Outcome quality has a significantly positive effect on EQ.
Hypothesis 4.
Affective quality has a significantly positive effect on EQ.
2.2. Experiential Satisfaction
Satisfaction, one of the most important factors influencing customers’ future behavior, has been extensively studied as an organizational goal, especially in the highly competitive hotel and tourism industries [47]. A key underlying concept of satisfaction is the expectancy–disconfirmation model, which postulates that perceived performance that exceeds consumer expectations leads to customer satisfaction [48]. According to Parasuraman, Zeithaml, and Berry [49], satisfaction is viewed as a positive or negative outcome compared to expectations. Satisfaction is another important variable in experience [50]. Anderson, Fornell, and Lehmann [51] suggested that satisfaction is an overall evaluation of a purchased product or service based on previous experiences [31]. Rust and Oliver [43] define satisfaction as the degree to which one believes that an experience evokes positive emotions. Experiential satisfaction derives from the concept of service satisfaction but extends beyond service satisfaction in that it focuses on the consumer’s overall evaluation of the post-consumption experience [14,45]. Experiential satisfaction is conceptualized from an experiential perspective and is defined as the result of a customer’s overall evaluation of the content presented by the service provider [15]. Hence, experiential satisfaction is the response of the fulfilment adopted to understand and assess value through customer experience [52]. Recently, customer dining satisfaction has attracted much attention from researchers as an interest that reflects customers’ systematic evaluation of restaurant quality attributes at the experiential level [34,53].
Because EQ is an emotional response, positive EQ leads to experiential satisfaction [16]. Several tourism and hospitality studies have confirmed that EQ is an antecedent of experiential satisfaction. Chen and Chen [11] and Wu and Li [14] confirmed that the quality of heritage tourism enhances tourists’ experiential satisfaction. Wu and Ai [46] stated that the quality of the golf tourism experience has a positive effect on experiential satisfaction. In studies targeting Starbucks coffee shops, Lacap and Sicat [33] and Wu [13] found that the EQ perceived by customers plays an important role in forming experiential satisfaction. Therefore, the following hypothesis is proposed:
Hypothesis 5.
EQ has a significantly positive effect on experiential satisfaction.
2.3. Storytelling
Storytelling refers to describing an experience in a coherent narrative format with the audience’s perspective in mind [17,54]. According to Delgadillo and Escalas [55], WOM communication is typically delivered through narrative storytelling. Storytelling is also considered “the art of narrating real or fictional events using words, pictures, and audio” on online and offline media and communication platforms [56,57]. Today, consumers are becoming more active in creating and sharing content over the Internet [21,24,58]. Storytelling contributes greatly as a source of consumer information because consumers trust the experiences of personal information providers, such as friends, family, and neighbors, much more than advertisements [59]. This aspect of storytelling is strategically important for strengthening engagement with social communities and for communicating service quality, relationships, and experiences without business influence [57,60]. This study considers both online (e.g., social media narratives) and offline formats (e.g., WOM and verbal narratives) of storytelling intent [61].
Customer-led storytelling behavior in the hospitality industry involves sharing information in the form of stories through WOM communication [18,55]. With the spread of social media, customers have become more willing to share their dining experiences with others on restaurant review websites or online communities [34,62,63]. Customers share their gastronomic experiences by posting articles and photos of food and restaurant facilities on SNS using smartphones [21].
Several authors have studied the impact of customer satisfaction on storytelling in the tourism and hospitality industries. Yang [64] confirmed that satisfaction, a restaurant experience element, is an antecedent that strengthens eWOM. Chinelato, de Oliveira, and Souki [21] reported that satisfaction with á la carte restaurants in Peru increases eWOM. Uslu [65] confirms that satisfaction plays an important role in forming eWOM and behavioral intentions in a restaurant situation. Cater, Albayrak, Caber, and Taylor [57] reported that the overall satisfaction of scuba diving tourists positively affected storytelling intention. Therefore, the following hypothesis is proposed:
Hypothesis 6.
Experiential satisfaction has a significantly positive effect on storytelling.
2.4. Subjective Well-Being
Research on well-being has been conducted from two philosophical perspectives: the hedonic and eudaimonic approaches [66]. The hedonic approach focuses on happiness and views well-being from the perspective of achieving pleasure and avoiding pain [63]. In applied psychology research, hedonistic approaches are said to reflect affective states and emotional experiences and seek to show how people experience their lives emotionally. From the hedonic perspective, well-being is represented by subjective well-being [67]. Subjective well-being is a scientific term for how people evaluate their lives [68] and refers to the evaluation of one’s life as satisfactory [24,69]. Subjective well-being is based on the subjective perceptions people use to evaluate the hedonic balance between pleasant and unpleasant effects (e.g., joy and sadness) in their lives [30,68]. A person’s subjective evaluation of their life may be based purely on cognitive or affective foundations or a combination of the two [24,70]. Therefore, the concept of subjective well-being generally also includes life satisfaction, which is a cognitive evaluation of an individual’s quality of life experience and emotional responses in the form of positive and negative factors [71,72].
In certain domains (e.g., tourism and restaurant situations), subjective well-being and overall quality of life can be conceptualized based on experience [73]. Meng and Choi [30] stated that the higher the evaluation (i.e., satisfaction) of the dining experience, the higher the overall quality of life and subjective well-being. Su et al. [24] confirmed that Chinese tourists’ overall satisfaction was an antecedent of increased subjective well-being. Wang, Lai, and Wang [25] found that overall satisfaction with a travel experience enhances subjective well-being in luxury travel situations. A study by Saayman, Uysal, and Song [74] also showed that tourists’ overall satisfaction has a positive effect on subjective well-being. Therefore, the following hypothesis is proposed:
Hypothesis 7.
Experiential satisfaction has a significantly positive effect on subjective well-being.
By integrating experience quality, experiential satisfaction, storytelling, and subjective well-being to identify relationships between variables, this study provides strong practical implications for professionals in the food service industry, guiding them in developing management strategies for sustainable vegan restaurants. All hypotheses set for this purpose belong to the research model shown in Figure 1.
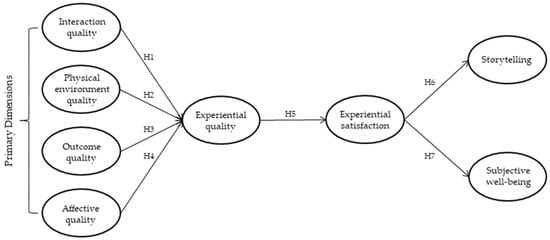
Figure 1.
Conceptual model experiential quality.
3. Methodology
3.1. Research Instrument
The factors in this study consist of four primary dimensions of EQ (interaction quality, physical environment quality, outcome quality, and affective quality) and eight factors: EQ, satisfaction, storytelling, and subjective well-being. The questions on the four primary dimensions were cited as 12 questions from Wu et al. [31], Wu [13], and Wu, Cheng, Chen, and Hong [32]. Three questions on experience quality were taken from Wu et al. [31] and Wu [13], and four questions on satisfaction were taken from Wu et al. [31] and Wu et al. [32]. Four questions on storytelling were taken from Manthiou, Kang, and Hyun [75] and Yoo et al. [18], and three questions on subjective well-being were taken from Su et al. [24] and Meng and Choi [30].
This study first organized the survey questions through a literature review and modified them to suit the context of vegetarian restaurants. Since all the questions in the survey were developed in English in previous studies, the questionnaire was redeveloped using the double translation protocol [76]. The questionnaire was developed in English first and then translated into Korean by two bilingual (Korean-English) Korean professors who had sufficient understanding of this study in Korea. Prior to the survey, a pilot test was conducted to determine whether participants could fully comprehend the survey questions. After the pilot test, based on an exploratory factor analysis, questions that were difficult to measure accurately were removed. After the survey was completed, the Korean version was translated back into English by two bilingual (English-Korean) American professors from related fields in order to be of use in this study. There was little difference between the two English versions of the survey. The measured items were used on a 5-point Likert-type scale.
3.2. Sampling and Data Collection
Survey participants were selected as residents of South Korea aged 20 years or older who had experience using vegetarian restaurants within the past three months. We first considered the 10 restaurants selected in “100 Taste of Seoul 2023 at a Glance” as the vegetarian restaurants to be surveyed [77]. And “MONK’s BUTCHER, Forest Kitchen, Base in nice, PLANT,” which was identified as the most frequently used vegetarian restaurant by restaurant consumers through a pilot test, was finally selected as the restaurant to be investigated. The users of these four vegetarian restaurants can be considered representative of all vegetarian restaurant users.
Data were collected from 1 September to 15 September 2023, through a global online research company. The respondents were asked two screening questions before being invited to participate in the interviews. Have you visited one or more of “MONK’s BUTCHER, Forest Kitchen, Base in nice, PLANT” within the last 3 months? Do you know if “MONK’s BUTCHER, Forest Kitchen, Base in nice, PLANT” is a vegetarian restaurant? If there was no response, the survey was terminated. Of the 5000 people who responded to the survey, 297 answered ‘yes’ to the two questions. Among the 297 collected survey questionnaires, a total of 262 usable questionnaires were obtained after eliminating incomplete and unusable responses (usable response rate = 88.2%). The demographic characteristics of the participants are shown in Table 1.

Table 1.
Demographic characteristics of participants.
3.3. Data Analysis
SPSS 25.0 and AMOS 25.0 were used for data analysis. The two-step approach proposed by Anderson and Gerbing [78] was used. First, a confirmatory factor analysis (CFA) was performed to test the suitability of the measurement model and evaluate convergent and discriminant validity. Structural equation modeling (SEM) was performed to test the structural relationships between the latent constructs.
4. Data Analysis and Results
4.1. Measurement Model
The measurement model using a CFA was generated to test convergent and discriminant validity. To estimate the measurement model fit, χ2/df (<3), GFI (>0.90), RMSEA (<0.08), RMR (<0.08), NFI (>0.9), IFI (>0.9), CFI (>0.9), seven common model fit measurements were used [79]. The fit statistics of the model was satisfactory (χ2 = 519.794, df = 263, χ2/df = 1.976, RMR = 0.040, GFI = 0.876, NFI = 0.894, IFI = 0.945, CFI = 0.944, RMSEA = 0.061) (See Table 2). We also examined the measurement model to verify its convergent and discriminant validity. First, the average variance extracted (AVE) was calculated. The values ranged from 0.675 to 0.802 (See Table 2). These values were all above the cutoff of 0.50 [79]. In addition, all standardized factor loadings were significant at the 0.01 level. Second, the composite reliability values ranged from 0.862 to 0.923 (see Table 2). All values were more than the Hair, Hult, Ringle, and Sarstedt [79] recommended threshold of 0.70, thus indicating an adequate level of reliability for the research variables. These findings indicated the acceptable level of convergent validity. Subsequently, to evaluate discriminant validity, the AVE square root of each latent variable was compared with the corresponding correlation coefficient between the latent variables [80]. Table 3 indicates adequate discriminant validity in that the AVE square root of each latent variable was greater than the corresponding correlation coefficient.
Table 2.
Measurement model assessment.
Table 3.
Analysis of correlations between the variables.
4.2. Common Method Bias
The only instrument used in this study was a questionnaire; therefore, common method bias (CMB) may exist. Therefore, Harman’s single-factor test was performed. To this end, we loaded all variable items into a single factor without rotation and performed an exploratory factor analysis (EFA). The EFA was performed by injecting 26 measurement items, including interaction quality, physical environment quality, outcome quality, affective quality, EQ, experiential satisfaction, storytelling, and subjective well-being. The analysis confirmed that there was no CMB because the variance of a single factor was explained at 44.2%, satisfying the criterion of less than 50% [81].
4.3. Structural Model
The fit of the structural model describing the relationships among the constructs was assessed to test the hypotheses established using SEM path coefficients. The model fit indices were χ2 = 589.391, df = 277, p = 0.000, CMIN/df = 2.128, RMR = 0.045, GFI = 0.855, NFI = 0.880, IFI = 0.933, CFI = 0.932, and RMSEA = 0.066, meeting the standard assessment criteria. Table 4 presents the results of each hypothesis test describing the causal relationship between any pair of constructs. H1 examines whether interaction quality positively influences EQ. The result was supported because interaction quality positively and significantly influences EQ (β = 0.133, t = 2.709, p = 0.007). H2 examines whether physical environment quality positively influences EQ. The result was supported because physical environment quality positively and significantly influences EQ (β = 0.277, t = 3.674, p = 0.000). H3 examines whether outcome quality positively influences EQ. The result was rejected because outcome quality negatively and significantly influences EQ (β = 0.074, t = 1.411, p = 0.158). H4 examines whether affective quality positively influences EQ. The result was supported because affective quality positively and significantly influences EQ (β = 0.578, t = 8.081, p = 0.000). H5 examines whether EQ positively influences experiential satisfaction. The result was supported because EQ positively and significantly influences experiential satisfaction (β = 0.862 t = 12.215, p = 0.000). H6 examines whether experiential satisfaction positively influences storytelling. The result was supported because experiential satisfaction positively and significantly storytelling (β = 0.842, t = 10.394, p = 0.000). Lastly, H7 examines whether experiential satisfaction positively influences subjective well-being. The result was supported because experiential satisfaction positively and significantly subjective well-being (β = 0.859, t = 12.196, p = 0.000).
Table 4.
Hypothesis test results.
5. Discussion
This study established four primary dimensions of EQ and experiential satisfaction as antecedents of customer storytelling and the subjective well-being of vegetarian restaurants and confirmed their influence on relationships. Four vegetarian restaurants in South Korea were selected through a pilot test, and customers who had experience using at least one of these restaurants were selected as the sample.
The results confirmed that the EQ of vegetarian restaurants was positively influenced by interaction quality, physical environment quality, and affective quality, among the primary dimensions of EQ. These three factors have been identified as important variables for vegetarian restaurants. Affective quality appears to be the most influential variable on EQ. These results partially support those of previous studies [13,31] targeting green hotels and coffee shops in the hospitality sector. This means that the pleasure and comfort that customers feel while staying at a vegetarian restaurant are the most important factors in positively perceiving EQ. Additionally, the eco-friendly physical environment provided by vegetarian restaurants and interactions with staff also plays an important role in strengthening the emotional experience of customers. However, the influence of the outcome quality on the EQ was found to be insignificant, which does not support the results of a previous study [13]. This means that the service and food quality provided in restaurants are somewhat lacking in making the experience better than expected.
Overall, EQ, formed by the primary dimensions of EQ, was found to have a positive effect on experiential satisfaction. This is consistent with the claims of previous studies [12,31], which identified EQ as an important indicator of experiential satisfaction in the food service industry. As in general restaurants, a great dining experience in a vegetarian restaurant—formed by interaction with customers and employees, physical environment, happiness, and enjoyment—leads to improved customer satisfaction. Experiential satisfaction was found to have a positive effect on storytelling. This is consistent with the results of Chinelato et al. [21], Uslu [65], and Yang [64], who targeted general restaurants. Even in vegetarian restaurants, customers who are satisfied with their dining experience have a strong intention to share their experiences through SNS or WOM. In addition, experiential satisfaction had a positive effect on subjective well-being. This finding is consistent with the results of Meng and Choi [31] regarding dining experiences. This means that customer happiness increases because of the experiential satisfaction that they feel at a vegetarian restaurant.
5.1. Theoretical Implications
The EQ theory used in this study has several important implications. Quality in restaurant situations has been studied mainly through the cognitive evaluation of customers based on service quality theory. However, service quality has been criticized as being too limited or incomprehensive in its attributes to reflect the diverse needs and pursuits of consumers [10]. Therefore, this study is different in that it applies EQ theory to measure not only customers’ cognitive evaluations but also their emotional responses. In addition, the EQ theory was applied to vegetarian restaurants at a time when the importance of the environment and health increased after the COVID-19 pandemic, and restaurant consumers’ interest in vegetarian food increased accordingly.
In addition, this study confirmed the relationship between the primary dimensions of EQ and experiential satisfaction, storytelling, and subjective well-being to confirm consumer behavior toward vegetarian restaurants. This study design has not been attempted in previous studies on EQ [14,31,32,46]. The results showed that affective quality, physical environment quality, and interaction quality are important for improving customers’ EQ and satisfaction with vegetarian restaurants. Similar to Wu [13], the only previous study that applied interaction quality, physical environment quality, outcome quality, and affective quality to coffee shops, this study also confirmed that affective quality was the most important primary dimension of EQ. However, unlike previous research [13], interaction quality was confirmed to be an important antecedent in vegetarian restaurants. Coffee shops and vegetarian restaurants are sectors of the food service industry, but in vegetarian restaurants, unlike coffee shops, interaction and bonding with employees in the process of delivering services to customers is very important. This is the largest theoretical difference from previous research [13]. Additionally, it was confirmed that experiential satisfaction, which is positively formed in customers by EQ, is an important antecedent to storytelling and subjective well-being. As the use of SNS has become a daily routine for consumers, this study differs from previous EQ studies [11,13,14,31,32,33,34,46] in the tourism and hospitality fields by identifying an antecedent that strengthens consumers’ storytelling intentions online and offline. Ultimately, this study contributes to the hospitality literature by applying EQ theory, which has been mainly applied to the non-eco-friendly tourism and hospitality industry and eco-friendly vegetarian restaurants, and identifying its role therein.
5.2. Practical Implications
The results show that affective quality is the most essential dimension of EQ. Therefore, from a practical perspective, the affective quality perceived by customers of vegetarian restaurants should be strengthened. It is important to ensure that customers feel pleasant and relaxed when staying at vegetarian restaurants. These positive emotions arise when various factors within a vegetarian restaurant collaborate. Vegetarian restaurants should not only focus on food for the sake of health and personal preference but should also implement environmentally friendly practices. In particular, from the perspective of a tangible service environment, not only vegetarian-based food but also the interior design, tableware, utensils, and employee clothing should highlight an eco-friendly appeal and harmonize with each other. Additionally, lighting, background music, comfortable seating, comfortable indoor temperature, and the overall atmosphere are necessary elements for customer comfort. Strengthening interactions with employees, which is an intangible service, is also important. Employees’ service skills, food and beverage expertise, and complaint-handling abilities must be improved through training, and a service mindset that responds to customers must also be strengthened.
Customers who are satisfied with restaurants try to share their experiences with people around them through SNS or WOM. Since the beginning of the COVID-19 pandemic, smart devices have further amplified non-face-to-face culture and social media communication [18]. Customers play an important role in maximizing marketing effectiveness because they share their experiences at restaurants through photos or videos. Therefore, vegetarian restaurant operators need to provide interesting visual elements (e.g., food, interiors, and props) to help customers tell stories. Additionally, the operator will be able to achieve a stronger marketing effect if they operate their SNS or YouTube channel for vegetarian restaurants.
Customers’ subjective well-being is formed during the consumption process [30]. Therefore, vegetarian restaurant operators must create unique experiences for customers while they eat in order to increase customer happiness. The operator creates an attractive interior and atmosphere that stimulates customers’ senses and provides healthy food and high-quality human services.
6. Conclusions
Many individuals have been switching to a plant-based diet (e.g., vegetarian food), which is considered a healthier and more environmentally sustainable option [5]. Therefore, this study confirmed how experiential satisfaction, storytelling, and subjective well-being are formed by the EQ of a vegetarian restaurant. For this verification, we applied the EQ presented by Wu [13] and presented a model that integrated EQ and consequents. The analysis results confirmed primary dimensions of EQ that strengthen EQ and identified relationships between each variable. This empirical evidence proves that the model proposed in this study is suitable for explaining consumer behavior toward vegetarian restaurants. Consequently, the theoretical framework verified in this study will serve as a foundation for future research on vegetarian and eco-friendly restaurants.
7. Limitations and Future Research
Although this study provides a number of important contributions to the eco-friendly food service sector, there are some limitations. First, because the data were collected only in Korea, the generalizability of the results may be limited because perceptions of vegetarianism may vary by country and region. Second, as this was a cross-sectional study that used questionnaires, a longitudinal study is required to obtain more reliable results. Finally, as this study was conducted without dividing the sample into vegetarians and non-vegetarians, more interesting research results will be obtained if the two groups are separated in the future.
Author Contributions
Y.-J.K. and H.-M.J. conceived and designed the experiments; Y.-J.K. performed the experiments and analyzed the data; Y.-J.K. and H.-M.J. wrote the paper. All authors have read and agreed to the published version of the manuscript.
Funding
This research received no external funding.
Institutional Review Board Statement
Not applicable.
Informed Consent Statement
Not applicable.
Data Availability Statement
The data presented in this study are available upon request from the corresponding author.
Conflicts of Interest
The authors declare no conflicts of interest.
References
- Fresán, U.; Sabaté, J. Vegetarian diets: Planetary health and its alignment with human health. Adv. Nutr. 2019, 10, S380–S388. [Google Scholar] [CrossRef] [PubMed]
- Martin-Rios, C.; Demen-Meier, C.; Gössling, S.; Cornuz, C. Food waste management innovations in the foodservice industry. Waste Manag. 2018, 79, 196–206. [Google Scholar] [CrossRef] [PubMed]
- Fieschi, M.; Pretato, U. Role of compostable tableware in food service and waste management. A life cycle assessment study. Waste Manag. 2018, 73, 14–25. [Google Scholar] [CrossRef] [PubMed]
- Krizanova, J.; Guardiola, J. Happy but vegetarian? Understanding the relationship of vegetarian subjective well-being from the nature-connectedness perspective of university students. Appl. Res. Qual. Life 2021, 16, 2221–2249. [Google Scholar] [CrossRef]
- Kautish, P.; Thaichon, P.; Soni, P. Environmental values and sustainability: Mediating role of nature connectedness, and love for nature toward vegan food consumption. J. Consum. Behav. 2023, 23, 1130–1145. [Google Scholar] [CrossRef]
- Kim, M.J.; Hall, C.M.; Kim, D.K. Predicting environmentally friendly eating out behavior by value-attitude-behavior theory: Does being vegetarian reduce food waste? J. Sustain. Tour. 2020, 28, 797–815. [Google Scholar] [CrossRef]
- Ottenbacher, M.; Busam, S.; Harrington, R.J.; Allhoff, J. The factors impacting on the travel experience of a vegan lifestyle. Int. Hosp. Rev. 2023. [Google Scholar] [CrossRef]
- Choi, H.; Joung, H.W.; Choi, E.K.; Kim, H.S. Understanding vegetarian customers: The effects of restaurant attributes on customer satisfaction and behavioral intentions. J. Foodserv. Bus. Res. 2022, 25, 353–376. [Google Scholar] [CrossRef]
- Turner-McGrievy, G.M.; Leach, A.M.; Wilcox, S.; Frongillo, E.A. Differences in environmental impact and food expenditures of four different plant-based diets and an omnivorous diet: Results of a randomized, controlled intervention. J. Hunger Environ. Nutr. 2016, 11, 382–395. [Google Scholar] [CrossRef]
- Sharma, P.; Nayak, J.K. Examining experience quality as the determinant of tourist behavior in niche tourism: An analytical approach. J. Herit. Tour. 2020, 15, 76–92. [Google Scholar] [CrossRef]
- Chen, C.F.; Chen, F.S. Experience quality, perceived value, satisfaction and behavioral intentions for heritage tourists. Tour. Manag. 2010, 31, 29–35. [Google Scholar] [CrossRef]
- Jin, N.P.; Lee, S.; Lee, H. The effect of experience quality on perceived value, satisfaction, image and behavioral intention of water park patrons: New versus repeat visitors. Int. J. Tour. Res. 2015, 17, 82–95. [Google Scholar] [CrossRef]
- Wu, H.C. What drives experiential loyalty? A case study of Starbucks coffee chain in Taiwan. Br. Food J. 2017, 119, 468–496. [Google Scholar] [CrossRef]
- Wu, H.C.; Li, T. A study of experiential quality, perceived value, heritage image, experiential satisfaction, and behavioral intentions for heritage tourists. J. Hosp. Tour. Res. 2017, 41, 904–944. [Google Scholar] [CrossRef]
- Wu, H.C.; Cheng, C.C.; Ai, C.H. A study of experiential quality, experiential value, trust, corporate reputation, experiential satisfaction and behavioral intentions for cruise tourists: The case of Hong Kong. Tour. Manag. 2018, 66, 200–220. [Google Scholar] [CrossRef]
- Wu, H.C.; Li, M.M.; Li, T.A. study of experiential quality, experiential value, experiential satisfaction, theme park image and revisit intention. J. Hosp. Tour. Res. 2018, 42, 26–73. [Google Scholar] [CrossRef]
- Ahn, Y.J.; Hyun, S.S.; Kim, I. Vivid-memory formation through experiential value in the context of the international industrial exhibition. J. Travel Tour. Mark. 2017, 34, 291–311. [Google Scholar] [CrossRef]
- Yoo, S.R.; Kim, S.H.; Jeon, H.M. How does experiential value toward robot barista service affect emotions, storytelling, and behavioral intention in the context of COVID-19? Sustainability 2022, 14, 450. [Google Scholar] [CrossRef]
- Line, N.D.; Hanks, L.; Dogru, T. A reconsideration of the eWOM construct in restaurant research: What are we really measuring? Int. J. Contemp. Hosp. Manag. 2020, 32, 3479–3500. [Google Scholar] [CrossRef]
- Chen, Y.F.; Law, R.; Yan, K.K. Negative eWOM management: How do hotels turn challenges into opportunities? J. Qual. Assur. Hosp. Tour. 2022, 23, 692–715. [Google Scholar] [CrossRef]
- Chinelato, F.B.; de Oliveira, A.S.; Souki, G.Q. Do satisfied customers recommend restaurants? The moderating effect of engagement on social networks on the relationship between satisfaction and eWOM. Asia Pac. J. Mark. Logist. 2023, 35, 2765–2784. [Google Scholar] [CrossRef]
- Tan, W.K.; Chen, P.Y. Flash sales: How consumers’ emotional responses to negative word-of-mouth affect diagnosticity and purchase intentions. Serv. Bus. 2023, 17, 1001–1024. [Google Scholar] [CrossRef]
- Wahyuningsih; Nasution, H.; Yeni, Y.H.; Roostika, R. A comparative study of generations X, Y, Z in food purchasing behavior: The relationships among customer value, satisfaction, and Ewom. Cogent Bus. Manag. 2022, 9, 2105585. [Google Scholar] [CrossRef]
- Su, L.; Swanson, S.R.; Chen, X. The effects of perceived service quality on repurchase intentions and subjective well-being of Chinese tourists: The mediating role of relationship quality. Tour. Manag. 2016, 52, 82–95. [Google Scholar] [CrossRef]
- Wang, X.; Lai, I.K.W.; Wang, X. The influence of girlfriend getaway luxury travel experiences on women’s subjective well-being through travel satisfaction: A case study in Macau. J. Hosp. Tour. Manag. 2023, 55, 91–100. [Google Scholar] [CrossRef]
- Uysal, M.; Sirgy, M.J.; Woo, E.; Kim, H. Quality of life (QOL) and well-being research in tourism. Tour. Manag. 2016, 53, 244–261. [Google Scholar] [CrossRef]
- Andereck, K.L.; Nyaupane, G.P. Exploring the nature of tourism and quality of life among residents. J. Travel Res. 2011, 50, 248–260. [Google Scholar] [CrossRef]
- Dolnicar, S.; Yanamandram, V.; Cliff, K. The contribution of vacations to quality of life. Ann. Tour. Res. 2012, 39, 59–83. [Google Scholar] [CrossRef]
- Kim, H.; Woo, E.; Uysal, M. Tourism experience and quality of life among elderly tourists. Tour. Manag. 2015, 46, 465–476. [Google Scholar] [CrossRef]
- Meng, B.; Choi, K. Theme restaurants’ servicescape in developing the quality of life: The moderating effect of perceived authenticity. Int. J. Hosp. Manag. 2017, 65, 89–99. [Google Scholar] [CrossRef]
- Wu, H.C.; Ai, C.H.; Cheng, C.C. Synthesizing the effects of green experiential quality, green equity, green image and green experiential satisfaction on green switching intention. Int. J. Contemp. Hosp. Manag. 2016, 28, 2080–2107. [Google Scholar] [CrossRef]
- Wu, H.C.; Cheng, C.C.; Chen, Y.C.; Hong, W. Towards green experiential loyalty: Driving from experiential quality, green relationship quality, environmental friendliness, green support and green desire. Int. J. Contemp. Hosp. Manag. 2018, 30, 1374–1397. [Google Scholar] [CrossRef]
- Lacap, J.P.; Sicat, A.T. Effects of experiential quality on experiential loyalty: Evidence from Starbucks Coffee chains in Pampanga, Philippines. Asia Pac. Soc. Sci. Rev. 2022, 22, 14–36. [Google Scholar]
- Liu, Y.; Song, Y.; Sun, J.; Sun, C.; Liu, C.; Chen, X. Understanding the relationship between food experiential quality and customer dining satisfaction: A perspective on negative bias. Int. J. Hosp. Manag. 2020, 87, 102381. [Google Scholar] [CrossRef]
- Fick, G.R.; Ritchie, J.R.B. Measuring service quality in the travel and tourism industry. J. Travel Res. 1991, 30, 2–9. [Google Scholar] [CrossRef]
- Crompton, J.L.; Love, L.L. The predictive validity of alternative approaches to evaluating quality of a festival. J. Travel Res. 1995, 34, 11–24. [Google Scholar] [CrossRef]
- Lemke, F.; Clark, M.; Wilson, H. Customer experience quality: An exploration in business and consumer contexts using repertory grid technique. J. Acad. Mark. Sci. 2011, 39, 846–869. [Google Scholar] [CrossRef]
- Klaus, P.; Maklan, S. EXQ: A multiple-item scale for assessing service experience. J. Serv. Manag. 2012, 23, 5–33. [Google Scholar] [CrossRef]
- Otto, J.E.; Ritchie, J.B. The service experience in tourism. Tour. Manag. 1996, 17, 165–174. [Google Scholar] [CrossRef]
- de Rojas, C.; Camarero, C. Visitors’ experience, mood and satisfaction in a heritage context: Evidence from an interpretation center. Tour. Manag. 2008, 29, 525–537. [Google Scholar] [CrossRef]
- Brady, M.K.; Cronin, J.J., Jr. Some new thoughts on conceptualizing perceived service quality: A hierarchical approach. J. Mark. 2001, 65, 34–49. [Google Scholar] [CrossRef]
- Bitner, M.J. Servicescapes: The impact of physical surroundings on customers and employees. J. Mark. 1992, 56, 57–71. [Google Scholar] [CrossRef]
- Rust, R.T.; Oliver, R.L. (Eds.) Service Quality: Insights and managerial implication from the frontier. In Service Quality: New Directions in Theory and Practice; Sage: Thousand Oaks, CA, USA, 1994; pp. 1–19. [Google Scholar]
- Russell, J.A.; Pratt, G.A. Description of the affective quality attributed to environments. J. Person. Soc. Psychol. 1980, 38, 311–322. [Google Scholar] [CrossRef]
- Kao, Y.F.; Huang, L.S.; Yang, M.H. Effects of experiential elements on experiential satisfaction and loyalty intentions: A case study of the super basketball league in Taiwan. Int. J. Revenue Manag. 2007, 1, 79–96. [Google Scholar] [CrossRef]
- Wu, H.C.; Ai, C.H. Synthesizing the effects of experiential quality, excitement, equity, experiential satisfaction on experiential loyalty for the golf industry: The case of Hainan Island. J. Hosp. Tour. Manag. 2016, 29, 41–59. [Google Scholar] [CrossRef]
- Jin, N.; Lee, S.; Huffman, L. Impact of restaurant experience on brand image and customer loyalty: Moderating role of dining motivation. J. Travel Tour. Mark. 2012, 29, 532–551. [Google Scholar] [CrossRef]
- Oliver, R.L. A cognitive model of the antecedents and consequences of satisfaction decisions. J. Mark. Res. 1980, 17, 460–469. [Google Scholar] [CrossRef]
- Parasuraman, A.; Zeithaml, V.A.; Berry, L.L. A conceptual model of service quality and its implications for future research. J. Mark. 1985, 49, 41–50. [Google Scholar] [CrossRef]
- Westbrook, R.A.; Oliver, R.L. The dimensionality of consumption emotion patterns and consumer satisfaction. J. Con. Res. 1991, 18, 84–91. [Google Scholar] [CrossRef]
- Anderson, E.W.; Fornell, C.; Lehmann, D.R. Customer satisfaction, market share, and profitability: Findings from Sweden. J. Mark. 1994, 58, 53–66. [Google Scholar] [CrossRef]
- Kim, S.H.; Yoo, S.R.; Jeon, H.M. The role of experiential value, novelty, and satisfaction in robot barista coffee shop in South Korea: COVID-19 crisis and beyond. Serv. Bus. 2022, 16, 771–790. [Google Scholar] [CrossRef]
- Chua, B.L.; Lee, S.; Han, H. Consequences of cruise line involvement: A comparison of first-time and repeat passengers. Int. J. Contemp. Hosp. Manag. 2017, 29, 1658–1683. [Google Scholar] [CrossRef]
- McGregor, I.; Holmes, J.G. How storytelling shapes memory and impressions of relationship events over time. J. Pers. Soc. Psychol. 1999, 76, 403–419. [Google Scholar] [CrossRef]
- Delgadillo, Y.; Escalas, J.E. Narrative word-of mouth communication: Exploring memory and attitude effects of consumer storytelling intentions. Adv. Con. Res. 2004, 31, 186–192. [Google Scholar]
- Akgün, A.E.; Keskin, H.; Ayar, H.; Erdoğan, E. The influence of storytelling approach in travel writings on readers’ empathy and travel intentions. Procedia Soc. Behav. Sci. 2015, 207, 577–586. [Google Scholar] [CrossRef]
- Cater, C.; Albayrak, T.; Caber, M.; Taylor, S. Flow, satisfaction and storytelling: A causal relationship? Evidence from scuba diving in Turkey. Curr. Issues Tour. 2021, 24, 1749–1767. [Google Scholar] [CrossRef]
- Souki, G.Q.; Chinelato, F.B.; Gonçalves Filho, C. Sharing is entertaining: The impact of consumer values on video sharing and brand equity. J. Res. Interact. Mark. 2022, 16, 118–136. [Google Scholar] [CrossRef]
- Choi, M.; Han, K.; Choi, J. The effects of product attributes and service quality of transportation card solutions on service user’s continuance and word-of-mouth intention. Serv. Bus. 2015, 9, 463–490. [Google Scholar] [CrossRef]
- Pera, R. Empowering the new traveller: Storytelling as a co-creative behaviour in tourism. Curr. Issues Tour. 2017, 20, 331–338. [Google Scholar] [CrossRef]
- Pabel, A. A narrative approach to understanding recreational dive tourists’ experiences on coral reefs. In Coral Reefs: Tourism, Conservation and Management; Prideaux, B., Pabel, A., Eds.; Routledge: Abingdon, UK, 2018; pp. 169–183. [Google Scholar]
- Schuckert, M.; Liu, X.; Law, R. Hospitality and tourism online reviews: Recent trends and future directions. J. Travel Tour. Mark. 2015, 32, 608–621. [Google Scholar] [CrossRef]
- Xiang, Z.; Du, Q.; Ma, Y.; Fan, W. A comparative analysis of major online review platforms: Implications for social Media Analytics in hospitality and tourism. Tour. Manag. 2017, 58, 51–65. [Google Scholar] [CrossRef]
- Yang, F.X. Effects of restaurant satisfaction and knowledge sharing motivation on eWOM intentions: The moderating role of technology acceptance factors. J. Hosp. Tour. Res. 2017, 41, 93–127. [Google Scholar] [CrossRef]
- Uslu, A. The relationship of service quality dimensions of restaurant enterprises with satisfaction, behavioural intention, eWOM, and the moderating effect of atmosphere. Tour. Manag. Stud. 2020, 16, 23–35. [Google Scholar] [CrossRef]
- Ryan, R.M.; Deci, E.L. On happiness and human potentials: A review of research on hedonic and eudaimonic well-being. Annu. Rev. Psychol. 2001, 52, 141–166. [Google Scholar] [CrossRef] [PubMed]
- Sirgy, M.J. The Psychology of Quality of Life: Hedonic Well-Being, Life Satisfaction, and Eudaimonia; Springer: New York, NY, USA, 2012. [Google Scholar]
- Diener, E.; Suh, E.; Oishi, S. Recent findings on subjective well-being. Indian J. Clin. Psychol. 1997, 24, 25–41. [Google Scholar]
- Diener, E. Subjective well-being. Psychol. Bull. 1984, 95, 542–575. [Google Scholar] [CrossRef] [PubMed]
- Diener, E.; Emmons, R.A.; Larsen, R.J.; Griffin, S. The satisfaction with life scale. J. Pers. Assess. 1985, 49, 71–75. [Google Scholar] [CrossRef] [PubMed]
- Diener, E.; Suh, E.M.; Lucas, R.E.; Smith, H.L. Subjective well-being: Three decades of progress. Psychol. Bull. 1999, 125, 276–302. [Google Scholar] [CrossRef]
- Yurcu, G.; Akinci, Z. Influence of organizational citizenship behavior on hotel employees’ job satisfaction and subjective well-being. Adv. Hosp. Tour. Res. 2017, 5, 57–83. [Google Scholar]
- Dagger, T.S.; Sweeney, J.C. The effect of service evaluations on behavioral intentions and quality of life. J. Serv. Res. 2006, 9, 3–18. [Google Scholar] [CrossRef]
- Saayman, M.; Li, G.; Uysal, M.; Song, H. Tourist satisfaction and subjective well-being: An index approach. Int. J. Tour. Res. 2018, 20, 388–399. [Google Scholar] [CrossRef]
- Manthiou, A.; Kang, J.; Hyun, S.S. An integration of cognitive appraisal theory and script theory in the luxury cruise sector: The bridging role of recollection and storytelling. J. Travel Tour. Mark. 2017, 34, 1071–1088. [Google Scholar] [CrossRef]
- Harkness, J. Guidelines for Best Practice in Cross-Cultural Surveys; University of Michigan Institute for Social Research: Ann Arbor, MI, USA, 2011. [Google Scholar]
- Seoul Metropolitan Government. Taste of Seoul. Available online: https://tasteofseoul.visitseoul.net/eng/restaurants/list (accessed on 29 September 2023).
- Anderson, J.C.; Gerbing, D.W. Structural equation modeling in practice: A review and recommended two-step approach. Psychol. Bull. 1988, 103, 411–423. [Google Scholar] [CrossRef]
- Hair, J.F.; Hult, G.T.M.; Ringle, C.; Sarstedt, M. Primer on Partial Least Squares Structural Equation Modelling (PLS-SEM); Sage: Los Angeles, CA, USA, 2016. [Google Scholar]
- Fornell, C.R.; Larcker, D.F. Evaluating structural equation models with unobservable variables and measurement error. J. Mark. Res. 1981, 18, 39–50. [Google Scholar] [CrossRef]
- Podsakoff, P.M.; MacKenzie, S.B.; Lee, J.Y.; Podsakoff, N.P. Common method biases in behavioral research: A critical review of the literature and recommended remedies. J. Appl. Psychol. 2003, 88, 879–903. [Google Scholar] [CrossRef]

Disclaimer/Publisher’s Note: The statements, opinions and data contained in all publications are solely those of the individual author(s) and contributor(s) and not of MDPI and/or the editor(s). MDPI and/or the editor(s) disclaim responsibility for any injury to people or property resulting from any ideas, methods, instructions or products referred to in the content. |
© 2024 by the authors. Licensee MDPI, Basel, Switzerland. This article is an open access article distributed under the terms and conditions of the Creative Commons Attribution (CC BY) license (https://creativecommons.org/licenses/by/4.0/).