Article

Carbon Dioxide Gasification of Biochar: A Sustainable Way of Utilizing Captured CO2 to Mitigate Greenhouse Gas Emission

Department of Mechanical Engineering, Georgia Southern University, Statesboro, GA 30460, USA
*
Author to whom correspondence should be addressed.
Sustainability 2024, 16(12), 5044; https://doi.org/10.3390/su16125044
Submission received: 1 May 2024 / Revised: 27 May 2024 / Accepted: 5 June 2024 / Published: 13 June 2024
(This article belongs to the Section Energy Sustainability)

Abstract

:
This study proposes CO2 gasification of biochar as a potential carbon utilization pathway for greenhouse gas emission reduction. It aims to evaluate the effects of CO2 concentration on carbon and CO2 conversion and output CO yield. It also performs kinetic analysis, using the volume reaction model, to determine the activation energy and pre-exponential factor. The operating conditions utilized include gasification temperatures of 700, 800, and 900 °C; inlet CO2 concentrations of 15%, 30%, 45%, and 60% by volume (N2 balance); and a CO2 flow rate of 5 L/min. Carbon dioxide gasification of biochar was performed in a fixed bed batch reactor, and the composition of the output gases was analyzed. Increases in the temperature and inlet CO2 concentration both resulted in an increase in carbon conversion, with the maximum carbon conversion of 57.1% occurring at 900 °C and a 60% inlet CO2 concentration. The results also showed that CO2 conversion increased against temperature but decreased with an increasing inlet CO2 concentration. The maximum CO2 conversion of 76% was observed at 900 °C and a 15% inlet CO2 concentration. An activation energy in the range of 109 to 117 kJ/mol and a pre-exponential factor in the range of 63 to 253 s−1 were determined in this study.

1. Introduction

Energy production in the US is largely sourced from fossil fuel (petroleum, natural gas, and coal), nuclear energy, and renewable energy. In 2022, fossil fuel accounted for 79% of the total energy production in the US [1]. The use of fossil fuels leads to the emission of greenhouse gases (GHGs). GHGs include carbon dioxide (CO2), methane (CH4), nitrous oxide (N2O), and industrial gases like hydrofluorocarbons (HFCs), perfluorochemicals (PFCs), sulfur hexafluoride (SF6), and nitrogen trifluoride (NF3). In a 2021 report on US emissions, it was seen that GHG emissions totaled 6340 million metric tons (14.0 trillion pounds) of carbon dioxide equivalents [2]. Sustainable goal number 13 states that urgent action must be taken to combat climate change and its impact [3]. In conjunction with this goal is the 2015 Paris agreement [4], which advocates for efforts to be made to limit the temperature rise to 1.5 ° C above pre-industrial levels. In order to achieve sustainability goals and to prevent the negative effects of climate change, decarbonization of all sectors is paramount. In pursuit of this decarbonization agenda, alternative sources of energy like wind, solar, biomass, etc., are being explored. With fast-growing global economies and world populations, however, energy demands continue to increase. This means that fossil fuel will still need to play a major role in meeting the current energy demands. To that end, carbon capture and storage (CCS) technologies have been implemented to reduce CO2 emissions in the atmosphere.
With the implementation of CCS technologies comes the need to utilize the captured CO2. Several utilization pathways exist. For example, captured CO2 is used in curing concrete, producing algae-based products like biofertilizers, and producing carbonated drinks and beverages. Captured CO2 is also useful in the production of fuels and chemicals. The use of CO2 to produce fuel is largely implemented in two ways: the direct hydrogenation of CO2 and indirect production, where CO2 is converted into an intermediary product and then synthesized. In direct hydrogenation, hydrogen is added to CO2, without first converting it into an intermediary product, to produce methane, methanol, and other chemicals [5]. The direct hydrogenation pathway, however, is very costly, as CO2 is not chemically active to react with hydrogen. The indirect pathway, on the other hand, is more attractive seeing that CO2 is first converted into carbon monoxide (CO), a more chemically active product with multiple uses. While CO can be used to manufacture various organic and inorganic chemicals, the indirect pathway focuses on synthesizing CO and hydrogen in a Fischer–Tropsch (FT) reactor. When CO and H2 are combined, it is called synthesis gas, usually known as syngas. The FT synthesis of syngas, which is a very well-known process, can be used to produce methanol and various hydrocarbons, including bio-jet fuel, biodiesel, etc.
The main challenge with this indirect pathway is the conversion of CO2 into CO. Some options exist, like the reverse water–gas shift (RWGS) process, methane reforming, and electrochemical conversion. While the aforementioned approaches are highly energy-intensive, a promising approach is the CO2 gasification of biochar to produce CO. Biochar is a porous, carbon-rich waste material which can be obtained from either pyrolysis or the gasification of biomass. Pyrolysis-based biochar is superior compared to gasification-based biochar. CO2 gasification of biochar is a unique approach because it achieves two things simultaneously: carbon emission reduction, through the utilization of captured CO2, and efficient waste disposal since waste material is the fuel source.
There are several factors that can influence the CO2 gasification yield, some of which include feedstock type, operating temperature, inlet CO2 concentration and flow rate, etc. These factors have been studied by various researchers. For example, Sadhwani et al. [6] studied CO2 gasification using southern pine at temperatures from 700 to 934 ° C and a 100% inlet CO2 concentration using a fluidized bed gasifier. They reported increasing the CO concentration from 6.0% vol at 700 ° C to 11.3% vol at 934 ° C . Shen et al. [7] studied CO2 gasification using woody biomass at temperatures of 700 and 800 ° C and an inlet CO2 concentration of 15% CO2 (air balance) in a small-scale autothermal gasifier. They reported CO concentrations of 20 and 40% vol at 700 and 800 ° C , respectively. Cheng et al. [8] performed a numerical study using woodchips at temperatures of 875 to 950 ° C and inlet CO2 concentrations of 20%, 40%, 60%, and 80% CO2 (air balance) via the Eulerian method. They reported CO concentrations of 10%, 14%, 18%, and 15.7% vol at 20%, 40%, 60%, and 80% inlet CO2 concentrations, respectively. Hu et al. [9] performed 100% CO2 gasification using rice straw at temperatures of 700, 800, 900, and 1000 ° C in a thermogravimetric analyzer (TGA). They reported CO concentrations of 16%, 21%, 40%, and 43% vol at 700, 800, 900, and 1000 ° C , respectively and kinetic parameters such as an activation energy of 155.7 kJ/mol and a pre-exponential factor of 1.72 × 10⁵ s−1. Wang et al. [10] studied kinetic analysis of the CO2 gasification of pine sawdust and wheat straw via the volume reaction model (VRM). They reported activation energies of 140.7 and 163.5 kJ/mol and pre-exponential factors of 2 × 10⁵ and 4.22 × 10⁴ s−1 for pine dust and wheat straw, respectively. Pacioni et al. [11] performed a TGA study on coffee grounds and sawdust via the VRM. They reported activation energies of 185.8 and 211.7 kJ/mol and pre-exponential factor values of 3.32 × 10⁵ and 7.93 × 10⁶ s−1 for coffee grounds and sawdust, respectively. Beagle et al. [12] performed CO2 gasification of coal and oak using a TGA via the random pore model (RPM). They reported activation energy values of 100.4 and 127.9 kJ/mol and pre-exponential factor values of 319 and 44.9 s−1 for pine dust and wheat straw, respectively.
While numerous studies have been reported, as highlighted above, to understand factors such as the feedstock type and operating temperature, few studies have been reported on understanding the effect of CO2 concentration on carbon conversion and product yield, which is the focus of this study. Understanding this effect is important because the captured CO2 from various sources and industries has various CO2 concentrations. This study adds value to the existing literature by reporting elaborately on the output gas composition and performing a detailed kinetic analysis at the laboratory scale using a fixed bed batch reactor.

2. Materials and Methods

2.1. Materials

Kingsford biochar (Kingsford, Belle, MO, USA) was purchased from a commercial supplier and used as the feedstock for this study. The biochar, which came in large chunks, was further sized and sieved to a particle size of 1 to 3 mm. A small particle size is important to allow high heat and mass transfer as the gasification reaction occurs.

2.2. Feedstock Analysis

2.2.1. Proximate and Ultimate Analysis
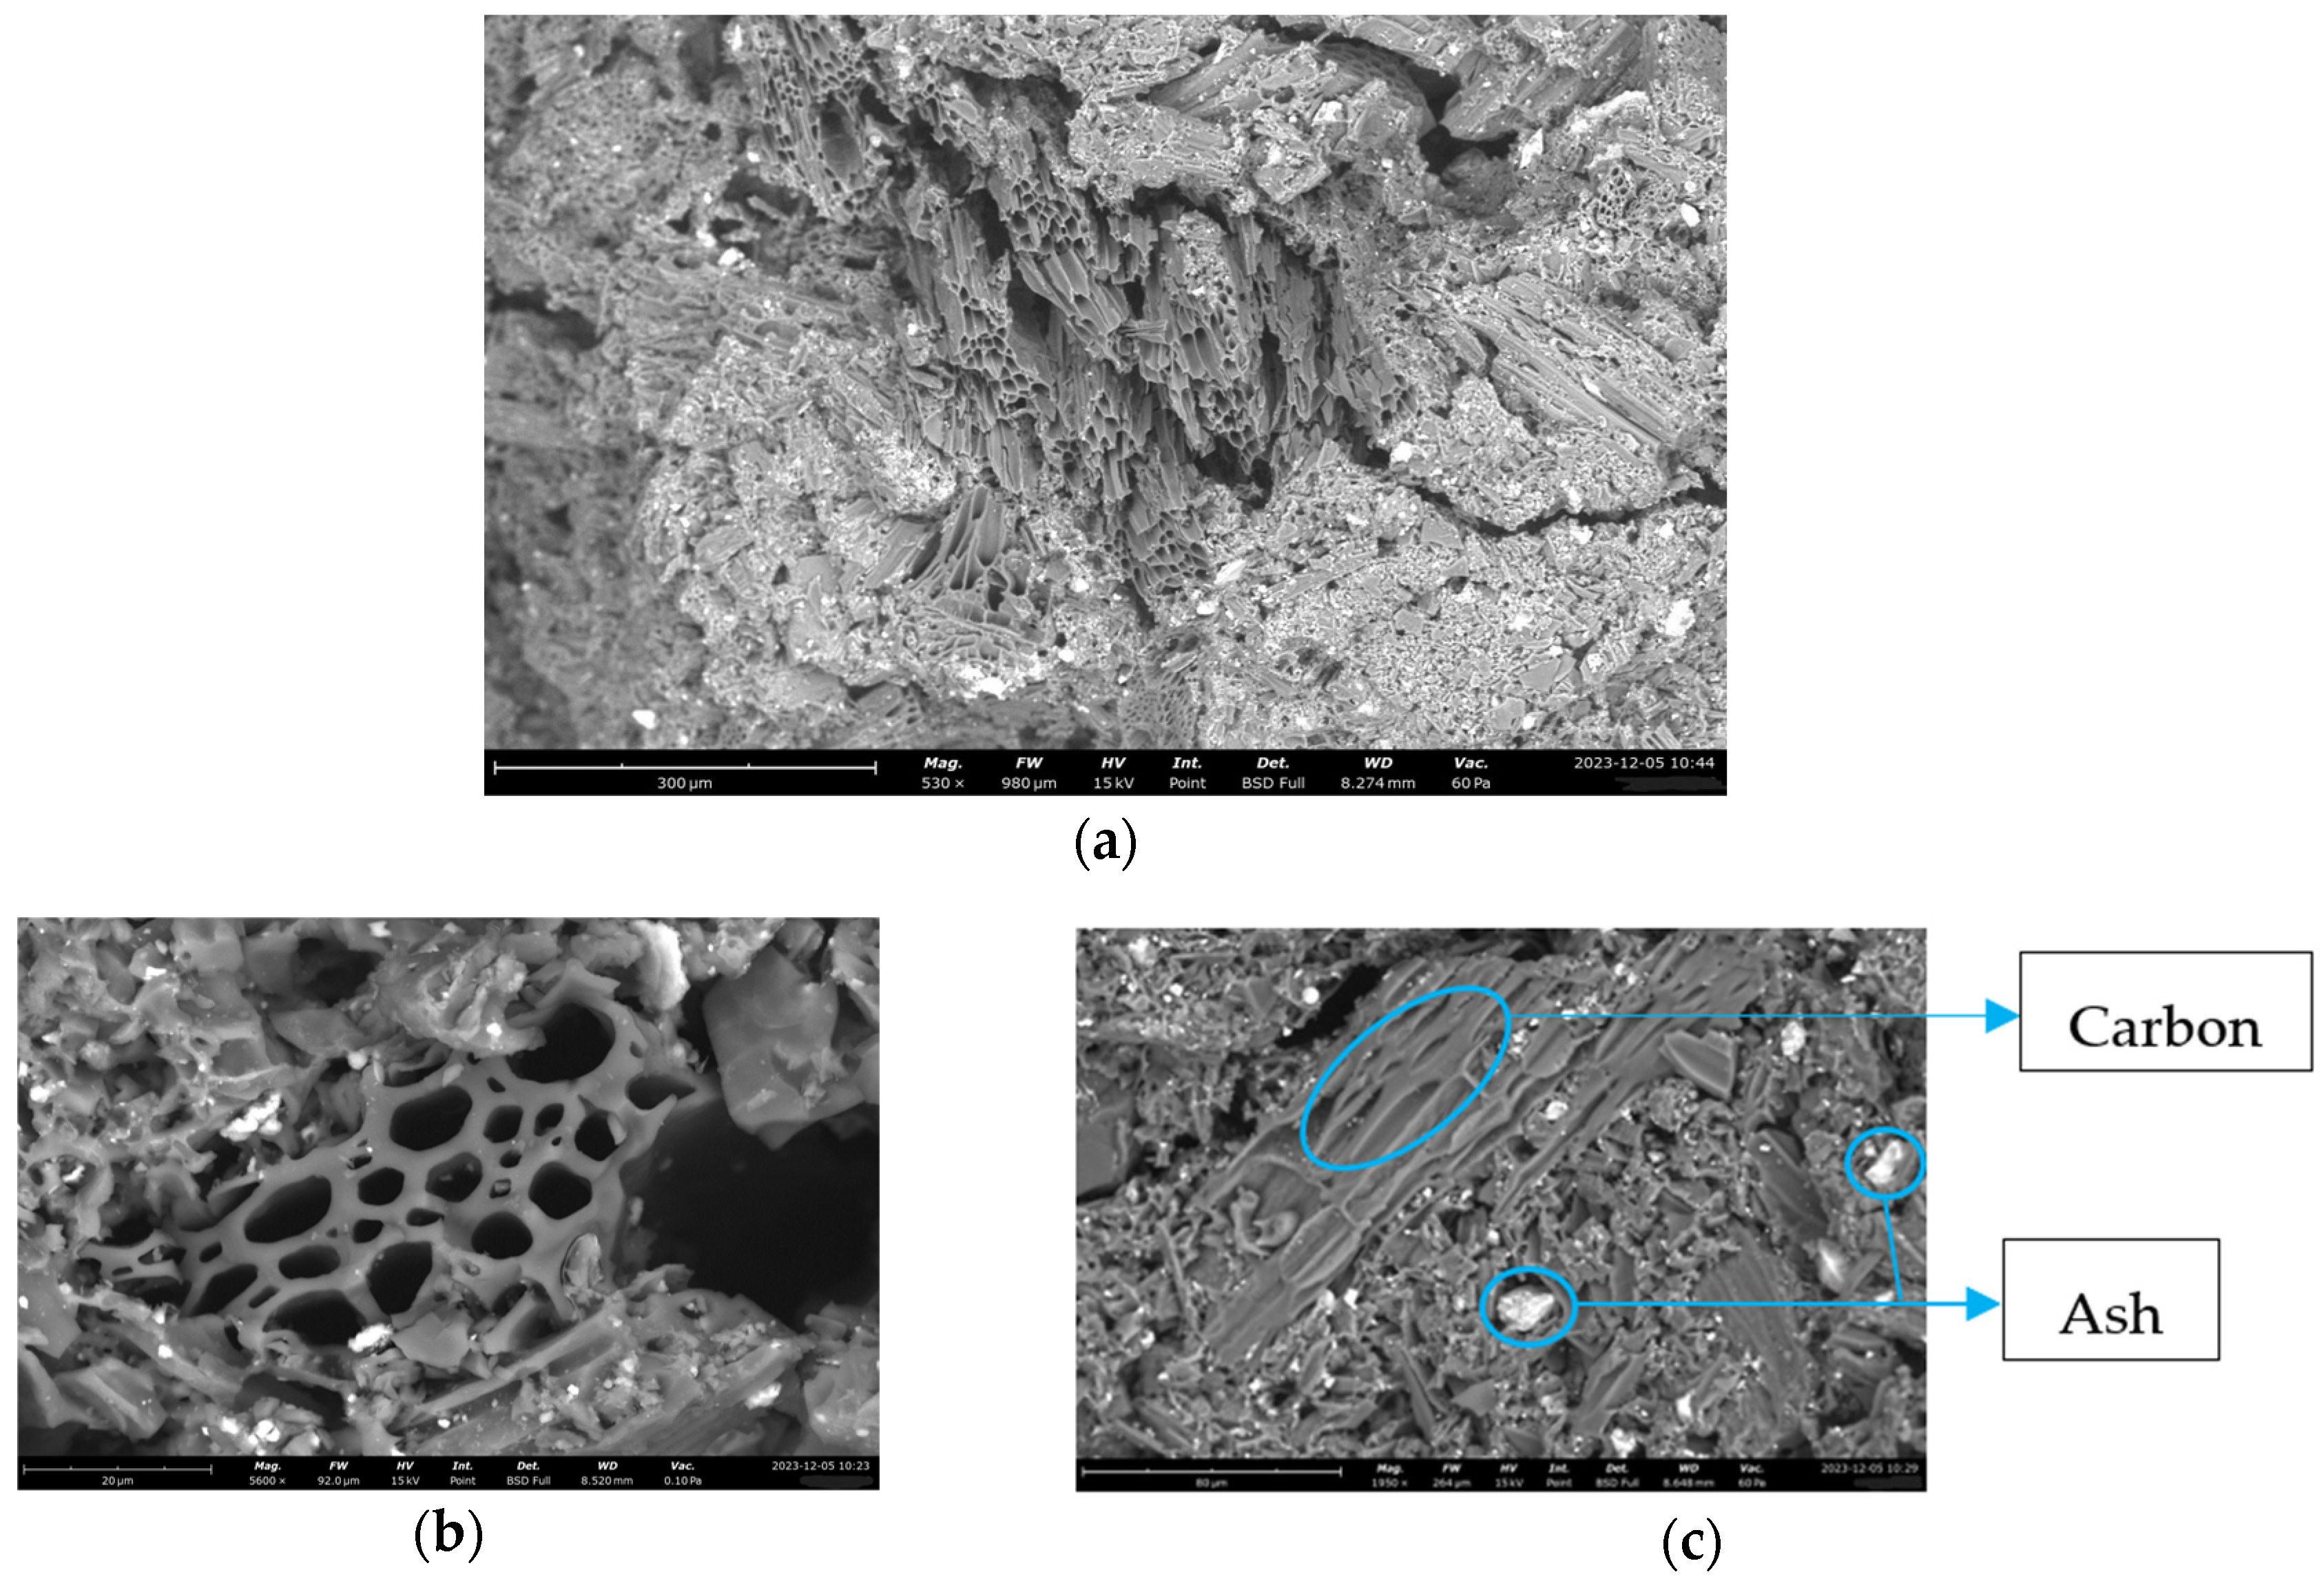
To analyze the feedstock (Kingsford biochar), proximate and ultimate analyses were performed. The proximate analysis determined the fixed carbon, volatile matter, ash, and moisture contents in the sample. The ultimate analysis, on the other hand, was used to determine the elemental composition, such as the carbon, hydrogen, nitrogen, oxygen, and sulfur content in the sample. The proximate and ultimate analyses help to determine the physical and chemical properties of the feedstock, thus enabling researchers to predict the quantity of feedstock needed and perform the necessary yield calculations. The proximate and ultimate analyses of the Kingsford biochar sample were performed by Hazen Research Inc. (Golden, CO, USA), and the results are shown in Table 1.

2.2.2. SEM Analysis

Scanning electron microscopy (SEM) is a technique that uses electrons, as opposed to light, to create images. This occurs by means of a focused beam of electrons scanning the surface of the material. The Phenom™ XL G2 Desktop SEM, purchased from Thermo Fisher Scientific (Waltham, MA, USA), was used for this analysis. To prepare the sample for SEM, a carbon dot was placed on the SEM pin stub, and the biochar sample was placed on the carbon dot surface. The sample was securely fixed to the pin stub by means of aluminum strips and placed in the sample holder. The sample holder was placed in the SEM machine, and the analysis was carried out. The images were taken with magnification ranging from 810× to 5600×, and an energy-dispersive X-ray spectroscopy (EDS) analysis was performed. The results are discussed in Section 3.1.

2.3. Experimental Setup and Procedure

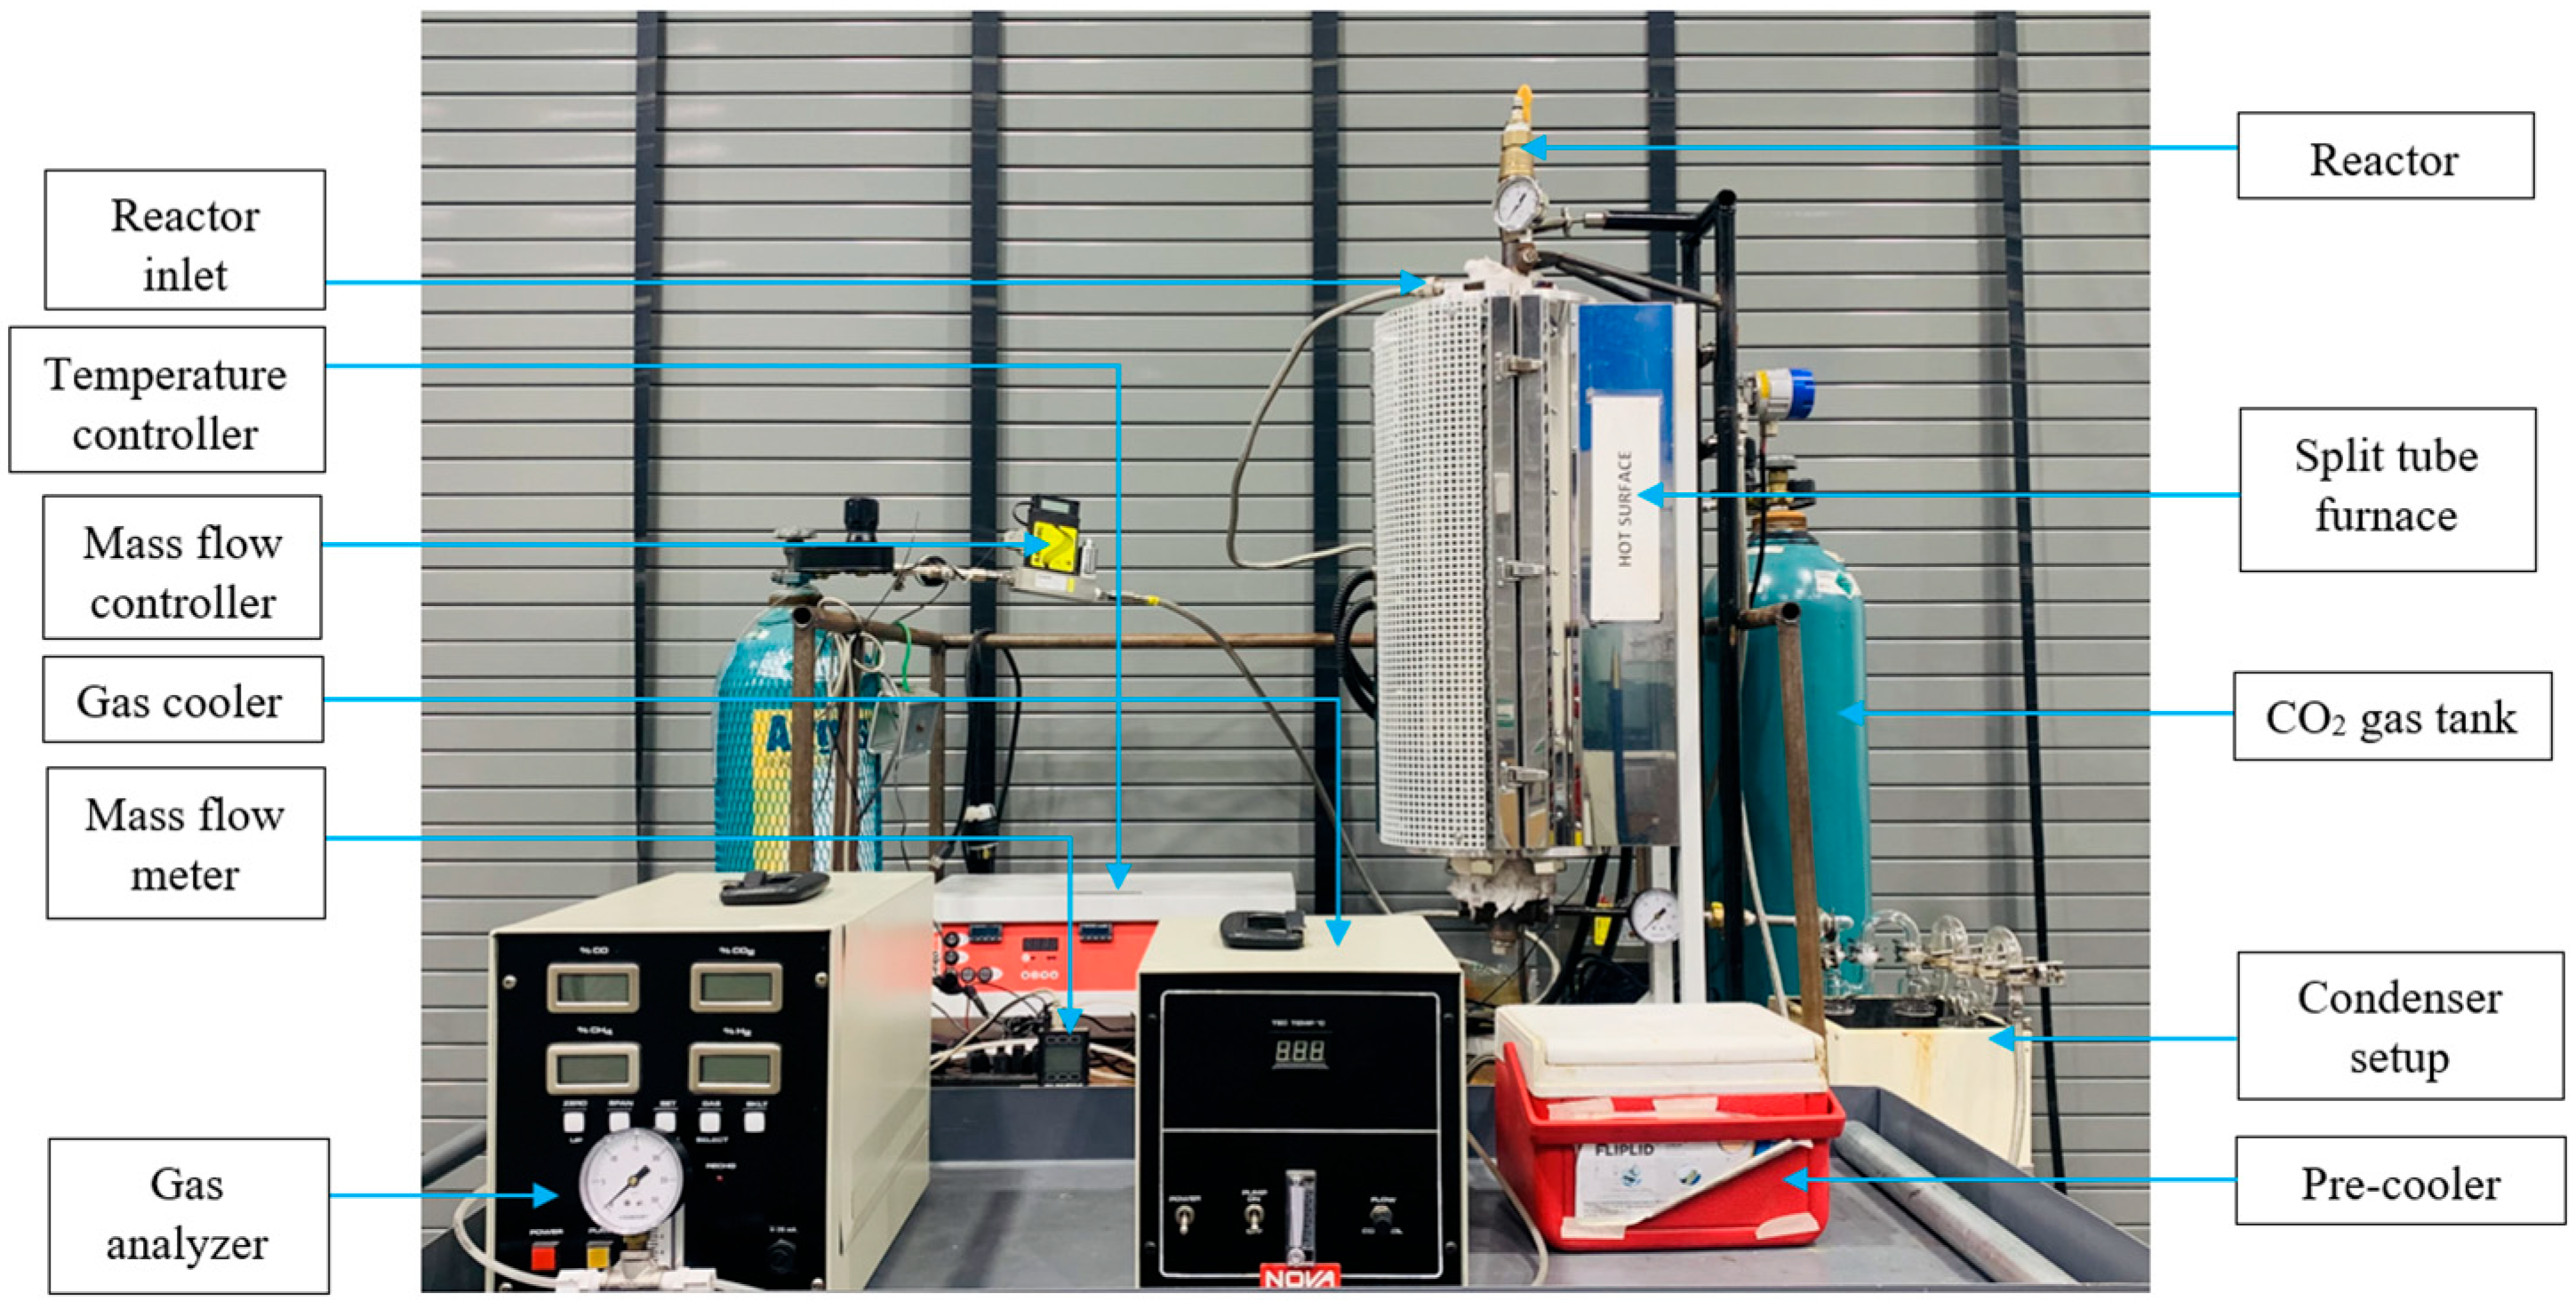
2.3.1. Experimental Setup

The experimental setup is shown in Figure 1. To run the CO2 gasification experiment, the major apparatus needed include a fixed bed batch reactor, a split furnace, a mass flow controller/meter, impinger-bottle-based glass condensers, a pre-cooler, an electric gas cooler, and a gas analyzer. The fixed bed reactor is a stainless steel, one-inch inner diameter reactor that holds the biochar bed on a wire mesh in the middle of the reactor. The split tube furnace TVS 1200 (Carbolite Gero, Newtown, PA, USA) is used to provide heat to the reactor, alongside a Carbolite Gero 301 temperature controller, with a maximum operating temperature of 1200 °C. The mass flow controller (Model GFC17, Aalborg Instruments, New York, NY, USA) is used to control the flow rate of the supplied gases from the nitrogen and CO2 gas cylinders. The condenser setup, which included a set of three impinger bottles (500 mL each), U-tube and L-tube adapters, stainless steel clamps, and an insulated coolant reservoir, was purchased from Apex Instruments (Apex, Centennial, CO, USA) and customized in house. A Coleman flip lid cooler (Coleman, Wichita, KS, USA) was used as the pre-cooler. The mass flow meter (Model FMA-1601A, Omega, Norwalk, CT, USA) was used to measure the flow rate of the output gas. The electric gas cooler (Model 2000, NOVA Analytical Systems, New York, NY, USA) was used to provide further cooling and ensure a steady flow of the output gas through the gas analyzer by means of an in-built pump system. The gas analyzer (Model 700 P-4C, NOVA Analytical Systems, New York, NY, USA) was used to analyze the composition of the produced gas, such as CO2, CO, H2, and CH4.

2.3.2. Experimental Design

In this study, the three independent parameters are inlet CO2 flow rate, gasification temperature, and inlet CO2 concentration. A CO2 flow rate of 5 L/min, temperatures of 700, 800, and 900 °C, and inlet CO2 concentrations of 15%, 30%, 45%, and 60% (N2 balance) were used in this study. The experiments were run twice for validation purposes, resulting in a total of 24 experiments.

2.3.3. Operating Procedure

Initially, a known quantity of biochar (in this case, 52.5 g) was loaded into the reactor. The biochar sat on the wire mesh support in the middle of the reactor, forming a fixed bed of biochar. The reactor was securely placed in the split tube furnace, and the top and bottom of the reactor were insulated with 2-inch fiber glass to prevent any heat loss. The reactor outlet was connected to the condenser, which was built using three impinger bottles, clamps, U-tubes, and an insulated container. The condenser outlet was connected to the pre-cooler inlet, and the pre-cooler outlet was connected to the mass flow meter inlet. In between the pre-cooler and the mass flow meter is a filter to prevent impurities (particulates) from entering the flow meter. The outlet of the mass flow meter was connected to the inlet of the electric gas cooler, and the outlet of the electric gas cooler was connected to the inlet of the gas analyzer.
Before CO2 gasification, the biochar goes through a preheating process, where nitrogen is allowed to pass through the biochar for about 30 to 45 min (in total) until the electric furnace attains the set temperature. A bypass connection was installed on the reactor, with an exhaust pipe, in order to remove all the volatile matter without allowing it to pass through the condenser. The valve at the condenser inlet is opened when the gasification experiment is about to start. Once equilibrium temperature is achieved, the nitrogen supply is stopped, and CO2 gas is introduced to initiate the gasification experiment. As soon as the CO2 gas supply is introduced, the bypass valve is closed, and the condenser inlet valve is opened. Thus, the produced syngas flows through the condenser to the gas analyzer, where the concentrations of CO2, CO, H2, and CH4 are measured. The concentration of the produced gas is recorded using a DAQ system. The experiment is allowed to run for approximately 30 min after the CO2 is introduced. After 30 min of operation, the CO2 gas cylinder is turned off, and the bypass valve is opened. The DAQ system is stopped, all the devices, including the electric gas cooler, gas analyzer, flow meters, etc., are disconnected from power, and the reactor is allowed to cool down for about 3 to 4 h. Once the reactor is cooled, the leftover char is collected, measured, and stored in a Ziploc bag for further analysis.

2.4. Kinetic Analysis

The volume reaction model (VRM) is selected for the kinetic analysis because it is widely used by researchers for biochar gasification. The VRM, also known as the volumetric or homogenous model, does not account for the structural changes in the biochar sample during the gasification reaction. However, it assumes that the reaction occurs at all active sites, which are uniformly distributed across the char particles, both inside and outside [10]. This model is basically a simplification of the gas–solid heterogeneous reaction, as noted by Pacioni et al. [11]. The expression for the gasification reaction rate as predicted by the VRM is shown in Equation (1).
d x d t = k V R M ( 1 x )
where d x d t is the gasification reaction rate, k V R M is the rate constant from the volume reaction model, x is carbon conversion.
Studies show that the apparent reaction rate constant is more suitable for predicting the kinetics of the gasification experiment, as it accounts for the reaction order, chemical reaction controls, and the concentration of the output gas [13]. Using a simplified Dutta and Wen model [14], the gasification rate can be expressed as:
d x d t = k a p p P R T ( 1 x )
where d x d t is the gasification reaction rate, k a p p is the apparent rate constant (L/mol·s), P is the pressure of the output gas (atm), R is the universal gas constant (L·atm·K−1·mol−1), T is temperature ( K ), and x is carbon conversion.
To calculate the apparent reaction rate constant, Equation (2) must be linearized first (as shown in Equation (3)); then, the slope of the graph plotted with the linear equation will be used to determine the apparent rate constant. The plots based on Equation (3) are shown in Section 3.7.1.
ln 1 x = k a p p P R T t
where d x d t is the gasification reaction rate, k a p p is the apparent rate constant (L/mol·s), P is the pressure of the output gas (atm), R is the universal gas constant (L·atm·K−1·mol−1), T is temperature ( K ), and x is carbon conversion.
Upon calculating the apparent rate constant from each model, the Arrhenius equation (Equation (4)) can be utilized to calculate the activation energy E a and pre-exponential factor A 0 .
k a p p = A 0 e E a R T
where R is the molar gas constant (L·atm·K−1·mol−1), T is temperature (K), E a is the activation energy (kJ/mol), A 0 is the pre-exponential factor, k a p p is the apparent rate constant.
The linearized form of Equation (4) is denoted in Equation (5).
ln k a p p = E a R 1 T + l n ( A 0 )
where R is the molar gas constant (L·atm·K−1·mol−1), T is temperature (K), E a is the activation energy (kJ/mol), A 0 is the pre-exponential factor, and k p the rate constant.
Based on Equation (5), the graph of “ l n ( k a p p ) vs. 1 / T ” is plotted, and the slope represents E a R , while the y-intercept represents l n ( A 0 ) . These calculations are carried out, and the plots made are shown in Section 3.7.2.

3. Results and Discussion

As stated above, the objectives of this study are to understand the effect of CO2 concentration on carbon conversion and product yield and to perform kinetic analysis using the volume reaction kinetic model to determine important parameters such as the activation energy, reaction rate, and pre-exponential factor.

3.1. SEM Analysis

SEM analysis of the biochar sample showed that the biochar is a very porous material, as depicted in Figure 2. During the gasification process, CO2 gas flows into these pores, encouraging surface reaction.
The gray surfaces are carbon, while the white surfaces represent ash, as shown in Figure 2c. From the proximate analysis of the biochar, shown in Table 1 (Section 2.2), the biochar contains about 48% carbon, hence the surface of the material being mostly gray. The proximate analysis also indicates an ash content of 18%, hence the presence of the white surfaces. Ash comprises elements such as oxygen, carbon, calcium, phosphorus, and silicon. An EDS analysis performed on the white region showed some of these elements, which validated the presence of ash.

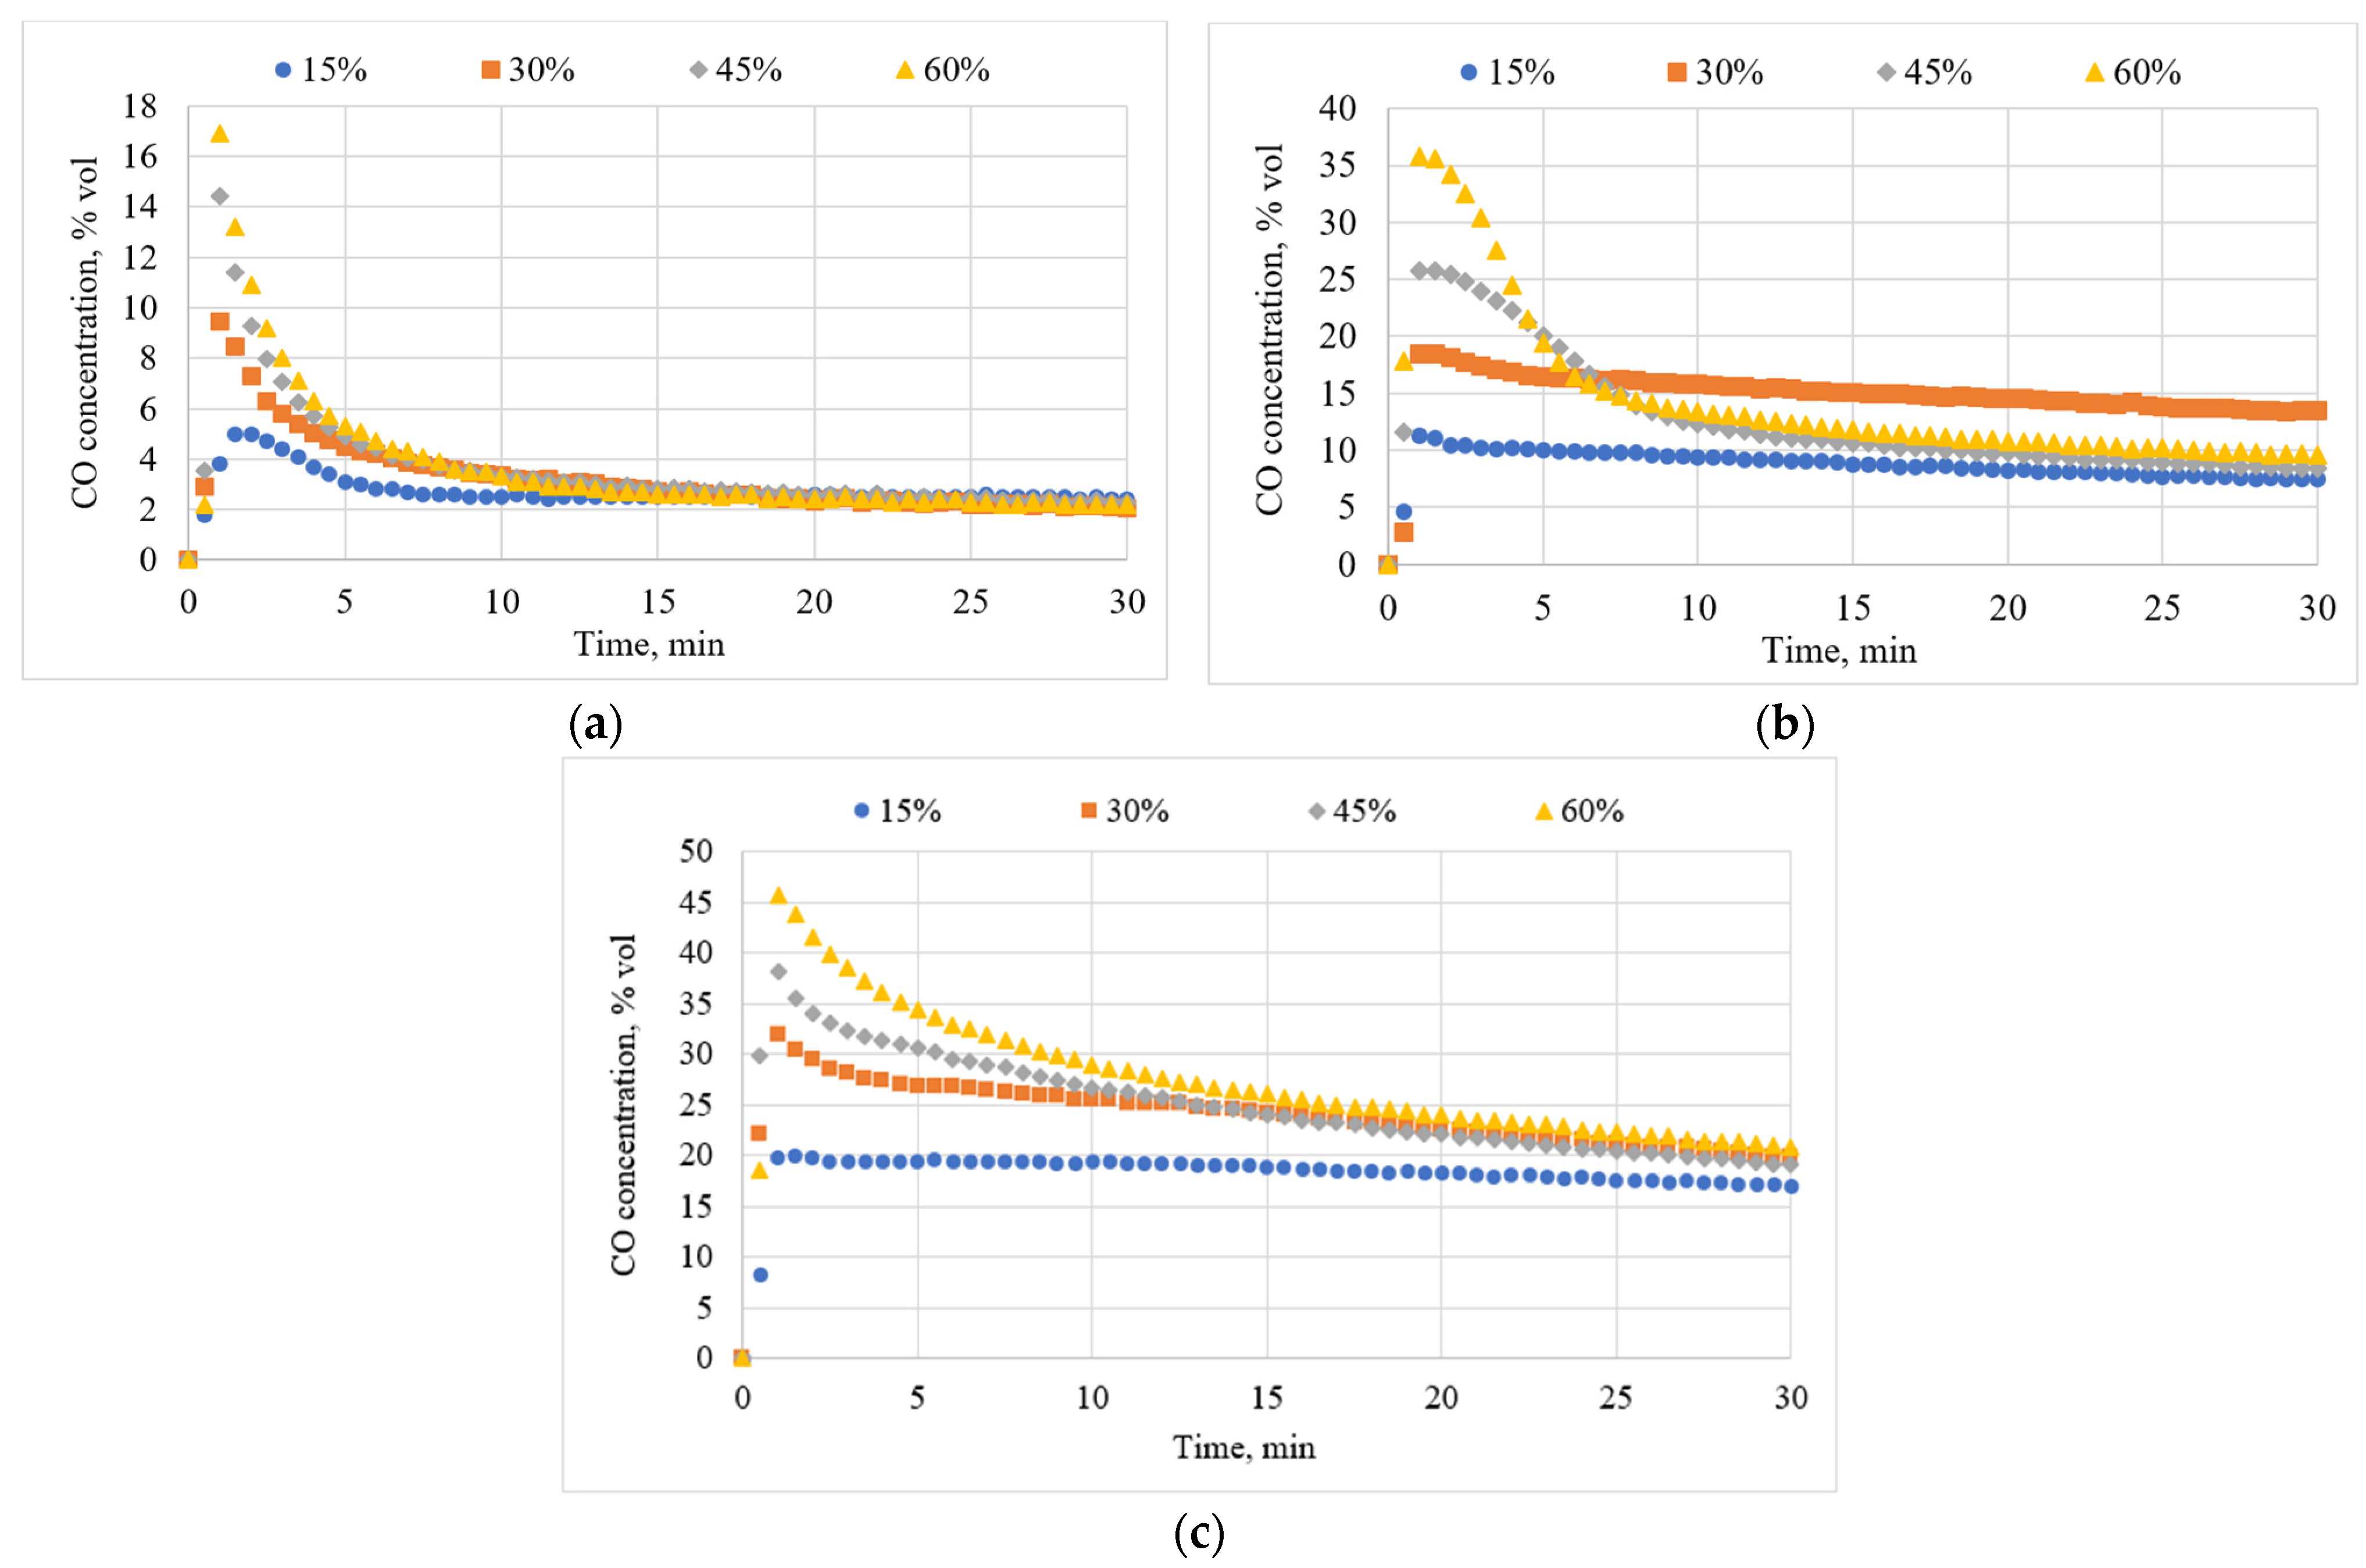
3.2. Effects of Temperature on CO Concentration

The main reaction, the Boudouard reaction, is an endothermic reaction; hence, energy is needed for the reaction to take place. The effects of temperature on CO concentration are shown in Figure 3. For all the tested concentrations of inlet CO2, the concentration of CO in the output gas increases as temperature increases. In Figure 3a (15% inlet CO2 concentration), the concentrations of CO at the 5 min mark are 3.2, 10, and 19.3% vol at 700, 800, and 900 ° C , respectively. In Figure 3b (30% inlet CO2 concentration), the concentrations of CO are 4.6, 17.2, and 26% vol at 700, 800, and 900 ° C , respectively. In Figure 3c (45% inlet CO2 concentration), the concentrations of CO are 5.4, 21.6, and 31.4% vol at 700, 800, and 900 ° C , respectively. In Figure 3d (60% inlet CO2 concentration), the concentrations of CO are 5.3, 22.5, and 34% vol at 700, 800, and 900 ° C , respectively. The 5 min mark was chosen to ensure consistent comparisons by avoiding initial data variations. Ultimately, a similar trend is seen for each CO2 inlet concentration, whether 15%, 30%, 45%, or 60% CO2. As the temperature increases, the concentration of CO in the output gas is expected to increase. This is because an increase in temperature will result in more free energy available to favor reactions. Gibbs free energy describes the amount of energy available in a system to do work. Gibbs free energy is given by Equation (6). As temperature increases, G ° becomes more negative, indicating the presence of more free energy.
G ° = H ° T S °
where G ° is the Gibbs free energy (kJ/mol); H ° is enthalpy change (kJ/mol); T is temperature (kJ/mol); S ° is entropy change (kJ/mol).
In addition, the CO concentration generally decreases with time at all temperatures. Once CO2 is introduced into the gasification chamber at the start of the experiment, the CO2 molecules move into the carbon active sites on the biochar and sponsor chemical reactions, resulting in the peak CO concentrations. Over time, the biochar is consumed, resulting in fewer vacant active sites and a gradual decrease in the carbon concentration, resulting in a decrease in the CO concentration. A similar trend in the effect of temperatures on the CO2 gasification of southern pine was reported by Sadhwani et al. [6]. They reported CO concentrations of 6, 7.3, 9.8, and 11.3 at 700, 790, 850, and 934 ° C , respectively, having performed 100% CO2 gasification of southern pine. Another study by Hu et al. [9] reported a similar trend in the CO concentration values of 16, 21, 40, and 43% vol at 700, 800, 900, and 1000 ° C , respectively, for 100% CO2 gasification of sewage sludge. A second run of these experiments is shown in Figure A1.

3.3. Effects of Inlet CO2 Concentration on CO Concentration

An increase in the inlet CO2 concentration led to an increase in the CO concentration. An increase in the inlet CO2 concentration increases the CO2 partial pressure. As the CO2 partial pressure increases, the number of effective collisions between reactant molecules increases, leading to higher char reactivity. The effects of the inlet CO2 concentration on the CO concentration are shown in Figure 4. For different operating temperatures, the concentration of CO in the output gas has an increasing trend as the inlet CO2 concentration increases. As shown in Figure 4a (700 ° C ), the concentrations of CO at the 5 min mark are 3.2, 4.6, 5.4, and 5.3% vol at 15%, 30%, 45%, and 60% inlet CO2 concentrations, respectively. In Figure 4b (800 ° C ), the concentrations of CO are 10, 17.2, 21.6, and 22.5% vol for 15%, 30%, 45%, and 60% inlet CO2 concentrations, respectively. In Figure 4c (900 ° C ), the concentrations of CO are 19.3, 26, 31.4, and 34% vol for 15%, 30%, 45%, and 60% inlet CO2 concentrations, respectively.
When the inlet CO2 concentration increases, more CO2 is available for chemical adsorption at the carbon active sites of the char. When the carbon concentration decreases and fewer vacant active sites are present as a result, the CO concentration is expected to decrease with time. For example, in Figure 4c, the peak CO concentrations are observed during the first 5 min; afterward, the CO concentrations for the 45 and 60% inlet CO2 concentrations start to merge. This is indicative of the fact that even though more CO2 was available in the case of 60%, there were fewer vacant active sites and a lower carbon concentration to sponsor the reaction. The number of active sites of the biochar decreases primarily due to the consumption of the biochar’s carbon content over time.
A similar trend in the effect of the inlet CO2 concentration using woodchips was reported by Cheng et al. [8], wherein they stated CO concentrations of 10, 14, 18, and 15.7% vol for inlet CO2 concentrations of 20, 40, 60, and 80% (air balance), respectively, across a temperature range of 875 to 950 ° C . Another study undertaken by Shen et al. [7] on woody biomass using CO2 (air balance) reported CO concentrations of 20 and 40% vol for 700 and 800 ° C , respectively. Although a similar trend of an increasing CO concentration with an increasing inlet CO2 concentration is seen in the study carried out by Cheng et al. [8], they noted that they did not observe increases at a 60% inlet CO2 concentration. A second run of these experiments is shown in Figure A2.

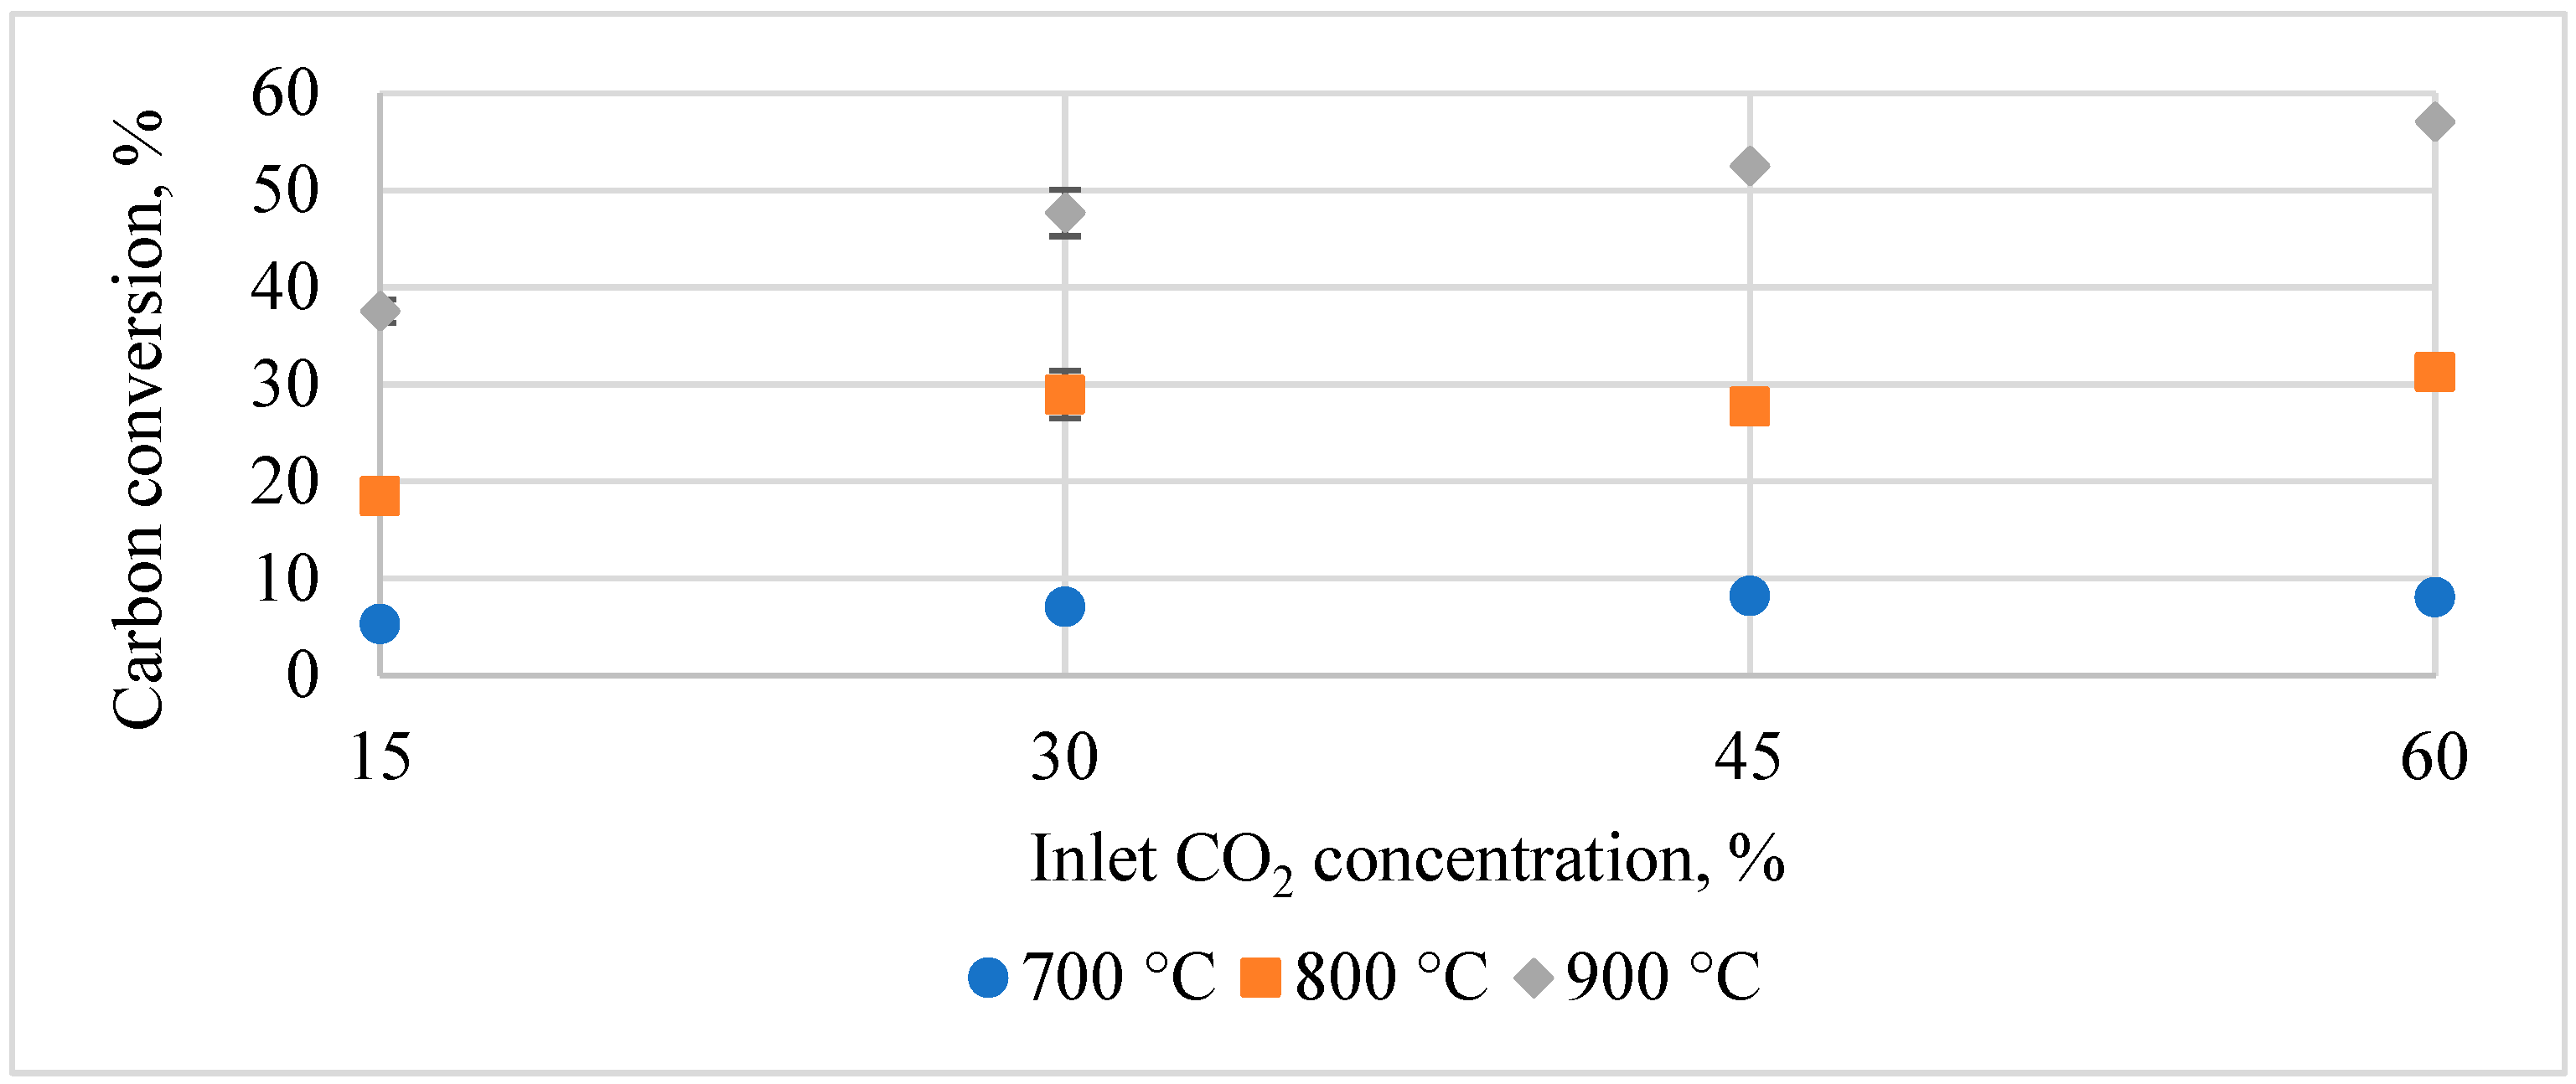
3.4. Effects of Temperature and Inlet CO2 Concentration on Carbon Conversion

Carbon conversion describes how much carbon in the biochar is converted into CO during the reaction time, in this case 30 min. To calculate the carbon conversion, the difference between the initial biochar mass and the instantaneous mass was divided by the initial mass, as shown in Equation (7).
x = w 0 w t w 0
where x is carbon conversion; w 0 is the initial weight of the char (g); w t is the instantaneous weight of the char (g).
As discussed in Section 3.2 and Section 3.3, the CO concentration increases as temperature and the inlet CO2 concentration increase. Therefore, carbon conversion increases as both the temperature and inlet CO2 concentration increase. In Figure 5, the carbon conversion of the biochar varying against temperature and CO2 inlet concentration is shown. While the carbon conversion is at a low of 5.3% at 700   ° C and a 15% inlet CO2 concentration, the carbon conversion at 900 ° C and a 60% inlet CO2 concentration is 57.1%. The recommended operating conditions therefore to maximize carbon conversion are a temperature of 900 ° C and above and an inlet CO2 concentration of 60%.

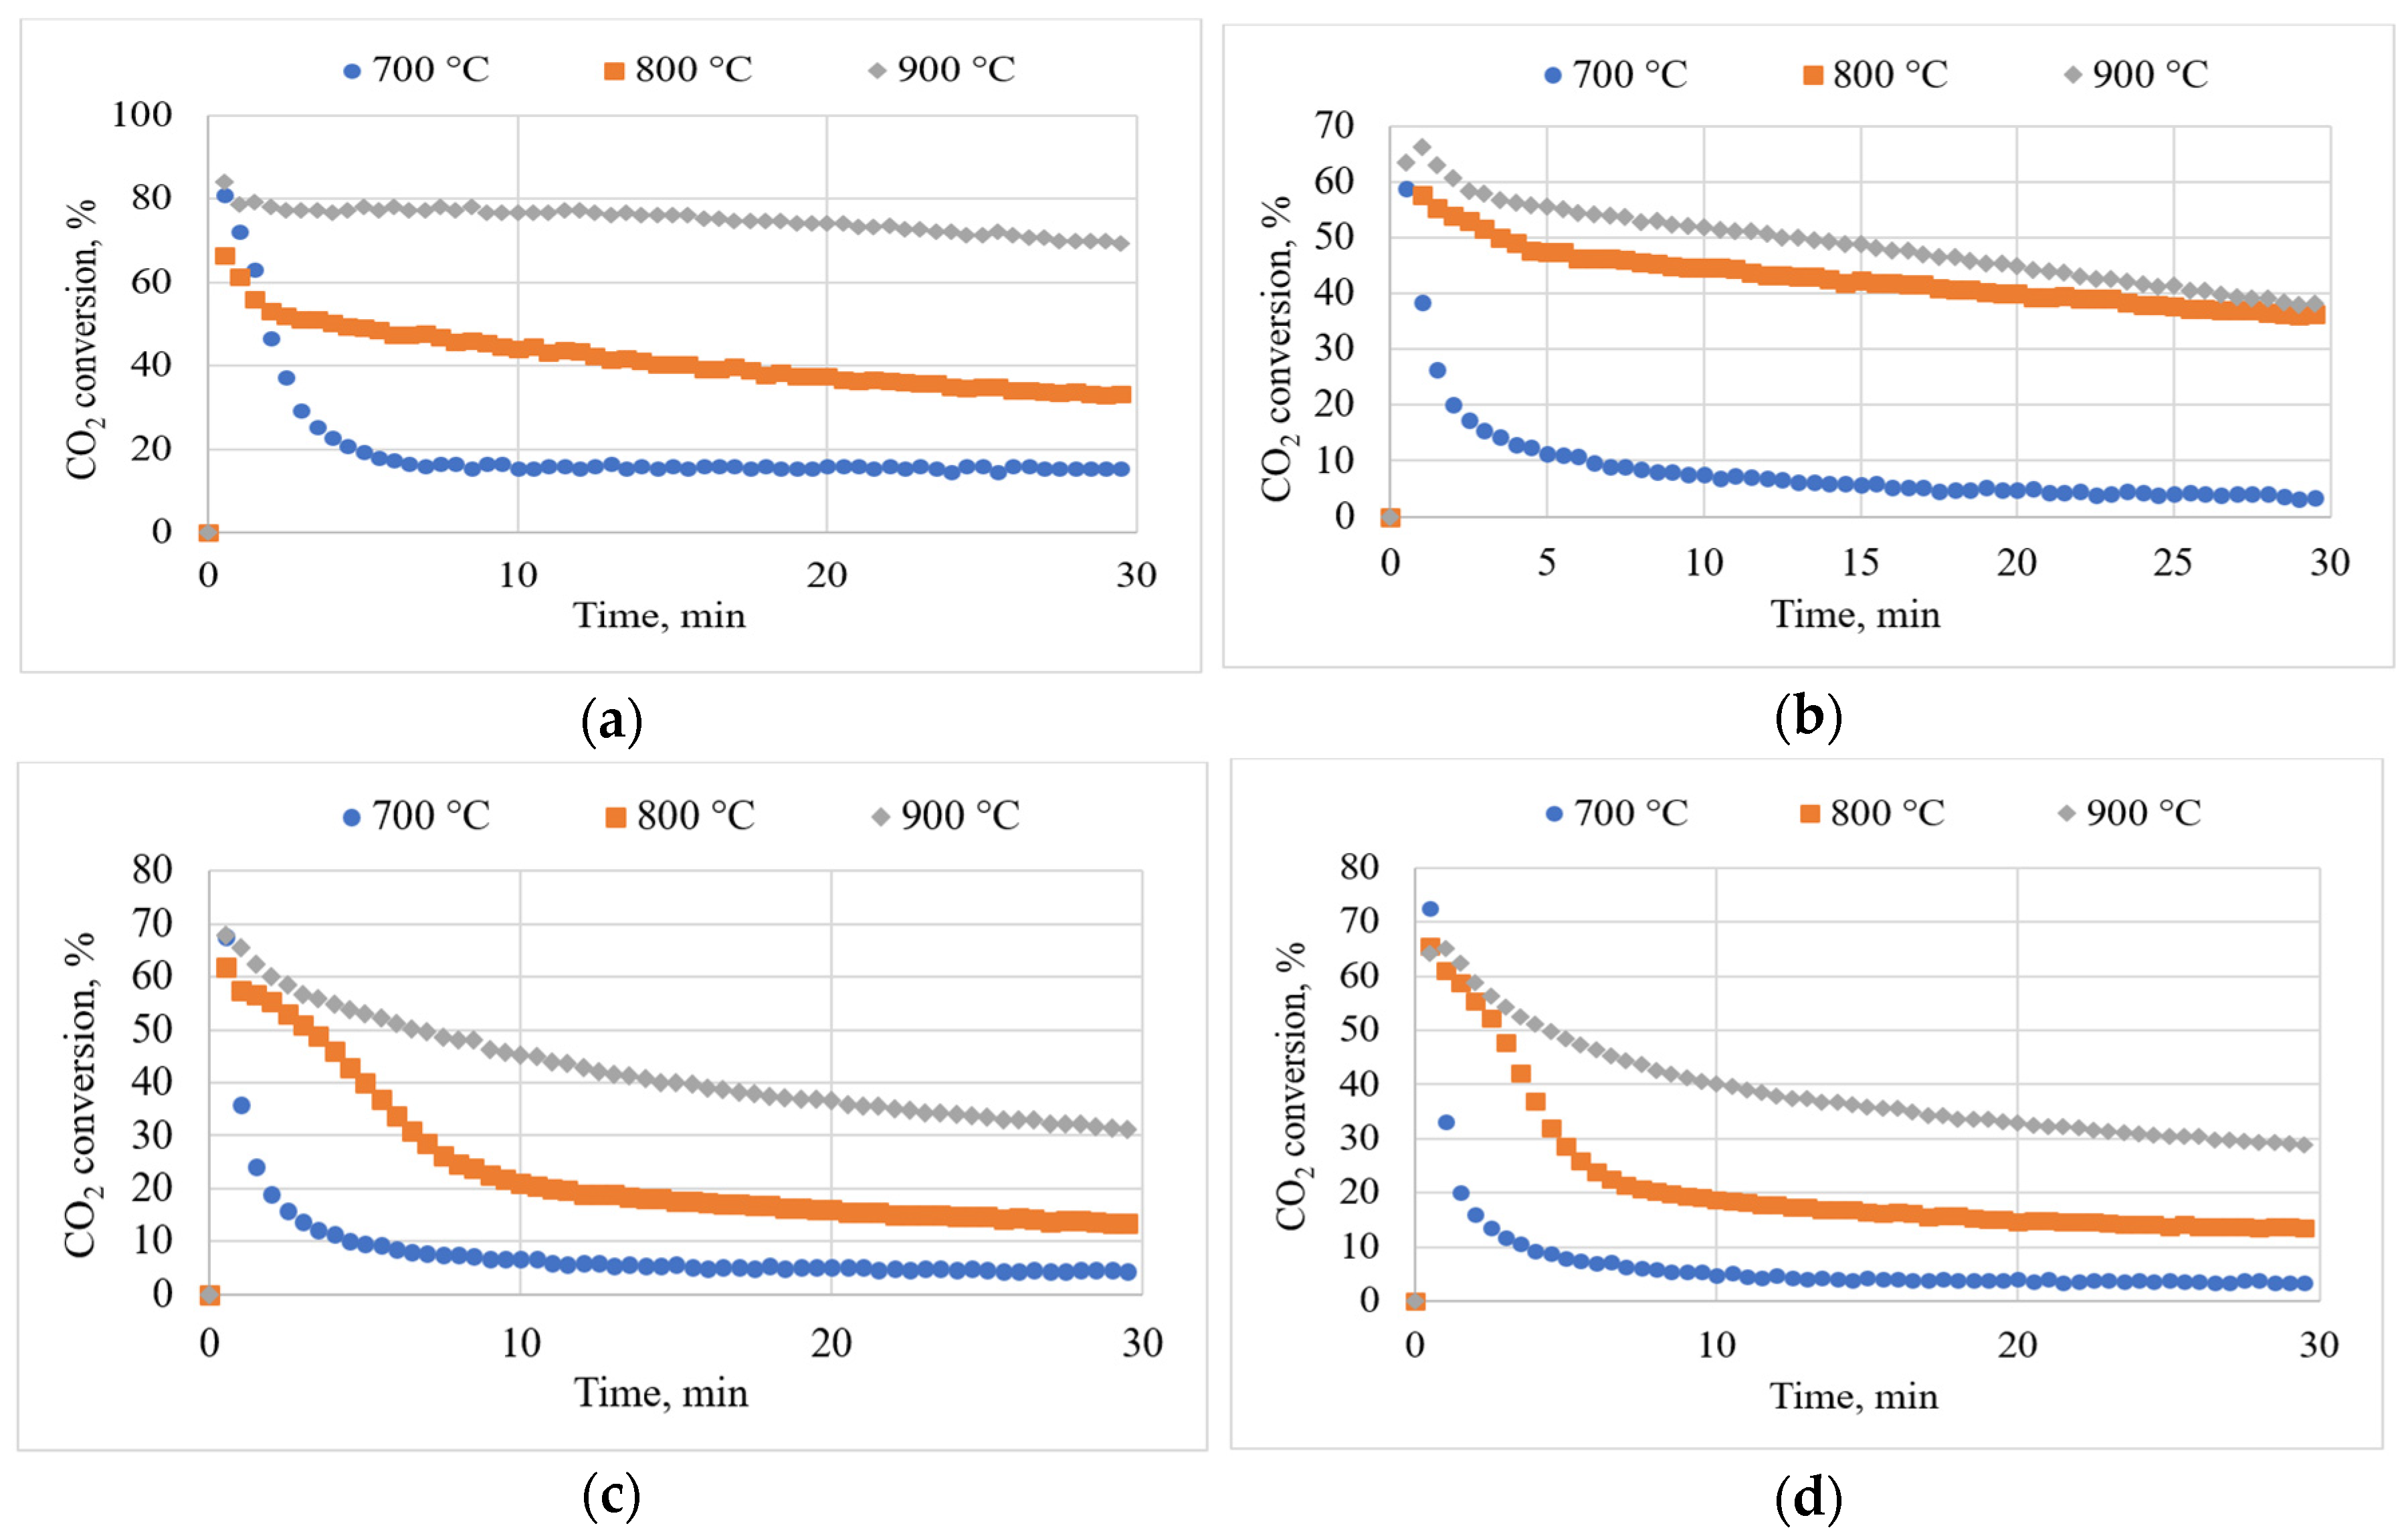
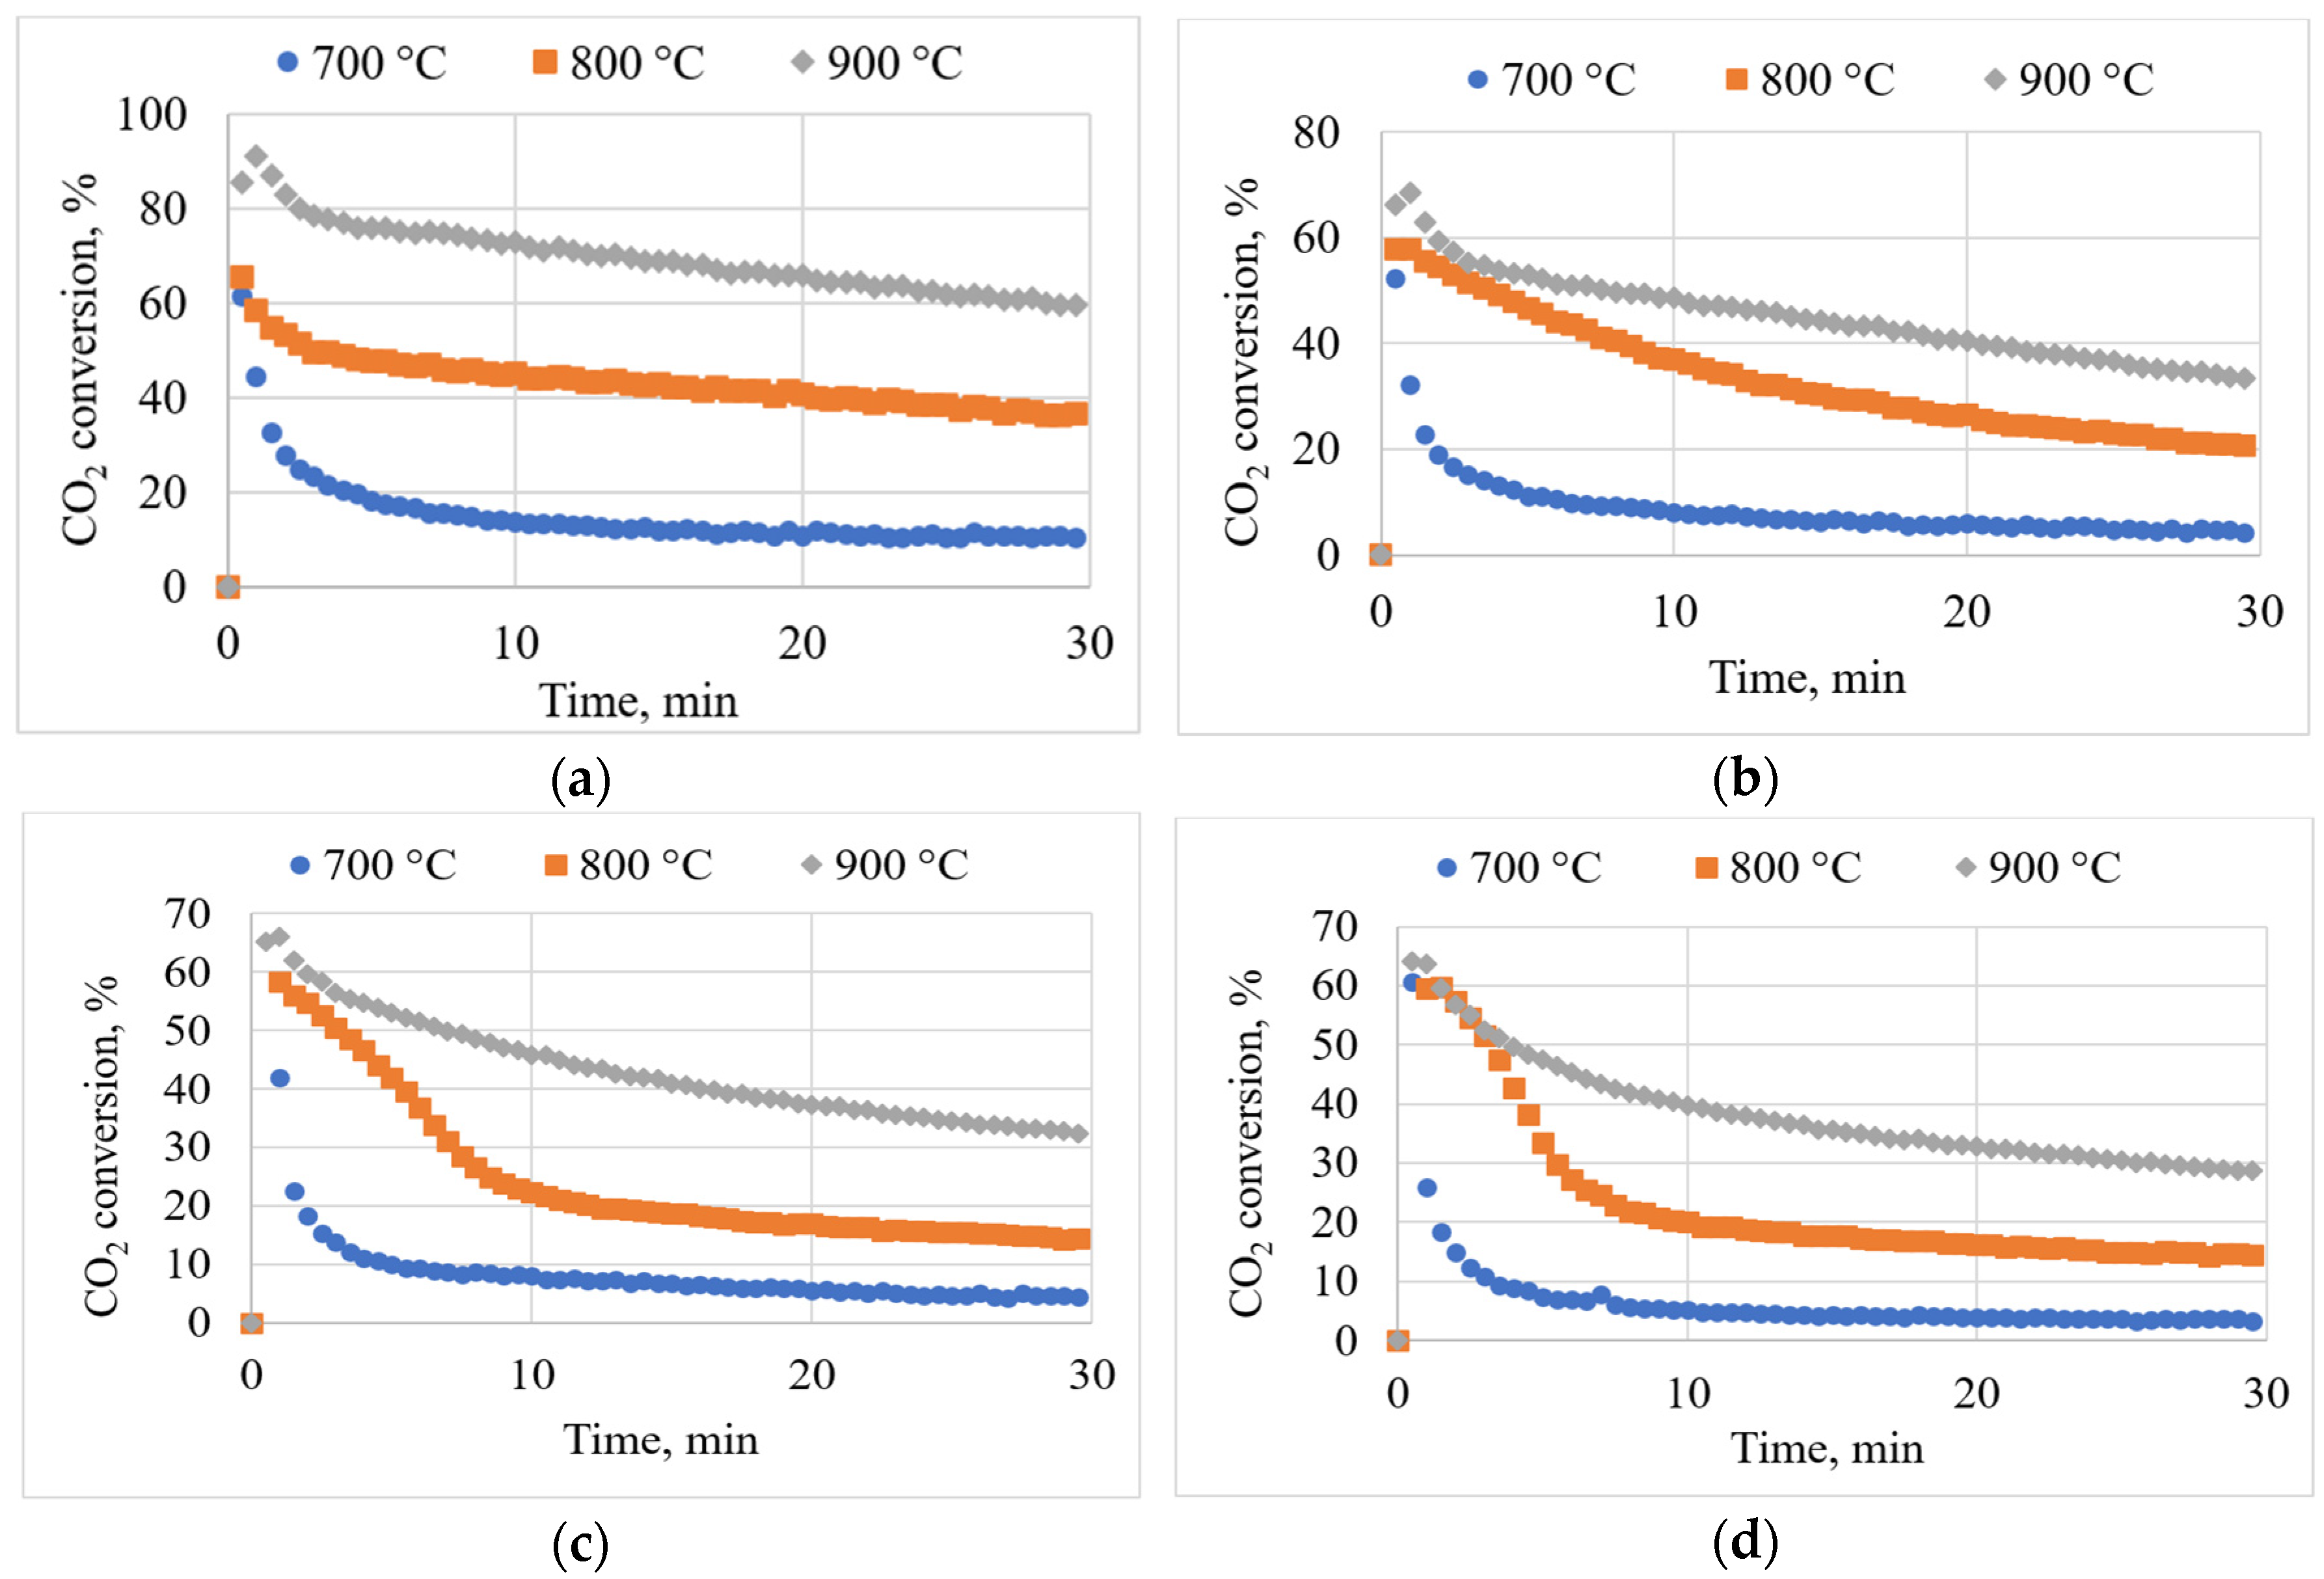
3.5. Effects of Temperature on CO2 Conversion

CO2 conversion describes how much CO2 is converted into a desirable product such as CO during the reaction. The CO2 conversion was calculated using Equation (8), where the difference in the moles of CO2 at the inlet and outlet is divided by the moles of CO2 at the inlet. As temperature increases, the CO2 conversion is expected to increase. This is because the main reaction that sponsors this conversion is the Boudouard reaction, which is endothermic in nature. An increase in temperature therefore will result in more CO2 being converted into CO.
C O 2   C o n v e r s i o n = 1 n C O 2 , o u t n C O 2 , i n 100 %
where n C O 2 , o u t is the moles of CO2 at the outlet; n C O 2 , i n is the moles of CO2 at the inlet.
The effects of temperature on CO2 conversion are shown in Figure 6. For the different inlet CO2 concentrations, the conversion of CO2 increases as temperature increases. In Figure 6a (15% inlet CO2 concentration), the CO2 conversion at the 5 min mark is 18.1, 48, and 76% at 700, 800, and 900 ° C , respectively. In Figure 6b (30% inlet CO2 concentration), the CO2 conversion is 11.1, 47, and 53% at 700, 800, and 900 ° C , respectively. In Figure 6c (45% inlet CO2 concentration), the CO2 conversion is 10.1, 42, and 53% at 700, 800, and 900 ° C , respectively. In Figure 6d (60% inlet CO2 concentration), the CO2 conversion is 7.4, 34, and 47% at 700, 800, and 900 ° C , respectively. Across all the inlet CO2 concentrations, the trend is similar, with the highest CO2 conversion of 76% occurring at 900 ° C and a 15% inlet CO2 concentration.
Though CO2 conversion increases with temperature, the CO2 conversion at a specific temperature decreases with time, as shown in Figure 6. This occurs due to the fact that there is less carbon (in the biochar) to react with the CO2 molecules, as carbon is being consumed over time during the experiment. The absence of vacant active sites results in less CO2 conversion over time. A second run of these experiments is shown in Figure A3.

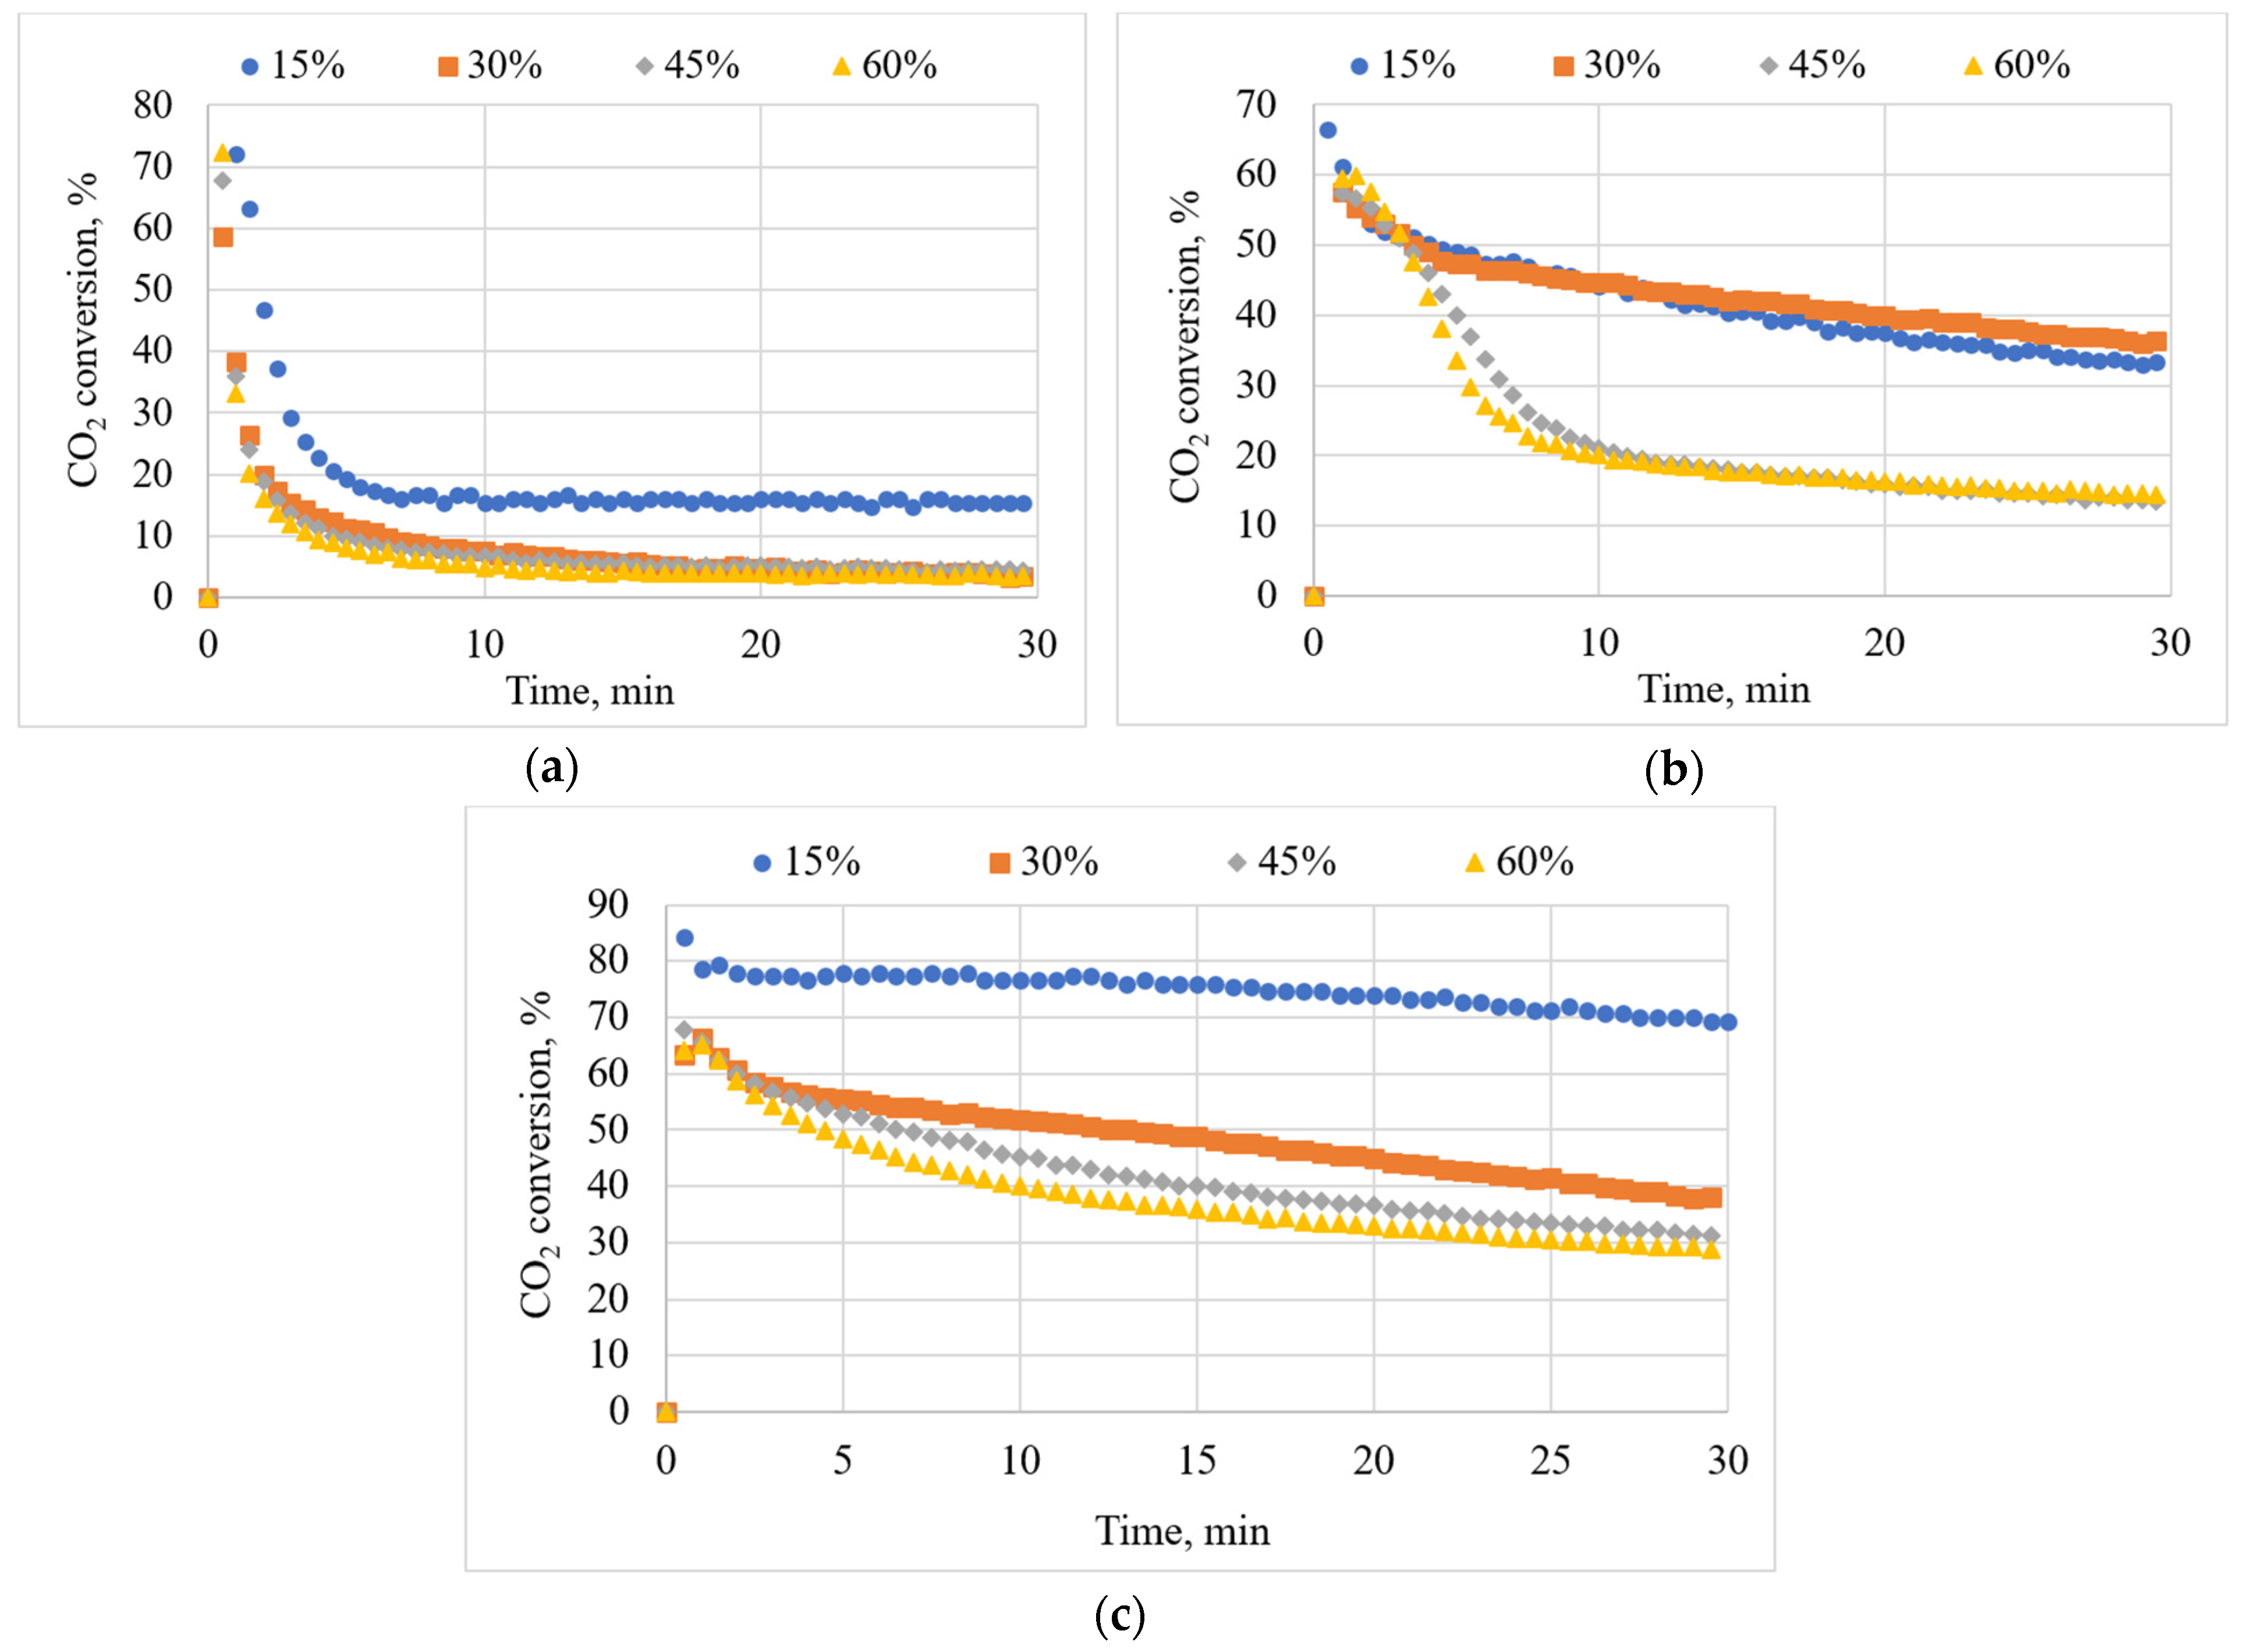
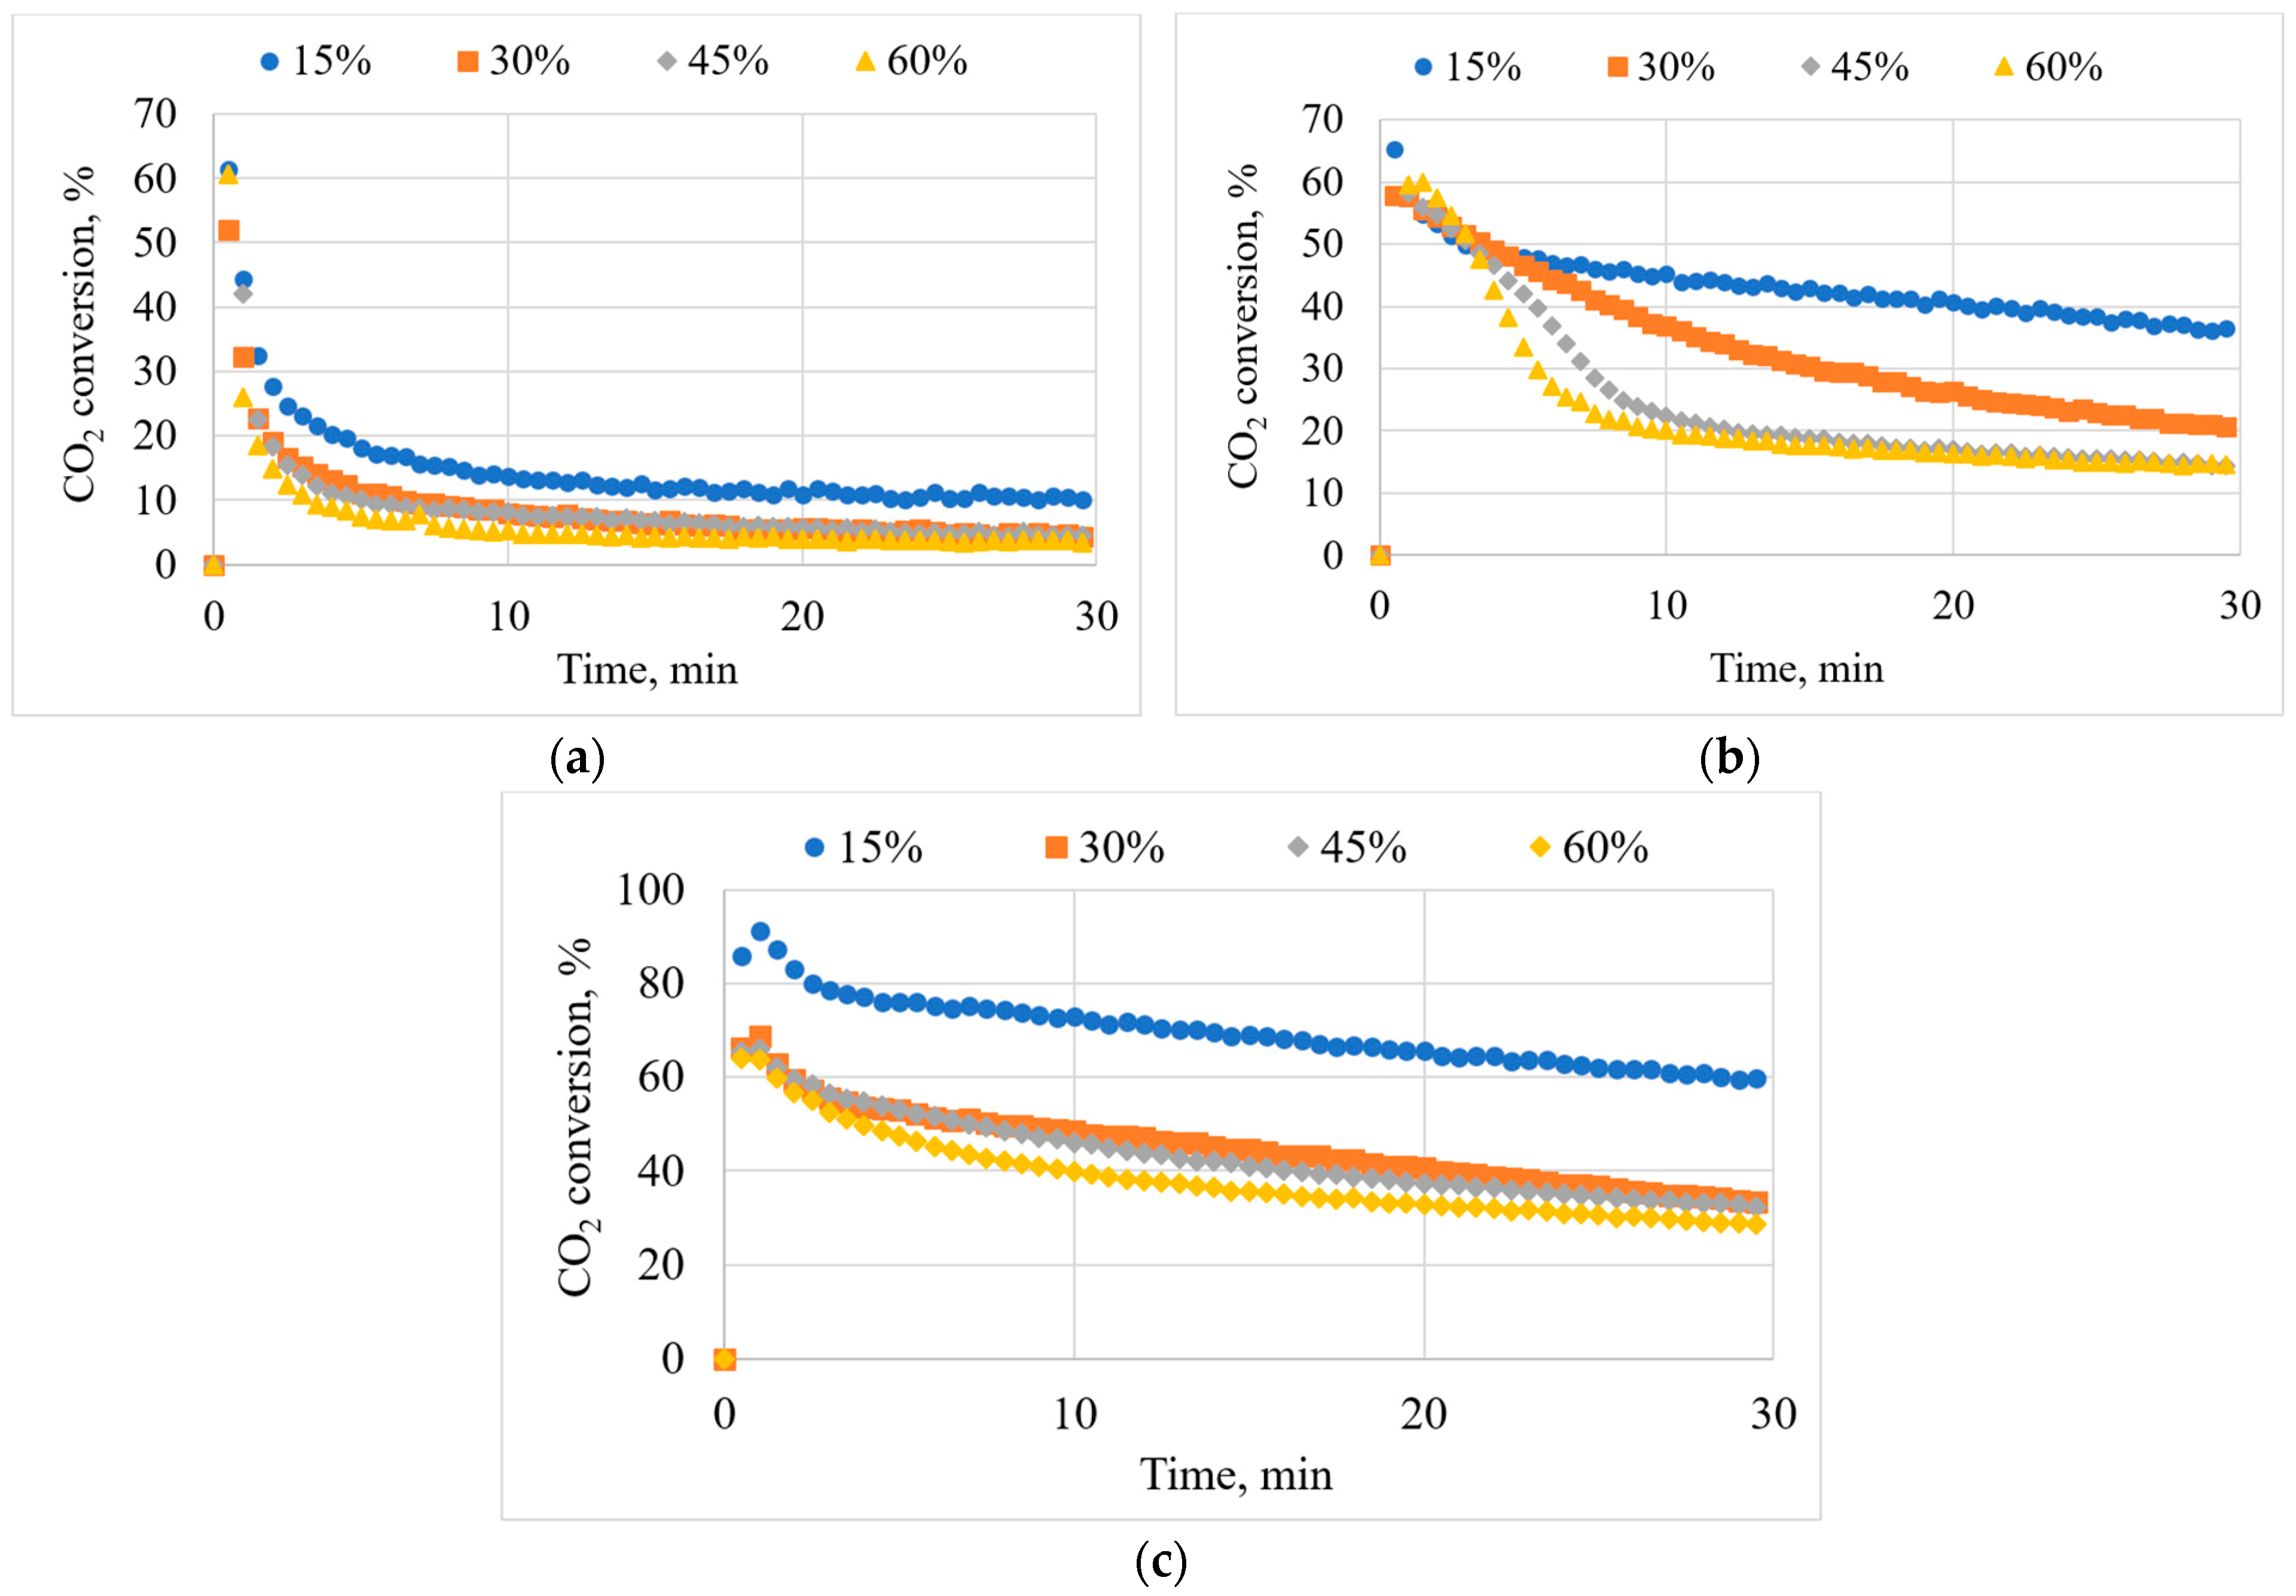
3.6. Effects of Inlet CO2 Concentration on CO2 Conversion

To understand how the inlet CO2 concentration affects the CO2 conversion, it is important to study how the equilibrium constant ( k p ) varies at different partial pressures. For a chemical reaction involving gases, the pressure exerted by the gases can be used to calculate the equilibrium constant for varied partial pressures of gases. The equilibrium constant, k p , can therefore be expressed as the ratio of the partial pressure of the products to the partial pressure of the reactants, as denoted in Equation (9).
k p = P p r o d u c t s P r e a c t a n t s
where k p is the equilibrium constant; P p r o d u c t s is the partial pressure of the products; P r e a c t a n t s is the partial pressure of the reactants.
An increase in the inlet CO2 concentration leads to an increase in the partial pressure of CO2. This increase in partial pressure results in a lower k p , signifying that the reverse reaction is being favored at a higher CO2 concentration. When the reverse reaction is favored, that means the CO2 conversion efficiency is lower.
The effects of the inlet CO2 concentration on CO2 conversion are shown in Figure 7. For different operating temperatures, CO2 conversion decreases as the inlet CO2 concentration increases. In Figure 7a (700 ° C ), the CO2 conversion at the 5 min mark is 18.1, 11.1, 10.1, and 7.4 for 15, 30, 45, and 60% inlet CO2 concentrations, respectively. In Figure 7b (800 ° C ), the CO2 conversion is 48, 47, 42, and 34% for 15, 30, 45, and 60% inlet CO2 concentrations, respectively. In Figure 7c (900 ° C ), the CO2 conversion is 76, 53, 53, and 47% for 15, 30, 45, and 60% inlet CO2 concentrations, respectively. Across all temperatures, the CO2 conversion decreases as the inlet CO2 concentration increases.
The decrease in the k p values as the inlet CO2 concentration increases indicates that the CO2 conversion is lower at higher inlet concentrations of CO2. Another reason for this trend is due to a phenomenon called the CO inhibition effect. In a chemically controlled surface reaction, there are three subsequent processes that can take place: (1) chemical adsorption of CO2 on the solid surface, (2) the surface reaction of CO2 with the carbon in the char, and (3) the desorption of the product, CO, from the solid surface [15,16]. When the adsorption of CO2 is the rate controlling step, an increase in CO2 partial pressure will lead to an increase in the reaction rate. When the desorption of CO from the solid surface, however, is the rate controlling step, an increase in CO2 partial pressure will not affect the char’s reactivity, and thus CO2 conversion decreases. This is called the CO inhibition effect.
The highest CO2 conversion occurs at a CO2 inlet concentration of 15%. Knowing that the highest CO2 conversion occurs at a 15% CO2 concentration is beneficial because it implies that flue gases that are captured at low CO2 concentrations can be used directly for the gasification process. This eliminates the need for carbon sequestration and therefore saves costs. It is worth noting that there are other impurities that may need to be removed before the captured CO2 is ready for use for gasification. A second run of these experiments is shown in Figure A4.

3.7. Determination of Kinetic Parameters

In this section, the steps and calculations employed to determine the gasification rate constant, as well as the activation energy and pre-exponential factor, are discussed.

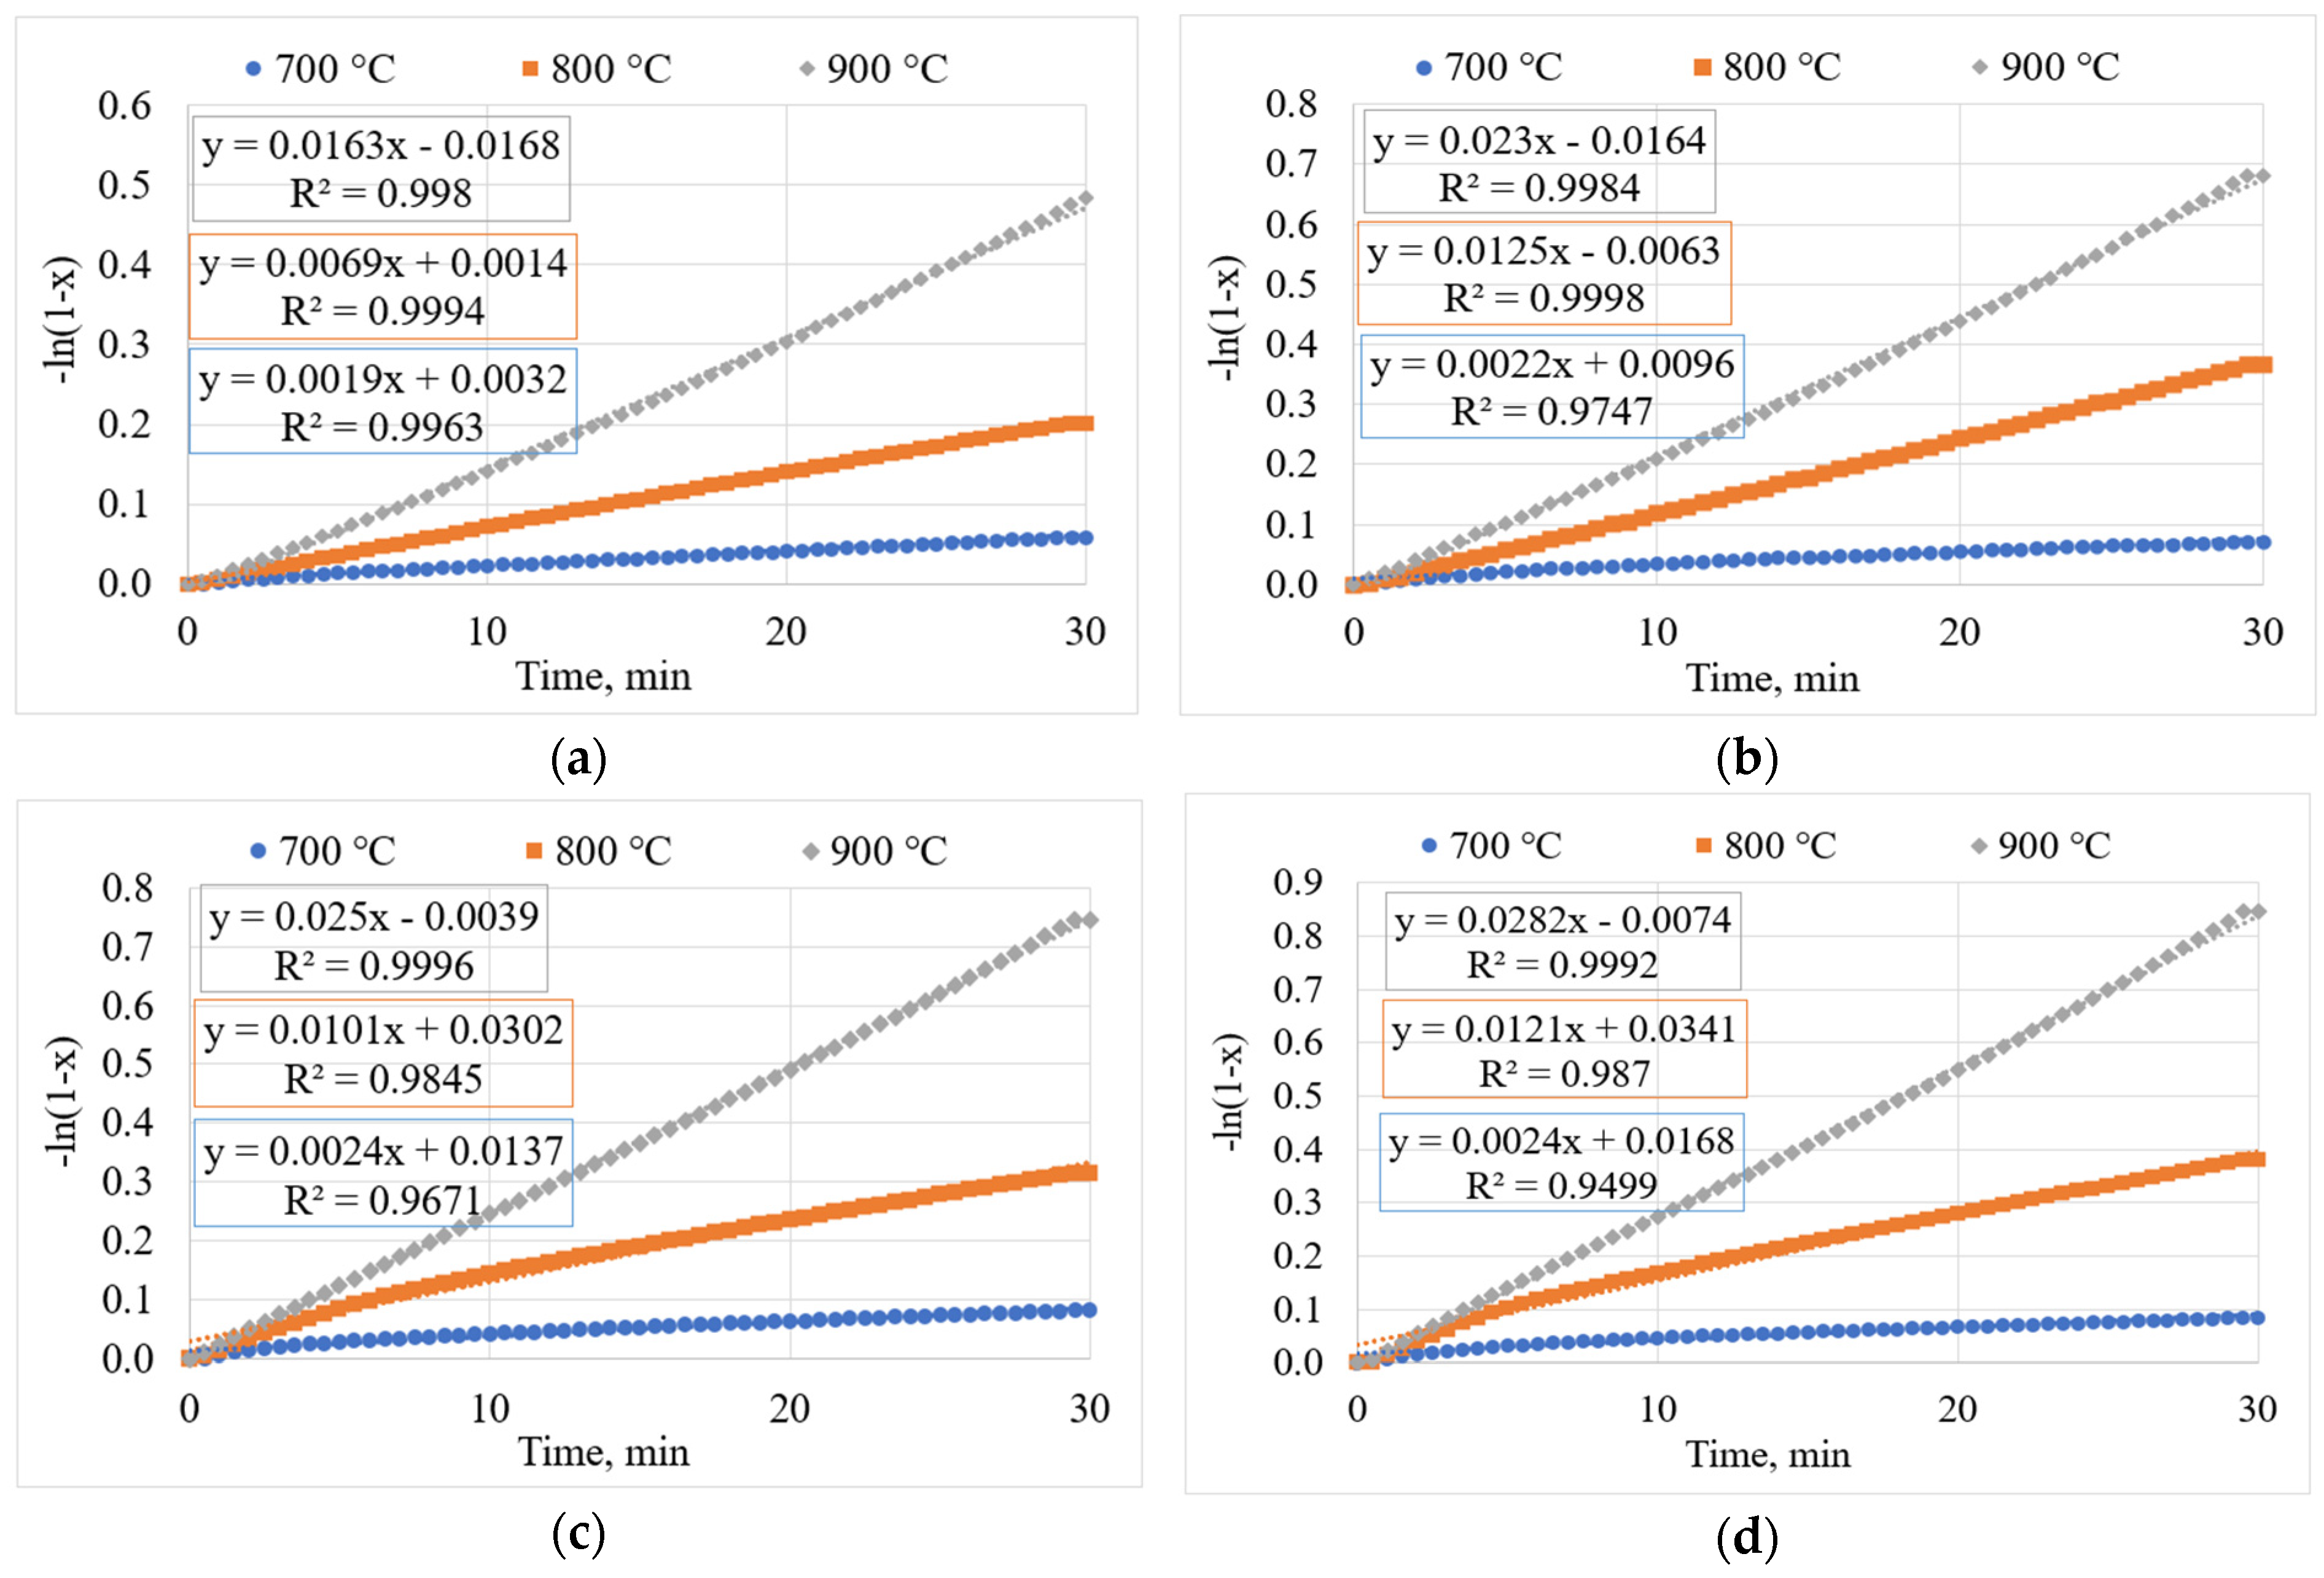
3.7.1. Determining the Gasification Rate Constant (kapp)

Having calculated the carbon conversion x using Equation (7) (discussed in Section 3.4), Equation (3) (discussed in Section 2.3) is used to calculate the apparent rate constant (kapp). The graphs of “ ln 1 x vs. time” for 15%, 30%, 45%, and 60% inlet CO2 concentrations are shown in Figure 8. In Figure 8, the plots for the different temperatures are shown alongside the equations for the lines. A second run of these experiments is shown in Figure A5.
To avoid unstable data and improve the accuracy, the graphs shown in Figure 8 were truncated to only include data points from 4 min to 13 min. The resulting slope, which represents “ k a p p P R T ”, as discussed in Equation (16), was used to calculate the apparent rate constant. The values for k a p p for each experiment are recorded and shown in Table 2. The k a p p values shown in Table 2 are the average values from two runs of each experiment for validation purposes.

3.7.2. Determining the Activation Energy and Pre-Exponential Factor

Once k a p p is calculated, ln ( k a p p ) can be calculated and plotted against temperature based on Equation (5), as discussed in Section 2.3. The slope of the graph will represent E a R , while the y-intercept will represent ln( A 0 ). The graphs of “ln( k a p p ) vs. temperature” are shown in Figure 9, and the activation energy ( E a ) and pre-exponential factor ( A 0 ) values are outlined in Table 3. These values in Table 3 are the average values from two runs of each experiment for validation purposes.
The activation energy reported in this study was within the range of 108 to 117 kJ/mol. Since the activation energy describes the minimum amount of energy needed to sponsor a chemical reaction, it should stay about the same regardless of temperature and concentration variations. The closeness in values reported in this present study is a sign of accuracy. The activation energy values reported by other researchers were comparable. For example, 140.7 and 163.5 kJ/mol [10], 185.8 and 211.7 [11], and 100.4 and 127.9 kJ/mol [12].

4. Conclusions

As a contribution to sustainability goal number 13, this study proposes an efficient carbon utilization pathway, where captured CO2 can be used in the gasification of biochar (a carbon-rich waste material) to produce useful fuels and chemicals. With the captured CO2 coming at various concentrations, this study aimed to investigate the effects of the CO2 concentration on the carbon conversion and product yield, alongside performing kinetic analysis, using the volume reaction model, to determine important parameters such as the activation energy and pre-exponential factor. The parameters employed in this study include gasification temperatures of 700, 800, and 900 ° C ; inlet CO2 concentrations of 15, 30, 45, and 60% by volume (N2 balance); and an inlet CO2 flow rate of 5 L/min.
A positive correlation was observed between temperature, inlet CO2 concentration, and carbon conversion efficiency. In other words, an increase in the temperature and inlet CO2 concentration resulted in an increase in the carbon conversion efficiency, with the maximum conversion of 57.1% occurring at 900 ° C and a 60% inlet CO2 concentration.
The study also revealed that the CO2 conversion increased with temperature but decreased with an increasing inlet CO2 concentration. The maximum CO2 conversion reported in this study is 76%, occurring at 900 ° C and a 15% inlet CO2 concentration.
The activation energy was found in the range of 109 to 117 kJ/mol and the pre-exponential factor found in the range of 63 to 253 s−1 in this study.
This study explains the relationship between the inlet CO2 concentration and carbon conversion and demonstrates that the CO2 gasification of biochar is a viable pathway for utilizing captured CO2 to produce useful fuels and chemicals. The advantage of this process is that efficient waste disposal takes place simultaneously since the feedstock is waste material. Another important finding in this study is that the CO2 conversion is higher at lower inlet concentrations of CO2. This implies that flue gases captured at low CO2 concentrations can be used directly for gasification. This eliminates the need for carbon sequestration and therefore saves costs. It is worth noting that there are other impurities that may need to be removed before the captured CO2 can be used for gasification. The kinetic parameters calculated in this study can be used by engineers in their design process to perform scaled-up gasification studies and optimize clean energy production. While this study is performed using a batch-type gasification process and operated at a maximum temperature of 900 ° C , future studies could employ a continuous gasification process and higher temperatures of 1000 to 1200 ° C .

Author Contributions

Conceptualization, N.O. and P.B.; methodology, N.O. and P.B.; validation, N.O. and P.B.; formal analysis, N.O.; investigation, N.O.; resources, P.B.; data curation, N.O. and P.B.; writing—original draft preparation, N.O.; writing—review and editing, P.B.; visualization, N.O. and P.B.; supervision, P.B.; project administration, P.B.; funding acquisition, P.B. All authors have read and agreed to the published version of the manuscript.

Funding

This research received no external funding.

Institutional Review Board Statement

Not applicable.

Informed Consent Statement

Not applicable.

Data Availability Statement

The additional data are provided in Appendix A.

Acknowledgments

The authors greatly acknowledge the funding and facilities provided by the Department of Mechanical Engineering at Allen E. Paulson College of Engineering and Computing at Georgia Southern University, Statesboro, Georgia, USA.

Conflicts of Interest

The authors declare no conflicts of interest.

Appendix A

The nomenclature utilized in this study is shown in Table A1.
Table A1. Nomenclature.
FTFischer–Tropsch
CCSCarbon capture and storage
GHGGreenhouse gas
w o Initial weight of char
w t Instantaneous weight of char
SEMScanning electron microscopy
TGAThermogravimetric analysis
r Gasification rate
x Carbon conversion
k a p p Apparent reaction rate
E a Activation energy
A 0 Pre-exponential factor
R Molar gas constant
T Temperature
G ° Gibbs free energy
H Enthalpy change
P p r o d u c t s Partial pressure of products
P r e a c t a n t s Partial pressure of reactants
As discussed in the paper, the experiments in this research were run twice for validation purposes. While Trial 1 was used to depict the results, where the use of error bars was not feasible, Trial 2 is shown here.
Figure A1. Effects of temperature on CO concentration for various inlet CO2 concentrations (Trial 2): (a) 15% CO2; (b) 30% CO2; (c) 45% CO2; (d) 60% CO2.
Sustainability 16 05044 g0a1
Figure A2. Effects of inlet CO2 concentration on CO concentration for various temperatures (Trial 2): (a) 700 ° C ; (b) 800 ° C ; (c) 900 ° C .
Sustainability 16 05044 g0a2
Figure A3. Effects of temperature on CO2 conversion at various inlet CO2 concentrations (Trial 2): (a) 15% CO2; (b) 30% CO2; (c) 45% CO2; (d) 60% CO2.
Sustainability 16 05044 g0a3
Figure A4. Effects of inlet CO2 concentration on CO2 conversion at various temperatures (Trial 2): (a) 700 ° C ; (b) 800 ° C ; (c) 900 ° C .
Sustainability 16 05044 g0a4
Figure A5. −ln(1 − x) vs. time for various inlet CO2 concentrations (Trial 2): (a) 15% CO2; (b) 30% CO2; (c) 45% CO2; (d) 60% CO2.
Sustainability 16 05044 g0a5
Table A2. List of instruments’ sensor accuracy.
InstrumentsAnalysisAccuracy
TGA Q50 V20.13Weighting±0.01%
NOVA gas analyzerCO2, CO, H2, and CH4 gas analysis1–2% FS
AALBORG mass flow controllerGas flow rate control±1%
Omega mass flow meterGas flow rate analysis±(0.8% of rdg + 0.2% FS)

References

  1. EIA. Energy Facts Explained. Available online: https://www.eia.gov/energyexplained/us-energy-facts/ (accessed on 4 February 2024).
  2. EPA. Climate Change Indicators: U.S. Greenhouse Gas Emissions. Available online: https://www.epa.gov/climate-indicators/climate-change-indicators-us-greenhouse-gas-emissions (accessed on 4 February 2024).
  3. United Nations. Transforming our World: The 2030 Agenda for Sustainable Development. Available online: https://sdgs.un.org/goals/goal13 (accessed on 12 April 2024).
  4. United Nations Climate Change. The Paris Agreement. Available online: https://unfccc.int/process-and-meetings/the-paris-agreement (accessed on 4 February 2024).
  5. Bobeck, J.; Peace, J.; Ahmad, F.M.; Munson, R. Carbon Utilization-A Vital and Effective Pathway for Decarbonization Summary Report. 2019. Available online: https://www.c2es.org/wp-content/uploads/2019/09/carbon-utilization-a-vital-and-effective-pathway-for-decarbonization.pdf (accessed on 4 February 2024).
  6. Sadhwani, N.; Adhikari, S.; Eden, M.R. Biomass Gasification Using Carbon Dioxide: Effect of Temperature, CO2/C Ratio, and the Study of Reactions Influencing the Process. Ind. Eng. Chem. Res. 2016, 55, 2883–2891. [Google Scholar] [CrossRef]
  7. Shen, Y.; Li, X.; Yao, Z.; Cui, X.; Wang, C.H. CO2 gasification of woody biomass: Experimental study from a lab-scale reactor to a small-scale autothermal gasifier. Energy 2019, 170, 497–506. [Google Scholar] [CrossRef]
  8. Cheng, Y.; Thow, Z.; Wang, C.H. Biomass gasification with CO2 in a fluidized bed. Powder Technol. 2016, 296, 87–101. [Google Scholar] [CrossRef]
  9. Hu, Y.; Yu, H.; Zhou, F.; Chen, D. A comparison between CO2 gasification of various biomass chars and coal char. Can. J. Chem. Eng. 2019, 97, 1326–1331. [Google Scholar] [CrossRef]
  10. Wang, G.; Zhang, J.; Shao, J.; Lui, Z.; Wang, H.; Li, X.; Zhang, P.; Geng, W.; Zhang, G. Experimental and modeling studies on CO2 gasification of biomass chars. Energy 2016, 114, 143–154. [Google Scholar] [CrossRef]
  11. Pacioni, T.R.; Soares, D.; Di Domenico, M.; Alves, J.L.F.; Virmond, E.; Moreira, R.P.M.; José, H.J. Kinetic modeling of CO2 gasification of biochars prepared from Brazilian agro-industrial residues: Effect of biomass indigenous mineral content. Biomass Convers. Biorefin. 2023, 13, 6675–6688. [Google Scholar] [CrossRef]
  12. Beagle, E.; Wang, Y.; Bell, D.; Belmont, E. Co-gasification of pine and oak biochar with sub-bituminous coal in carbon dioxide. Bioresour. Technol. 2018, 251, 31–39. [Google Scholar] [CrossRef] [PubMed]
  13. Bu, J. Kinetic Analysis of Coal and Biomass Co-gasification with Carbon Dioxide. Master’s Thesis, West Virginia University, Morgantown, WV, USA, 2009. [Google Scholar] [CrossRef]
  14. Dutta, S.; Wen, C.Y.; Belt, R.J. Reactivity of Coal and Char. 1. In Carbon Dioxide Atmosphere. Ind. Eng. Chem. 1977, 16, 20–30. [Google Scholar] [CrossRef]
  15. Ahmed, I.I.; Gupta, A.K. Kinetics of woodchips char gasification with steam and carbon dioxide. Appl. Energy 2011, 88, 1613–1619. [Google Scholar] [CrossRef]
  16. Mandapati, R.N.; Daggupati, S.; Mahajani, S.M.; Aghalayam, P.; Sapru, R.K.; Sharma, R.K.; Ganesh, A. Experiments and kinetic modeling for CO2 gasification of Indian coal chars in the context of underground coal gasification. Ind. Eng. Chem. 2012, 51, 15041–15052. [Google Scholar] [CrossRef]
Figure 1. Gasification experimental setup.
Sustainability 16 05044 g001
Figure 2. SEM of biochar sample with magnification of 530× (a), 5600× (b), and 1950× (c).
Sustainability 16 05044 g002
Figure 3. Effects of temperature on CO concentration for various inlet CO2 concentrations: (a) 15% CO2; (b) 30% CO2; (c) 45% CO2; (d) 60% CO2.
Sustainability 16 05044 g003
Figure 4. Effects of inlet CO2 concentration on CO concentration for various temperatures: (a) 700 ° C ; (b) 800 ° C ; (c) 900 ° C .
Sustainability 16 05044 g004
Figure 5. Carbon conversion while varying temperature and inlet CO2 concentration.
Sustainability 16 05044 g005
Figure 6. Effects of temperature on CO2 conversion for various inlet CO2 concentrations: (a) 15% CO2; (b) 30% CO2; (c) 45% CO2; (d) 60% CO2.
Sustainability 16 05044 g006
Figure 7. Effects of inlet CO2 concentration on CO2 conversion for various temperatures: (a) 700 ° C ; (b) 800 ° C ; (c) 900 ° C .
Sustainability 16 05044 g007
Figure 8. −ln(1 – x) vs. time for various inlet CO2 concentrations: (a) 15% CO2; (b) 30% CO2; (c) 45% CO2; (d) 60% CO2.
Sustainability 16 05044 g008
Figure 9. ln( k a p p ) vs. temperature for various inlet CO2 concentrations: (a) 15% CO2; (b) 30% CO2; (c) 45% CO2; (d) 60% CO2.
Sustainability 16 05044 g009
Table 1. Proximate and ultimate analyses of Kingsford biochar.
Ultimate Analysis (wt.%, daf)Proximate Analysis (wt. %)HHV (MJ/kg)
CHNOSVolatile Matter (db)Moisture (wb)Fixed Carbon (db)Ash (db)
57.532.530.3123.790.1935.744.9546.4917.7717.22
Table 2. Apparent rate constants at different temperatures and inlet CO2 concentrations.
Inlet CO2 Concentration k a p p at Different Temperatures (L/mol·min)
700   ° C 800   ° C 900   ° C
15%0.1220.5181.192
30%0.1720.8651.649
45%0.1930.8391.897
60%0.1820.9162.094
Table 3. Kinetic parameters from present study.
Inlet CO2 ConcentrationActivation Energy (kJ/mol)Pre-Exponential Factor (s−1)
1510963
3010887
45109105
60117253
Disclaimer/Publisher’s Note: The statements, opinions and data contained in all publications are solely those of the individual author(s) and contributor(s) and not of MDPI and/or the editor(s). MDPI and/or the editor(s) disclaim responsibility for any injury to people or property resulting from any ideas, methods, instructions or products referred to in the content.

