Abstract
Technology has revolutionized various industries; notably, chatbots impact healthcare through the efficient streamlining of medical procedures, cost reductions, and improved accessibility to healthcare services. Consequently, understanding how to promote the adoption of healthcare chatbots has become crucial for enhancing the healthcare industry and medical service quality. Despite numerous studies identifying factors influencing healthcare chatbot adoption, there is a notable lack of empirical verification regarding their interrelationships, leading to a significant knowledge gap. Therefore, this study aims to address this gap by developing a decision-making model to analyze the relationships among key factors regarding three dimensions: technology, user, and society. The model begins by filtering out insignificant factors based on experts’ opinions. Subsequently, it employs DEMATEL (Decision Making Trial and Evaluation Laboratory) to construct a causal relationships graph and the ISM (interpretive structural modeling) method to categorize these factors into a hierarchical order. To mitigate uncertainties stemming from the topic’s complexity, this study utilizes fuzzy sets and Z-number theory in the assessment process. The findings reveal a predominance of causal factors within the technological dimension. Notably, the quality of information provided by chatbots stands out as the most influential causal factor. The insights from this study suggest implications for both enterprises and governments to boost chatbot adoption in society.
1. Introduction
The progress in technology is sparking conversations about the potential transformation of various processes across industries, society, and the economy, with particular emphasis on its impact on the healthcare sector. The healthcare industry is known as an industry that comprises entities offering medical services, producing medical devices or medications, delivering medical coverage, or supporting the delivery of healthcare to individuals [1]. Healthcare facilities and caregivers globally, particularly in advanced economies, are actively integrating digital advancements, which aim to enhance both the quality of care provided and the operational efficiency of these establishments [2]. People’s awareness is moving towards patient-centered services. Hospitals and medical services have been moving their attention from treatment to disease prevention and health management to deal with the global aging population and healthcare costs around the world [3,4]. Therefore, this is the perfect time for new technologies, such as chatbots with their huge potential, to fulfill the demands of society.
Chatbots, also referred to as artificial conversational entities, interactive agents, smart bots, and digital assistants, are entities designed to engage in conversation and interact with users in various contexts [5]. A chatbot can also be defined as an artificial intelligence (AI) program that operates within the framework of the human–computer interaction model [6]. Chatbots save information in a database to find important words in sentences and decide how to respond to questions [7]. These are mimic systems that can copy how people talk to each other using techniques that understand language, process it naturally, and learn from machines [8]. The use of chatbots in healthcare has many practical applications, from seeking medical advice and booking medical appointments [9] to dealing with anxiety and depression [10] and even helping with cancer [11]. In addition, chatbots are said to be the solution to increasing mental healthcare access [12]. In particular, chatbots showed potential for fighting COVID-19 [13]. Despite these great benefits, healthcare chatbots, in fact, are not popular among the general public, as explained in a research study wherein only 6% of the participants had heard of a health chatbot [9]. These days, human–technology interactions have gained importance in modern life, so there have been a large number of studies revealing factors affecting the adoption of health chatbots. Nevertheless, the inquiry into which factors constitute key factors and the relationships among them remains unanswered. The process leading to that answer reflects a multi-attribute decision-making approach.
Multiple criteria decision-making (MCDM) techniques have been widely applied in many aspects of healthcare industry such as healthcare service quality [14,15,16], medical treatments [17,18,19], and technology applications [20,21,22]. However, regarding health chatbots, the applications of MCDM are limited and new. Santa Barletta et al. [23] applied the very traditional technique of analytic hierarchy process (AHP) to evaluate clinical health chatbots. Hsu [24] constructed a model for implementing chatbots within military mental health services using DEMATEL. AHP was also used to select chatbots in the healthcare industry in Thailand [25].
Considering the noted shortcomings in previous research, this study proposes a model to empirically investigate the key factors influencing the acceptability of healthcare chatbots. The model seeks to highlight the relationships among these factors and identify the pivotal factors within the system. Initially, the study will filter out insignificant factors and then employ DEMATEL and ISM techniques to explore these relationships. Furthermore, fuzzy sets and Z-numbers will be utilized to address uncertainty in expert assessments stemming from the novelty of the subject matter.
This research provides a methodological framework to facilitate decision-makers in systematically identifying root causes within complex systems. This systematic approach lays a robust foundation for the development of effective strategies. The study has achieved the following contributions:
- (1)
- After listing important factors that impact healthcare chatbot adoption in a broader context, the study can highlight these, which can assist with decision-making processes.
- (2)
- By pinpointing causal relationships and visually representing them, this study simplifies the complex evaluation system. This simplification aids in effectively exploring root problems and developing strategies.
- (3)
- Based on the results, this study provides managerial and theoretical implications for health chatbot adoption.
2. Literature Review
This section will present the list of factors identified from the literature and describe the methods used to obtain these factors.
2.1. Factor Identification Process
- (1)
- Identifying key terms: To discover relevant factors, we first generated key words related to the theme of healthcare chatbot adoption factors. This process yields a list of key terms, as shown in Table 1.
 Table 1. Keywords for identifying factors.
- (2)
- The identified keywords were used to search research databases for relevant factors.
2.2. Factors Influencing Health Chatbot Adoption
Twenty factors were identified and grouped into three dimensions: technology, user, and society.
2.2.1. Technology Dimension
The technology aspect pertains to the specific traits and capabilities of health chatbots.
- Usefulness
Perceived usefulness is one of the two factors in the technology acceptance model [26], used to study user acceptance of new technology. The acceptance of AI-driven chatbot services in healthcare shows a positive correlation with the usefulness of the chatbot [9]. The perceived benefits of healthcare chatbots are a direct predictor of adoption [27,28,29]. Moreover, perceived usefulness is a significant predictor of intention to continue using chatbots [30]. In this study, we propose usefulness to be the ability to meet the demand of patients.
- Integration
In a scoping review, it is suggested that chatbots’ interconnectedness with other devices can help to enhance the adoption of AI applications in healthcare [31].
- Security
Information insecurity is considered a barrier to chatbot adoption [9]. Data privacy is also a concern of patients using health AI applications [31].
- Quality of information
It is emphasized that initial failures of chatbots may adversely impact a patient’s willingness to look for mental health assistance in the future [32]. In another research study, most of the participants believed that reliable and accurate information about healthcare chatbots is important [9].
- Customization
It is suggested that, to improve the adoption of AI applications in healthcare, personalization and customization should be taken into account [31].
- Natural language ability
Natural language is an advanced ability of chatbots, which make them sound like humans. In healthcare, empathy is a crucial factor in building trust between service providers and patients; however, it should be displayed properly in verbal and nonverbal expressions [31].
- Human involvement
Miles et al. [33] found out that a general practitioners–chatbot approach is more acceptable than a chatbot-only approach. In addition, patients were less accepting of chatbots due to their perceived lack of empathy and the absence of a professional human approach [9].
2.2.2. User Dimension
The user dimension encompasses factors associated with individuals engaging with chatbots, including various aspects such as their attitudes toward these systems, educational backgrounds, health-related considerations, etc.
- Chatbot perception
Healthcare chatbot acceptability is highly correlated with positive attitudes and perceived trustworthiness towards heath chatbots [9]. Individuals held favorable views regarding healthcare chatbots and expressed a willingness to adopt these innovative technologies [27,34]. Furthermore, medical AI resistance bias can have a negative impact on the intention to switch to an AI chatbot [35].
- IT literacy
Chatbot acceptability in healthcare is negatively correlated with poor IT skills [9].
- Level of education
A cross-sectional study showed that highly educated users were more likely to engage with healthcare chatbots [36].
- Personal innovativeness
People are curious about how new technologies could improve health, and this is highly correlated with an intention to use health chatbots [9]. Those who look for complementary and alternative medicine tend to look for new solutions to improve their well-being and health [37]. Personal innovativeness was found to be a crucial factor influencing people’s intention to use a health chatbot [28].
- Health issues
For health problems such as sexual and mental health issues, it is preferable that these be dealt with by chatbots [9]. Nevertheless, these technological solutions are deemed less suitable for managing health problems of greater severity and, thus, should not be suggested in such cases [33].
- Hedonic motivation
Hedonic motivation is a popular factor in technology adoption research [38]. In a research about COVID-19 chatbots, the most influential predictor of readiness to use chatbots was shown to originate from the internal drive factor [27].
- Habit
People who regularly sought health information online were more prone to finding nearby healthcare services using healthcare chatbots. [36]. In addition, users’ habits influence their intention to use a health chatbot [28,36].
2.2.3. Society Dimension
This dimension holds a wider scope compared to others. These factors lie beyond the control of chatbot users or developers.
- Promotion
Although the popularity of chatbots in the field of public health has increased since COVID-19 [39], there existed a widespread lack of familiarity and understanding regarding health chatbots [9]. Numerous studies have underscored the limited public and clinical awareness regarding the capabilities of AI in healthcare and most respondents expressed a willingness to learn more about these capabilities [31].
- Cost
Acceptance hinges on the cost of AI diagnosis in comparison to that of doctors [40]. Moreover, the cost of healthcare chatbots can be an important element in regions with inadequate health insurance coverage [41].
- Social influence
People tend to conform to the opinions of others regarding healthcare chatbots, as found in an analysis [41].
- Healthcare infrastructure
There is a strong correlation between the technology adoption index and infrastructure in agriculture [42,43], which may also be applicable to the healthcare industry.
- Cultural norms
Some cultural dimensions were discovered to have notable moderation effects on the acceptance of service robots [44].
- Network externalities
Network externality was found to play a crucial role in influencing one’s adoption of a healthcare chatbot [28].
Table 2 summarizes the list of identified factors.
Table 2.
List of factors.
3. Methodology
This section introduces the methods utilized in the study and outlines the steps for their applications.
3.1. Experts’ Importance Integration
Considering varying levels of experience and expertise, each expert is assigned a specific weight indicating the significance of their assessment to the study. This is because giving priority to expertise during the aggregation stage can help mitigate unstable preferences [45]. Levels of expertise can be categorized according to years of experience in the field, consistency levels, or other pertinent indicators [46].
3.2. Exploring Relationships among Factors
DEMATEL is a technique introduced by the Geneva Research Centre of the Battelle Memorial Institute to solve sophisticated and intertwined issues [47]. In contrast to other traditional approaches such as the analytic hierarchy process, this technique can show relationships among factors through a causal diagram [48,49]. The result of DEMATEL is a diagraph showing interdependence among factors, which divide factors into cause and effect groups, with numbers showing strength of influence [50]. DEMATEL has been successfully applied to discover relationships and rankings among adoption factors in various different industries such as the manufacturing sector [51], healthcare [22], banking [52], and retailing [53].
ISM was developed by Warfield [54] to deal with complex problems with the help of experts. The method is interpretive, in that the experts’ expertise decides whether and how items are related, an overall structure is drawn from the set of items, and the specific relationships and overall structure are demonstrated in a digraph model [55]. ISM has been applied successfully in many fields to discover the relationships among adoption enablers and their ratings such as the adoption of solar energy products [56], barriers to the agriculture supply chain [57], cloud computing adoption [58], and barriers to m-commerce adoption [59].
Due to the effectiveness of these two techniques in exploring relationships among adoption factors, we advocate for their use in our study.
3.3. Addressing Uncertainty
When completing the surveys, experts use their experiences and knowledge to reflect the real situation. According to Tseng, Ming-Lang et al. [60], crisp numbers cannot present their evaluation. Experts need to depend on linguistic variables to express their evaluation. However, these linguistic preferences are not directly comparable values; therefore, fuzzy set theory is utilized to convert linguistic variables into crisp values. Moreover, along with fuzzy logic, Z-numbers facilitate the decision-making process when the information is imprecise and/or incomplete. Since health chatbots are still in the initial phases of development [12,39], there is a high level of uncertainty regarding the topic; therefore, this approach is excellent for addressing this issue.
3.4. The Proposed Methods
This section details the outline of our model, organized into three stages, as illustrated in Figure 1. The goals of the stages are listed as follows:
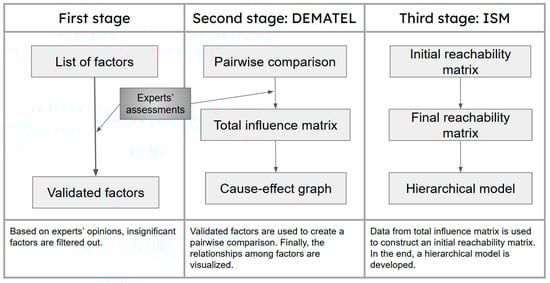
Figure 1.
Research flow chart.
- (1)
- Developing the list of validated factors by filtering out insignificant ones.
- (2)
- Evaluating the relationships among factors within each dimension and across the entire system.
- (3)
- Establishing a hierarchical order for the factors based on their relationships.
- (1)
- First stage: Developing the list of validated factors by filtering out insignificant ones.
After defining the factors, a survey is created to ask experts about the levels of significance of the factors in practice. If the expert k thinks the factor j is significant in real life, he/she will give the answer “Yes”, which equals to 1 ; otherwise, it will be “No”, which equals to 0 . A sample of the first questionnaire is shown in Appendix A. With the integration of weight of each expert , if the average scores, , equal at least 75%, the factors are selected for further research. The equation for this calculation is as follows:
- (2)
- Second stage: Evaluating the relationships among factors within each dimension and across the entire system.
The steps below show how the DEMATEL technique is conducted in the study after obtaining the list of validated factors.
Step 2.1: Constructing the pairwise comparison matrix X
In this step, the questionnaire asks the experts to give their opinions on pairwise comparisons of influence among factors, using a scale spanning from no influence to very high influence. Triangular fuzzy numbers (TFNs) are applied to demonstrate the fuzziness in experts’ decisions. Table 3 illustrates the linguistic terms [61] used in the study.
Table 3.
Influence linguistic variables.
A TFN is demonstrated by a triplet, i.e., . Suppose where 1 ≤ k ≤ K is a fuzzy judgment that the kth expert makes about the degree to which factor i has influence on factor j. If there are K experts on the decision panel to estimate the causality between n adoption factors, the inputs are a n × n matrix, i.e., Xk= ; where k = 1, 2,…, K.
Also, while giving answers on degree of causality, experts are also asked to give their confidence level for each answer on a fuzzy five-level scale [61], as shown in Table 4. A TFN is applied again to capture the fuzziness in experts’ judgements, i.e., . A sample of the second questionnaire for pairwise comparison is shown in Appendix B.
Table 4.
Reliability linguistic variables.
Therefore, each expert’s evaluation can be denoted as follows:
where represents the influence membership of factor i on factor j of expert k, and represents the corresponding reliability membership.
After that, Zij will be converted into classical fuzzy numbers, before moving to the next step using the following method by Kang et al. [62] as in Equations (4)–(6):
First, convert the reliability part into a crisp number, as follows:
when denotes the reliability membership.
Second, add the weight of the reliability part to the restriction part using Equation (5), as follows:
Third, convert the irregular fuzzy number () into a classical fuzzy number, as follows:
The result of the calculation is a classical fuzzy set, which is denoted as follows:
After that, will go through the defuzzification using the center of gravity method, which is set out in the equation below:
Finally, the pairwise comparison matrix of expert k is constructed, using Equation (9), as follows:
Step 2.2: Compute the direct relationship matrix with weight integration A
The n × n matrix A is found by averaging all the experts’ scores from matrices , as follows:
where is the average influence score of factor i on factor j, is the weight of the expert, is the influence score of expert kth for factor i on factor j, and k is the number of experts.
Step 2.3: Computing the normalized initial direct relationship matrix D
The matrix D is calculated by normalizing the average matrix A.
Let the following be true:
Then, as follows:
Step 2.4: Compute the total influence matrix T
The total influence matrix T is defined as an n × n matrix, as in Equation (14) below:
where (i, j = 1, 2, 3, 4,…, n), and
when
T = D × (I − D)−1
Also, the sums of rows and the sums of columns of the matrix T are denoted as R and G in Equations (11) and (12), respectively, as follows:
where show the combined effect both provided and received by factor i, and gives the net effect by factor i.
Step 2.5: The thresholds are calculated to filter out insignificant influence relationships in the total influence matrix using Equation (19), as follows:
where N is the number of items in the matrix T.
Step 2.6: Visualize the cause–effect relationships
- (3)
- Stage 3: Establishing hierarchical orders for the factors based on their relationships.
The following steps show how ISM technique is employed in the study. The approach is based on the method by Mathiyazhagan, K. et al. [63], with some modifications.
Step 3.1: Create the initial reachability matrix L
If the value is equal or greater than the threshold , it will be denoted as having a relevant amount of influence on other factors () or having negligible impact (. The matrix L can be obtained by the equation below:
Step 3.2: Develop the final reachability matrix F based on the direct and indirect relationships among the factors. The logic is that, when factor i has an impact on factor j, and factor j has an impact on factor k, factor i will be considered to have an impact on factor k.
Step 3.3: Level partition
The reachability and antecedent sets for each factor are determined using the final reachability matrix F variables. The reachability set includes the variable itself and other variables that the variable influences. Similarly, the antecedent set includes the variable itself and others that influence the variable. The intersection of these sets is then computed across all variables. The Level I variable in the ISM hierarchy, which cannot assist in achieving any higher-level variables, is identified as the one where the reachability and intersection sets coincide. Once level I is identified, it is removed from consideration, along with any other variables in that level.
Step 3.4: Development of the cause–effect digraph
From the results of level partitioning, the model is constructed. The relationships among levels are shown by an arrow pointing from the level that exerts influence to the level that receives influence.
4. Case Study Analysis and Results
This section will describe how the above methods were used to analyze the case study and the results.
4.1. Identification of Key Factors
Chakrabortty et al. [64] and Phooriyaphan et al. [25] indicate that, for reliable results, this type of study typically requires the participation of three to nine experts with expertise in AI and chatbots to complete the surveys. Thus, our expert panel comprises six males and three females with expertise in healthcare chatbot adoption, encompassing roles such as professors, researchers, developers, professionals, and users across various organizations. The experts received a questionnaire containing twenty factors from the literature to validate. Table 5 summarizes the experts’ information alongside the weights they were assigned.
Table 5.
Expert panel.
The experts were tasked with providing their evaluations regarding the importance of the factors. The significance level of each factor was determined using Equation (1). Subsequently, only factors with values exceeding 75% were retained for further investigation, as depicted in Table 6.
Table 6.
Factor filtering.
4.2. Casual Relationships
This study will employ the DEMATEL technique to elucidate the interrelationships among factors within a dimension, as well as the relationships among different dimensions.
After collecting the results from the pairwise questionnaire, the next step involves the conversion of linguistic terms into Z-numbers. For instance, if an expert assesses that factor C1 exhibits low influence (L) on factor C2 with a reliability level of “Neutral” (N), the corresponding Z-number would be represented as (L, N) = (1, 2, 3; 0.3, 0.5, 0.7), based on Table 3 and Table 4.
The following steps describe how the calculations are performed to convert the Z-number into a classical fuzzy set [62]. Utilizing the aforementioned example, the calculation of α is initiated using Equation (4), as follows:
Then, the α value is incorporated with the influence fuzzy number, as follows:
This fuzzy number then is converted into a crisp set using Equation (6), as follows:
Applying the same calculation method as above, we derive the values of crisp sets for all combinations of fuzzy linguistic terms representing influence and fuzzy reliability terms, as presented in Table 7 [61].
Table 7.
Z-number linguistic variables.
Table 8 displays the assessment of expert 1. Using Table 7 as a reference, we can convert experts’ assessment into fuzzy sets, as shown in Table 9.
Table 8.
Expert 1’s assessment.
Table 9.
Expert 1′s assessment converted into fuzzy numbers.
After that, the scores provided by the experts undergo a defuzzification process using Equation (8). For example, Table 10 shows the defuzzified number of fuzzy sets in Table 9.
Table 10.
Defuzzified numbers of expert 1’s assessment.
4.2.1. Causal Relationships between Dimensions
In this part, we discuss the relationships in each dimension, rather than the whole system. Therefore, to create the average matrix for each dimension, we first categorize the data of direct relation matrices Xk into dimensions as mentioned earlier (technology—C1, C2, C3, C4, C5, and C6, user—C7, C8, and C9, and society—C10, C11, C12, C13, and C14).
Then, we apply Equation (11) for each dimension to create the weighted average matrices, as shown in Table 11, Table 12 and Table 13.
Table 11.
Average matrix—technology.
Table 12.
Average matrix—users.
Table 13.
Average matrix—society.
The next step involves normalizing these matrices. We use Equation (12) to find the value s of each matrix and utilize Equation (13) to obtain the normalized values. Total influence matrices are created using Equations (15) and (16), as shown in Table 14, Table 15 and Table 16. Scores higher than the predetermined thresholds are highlighted in bold, indicating significant influences between factors. The thresholds are calculated for each dimension using Equation (19).
Table 14.
Total influence matrix—technology.
Table 15.
Total influence matrix—users.
Table 16.
Total influence matrix—society.
The graphs below are created based on significant relationships among factors in each dimension, after removing insignificant relationships (Figure 2, Figure 3 and Figure 4).
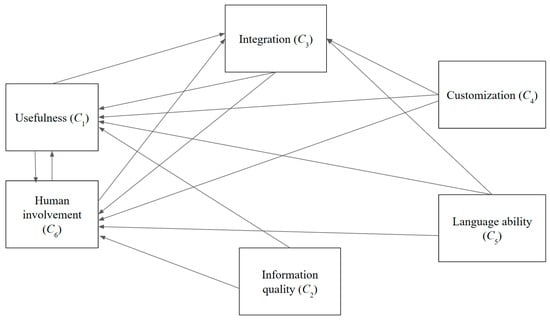
Figure 2.
Cause and effect graph—technology.
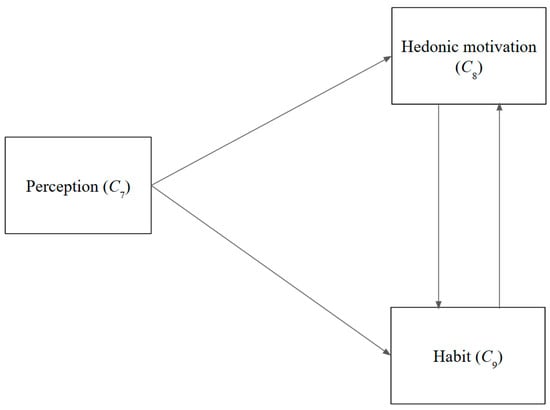
Figure 3.
Cause and effect graph—users.
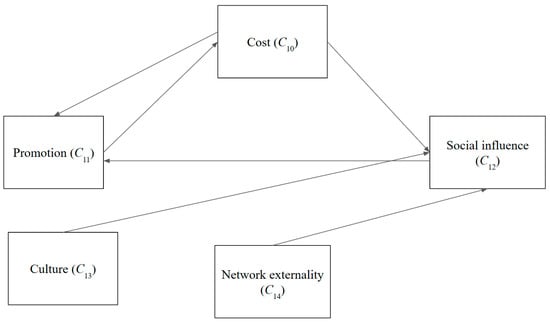
Figure 4.
Cause and effect graph—society.
Regarding the technological dimension, certain attributes such as the customizability of chatbots (C4), language capabilities (C5), and information quality (C2) only influence other technological variables without being affected. Noteworthy is the considerable degree to which external factors influence the usefulness aspect (C1). Moreover, usefulness (C1) and human involvement (C6) are subject to the influence of various other factors.
Looking at the user-related factors, the perceptions held by users regarding chatbots (C7) exert an influence on habits (C9). Moreover, such perceptions (C7) significantly affect pleasure from their usage (C8).
In the societal dimension, social influence (C12) and the cost of chatbots (C10) significantly impact the promotional aspect (C11). Conversely, cultural dynamics (C13) remain insulated from the influences of other factors. Social influence (C12) is significantly affected by promotion (C11) and culture (C13).
4.2.2. Casual Relationships between Factors
In a manner similar to the previous procedures, the direct relationship matrix X, the average matrix A, the normalized direct relationship matrix D, and the total influence relationship T are formulated for the 14 factors. Table 17 and Table 18 show the matrices A and T.
Table 17.
Average matrix.
Table 18.
Total influence matrix.
Table 19 represents rankings for significance level, cause, and effect, based on the values of r + g and r − g.
Table 19.
Cause and effect rankings.
Figure 5 displays both the combined effect (r + g) and the net effect (r – g) of each factor, with three dimensions represented by different colors. Figure 6 shows the word clouds of factors based on their net effect scores.
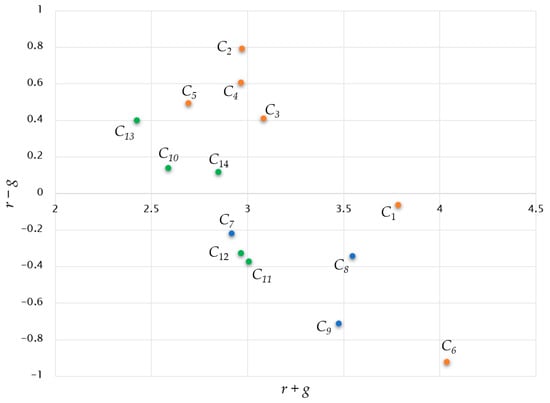
Figure 5.
Casual diagram.
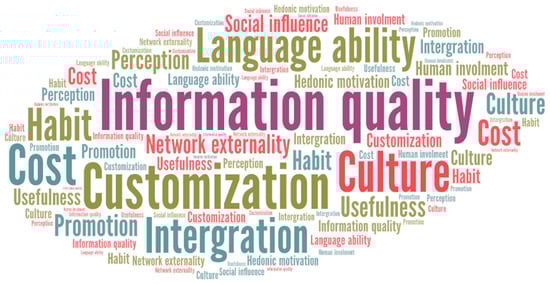
Figure 6.
Word cloud based on net effect.
Regarding their impact on other factors, information quality (C2), customizability (C4), and language proficiency (C5) stand out as the most potent factors, whereas integration features (C3) and cultural elements (C13) rank fourth and fifth in influence, respectively. Interestingly, a relationship between quality of information and usefulness is again highlighted, with a score of 0.215. Also, usefulness (C1) shows the strongest impact on human involvement (C6). In the broader context, the technological dimension and user-related factors assume greater significance than the social dimension. Moreover, technology-related factors predominantly contribute to causation, whereas factors stemming from the users’ dimension exert the most significant influence in terms of effects.
Regarding the influenced variables, human involvement (C6), habit formation (C9), and promotional strategies (C11) are notably impacted by other variables. Human involvement (C6) emerges as the most affected factor, necessitating the consideration of technological-related factors with significant influence on it. Furthermore, the perception of chatbots (C7) is notably influenced by chatbot-related technology, while promotion (C11) is significantly impacted by both technology factors (C1, C2, C3, C4, C5, and C6) and societal factors (C10 and C12).
4.3. Hierarchical Relationships
Data from total influence T are used to create the initial reachability matrix L. After that, final reachability matrix F and level partition tables are also obtained, as shown below (Table 20, Table 21, Table 22, Table 23 and Table 24).
Table 20.
Initial reachability matrix.
Table 21.
Final reachability matrix.
Table 22.
Level partition—Level I.
Table 23.
Level partition—Level II.
Table 24.
Level partition—Level III.
Finally, the hierarchical structure is developed based on the level partitioning results, as shown in Figure 6. As expected, some of the factors shown to be enablers in each dimension are the enablers for the whole system, namely the quality of information (C2), customization (C4), language ability (C5), cost (C10), and culture (C13). Interestingly, network externalities (C14) are a bridge between the base of the system and other factors (Figure 7).
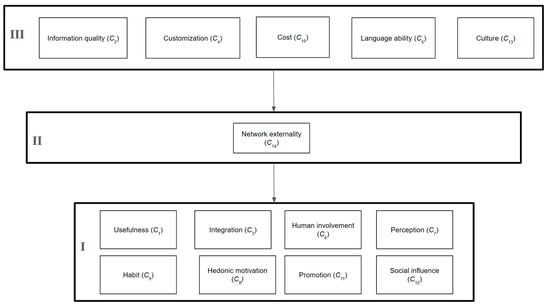
Figure 7.
Hierarchical structure.
5. Discussion
This section will suggest managerial and theoretical implications based on the results.
5.1. Managerial Implications
The study sheds light on the relatively nascent domain of healthcare chatbot adoption, offering insights that can inform strategies aimed at enhancing public acceptance of these technological solutions. The findings underscore the paramount importance of information quality (C2) provided by healthcare chatbots, as it emerges as the most influential causal factor with the highest net effect score of 0.792, significantly impacting other adoption factors, including the usefulness of chatbots (C1). Several studies [9,65] also emphasize the importance of information quality due to its crucial role in delivering high-quality healthcare chatbot services. Furthermore, the effective exchange of information enhances the adoption of public transportation chatbots [66]. Therefore, developers and enterprises should prioritize efforts to enhance the quality of information delivered by chatbots to increase their adoption.
Secondly, beyond information quality (C1), various other capabilities of chatbots (C3, C4, and C5) also exhibit substantial impacts on their usefulness (C1), a critical quality of chatbots and the whole adoption system. This aligns with Hsu‘s research [24], which identifies the technological dimension as a key influence in the healthcare chatbot introduction system. Thus, efforts to enhance these capabilities represent promising avenues for future improvement in chatbots’ usefulness and chatbot adoption. Thirdly, while promotional campaigns (C11) can serve as effective tools to bolster chatbot acceptance among the public [31], it is noteworthy that this factor is primarily influenced by technological factors. This can be explained by the fact that these factors, including information quality (C2), significantly impact usefulness as the core quality of chatbots, while this quality can lead to more effective advertising [67]. Consequently, the advanced technology of chatbots should be a focal point to ensure the success of promotional initiatives. Fourthly, the perception of chatbots (C7) is influenced by their usefulness (C1) and other technological factors. In a study involving a data-collecting chatbot [68], respondents’ perceptions about chatbots changed after engaging with them because of their natural language abilities. Another study on a voice chatbot (Apple Siri) found that the chatbot’s technological advancements, which enable it to perform tasks like a human, lead to a positive attitude towards it [69]. Therefore, efforts to alter public perceptions of chatbots should commence with enhancing the capabilities of these technological solutions.
Fifthly, in addition to technical capabilities, the usefulness of chatbots is significantly influenced by human assistance (C6), with the combination of chatbots and human support being perceived as more trustworthy than chatbots alone [33]. A similar result was also found in a study on journaling guidance chatbots [70]. Hence, when optimizing the usefulness of chatbots in healthcare settings, their acceptance necessitates the consideration of the extent of human involvement. Lastly, the cost of health chatbots (C10) is also one of the factors constructing the base of the ISM model, which affects many other factors in the system. The demand for low-cost and available healthcare solutions is increasing in developing countries [71]. Therefore, if the cost of health chatbots is lowered or even becomes free, it will not only facilitate health chatbot health adoption in general, but will also facilitate other factors in the overall system.
5.2. Theoretical Implications
Firstly, experts’ input is weighted based on their level of expertise, which mirrors their deep understanding of the subject matter. To attain a comprehensive perspective on health chatbot adoption, it is crucial to assemble a diverse panel of experts who engage with the topic from various angles. However, this diversity may lead to inconsistencies in their responses. Nevertheless, this approach helps mitigate the variability stemming from differing levels of expertise while incorporating all stakeholders’ viewpoints. Secondly, the utilization of Z-numbers is employed to handle the uncertainty surrounding the topic of health chatbot adoption. Given the novelty of the subject, there are still many misconceptions and areas of ambiguity. Therefore, assigning a reliability level to each response helps address this issue. This method enables experts to evaluate the subject while reducing the impact of uncertainty. Thirdly, the combined research framework of DEMATEL and ISM offers enterprises and governments clearer insights into the relationships among factors influencing health chatbot adoption. This approach not only explores relationships among factors but also organizes them hierarchically, aiding stakeholders in further research and future investments. The study also categorizes factors into three dimensions: technology, users, and society. This categorization helps stakeholders associated with each dimension better understand their role in the system and facilitates the decision-making process.
6. Conclusions and Remarks
The study sheds light on the factors influencing healthcare chatbot adoption. The study discovered key factors and explored the relationships among them. The findings underscore the critical role of technological factors in the adoption of healthcare chatbots, particularly emphasizing the significance of information quality as a primary causal determinant within the system. Technological factors predominantly influence factors within other dimensions, including user and societal aspects. Based on these insights, practical applications are proposed. Particularly, to promote the widespread adoption of healthcare chatbots, it is essential to allocate resources towards enhancing their capabilities.
However, this study has some limitations, which warrant consideration for future refinement. Firstly, the extensive array of factors and questions within the questionnaire poses a risk of inconsistency in evaluation due to the potential burden on respondents [46]. Streamlining the questionnaire to mitigate this workload could enhance the reliability of responses. Secondly, while the study adeptly elucidates the relationships among factors influencing chatbot adoption, it falls short of discerning the relative importance of the factors compared to others. To address this limitation, future research could employ an analytic network process methodology to rank factors, thereby offering clearer insights into their significance. Lastly, the reliance on survey-based data collection may restrict the depth of insights obtained, compared to face-to-face interviews. Embracing interview-based approaches in future studies could afford researchers a more nuanced understanding of the issue at hand, potentially yielding richer data and insights.
Author Contributions
Conceptualization, J.J.H.L.; methodology, J.J.H.L.; validation, J.J.H.L.; formal analysis, T.T.V.; investigation, T.T.V.; data writing—original draft preparation, T.T.V.; writing—review and editing, J.J.H.L.; visualization, T.T.V.; supervision, J.J.H.L. All authors have read and agreed to the published version of the manuscript.
Funding
This research received no external funding.
Institutional Review Board Statement
Not applicable.
Data Availability Statement
The original contributions presented in the study are included in the article; further inquiries can be directed to the corresponding author.
Conflicts of Interest
The authors declare no conflict of interest.
Appendix A
Table A1.
The first questionnaire (sample).
Table A1.
The first questionnaire (sample).
| Expert’s Evaluation | ||||
|---|---|---|---|---|
| Dimension | Factors | Factor Description | Expert’s Opinion | |
| Yes | No | |||
| Technology | Usefulness | Healthcare chatbots are able to meet users’ demands such as seeking information, booking appointments, and diagnosis, etc. | ||
| Integration | Healthcare chatbots are integrated in popular systems such as social media platforms, smart devices, etc. | |||
| Security | Healthcare chatbots are safe to use without any potential harms such as data privacy, misleading information, etc. | |||
| Quality of information | Healthcare chatbots are able to provide reliable and accurate information | |||
| Customization | Healthcare chatbots can be customized to suit each individual user. | |||
| Natural language ability | Healthcare chatbots are able to communicate with users naturally like a human. | |||
| Human involvement | Healthcare chatbot services is partly supported by humans. | |||
Appendix B
Table A2.
The second questionnaire (sample).
Table A2.
The second questionnaire (sample).
| For example: Factor “Usefulness” has no influence on factor “Cost” with very high confidence level and has high influence on factor “Chatbot perception” with high confidence level, we have the table, as follow. | ||
| Usefulness | Confidence Level | |
| Cost | NO | SL |
| Chatbot perception | H | L |
| Expert’s Evaluations | ||
| Usefulness | Confidence Level | |
| Integration | ||
| Quality of information | ||
| Customization | ||
| Natural language ability | ||
| Human involvement | ||
| Chatbot perception | ||
| Hedonic motivation | ||
| Habit | ||
| Promotion | ||
| Cost | ||
| Social influence | ||
| Cultural norms | ||
| Network externalities | ||
References
- Team, T.I. Healthcare Sector: Industries Defined and Key Statistics. 2021. Available online: https://www.investopedia.com/terms/h/health_care_sector.asp (accessed on 25 April 2024).
- Lee, D. Effects of key value co-creation elements in the healthcare system: Focusing on technology applications. Serv. Bus. 2019, 13, 389–417. [Google Scholar] [CrossRef]
- Chung, K.; Park, R.C. Chatbot-based healthcare service with a knowledge base for cloud computing. Clust. Comput. 2019, 22, 1925–1937. [Google Scholar] [CrossRef]
- Touati, F.; Tabish, R. U-healthcare system: State-of-the-art review and challenges. J. Med. Syst. 2013, 37, 9949. [Google Scholar] [CrossRef] [PubMed]
- Adamopoulou, E.; Moussiades, L. Chatbots: History, technology, and applications. Mach. Learn. Appl. 2020, 2, 100006. [Google Scholar] [CrossRef]
- Bansal, H.; Khan, R. A review paper on human computer interaction. Int. J. Adv. Res. Comput. Sci. Softw. Eng. 2018, 8, 53–56. [Google Scholar] [CrossRef]
- Athota, L.; Shukla, V.K.; Pandey, N.; Rana, A. Chatbot for healthcare system using artificial intelligence. In Proceedings of the 2020 8th International Conference on Reliability, Infocom Technologies and Optimization (Trends and Future Directions) (ICRITO), Noida, India, 4 June 2020. [Google Scholar]
- Bhirud, N.; Tataale, S.; Randive, S.; Nahar, S. A literature review on chatbots in healthcare domain. Int. J. Sci. Technol. Res. 2019, 8, 225–231. [Google Scholar]
- Nadarzynski, T.; Miles, O.; Cowie, A.; Ridge, D. Acceptability of artificial intelligence (AI)-led chatbot services in healthcare: A mixed-methods study. Digit. Health 2019, 5, 2055207619871808. [Google Scholar] [CrossRef] [PubMed]
- Ahmed, A.; Ali, N.; Aziz, S.; A Abd-Alrazaq, A.; Hassan, A.; Khalifa, M.; Elhusein, B.; Ahmed, M.; Ahmed, M.A.S.; Househ, M. A review of mobile chatbot apps for anxiety and depression and their self-care features. Comput. Methods Programs Biomed. Update 2021, 1, 100012. [Google Scholar] [CrossRef]
- Xu, L.; Sanders, L.; Li, K.; Chow, J.C.L. Chatbot for health care and oncology applications using artificial intelligence and machine learning: Systematic review. JMIR Cancer 2021, 7, e27850. [Google Scholar] [CrossRef]
- Viduani, A.; Cosenza, V.; Araújo, R.M.; Kieling, C. Chatbots in the Field of Mental Health: Challenges and Opportunities. In Digital Mental Health: A Practitioner’s Guide; Springer: Cham, Switzerland, 2023; pp. 133–148. [Google Scholar]
- Almalki, M.; Azeez, F. Health chatbots for fighting COVID-19: A scoping review. Acta Inform. Medica 2020, 28, 241. [Google Scholar] [CrossRef]
- Akdag, H.; Kalaycı, T.; Karagöz, S.; Zülfikar, H.; Giz, D. The evaluation of hospital service quality by fuzzy MCDM. Appl. Soft Comput. 2014, 23, 239–248. [Google Scholar] [CrossRef]
- Esfahani, A.A.; Ahmadi, H.; Nilashi, M.; Alizadeh, M.; Bashiri, A.; Farajzadeh, M.A.; Shahmoradi, L.; Rasouli, H.R.; Hekmat, M. An evaluation model for the implementation of hospital information system in public hospitals using multi-criteria-decision-making (MCDM) approaches. Int. J. Eng. Technol. (UAE) 2018, 7, 1–18. [Google Scholar] [CrossRef][Green Version]
- Verma, P.; Dutta, S. Critical success factors for better healthcare: An MCDM approach. Int. J. Technol. Mark. 2021, 15, 287–315. [Google Scholar] [CrossRef]
- Sir, E.; Batur Sir, G.D. Evaluating treatment modalities in chronic pain treatment by the multi-criteria decision making pro-cedure. BMC Med. Inform. Decis. Mak. 2019, 19, 191. [Google Scholar] [CrossRef] [PubMed]
- Tamanini, I.; de Castro, A.K.; Pinheiro, P.R.; Pinheiro, M.C. Applied neuroimaging to the diagnosis of Alzheimer’s disease: A multicriteria model. In Proceedings of the Best Practices for the Knowledge Society. Knowledge, Learning, Development and Technology for All: Second World Summit on the Knowledge Society, WSKS 2009, Chania, Crete, Greece, 16–18 September 2009. [Google Scholar]
- Yildirim, F.S.; Sayan, M.; Sanlidag, T.; Uzun, B.; Ozsahin, D.U.; Ozsahin, I. Comparative evaluation of the treatment of COVID-19 with multicriteria decision-making techniques. J. Healthc. Eng. 2021, 2021, 8864522. [Google Scholar] [CrossRef] [PubMed]
- Büyüközkan, G.; Mukul, E. Evaluation of smart health technologies with hesitant fuzzy linguistic MCDM methods. J. Intell. Fuzzy Syst. 2020, 39, 6363–6375. [Google Scholar] [CrossRef]
- Liou, J.J.H.; Lu, M.-T.; Hu, S.-K.; Cheng, C.-H.; Chuang, Y.-C. A hybrid MCDM model for improving the electronic health record to better serve client needs. Sustainability 2017, 9, 1819. [Google Scholar] [CrossRef]
- Lu, M.-T.; Lin, S.-W.; Tzeng, G.-H. Improving RFID adoption in Taiwan’s healthcare industry based on a DEMATEL technique with a hybrid MCDM model. Decis. Support Syst. 2013, 56, 259–269. [Google Scholar] [CrossRef]
- Santa Barletta, V.; Caivano, D.; Colizzi, L.; Dimauro, G.; Piattini, M. Clinical-chatbot AHP evaluation based on “quality in use” of ISO/IEC 25010. Int. J. Med. Inform. 2023, 170, 104951. [Google Scholar] [CrossRef]
- Hsu, M.-C. The construction of critical factors for successfully introducing chatbots into mental health services in the army: Using a hybrid MCDM approach. Sustainability 2023, 15, 7905. [Google Scholar] [CrossRef]
- Phooriyaphan, S.; Rachsiriwatcharabul, N. Identifying the Criteria for Selection of Healthcare Chatbot in Thailand Using A Multi-Criteria Decision Making Approach. J. Posit. Sch. Psychol. 2022, 6, 3757–3763. [Google Scholar]
- Davis, F.D. Perceived usefulness, perceived ease of use, and user acceptance of information technology. MIS Q. 1989, 13, 319–340. [Google Scholar] [CrossRef]
- Almalki, M. Exploring the Influential Factors of Consumers’ Willingness Toward Using COVID-19 Related Chatbots: An Empirical Study. Med. Arch. 2021, 75, 50. [Google Scholar] [CrossRef]
- Huang, C.Y.; Yang, M.C.; Chen, I.M.; Hsu, W.C. Modeling consumer adoption intention of an AI-powered health chatbot in Taiwan: An empirical perspective. Int. J. Perform. Eng. 2022, 18, 338. [Google Scholar]
- Patil, K.; Kulkarni, M. Can we trust Health and Wellness Chatbot going mobile? Empirical research using TAM and HBM. In Proceedings of the 2022 IEEE Region 10 Symposium (TENSYMP), Mumbai, India, 1–3 July 2022. [Google Scholar]
- Li, X.; Xie, S.; Ye, Z.; Ma, S.; Yu, G. Investigating patients’ continuance intention toward conversational agents in outpatient departments: Cross-sectional field survey. J. Med. Internet Res. 2022, 24, e40681. [Google Scholar] [CrossRef] [PubMed]
- Chew, H.S.J.; Achananuparp, P. Perceptions and needs of artificial intelligence in health care to increase adoption: Scoping review. J. Med. Internet Res. 2022, 24, e32939. [Google Scholar] [CrossRef] [PubMed]
- Miner, A.S.; Milstein, A.; Hancock, J.T. Talking to machines about personal mental health problems. JAMA 2017, 318, 1217–1218. [Google Scholar] [CrossRef] [PubMed]
- Miles, O.; West, R.; Nadarzynski, T. Health chatbots acceptability moderated by perceived stigma and severity: A cross-sectional survey. Digit. Health 2021, 7, 20552076211063012. [Google Scholar] [CrossRef]
- Hussain, S.A.; Ogundimu, F.; Bhattarai, S. Mobile phone-based chatbot for family planning and contraceptive information. In Proceedings of the Digital Human Modeling and Applications in Health, Safety, Ergonomics and Risk Management. Healthcare Applications: 10th International Conference, DHM 2019, Held as Part of the 21st HCI International Conference, HCII 2019, Orlando, FL, USA, 26–31 July 2019. [Google Scholar]
- Lai, Y.; Lioliou, E.; Panagiotopoulos, P. Understanding Users’ switching Intention to AI-Powered Healthcare Chatbots. In Proceedings of the ECIS 2021, Marrakech, Morrocco, 14–16 June 2021. [Google Scholar]
- Almalki, M. Perceived utilities of COVID-19 related chatbots in Saudi Arabia: A cross-sectional study. Acta Inform. Medica 2020, 28, 218. [Google Scholar] [CrossRef]
- Barnes, P.M.; Bloom, B.; Nahin, R.L. Complementary and alternative medicine use among adults and children: United States, 2007. Natl. Health Stat. Rep. 2008, 12, 1–23. [Google Scholar]
- Tamilmani, K.; Rana, N.P.; Prakasam, N.; Dwivedi, Y.K. The battle of Brain vs. Heart: A literature review and meta-analysis of “hedonic motivation” use in UTAUT2. Int. J. Inf. Manag. 2019, 46, 222–235. [Google Scholar] [CrossRef]
- Wilson, L.; Marasoiu, M. The development and use of chatbots in public health: Scoping review. JMIR Hum. Factors 2022, 9, e35882. [Google Scholar] [CrossRef] [PubMed]
- Liu, T.; Tsang, W.; Huang, F.; Lau, O.Y.; Chen, Y.; Sheng, J.; Guo, Y.; Akinwunmi, B.; Zhang, C.J.; Ming, W.K. Patients’ preferences for artificial intelligence applications versus clinicians in disease diagnosis during the SARS-CoV-2 pandemic in China: Discrete choice experiment. J. Med. Internet Res. 2021, 23, e22841. [Google Scholar] [CrossRef]
- Prakash, A.V.; Das, S. Intelligent conversational agents in mental healthcare services: A thematic analysis of user perceptions. Pac. Asia J. Assoc. Inf. Syst. 2020, 12, 1. [Google Scholar] [CrossRef]
- Jain, R.; Arora, A.; Raju, S. A novel adoption index of selected agricultural technologies: Linkages with infrastructure and productivity. Agric. Econ. Res. Rev. 2009, 22, 109–120. [Google Scholar]
- Da Silveira, F.; Da Silva, S.L.; Machado, F.M.; Barbedo, J.G.; Amaral, F.G. Farmers’ perception of barriers that difficult the implementation of agriculture 4.0. Agric. Syst. 2023, 208, 103656. [Google Scholar] [CrossRef]
- Chi, O.H.; Chi, C.G.; Gursoy, D.; Nunkoo, R. Customers’ acceptance of artificially intelligent service robots: The influence of trust and culture. Int. J. Inf. Manag. 2023, 70, 102623. [Google Scholar] [CrossRef]
- Bulut, E.; Duru, O.; Yoshida, S. Market entry, asset returns, and irrational exuberance: Asset management anomalies in dry cargo shipping. Int. J. Shipp. Transp. Logist. 2013, 5, 652–667. [Google Scholar] [CrossRef]
- Bulut, E.; Duru, O. Analytic hierarchy process (AHP) in maritime logistics: Theory, application and fuzzy set integration. In Multi-Criteria Decision Making in Maritime Studies and Logistics: Applications and Cases; Springer: Cham, Switzerland, 2018; pp. 31–78. [Google Scholar]
- Gabus, A.; Fontela, E. World Problems, an Invitation to Further Thought within the Framework of DEMATEL; Battelle Geneva Research Center: Geneva, Switzerland, 1972; Volume 1, pp. 12–14. [Google Scholar]
- Tzeng, G.-H.; Chiang, C.-H.; Li, C.-W. Evaluating intertwined effects in e-learning programs: A novel hybrid MCDM model based on factor analysis and DEMATEL. Expert Syst. Appl. 2007, 32, 1028–1044. [Google Scholar] [CrossRef]
- Wu, W.-W.; Lee, Y.-T. Developing global managers’ competencies using the fuzzy DEMATEL method. Expert Syst. Appl. 2007, 32, 499–507. [Google Scholar] [CrossRef]
- Wu, W.-W. Choosing knowledge management strategies by using a combined ANP and DEMATEL approach. Expert Syst. Appl. 2008, 35, 828–835. [Google Scholar] [CrossRef]
- Sharma, M.; Sehrawat, R. Quantifying SWOT analysis for cloud adoption using FAHP-DEMATEL approach: Evidence from the manufacturing sector. J. Enterp. Inf. Manag. 2020, 33, 1111–1152. [Google Scholar] [CrossRef]
- Lin, W.-R.; Wang, Y.-H.; Hung, Y.-M. Analyzing the factors influencing adoption intention of internet banking: Applying DEMATEL-ANP-SEM approach. PLoS ONE 2020, 15, e0227852. [Google Scholar] [CrossRef]
- Yadav, H.; Soni, U.; Gupta, S.; Kumar, G. Evaluation of barriers in the adoption of E-commerce technology in SMEs: A fuzzy DEMATEL approach. J. Electron. Commer. Organ. (JECO) 2022, 20, 1–18. [Google Scholar] [CrossRef]
- Warfield, J.N. Societal systems planning, policy and complexity. Cybern. Syst. 1978, 8, 113–115. [Google Scholar] [CrossRef]
- Sage, A.P. Methodology for Large-Scale Systems; McGraw-Hill College: New York, NY, USA, 1977. [Google Scholar]
- Agarwal, R.; Bhadauria, A.; Kaushik, H.; Swami, S.; Rajwanshi, R. ISM-MICMAC-based study on key enablers in the adoption of solar renewable energy products in India. Technol. Soc. 2023, 75, 102375. [Google Scholar] [CrossRef]
- Kumar, S.; Raut, R.D.; Nayal, K.; Kraus, S.; Yadav, V.S.; Narkhede, B.E. To identify industry 4.0 and circular economy adoption barriers in the agriculture supply chain by using ISM-ANP. J. Clean. Prod. 2021, 293, 126023. [Google Scholar] [CrossRef]
- Raut, R.D.; Gardas, B.B.; Jha, M.K.; Priyadarshinee, P. Examining the critical success factors of cloud computing adoption in the MSMEs by using ISM model. J. High Technol. Manag. Res. 2017, 28, 125–141. [Google Scholar] [CrossRef]
- Rana, N.P.; Barnard, D.J.; Baabdullah, A.M.; Rees, D.; Roderick, S. Exploring barriers of m-commerce adoption in SMEs in the UK: Developing a framework using ISM. Int. J. Inf. Manag. 2019, 44, 141–153. [Google Scholar] [CrossRef]
- Tseng, M.L.; Sujanto, R.Y.; Ardaniah, V.; Bui, T.D.; Lan, S.; Negash, Y.T.; Tseng, J.W. Product-service system toward circularity: Hierarchical framework in Indonesia’s home appliance manufacturing industry under uncertainties. Ann. Oper. Res. 2023, 327, 1–27. [Google Scholar] [CrossRef]
- Hsu, W.-C.J.; Liou, J.J.; Lo, H.-W. A group decision-making approach for exploring trends in the development of the healthcare industry in Taiwan. Decis. Support Syst. 2021, 141, 113447. [Google Scholar] [CrossRef]
- Kang, B.; Wei, D.; Li, Y.; Deng, Y. A method of converting Z-number to classical fuzzy number. J. Inf. Comput. Sci. 2012, 9, 703–709. [Google Scholar]
- Mathiyazhagan, K.; Govindan, K.; NoorulHaq, A.; Geng, Y. An ISM approach for the barrier analysis in implementing green supply chain management. J. Clean. Prod. 2013, 47, 283–297. [Google Scholar] [CrossRef]
- Chakrabortty, R.K.; Abdel-Basset, M.; Ali, A.M. A multi-criteria decision analysis model for selecting an optimum customer service chatbot under uncertainty. Decis. Anal. J. 2023, 6, 100168. [Google Scholar] [CrossRef]
- Liu, C.; Zowghi, D.; Peng, G.; Kong, S. Information quality of conversational agents in healthcare. Inf. Dev. 2023, 02666669231172434. [Google Scholar] [CrossRef]
- Kuberkar, S.; Singhal, T.K. Factors influencing adoption intention of AI powered chatbot for public transport services within a smart city. Int. J. Emerg. Technol. Learn. 2020, 11, 948–958. [Google Scholar]
- Chenavaz, R.Y.; Jasimuddin, S.M. An analytical model of the relationship between product quality and advertising. Eur. J. Oper. Res. 2017, 263, 295–307. [Google Scholar] [CrossRef]
- Rhim, J.; Kwak, M.; Gong, Y.; Gweon, G. Application of humanization to survey chatbots: Change in chatbot perception, interaction experience, and survey data quality. Comput. Hum. Behav. 2022, 126, 107034. [Google Scholar] [CrossRef]
- Io, H.N.; Lee, C.B. Understanding the Adoption of Chatbot: A Case Study of Siri. In Advances in Information and Communication Networks: Proceedings of the 2018 Future of Information and Communication Conference (FICC); Springer International Publishing: Cham, Switzerland, 2019; Volume 1. [Google Scholar]
- Lee, Y.-C.; Yamashita, N.; Huang, Y. Exploring the effects of incorporating human experts to deliver journaling guidance through a chatbot. Proc. ACM Hum.-Comput. Interact. 2021, 5, 1–27. [Google Scholar] [CrossRef]
- Nelekar, S.; Abdulrahman, A.; Gupta, M.; Richards, D. Effectiveness of embodied conversational agents for managing academic stress at an Indian University (ARU) during COVID-19. Br. J. Educ. Technol. 2022, 53, 491–511. [Google Scholar] [CrossRef]


Disclaimer/Publisher’s Note: The statements, opinions and data contained in all publications are solely those of the individual author(s) and contributor(s) and not of MDPI and/or the editor(s). MDPI and/or the editor(s) disclaim responsibility for any injury to people or property resulting from any ideas, methods, instructions or products referred to in the content. |
© 2024 by the authors. Licensee MDPI, Basel, Switzerland. This article is an open access article distributed under the terms and conditions of the Creative Commons Attribution (CC BY) license (https://creativecommons.org/licenses/by/4.0/).