Article

What Drives the Sustainability Reporting Intentions of Firms?

by
Charles Ofori-Owusu
*,
Godfred Matthew Yaw Owusu
,
Cletus Agyenim-Boateng
and
Edem Emerald Sabah Welbeck
Department of Accounting, University of Ghana Business School, Legon, Accra P.O. Box LG 78, Ghana
*
Author to whom correspondence should be addressed.
Sustainability 2024, 16(12), 5052; https://doi.org/10.3390/su16125052
Submission received: 19 April 2024 / Revised: 8 June 2024 / Accepted: 11 June 2024 / Published: 13 June 2024

Abstract

:
Global leaders have adopted sustainable development goals to address critical issues like climate change, biodiversity loss, and pollution from both human activities and firms. Over the years, there has been a demand for stricter regulations, accountability, and improved sustainable business practices by stakeholders. In the field of accounting, voluntary disclosure of firms’ sustainability efforts has become an important component of firm reporting architecture. Despite being a voluntary practice in many jurisdictions, sustainability reporting has become essential for firms to demonstrate their commitment to meeting sustainability goals, ensuring future growth, and achieving long-term success. This study examines firms’ sustainability reporting intentions and further investigates the dominant factors that drive such intentions, relying on the extended version of the Theory of Planned Behaviour. Data for the study were gathered from managers of member firms with the Association of Ghana Industries. Using a total of 518 valid responses, the study’s hypotheses were tested employing the partial least square structural equation modelling technique. The results indicate that subjective norm, perceived behavioural control, dynamic capabilities, cultural tightness–looseness, sustainability commitment, and perceived benefit are good predictors of firms’ sustainability reporting intentions. However, the results suggest an inverse relationship exists between attitude, perceived cost, and intention to engage in sustainability reporting. The findings highlight some of the critical factors driving sustainability reporting behaviour among firms.

1. Introduction

In recent times, global leaders have heightened their concern about environmental issues and the quest to adopt measures to sustain the earth. The quest to sustain the earth has led to several global initiatives, with the latest being the adoption of Sustainable Development Goals (SDGs) by the General Assembly of the United Nations. Crucial to these goals are the issues of climate change, biodiversity loss, and pollution arising out of human activities and corporations, which have generated intense debate among stakeholders [1,2]. A shared belief from the ongoing discourse is that the survival and sustainability of the earth are at risk due to the harmful effects of both human and firm activities on the environment [3].
Accordingly, there has been a continuous demand for stricter legislation, accountability, and improved sustainable business practices by stakeholders over the years [4,5]. As a result, some businesses have, over the years, voluntarily accounted for and reported on their sustainability practices [4,6,7,8]. Sustainability reporting has become a critical tool for firms to showcase their effectiveness in meeting their own sustainability goals, future business growth, and long-term success, even though it remains largely a voluntary practice across many parts of the world [9,10].
Investment into sustainability reporting has been on the increase of late [8,11], and several firms are rapidly implementing systems for sustainability practices and reporting in a bid to adapt to the changing trends. The 2022 Governance and Accountability Institute (GAI) reports a steady rise in sustainability reports among US publicly traded companies. The report shows that 96% of S&P 500 companies and 81% of Russell 1000 companies are engaged in sustainability reporting. Again, the KPMG [8] survey of sustainability reports indicates that between 1993 and 2022, sustainability reporting increased from 12% to 79% for N100 companies and from 35% to 96% for G250 companies globally. However, the report reveals a 3% decline in sustainability reporting by N100 companies in the Middle East and Africa regions. This is an indication that the growth in sustainability reporting is more prevalent in developed countries, as documented by some existing studies [12,13]. The disparity in sustainability reporting between developed and less developed countries has become a hotspot for future research, especially for researchers in less developed countries.
Again, notwithstanding the surge in sustainability reporting practices, the value relevance of such reports has become a topical issue, generating research interest in the cost and benefit of sustainability reporting [14,15]. A number of studies have shown that firms’ sustainability reporting behaviour is usually influenced by societal, institutional, and stakeholder pressure [16,17,18]. Other studies have also identified internal organisational factors to be closely associated with sustainability reporting [19,20]. However, limited attention has been directed at exploring the perceptions and attitudes of firms towards sustainability reporting and how such perceptions influence intentions and actual reporting behaviour, particularly in developing nations [13,21,22,23]. Further, not much attention has been given to studying firms’ perspectives on sustainability reporting utilising the theory of planned behaviour (TPB) framework [13,21,23].
The need for studies to focus on firms’ perceptions and attitudes towards sustainability reporting within the context of developing countries has therefore been highlighted by existing studies [13,21,22,23]. This study examined firms’ intentions to engage in sustainability reporting and the drivers of such intentions. The study investigated the effects of selected firm-specific factors such as cultural tightness–looseness, dynamic capabilities, sustainability commitment, perceived cost and perceived benefit, and TPB’s tenets on sustainability reporting intentions of firms.
This study provides policymakers, particularly those concerned with the imminent SDG deadline, with insights into firms’ intentions towards sustainability reporting and the factors that influence these intentions. The study underscores the significant role of subjective norms in shaping sustainability reporting intentions, suggesting the need for industry-wide policies that promote reporting among member firms. Furthermore, the study advocates for establishing a detailed reporting framework that provides precise guidance and support to enhance firms’ reporting attitudes.
The remaining parts of this paper are organised as follows: Section 2 provides the theoretical background and hypothesis development. Section 3 outlines the methodology used for the study. Section 4 discusses the results, and Section 5 provides the conclusion, the study’s limitations, and future research opportunities.

2. Theoretical Background and Hypothesis Development

The theory of planned behaviour (TPB) postulates that an individual’s behaviour in a specific setting is shaped by psychosocial factors based on their rationale, leading to a planned course of action [24]. Benk et al. [25] posit that behavioural performance hinges on the objective of the behaviour. According to the theory, attitude, subjective norm, and perceived behavioural control are the factors that influence an individual’s behavioural intention [24,26], which informs the individual’s motivation to perform the behaviour. In addition, the TPB components are influenced by behavioural, normative, and control beliefs [27].
Ajzen [24] further explains that attitude signifies an individual’s evaluation of behaviour as favourable or unfavourable, while subjective norms revolve around a belief in the influence of others on decision-making and perceived behavioural control gauges a person’s control level (difficulty or opportunity) over engaging in a specific behaviour. Generally, the stronger the intention to engage in a behaviour, the greater the likelihood that the behaviour will be carried out.
This study applied the TPB to investigate the determinants impacting firms’ intentions to partake in sustainability reporting. Specifically, it analyses the attitudes toward sustainability reporting, perception of stakeholders’ relevance (subjective norm), and perceived control over the sustainability reporting process (perceived behavioural control), as well as some firm-specific variables, as an extension of the theory.
Previous research has employed this theory in studying sustainability reporting behaviour across family-owned businesses, listed and non-listed companies, and sustainability reporting intentions of professional accountants [20,21,28,29]. These studies emphasised the necessity of introducing supplementary variables to the TPB framework to better comprehend the factors affecting corporate sustainability reporting behaviour. As such, this study introduced firm-specific variables (such as dynamic capabilities, sustainability commitment, cultural tightness–looseness, perceived cost, and benefit) as an extension of the theory.
By incorporating these additional factors, this study intends to enrich understanding of the complexities surrounding firm sustainability practices and reporting behaviours.

2.1. Hypothesis Development

2.1.1. Attitude

The proponents of TPB postulate that a person’s attitude predicts the intention to perform a behaviour [24]. Attitude is a psychological emotion with a positive or negative evaluation of performing a behaviour. The extant literature posits that a manager’s attitude has important implications on social-environmental issues and sustainability reporting practices [21,30,31]. These studies found a positive association between managers’ attitudes and firms’ intentions to engage in sustainability reporting. For instance, Acheampong et al. [30] found a positive relationship between owner-manager attitudes and the probability of SMEs adopting sustainability reporting. Other researchers [28,32] found an insignificant relationship between attitude and intention to engage in sustainability reporting. Notwithstanding, this study hypothesises the following:
H1. 
There is a positive relationship between attitude and intention to engage in sustainability reporting.

2.1.2. Subjective Norm

Subjective norms emphasise the extent to which an individual’s perception of the opinions of other important people who maintain influence over decision-making can affect that individual’s intention to perform or not perform an action [24]. Studies confirm that subjective norms and the intention to adopt and implement a behaviour are positively related [20,21,28,30,33]. Thoradeniya et al. [21] and Kwakye et al. [28] found a positive relationship between managers’ and accountants’ subjective norms and their intention to engage in sustainability reporting. Hence, this study hypothesises the following:
H2. 
There is a positive relationship between subjective norms and intention to engage in sustainability reporting behaviour.

2.1.3. Perceived Behavioural Control

According to TPB, perceived behavioural control is the ease or difficulty of adopting and performing a behaviour [24,26]. It is influenced by factors within and external to the organisation. The TPB construct, perceived behavioural control, assesses opportunities and resources available to an individual in performing an activity [27]. As such, a behaviour is adopted when the implementation difficulties are manageable [34]. Managers, in discharging their obligations to either report or not, encounter challenges that potentially limit the control they possess and their intention to engage in sustainability reporting. Earlier studies posit that perceived behavioural control affects behavioural intentions [34,35,36]. Singh et al. [20] found that perceived behavioural control does not influence firms’ intentions to be environmentally sustainable. However, the evidence provided by most empirical studies [21,28] generally suggests a positive relationship between perceived behavioural control and intentions. Based on these studies, this is hypothesised:
H3. 
Perceived behavioural control positively relates to intentions to engage in sustainability reporting behaviour.

2.1.4. Dynamic Capabilities

According to Teece et al. [37] (p. 516), dynamic capabilities indicate “the firm’s ability to integrate, build, and reconfigure internal and external competencies to address rapidly changing environments”. Hence, firms with resources, such as employees with skill and expertise, are proactive in finding solutions to the evolving environment [38]. Vogel and Güttel [39] posit that managerial behaviour is critical for a firm to explore new knowledge domains and exploit current ones for the firm’s benefit. Barrales-Molina, Benitez-Amado, and Perez-Arostegui [40] also argue that firms promote the processes for developing dynamic capabilities only when the managers perceive the business environment as highly complex and rapidly changing. Pressure from stakeholders is causing managers of businesses to adopt sustainable practices and communicate the outcome to gain legitimacy. Several studies [41,42,43,44] have established a positive relationship between dynamic capabilities and intentions to adopt systems. For instance, Khan et al. [41] found a significant positive relationship between dynamic capabilities and SME behaviour in circular economy adoption. This study hypothesises the following:
H4. 
There is a positive relationship between dynamic capabilities and intention to engage in sustainability reporting.

2.1.5. Cultural Tightness–Looseness

Intentions are not developed in isolation to the cultural environment. According to Pelto [45], cultural tightness–looseness exhibits societies’ variation in the expression of and adherence to their social norms. “Tight” societies refer to those with clearly defined norms that impose severe sanctions on individuals who deviate from norms. “Loose” societies are those that lack formality, regimentation, discipline, and norms expressed through a wide variety of alternative channels and have a high tolerance for deviant behaviour [45]. Similarly, cultural tightness in organisations relates to the expectation that there are clear rules with little tolerance for deviance. At the individual level, tightness relates to a higher calling of accountability. Individuals in tight cultures generally focus on prevention, higher self-control, and greater self-monitoring, whereas individuals in loose cultures are promotion-centred and have less self-control and self-monitoring ability [46,47]. These attributes help managers develop intentions to fit in and maintain the strength of situations in their cultural context. In recent years, cultural tightness–looseness has been related to a wide range of organisational phenomena [48,49,50] but has yet to be examined for its effects on firm sustainability reporting behaviour. The following is hypothesised:
H5. 
There is a positive relationship between cultural tightness–looseness and the intention to engage in sustainability reporting.

2.1.6. Sustainability Commitment

Sustainability commitment is perceived as a prerequisite to gaining corporate support for strategies related to the organisation’s sustainable activities, and it is also the desire and ability to contribute to a sustainable transformation of our world [51,52]. Sustainability commitment permeates through the overall management philosophy, strategic product decisions, competitiveness, and strategic planning [53]. Thus, a firm strategy determines its sustainability reporting intention. From the extant literature, various variables have been used in the study of firms’ sustainability reporting behaviour. However, these studies have not considered the perceived commitment of management to sustainability. This study hypothesises the following:
H6. 
There exists a positive relationship between sustainability commitment and sustainability reporting intentions.

2.1.7. Perceived Cost and Perceived Benefit

The firm’s intention to engage in novel activities such as corporate sustainability reporting is critical to their implementation. According to the proponents of TPB, the antecedent of intentions determines the extent to which an activity is carried out. An evaluation of an outcome of an activity as positive or negative by the firm forms the intention toward the behaviour [24,54]. If a firm evaluates the outcomes of sustainability reporting to be positive, then the firm acquires a positive intention to engage in sustainability reporting behaviour [29,55]. On the other hand, when a firm perceives the outcome of sustainability reporting as less favourable [29,56], it results in a negative intention towards corporate sustainability reporting behaviour. This leads to the following hypotheses:
H7. 
A positive relationship exists between perceived benefits and intentions toward sustainability reporting behaviour.
H8. 
A negative relationship exists between perceived cost and intentions towards sustainability reporting behaviour.

3. Methodology

3.1. Research Design

This study adapted and applied techniques used in social psychology to understand and measure management’s intentions to adopt sustainability reporting. The survey development approach was guided by Dillman [57], Diamantopoulos et al. [58], and Thoradeniya et al. [21]. Using the seven-point Likert scale, multi-item scales were adopted to measure each construct. According to Chen et al. [59], the seven-point Likert scale has higher reliability in capturing data than the five-point Likert scale. Similarly, multi-item scales provide higher predictive validity given the constructs for this study. All scales developed for the survey were adapted from earlier studies. The scales for attitude, subjective norms, perceived behavioural control, and intentions comprised four items, each of which was adopted from Thoradeniya et al. [21] and Kwakye et al. [28]. The scale for dynamic capabilities, consisting of five items, was adapted from Khan et al. [41]. Sustainability commitment contained six items adapted from Henriques and Sa-dorsky [60]. The cultural tightness–looseness scale, made up of six items, was adapted from Gelfand et al. [61]. The scale for perceived benefit contained four items, and perceived cost consisted of five scale items. Both scales were adapted from Chen et al. [29].

3.2. Data Collection

The study’s respondents were management personnel primarily responsible for decision-making involving sustainability-related issues. The population of the study was made up of 1204 member firms of the Association of Ghana Industries (AGI), out of which 400 firms were sampled for the study. With the assistance of the Policy Unit of the AGI, the questionnaires were administered using both online survey forms and personal paper forms. A total of 518 responses were received from the targeted firms for the study.

3.3. Data Analysis Procedures

The descriptive analysis was carried out using the Statistical Package for the Social Sciences Version 29.0 (SPSS). The partial least square (PLS) structural equation modelling (SEM) technique was used to analyse the data. The PLS model is a variance-based method within SEM, enabling the examination of both direct and indirect associations between independent and dependent variables while requiring the construction of minimal paths [62]. Further, the PLS was used to measure relationships among latent underlying independent (exogenous) variables and their associated latent dependent (endogenous) variables. The measurement model outlines the association between the indicators and the latent variables or theoretical constructs they represent [63], whereas the structural model constitutes the hypothesised relationships among latent variables (theoretical constructs). Additionally, the PLS technique concurrently calculates both measurement and structural models [64] and does not necessitate a sizable sample size, making it more effective in handling data that do not follow a normal distribution [65,66,67].

3.4. Descriptive Statistics of the Respondents

Table 1 presents key demographic profiles of both firms and respondents. Within Table 1, Group A delineates firm demographic specifics (such as industry sector, ownership type, and years in operation), while Group B illustrates respondent demographic details (such as job title, religious affiliation, tenure in position, and educational attainment).
Among the total 518 respondents, 66.4% were male, while the remaining 33.6% were female, indicating that males occupied the majority of the positions. The predominant educational qualifications held by respondents were a master’s degree (46.5%) and a bachelor’s degree (40.9%). Of these respondents, 219 fell within the age range from 26 to 35 years, while 159 were between 36 and 45. Additionally, within the sample, a percentage breakdown indicated that 140 (27.03%) held positions as CEOs, 102 (19.69%) as CFOs and Accountants, and 114 (22.00%) as Managers (C.S.R., HR, E.H.S.). This suggests that a significant portion of these critical roles are occupied by relatively young yet knowledgeable individuals who recognise the importance of reporting financial and non-financial information to stakeholders.
The surveyed firms encompassed diverse sectors within the Ghanaian economy. Specifically, 190 respondents (36.7%) represented firms engaged in manufacturing and agro-processing, 177 (34.2%) represented firms in information technology (IT), logistics, transport, etc., and 100 (19.3%) represented firms in the power, mining, energy, and petroleum sectors. Among these firms, 353 (68.1%) were locally owned, 84 (16.2%) had mixed ownership, and 79 (15.3%) were foreign-owned.
Out of the 518 respondents, the majority (268) indicated firms that have been in operation for up to 15 years, followed by 99 respondents who stated the age of their firms to be between 16 and 30 years. The characteristics of these respondent firms signify that most are young.

3.5. Descriptive Statistics of Constructs

As depicted in Table 2, the results reveal an overall mean of 5.700 for the construct “Attitude”. This indicates that respondents generally agree that it is in the best interest of organisations to engage in sustainability reporting. The indicator “It is meaningful for my company to engage in sustainability reporting” achieved the highest score (mean = 5.767; SD = 1.480), while “It is good for my company to engage in sustainability reporting” obtained the lowest mean of 5.579 (SD = 1.556).
Concerning the construct “Subjective Norm”, the overall mean was 5.131, indicating that managers consider stakeholders’ relative importance in adopting sustainability reporting in their firms. The indicator “Most of the internal stakeholders (employees and management) would approve my company engaging in sustainability reporting” received the highest score (mean = 5.267; SD = 1.609), and “Many companies similar to my company engage in sustainability reporting” scored the lowest mean of 5.031 (SD = 1.784).
The constructs “Perceived Behavioural Control” and “Dynamic Capabilities” show an overall mean of 5.188 and 5.137, respectively. These values suggest that managers agree that their companies are aware of developments in corporate sustainability reporting and have the capacity to engage in sustainability reporting. The indicator “My company is aware of developments in corporate sustainability reporting” for dynamic capabilities had the highest score (mean = 5.260; SD 1.546), and “It is possible for my company to engage in sustainability reporting” had the top score (mean 5.471; SD 1.552) for the construct perceived behavioural control.
The overall means of 5.455 and 5.404 represent the constructs’ perceived cost and perceived benefits, respectively. This indicates that most managers highly agree that perceived sustainability reporting requires significant knowledge, although they agree that reporting on their sustainability issues will contribute to sustainable development. The highest scoring indicator for the construct perceived cost is “A significant learning effort is required to gain sufficient knowledge of sustainability reporting” (mean = 5.601; SD 1.525), and “Sustainability reporting will help my company to contribute to sustainable development” scored the highest (mean 5.529; SD 1.436) for the construct perceived benefit.
Regarding the construct “Cultural Tightness–Looseness”, the overall mean of 5.247 indicates that respondents mostly agree that inappropriate behaviours are not tolerated in their organisation. The indicator “In my company, if someone acts in an inappropriate way, others will strongly disapprove” received the top score (mean = 5.445; SD 1.609), while the indicator “Employees have a great deal of freedom in deciding how they want to behave in most situations” had the lowest score (mean = 4.849; SD 1.882).
An overall mean of 4.954 recorded by the construct “Sustainability Commitment” suggests that respondents generally believe that sustainability activities within their organisation are planned and implemented. The indicator “My company has an environment, health, and safety (EHS) unit/department” received the highest score (mean = 5.229; SD = 1.755), and the indicator “My company has a written document describing its sustainability action plan” had the lowest score (mean = 4.803; SD = 1.977).
The “Sustainability Reporting Intention”, the variable of interest, recorded an overall mean of 4.943, suggesting that respondents generally had a strong intention to comply with sustainability reporting. By implication, managers demonstrate their willingness and commitment to engage in sustainability reporting. Most managers indicated that their companies are willing to engage in or continue sustainability reporting (mean = 4.988; SD 1.848) and that their companies are committed to engaging in or continuing sustainability reporting (mean = 4.903; SD 1.723).

3.6. Reliability and Validity

Prior to performing the structural model analysis, an evaluation of the measurement characteristics of the constructs and the indicators was conducted to ensure their reliability and validity. The indicator loadings of the constructs, as presented in Table 3, demonstrate that all indicators for the constructs exceed the recommended threshold of 0.70, as suggested by Sarstedt et al. [68], except for indicator CTL 6, which should be considered for deletion, with a loading slightly below the threshold [66,69]. However, its effect on composite reliability and average variance extracted (AVE) is insignificant and, hence, maintained [66,69] for the study. Indicator loadings above 0.70, according to Sarstedt et al. [68], mean that the construct explains more than 50% of the indicator’s variance, which is considered appropriate for structural model analysis.
The internal consistency reliability of the constructs was assessed using composite reliability (CR), as shown in Table 3. The composite reliability scores for each of the study constructs exceeded the 0.70 minimum requirements recommended by [66] and Sarstedt et al. [68], an indication that consistent reliability is assured. Further, convergent and discriminant validity tests were conducted on the study constructs.
Convergent validity was assessed using the average variance extracted (AVE) for all items related to each construct. An AVE of 0.50 or higher is considered acceptable, as it indicates that more than 50% of the variance of the items is explained by the construct [66,68]. As shown in Table 3, the AVE scores for all the constructs were above 0.50, indicating that convergent validity was assured.
A discriminant validity test was conducted on the study constructs using the HTMT approach. According to Henseler, Ringle, and Sarstedt [70] and Ringle et al. [71], an HTMT value below 0.90 establishes discriminant validity between two reflectively measured constructs. In some practical instances, a threshold of 0.85 effectively identifies which pairs of latent variables exhibit discriminant validity and which do not [72,73]. As shown in Table 4, the HTMT between the latent variables of the study are all below the threshold of 0.85, indicating no similarities between latent variables and that discriminant validity was established. The results demonstrate that the measures for the study constructs are reliable and valid for performing the structural model analysis.

4. Discussion of Results

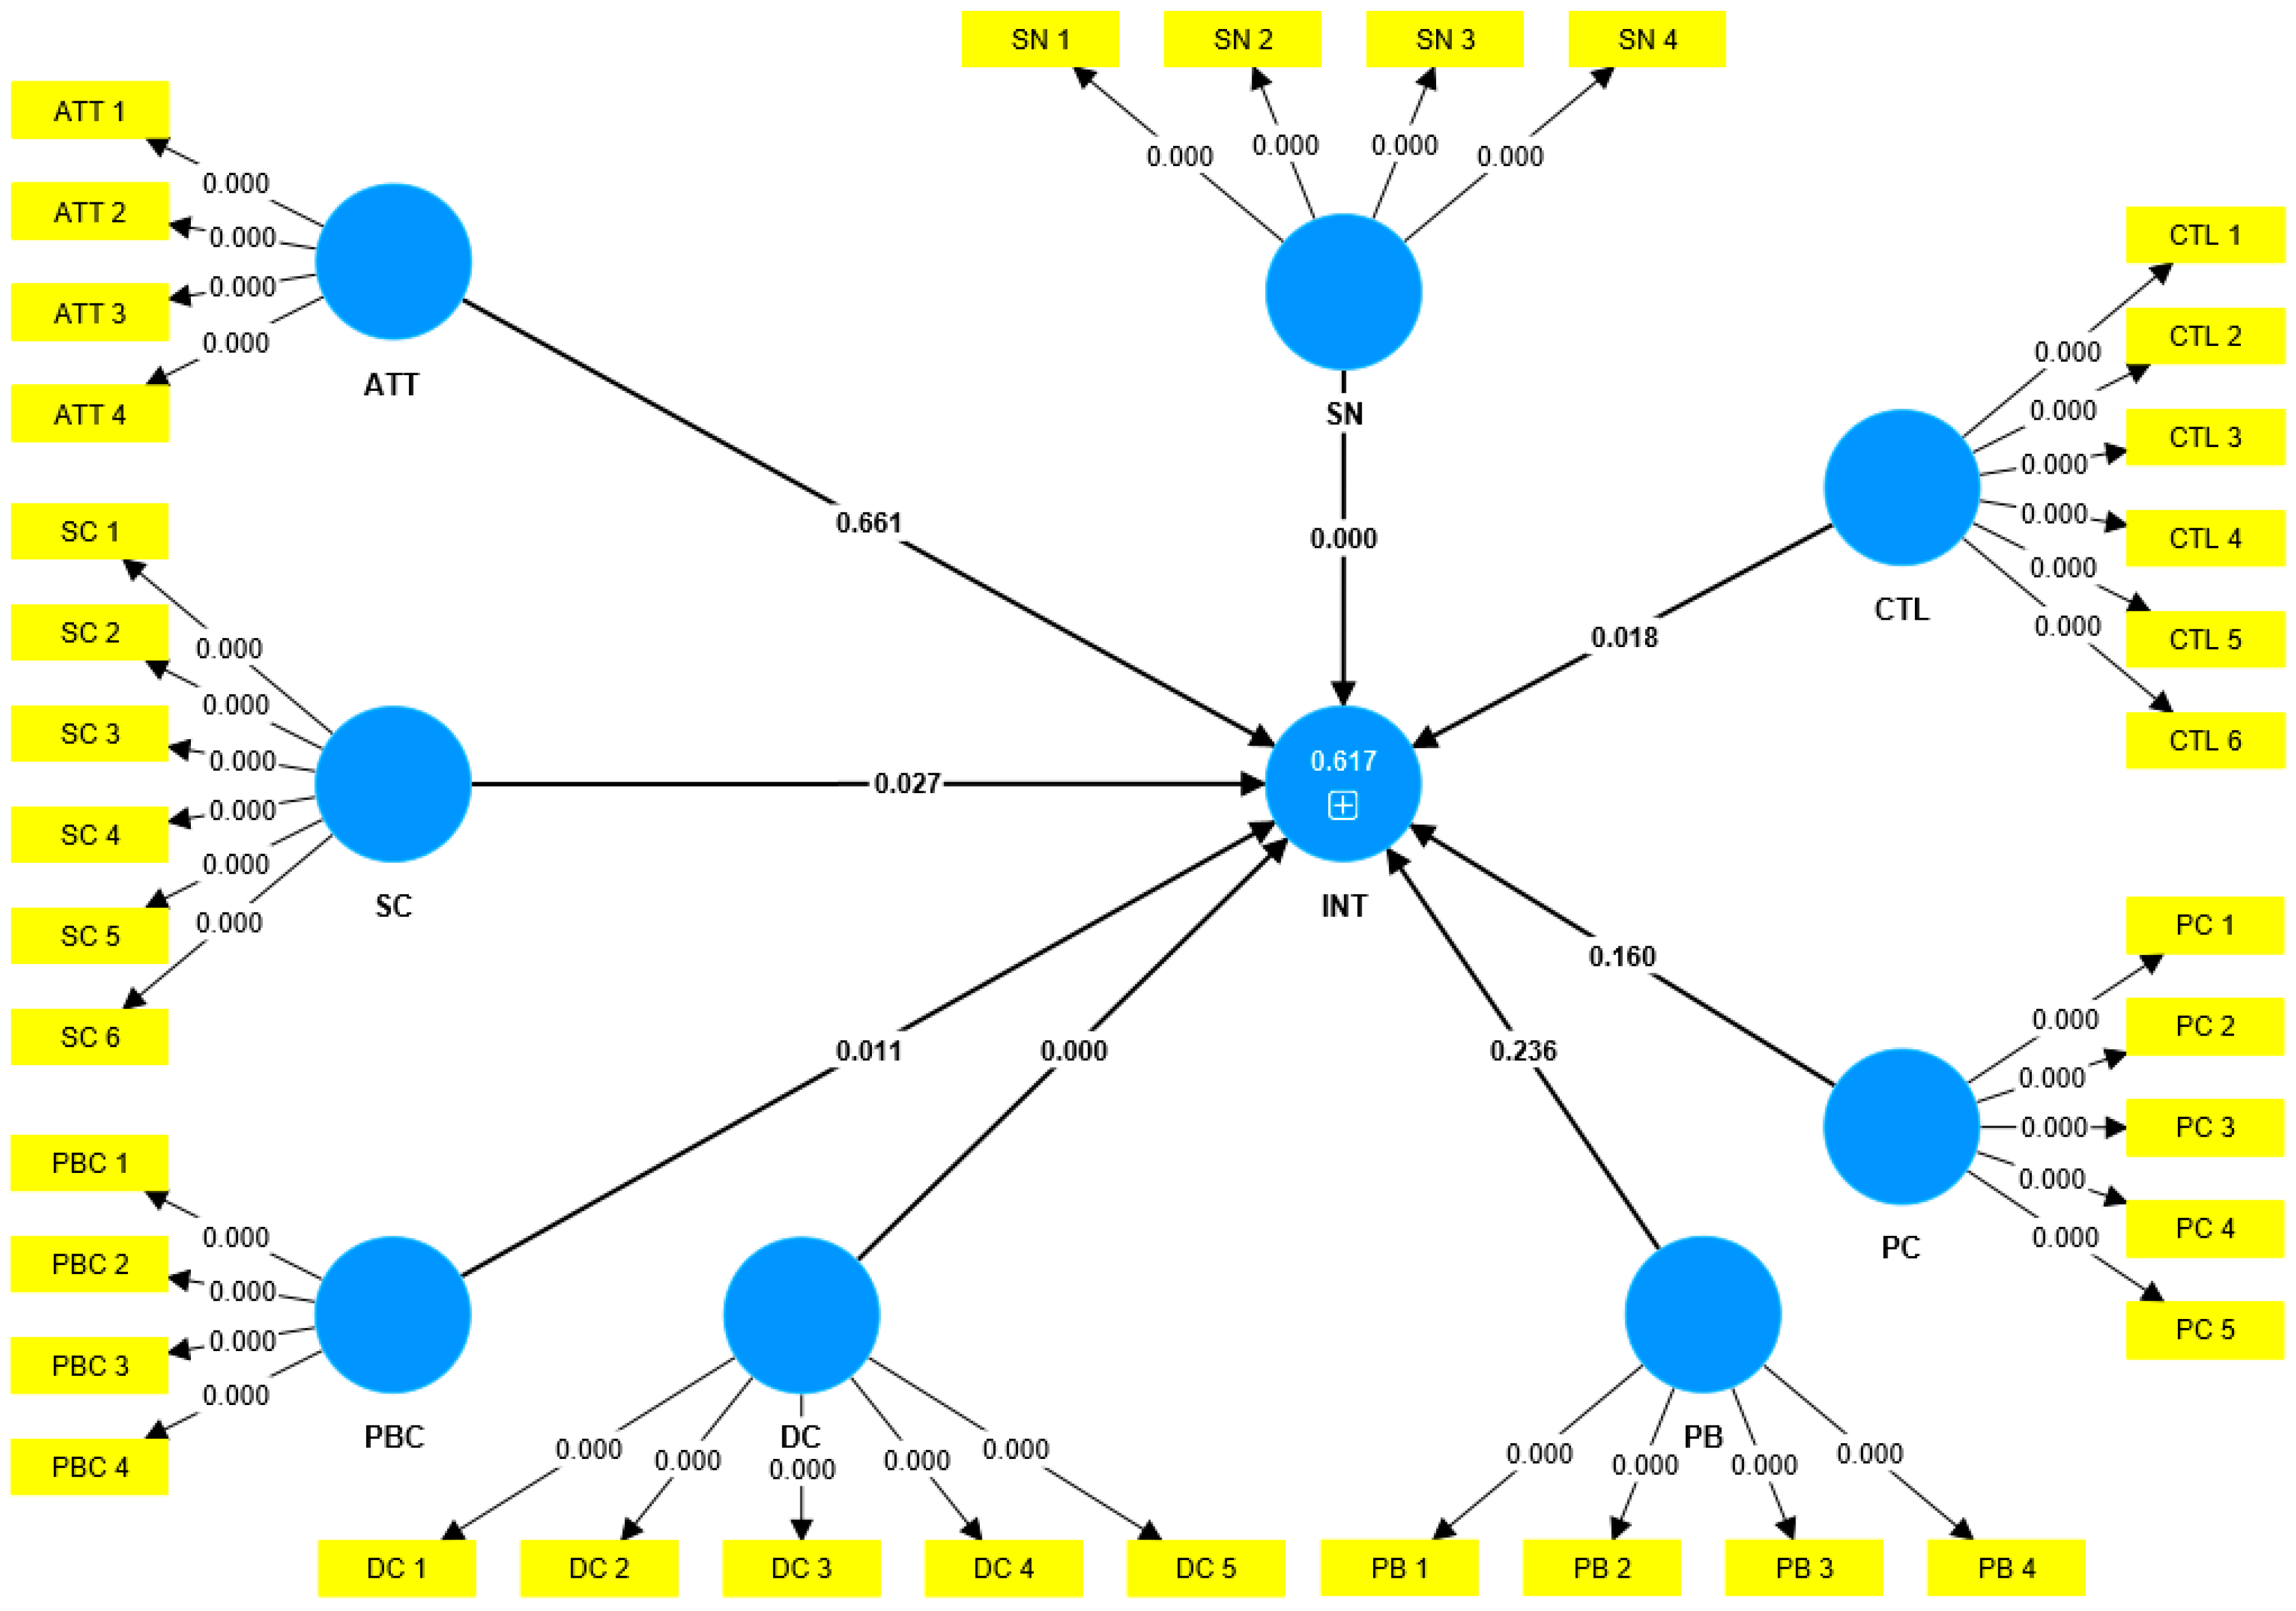
Structural Model Analysis

The reliability and validity of the constructs of the study were assessed prior to the evaluation of the structural model results. A multicollinearity test was conducted using the Variance Inflation Factor (VIF) to detect the presence of correlated constructs. The recommended VIF threshold by O’Brien [74] is ≤5 to avoid multicollinearity. Table 3 displays the VIF values computed, which were all below 5, indicating no multicollinearity. This indicates that collinearity problems do not negatively influence the structural model analysis.
Next, Herman’s single-factor score was employed to assess common method bias. This yielded 44.37%, below the recommended threshold of 50% [75]. This is an indication that the study is free from bias in the estimated correlation between two variables produced by common method variance.
Further, the model’s overall quality was gauged using the coefficient of determination (R2), which measures the predictive power of the endogenous constructs [68]. The R2 indicates the percentage of variance explained by endogenous constructs. Higher R2 values denote stronger predictive ability [76]. In Figure 1, the structural model exhibited a high predictive power of 0.617, implying that the latent variables explain 61.7% of the variance in firms’ sustainability reporting intentions.
Assessing the predictive relevance of the model’s endogenous construct [66], guidelines were followed. Chin [77] suggests that a cross-validated redundancy (Q2) value above zero indicates model relevance. The endogenous construct INT achieved a Q2 value of 0.5906, confirming its predictive relevance. Table 5 and Figure 1 depict further analysis exploring direct relations between latent variables. The coefficient and path significance were evaluated in the structural model by employing the bootstrapping procedure.
The findings show a positive and highly significant correlation between the construct subjective norm and sustainability reporting intentions (coefficient: 0.288, p-value = 0.000). Given that subjective norm describes the influence of significant others on firms’ behaviour, the positive association is therefore a demonstration that sustainability reporting intention increases with an increase in subjective norm. Thus, firms are more likely to engage in sustainability reporting based on the perceived importance of such a report to its valuable stakeholders. As Ajzen [24] pointed out, the views and opinions of significant others could be an important predictor of firms’ behavioural intentions to perform a particular behaviour. This finding compares favourably with some existing studies [21,28] that report that subjective norm influences intentions to engage in sustainability reporting. Consistent with the predicted hypothesis, H2 is supported by the findings of this study.
Similarly, the results show a positive and significant association between perceived behavioural control and sustainability reporting intentions (coefficient: 0.119, p-value = 0.011). There is an indication that as the firms’ perceived behavioural control increases, their intentions to report on sustainability also increase, suggesting that firms that believe they have the control, knowledge, and ability to report on sustainability are more likely to intend to do so. As postulated by Ajzen [24], the ease or difficulty of performing a particular behaviour increases the intention to perform the behaviour and the likelihood of actually performing that behaviour. As predicted in H3, this study is supported. This finding is consistent with some existing studies [21,28] that report that perceived behavioural control influences intentions to engage in sustainability reporting.
The relationship between attitude and sustainability reporting intention yielded negative and insignificant results (coefficient: −0.019, p-value = 0.661). This suggests that the firm’s attitude towards sustainability reporting intention is inversely related to reporting intention. Impliedly, a more positive attitude from the firm is associated with a lower intention to report on sustainability, but this finding is not statistically significant. As Ajzen [24] indicated, a favourable attitude towards a particular behaviour influences the intention to perform that behaviour, whereas an unfavourable attitude hinders the intention to perform the behaviour. In line with the prediction of this study, H1 is not supported. Empirically, this finding is consistent with Kwakye et al. [28], who found an insignificant relationship between attitude and intention to engage in sustainability accounting and reporting.
In terms of the relationship between dynamic capabilities and sustainability reporting intention, the results indicate a positive and highly significant relationship between the two constructs (coefficients: 0.260, p-value = 0.000). This suggests that firms’ intention to engage in sustainability reporting increases with higher levels of dynamic capabilities. Thus, firms that perceive themselves to possess dynamic capabilities, including the ability to integrate, build, and reconfigure internal and external competencies to adapt to rapidly evolving environmental conditions, are more inclined to engage in sustainability reporting. This finding aligns with earlier studies [41,42,43] that found a positive association between dynamic capabilities and adoption intentions. In line with the prediction of this study, H4 is thus supported.
The relationship between cultural tightness–looseness and firms’ intentions to report their sustainability practices yielded a positive and statistically significant relationship (coefficients: 0.109, p-value 0.018). By implication, organisations with tight cultures are more likely to engage in sustainability reporting, and tighter cultures may result in higher sustainability reporting intention. Accordingly, companies with clear and strict rules and sanctions are more likely to engage in sustainability reporting, as there are well-defined expectations for acceptable behaviours. This study’s outcome aligns with the findings of earlier studies [48,49,50] that found cultural tightness to positively influence behavioural intentions. The study’s result lends support to H5.
In line with H6, which tests the relationship between sustainability commitment and sustainability reporting intentions, the results reveal a positive and significant association between the two constructs (coefficient: 0.140, p-value 0.027). Impliedly, firms’ intentions to engage in sustainability reporting become stronger with the existence of sustainability commitment. This suggests that genuine commitment to sustainability, possibly reflected in a firm’s values, mission, and strategic objectives, is likely to translate into a higher likelihood of engaging in sustainability reporting. Empirically, this finding is supported by previous literature studies [60,78] that found sustainability commitment to drive firms’ intention to engage in sustainability practices.
The relationship between perceived benefits and firms’ sustainability reporting intentions was positive and insignificant between the two constructs (coefficient: 0.074, p-value = 0.236). This suggests that the perceived benefits do not significantly influence a firm’s sustainability reporting intention. In effect, a firm’s intention to report on its sustainability practices is not determined by the economic gains or corporate image enhancement that can be derived from such a report. This may be due to a lack of awareness of reporting benefits and the absence of social pressure for such a report. Prior studies [79,80] have shown that there is a positive correlation between perceived benefits and purchasing intention. The results of these studies corroborate the hypothesis H7 put forward in this research.
Regarding the relationship between the perceived cost and sustainability reporting intentions predicted in H8, the findings reveal a negative and insignificant relationship between perceived cost and sustainability reporting intentions (coefficient: −0.058, p-value = 0.160). This suggests that the sustainability reporting intention of firms declines with a rise in perceived cost. However, this relationship is not strong enough to be statistically significant. Impliedly, as the perceived costs (financial, time, effort, reporting complexities) associated with sustainability reporting increase, the intention to engage in such reporting could decrease. Further, firms may not perceive costs as prohibitive enough to significantly affect their reporting intentions. This finding compares favourably with some existing studies [81,82] that found the association between perceived cost and intention to be insignificant, thus supporting the findings of this study.

5. Conclusions

The study employed the TPB framework to examine the intentions of firms to engage in sustainability reporting and the factors that drive such intentions. Specifically, the research explored the components of TPB and firm-specific factors such as dynamic capabilities, cultural tightness–looseness, sustainability commitment, perceived benefit and cost, and their impact on intentions to engage in sustainability reporting. The PLS-SEM-based technique was employed to analyse the 518 survey questionnaires received from the management of AGI member firms that were involved in the study.
The results from this study indicate that subjective norms, perceived behavioural control, dynamic capabilities, cultural tightness–looseness, sustainability commitment, and perceived benefit positively influence sustainability reporting intention, whilst an inverse relationship exists between attitude, perceived cost, and intention to engage in sustainability reporting.
The findings of this study offer some useful insights into the sustainability reporting intention of firms registered with the largest industrial association in Ghana. An understanding of the intentions of firms towards sustainability reporting and the predictors of such intentions may be valuable to policymakers interested in promoting behaviours of sustainability practices among firms, especially with the SDG deadline nearing. Given that subjective norms significantly influence firms’ sustainability reporting intention, policymakers should promote industry-wide policies that would encourage reporting among member firms. Moreover, it is imperative for policymakers to acknowledge, based on this study, that the disposition (attitude) of firms towards sustainability reporting does not influence reporting behaviour. It is crucial, therefore, to establish a detailed reporting framework that furnishes firms with precise directions and assistance, enabling them to effectively communicate their sustainability initiatives. Furthermore, considering the positive impact of dynamic capabilities, cultural adaptability, perceived behavioural control, and commitment to sustainability on firms’ intentions to report, it is evidenced that the availability of resources will play an important role in promoting sustainability reporting behaviour among firms, especially from a developing country perspective.

Limitations and Future Research

Despite this study’s contributions, the findings are limited in some regards. The findings only reflect firms’ intentions to engage in sustainability reporting and the factors that predict such intentions, not the actual sustainability reporting behaviour. Moreover, the study relied on respondents from firms registered with AGI, which may limit its generalisation. Care should therefore be taken in the interpretation of the findings.

Author Contributions

Conceptualisation, C.O.-O., G.M.Y.O., C.A.-B. and E.E.S.W.; methodology, C.O.-O. and G.M.Y.O.; formal analysis, C.O.-O.; investigation, C.O.-O.; resources, C.O.-O.; data curation, C.O.-O. and G.M.Y.O.; writing—original draft preparation, C.O.-O.; writing—review and editing, C.O.-O. and G.M.Y.O.; supervision, G.M.Y.O., C.A.-B. and E.E.S.W. All authors have read and agreed to the published version of the manuscript.

Funding

This research received no external funding.

Institutional Review Board Statement

The study was conducted in accordance with the Declaration of Helsinki, and approved by the Institutional Review Board (or Ethics Committee) of UNIVERSITY OF GHANA ETHICS COMMITTEE FOR THE HUMANITIES (ECH) (protocol code (ECH 104/23-24) and date of approved on 27 December 2023).

Informed Consent Statement

Informed consent was obtained from all subjects involved in the study.

Data Availability Statement

The raw data supporting the conclusions of this article will be made available by the corresponding author on request.

Conflicts of Interest

The authors declare no conflicts of interest.

References

  1. McGrath, L.; Hynes, S.; McHale, J. The Air we Breathe: Estimates of Air Pollution Extended Genuine Savings for Europe. Rev. Income Wealth 2022, 68, 161–188. [Google Scholar] [CrossRef]
  2. Boakye, D.J.; TIngbani, I.; Ahinful, G.; Damoah, I.; Tauringana, V. Sustainable environmental practices and financial performance: Evidence from listed small and medium-sized enterprise in the United Kingdom. Bus. Strateg. Environ. 2020, 29, 2583–2602. [Google Scholar] [CrossRef]
  3. Vazquez-Brust, D.; Smith, A.M.; Sarkis, J. Managing the transition to critical green growth: The “Green Growth State”. Futures 2014, 64, 38–50. [Google Scholar] [CrossRef]
  4. Ingley, C.B. Company growth and Board attitudes to corporate social responsibility. Int. J. Bus. Gov. Ethics 2008, 4, 17–39. [Google Scholar] [CrossRef]
  5. Tuokuu, F.X.D.; Gruber, J.S.; Idemudia, U.; Kayira, J. Challenges and opportunities of environmental policy implementation: Empirical evidence from Ghana’s gold mining sector. Resour. Policy 2018, 59, 435–445. [Google Scholar] [CrossRef]
  6. Fusco, F.; Ricci, P. What is the stock of the situation? A bibliometric analysis on social and environmental accounting research in public sector. Int. J. Public Sect. Manag. 2019, 32, 21–41. [Google Scholar] [CrossRef]
  7. Welbeck, E.E.; Owusu, G.M.Y.; Bekoe, R.A.; Kusi, J.A. Determinants of environmental disclosures of listed firms in Ghana. Int. J. Corp. Soc. Responsib. 2017, 2, 11. [Google Scholar] [CrossRef]
  8. KPMG. Big Shifts, Small Steps: Survey of Corporate Responsibility 2022. Available online: https://assets.kpmg.com/content/dam/kpmg/se/pdf/komm/2022/Global-Survey-of-Sustainability-Reporting-2022.pdf (accessed on 25 April 2023).
  9. Mion, G.; Adaui, C.R.L. Mandatory nonfinancial disclosure and its consequences on the sustainability reporting quality of Italian and German companies. Sustainability 2019, 11, 4612. [Google Scholar] [CrossRef]
  10. Jackson, G.; Bartosch, J.; Avetisyan, E.; Kinderman, D.; Knudsen, J.S. Mandatory Non-financial Disclosure and Its Influence on CSR: An International Comparison. J. Bus. Ethics 2020, 162, 323–342. [Google Scholar] [CrossRef]
  11. Stubbs, W.; Higgins, C.; Milne, M. Why do companies not produce sustainability reports? Bus. Strateg. Environ. 2013, 22, 456–470. [Google Scholar] [CrossRef]
  12. Ali, W.; Frynas, J.G.; Mahmood, Z. Determinants of Corporate Social Responsibility (CSR) Disclosure in Developed and Developing Countries: A Literature Review. Corp. Soc. Responsib. Environ. Manag. 2017, 24, 273–294. [Google Scholar] [CrossRef]
  13. Tauringana, V. Sustainability reporting challenges in developing countries: Towards management perceptions research evidence-based practices. J. Account. Emerg. Econ. 2021, 11, 194–215. [Google Scholar] [CrossRef]
  14. Buallay, A. Between cost and value: Investigating the effects of sustainability reporting on a firm’s performance. J. Appl. Account. Res. 2019, 20, 481–496. [Google Scholar] [CrossRef]
  15. Buallay, A.M. Benefits and Costs of Disclosing Sustainability Reports. In International Perspectives on Sustainability Reporting; Emerald Publishing Limited: Leeds, UK, 2022; pp. 77–80. [Google Scholar] [CrossRef]
  16. De Villiers, C.; Alexander, D. The institutionalisation of corporate social responsibility reporting. Br. Account. Rev. 2014, 46, 198–212. [Google Scholar] [CrossRef]
  17. Hossain, M.M.; Alam, M.; Islam, M.A.; Hecimovic, A. Do stakeholders or social obligations drive corporate social and environmental responsibility reporting? Managerial views from a developing country. Qual. Res. Account. Manag. 2015, 12, 287–314. [Google Scholar] [CrossRef]
  18. Amoako, K.O.; Lord, B.R.; Dixon, K. Insights from the websites of five plants operated by Newmont Mining Corporation. Meditari Account. Res. 2017, 25, 186–215. [Google Scholar] [CrossRef]
  19. Rahaman, A.S.; Lawrence, S.; Roper, J. Social and environmental reporting at the VRA: Institutionalised legitimacy or legitimation crisis? Crit. Perspect. Account. 2004, 15, 35–56. [Google Scholar] [CrossRef]
  20. Singh, G.; Sharma, S.; Sharma, R.; Dwivedi, Y.K. Investigating environmental sustainability in small family-owned businesses: Integration of religiosity, ethical judgment, and theory of planned behavior. Technol. Forecast. Soc. Chang. 2021, 173, 121094. [Google Scholar] [CrossRef]
  21. Thoradeniya, P.; Lee, J.; Tan, R.; Ferreira, A. Sustainability reporting and the theory of planned behaviour. Account. Audit. Account. J. 2015, 28, 1099–1137. [Google Scholar] [CrossRef]
  22. Zharfpeykan, R.; Askarany, D. Sustainability Reporting and Organisational Factors. J. Risk Financ. Manag. 2023, 16, 163. [Google Scholar] [CrossRef]
  23. Owusu, G.M.Y.; Ofori-Owusu, C. Analysis of the structure and evolution of sustainability accounting research: A 41-year review. Meditari Account. Res. 2024; ahead-of-print. [Google Scholar] [CrossRef]
  24. Ajzen, I. The Theory of Planned Behavior. Organistional Behav. Hum. Decis. Process. 1991, 50, 179–211. [Google Scholar] [CrossRef]
  25. Benk, S.; Çakmak, A.F.; Budak, T. An investigation of tax compliance intention: A theory of planned behavior approach. Eur. J. Econ. Financ. Adm. Sci. 2011, 28, 180–188. [Google Scholar]
  26. Armitage, C.J.; Conner, M. Efficacy of the theory of planned behaviour: A meta-analytic review. Br. J. Soc. Psychol. 2001, 40, 471–499. [Google Scholar] [CrossRef]
  27. Ajzen, I. Perceived behavioral control, self-efficacy, locus of control, and the theory of planned behavior. J. Appl. Soc. Psychol. 2002, 32, 665–683. [Google Scholar] [CrossRef]
  28. Kwakye, T.O.; Welbeck, E.E.; Owusu, G.M.Y.; Anokye, F.K. Determinants of intention to engage in Sustainability Accounting & Reporting (SAR): The perspective of professional accountants. Int. J. Corp. Soc. Responsib. 2018, 3, 11. [Google Scholar] [CrossRef]
  29. Chen, X.; Weerathunga, P.R.; Nurunnabi, M.; Kulathunga, K.M.M.C.B.; Samarathunga, W.H.M.S. Influences of behavioral intention to engage in environmental accounting practices for corporate sustainability: Managerial perspectives from a developing country. Sustainability 2020, 12, 5266. [Google Scholar] [CrossRef]
  30. Acheampong, O.; Dogbe, C.S.K.; Iddris, F. Sustainability Reporting by Owner-Managers of SMEs: The Perspective of Theory of Planned Behavior (TPB). Probl. Zarządzania Manag. Issues 2022, 2022, 27–46. [Google Scholar] [CrossRef]
  31. Beddewela, E.; Herzig, C. Corporate social reporting by MNCs’ subsidiaries in Sri Lanka. Account. Forum 2013, 37, 135–149. [Google Scholar] [CrossRef]
  32. Flannery, B.L.; May, D.R. Environmental ethical decision making in the U.S. metal-finishing industry. Acad. Manag. J. 2000, 43, 642–662. [Google Scholar] [CrossRef]
  33. Sharma, S.; Singh, G.; Sharma, R. For it is in giving that we receive: Investigating gamers’ gifting behaviour in online games. Int. J. Inf. Manag. 2021, 60, 102363. [Google Scholar] [CrossRef]
  34. Chen, M.F.; Tung, P.J. Developing an extended Theory of Planned Behavior model to predict consumers’ intention to visit green hotels. Int. J. Hosp. Manag. 2014, 36, 221–230. [Google Scholar] [CrossRef]
  35. Paul, J.; Modi, A.; Patel, J. Predicting green product consumption using theory of planned behavior and reasoned action. J. Retail. Consum. Serv. 2016, 29, 123–134. [Google Scholar] [CrossRef]
  36. Wang, S.; Wang, J.; Li, J.; Zhou, K. How and when does religiosity contribute to tourists’ intention to behave pro-environmentally in hotels? J. Sustain. Tour. 2020, 28, 1120–1137. [Google Scholar] [CrossRef]
  37. Teece, D.J.; Pisano, G.; Shuen, A. Dynamic capabilities and strategic management. Knowl. Strateg. 2009, 18, 77–116. [Google Scholar] [CrossRef]
  38. Efrat, K.; Hughes, P.; Nemkova, E.; Souchon, A.L.; Sy-Changco, J. Leveraging of Dynamic export capabilities for competitive advantage and performance consequences: Evidence from China. J. Bus. Res. 2018, 84, 114–124. [Google Scholar] [CrossRef]
  39. Vogel, R.; Güttel, W.H. The dynamic capability view in strategic management: A bibliometric review. Int. J. Manag. Rev. 2013, 15, 426–446. [Google Scholar] [CrossRef]
  40. Barrales-Molina, V.; Benitez-Amado, J.; Perez-Arostegui, M.N. Managerial perceptions of the competitive environment and dynamic capabilities generation. Ind. Manag. Data Syst. 2010, 110, 1355–1384. [Google Scholar] [CrossRef]
  41. Khan, O.; Bellini, N.; Daddi, T.; Iraldo, F. Effects of behavioral intention and dynamic capabilities on circular economy adoption and performance of tourism SMEs. J. Sustain. Tour. 2023, 31, 1777–1796. [Google Scholar] [CrossRef]
  42. Bresciani, S.; Rehman, S.U.; Alam, G.M.; Ashfaq, K.; Usman, M. Environmental MCS package, perceived environmental uncertainty and green performance: In green dynamic capabilities and investment in environmental management perspectives. Rev. Int. Bus. Strateg. 2023, 33, 105–126. [Google Scholar] [CrossRef]
  43. Nasution, M.D.T.P.; Rafiki, A.; Lubis, A.; Rossanty, Y. Entrepreneurial orientation, knowledge management, dynamic capabilities towards e-commerce adoption of SMEs in Indonesia. J. Sci. Technol. Policy Manag. 2021, 12, 256–282. [Google Scholar] [CrossRef]
  44. Essid, M.; Berland, N. Adoption of environmental management tools: The dynamic capabilities contributions. Sustain. Account. Manag. Policy J. 2018, 9, 229–252. [Google Scholar] [CrossRef]
  45. Pelto, P.J. The differences between “tight” and “loose” societies. Trans-Action 1968, 5, 37–40. [Google Scholar] [CrossRef]
  46. Gelfand, M.J.; Nishii, L.H.; Raver, J.L. On the nature and importance of cultural tightness-looseness. J. Appl. Psychol. 2006, 91, 1225–1244. [Google Scholar] [CrossRef]
  47. Gelfand, M. Rule Makers, Rule Breakers: Tight and Loose Cultures and the Secret Signals That Direct Our Lives; Scribner: New York, NY, USA, 2019; 384p, Available online: https://books.google.it/books?hl=it&lr=&id=bLSkDwAAQBAJ&oi=fnd&pg=PA1&dq=Gelfand,+M.+(2019).+Rule+Makers,+Rule+Breakers:+Tight+and+Loose+Cultures+and+the+Secret+Signals+That+Direct+Our+Lives.+Scribner.&ots=PBy1D34Fwu&sig=K-QlHgHGUMAPHbqfoSbYtVn9i5c&redir_ (accessed on 15 April 2024).
  48. Contu, F.; Di Santo, D.; Baldner, C.; Pierro, A. Examining the Interaction between Perceived Cultural Tightness and Prevention Regulatory Focus on Life Satisfaction in Italy. Sustainability 2023, 15, 1865. [Google Scholar] [CrossRef]
  49. Di Santo, D.; Talamo, A.; Bonaiuto, F.; Cabras, C.; Pierro, A. A Multilevel Analysis of the Impact of Unit Tightness vs. Looseness Culture on Attitudes and Behaviors in the Workplace. Front. Psychol. 2021, 12, 652068. [Google Scholar] [CrossRef]
  50. Aktas, M.; Gelfand, M.J.; Hanges, P.J. Cultural Tightness–Looseness and Perceptions of Effective Leadership. J. Cross. Cult. Psychol. 2016, 47, 294–309. [Google Scholar] [CrossRef]
  51. Keogh, P.D.; Polonsky, M.J. Environmental commitment: A basis for environmental entrepreneurship? J. Organ. Chang. Manag. 1998, 11, 38–49. [Google Scholar] [CrossRef]
  52. Öhman, J.; Sund, L. A didactic model of sustainability commitment. Sustainability 2021, 13, 3083. [Google Scholar] [CrossRef]
  53. Jansson, J.; Nilsson, J.; Modig, F.; Hed Vall, G. Commitment to Sustainability in Small and Medium-Sized Enterprises: The Influence of Strategic Orientations and Management Values. Bus. Strateg. Environ. 2017, 26, 69–83. [Google Scholar] [CrossRef]
  54. Ajzen, I. Attitudes, Personality and Behaviour; McGraw-Hill Education: Maidenhead, UK, 2005. [Google Scholar]
  55. Burzis Homi, U. The Adoption and Implementation of Environmental Management Systems in New Zealand Hotels: The Managers’ Perspective. Master’s Thesis, Auckland University of Technology, Auckland, New Zealand, 2010. [Google Scholar]
  56. Tu, J.C.; Huang, H.S. Analysis on the relationship between green accounting and green design for enterprises. Sustainability 2015, 7, 6264–6277. [Google Scholar] [CrossRef]
  57. Dillman, D.A. Mail and Internet Surveys: The Tailored Design Method—2007 Update with New Internet, Visual, and Mixed-Mode Guide (Google eBoek); John Wiley & Sons: Hoboken, NJ, USA, 2011; ISBN 1118044630. Available online: http://books.google.com/books?hl=nl&lr=&id=d_VpiiWp51gC&pgis=1 (accessed on 15 April 2024).
  58. Diamantopoulos, A.; Sarstedt, M.; Fuchs, C.; Wilczynski, P.; Kaiser, S. Guidelines for choosing between multi-item and single-item scales for construct measurement: A predictive validity perspective. J. Acad. Mark. Sci. 2012, 40, 434–449. [Google Scholar] [CrossRef]
  59. Chen, R.; Wang, J.; Herath, T.; Rao, H.R. An investigation of email processing from a risky decision making perspective. Decis. Support. Syst. 2011, 52, 73–81. [Google Scholar] [CrossRef]
  60. Henriques, I.; Sadorsky, P. The relationship between environmental commitment and managerial perceptions of stakeholder importance. Acad. Manag. J. 1999, 42, 87–99. [Google Scholar] [CrossRef]
  61. Gelfand, M.J.; Raver, J.L.; Nishii, L.; Leslie, L.M.; Lun, J.; Lim, B.C.; Duan, L.; Almaliach, A.; Ang, S.; Arnadottir, J.; et al. Differences between tight and loose cultures: A 33-nati on study. Environment 2011, 53, 3–4. [Google Scholar] [CrossRef]
  62. Fornell, C.; Bookstein, F.L. Two Structural Equation Models: LISREL and PLS Applied to Consumer Exit-Voice Theory. J. Mark. Res. 1982, 19, 440–452. [Google Scholar] [CrossRef]
  63. Chin, W.W. The Partial Least Squares Approach to Structural Equation Modelling. In Modern Methods for Business Research; Marcoulides, G.A., Ed.; Lawrence Erlbaum Associates: Mahwah, NJ, USA, 1998; Volume 295. [Google Scholar]
  64. Chin, W. Partial Least Squares for Is Researchers: An Overview and Presentation of Recent Advances Using the Pls Approach. In Proceedings of the 21st International Conference on Information Systems ICIS 2000, Brisbane, Australia, 10–13 December 2000; pp. 741–742. [Google Scholar]
  65. Gefen, D.; Straub, D. A Practical Guide To Factorial Validity Using PLS-Graph: Tutorial And Annotated Example. Commun. Assoc. Inf. Syst. 2005, 16, 5. [Google Scholar] [CrossRef]
  66. Hair, J.F.; Sarstedt, M.; Hopkins, L.; Kuppelwieser, V.G. Partial least squares structural equation modeling (PLS-SEM): An emerging tool in business research. Eur. Bus. Rev. 2014, 26, 106–121. [Google Scholar] [CrossRef]
  67. Henseler, J.; Ringle, C.M.; Sinkovics, R.R. The use of partial least squares path modeling in international marketing. Adv. Int. Mark. 2009, 20, 277–319. [Google Scholar] [CrossRef]
  68. Sarstedt, M.; Ringle, C.M.; Hair, J.F. Partial Least Squares Structural Equation Modeling. In Handbook of Market Research (Issue July); Springer: Berlin/Heidelberg, Germany, 2021. [Google Scholar] [CrossRef]
  69. Ab Hamid, M.R.; Sami, W.; Mohmad Sidek, M.H. Discriminant Validity Assessment: Use of Fornell & Larcker criterion versus HTMT Criterion. J. Phys. Conf. Ser. 2017, 890, 012163. [Google Scholar] [CrossRef]
  70. Henseler, J.; Ringle, C.M.; Sarstedt, M. A New Criterion for assessing discriminant validity in variance-based structural equation modeling. J. Acad. Mark. Sci. 2015, 43, 115–135. [Google Scholar] [CrossRef]
  71. Ringle, C.M.; Sarstedt, M.; Sinkovics, N.; Sinkovics, R.R. A perspective on using partial least squares structural equation modelling in data articles. Data Brief 2023, 48, 109074. [Google Scholar] [CrossRef]
  72. Henseler, J. Partial Least Squares Path Modeling. In Advanced Methods for Modeling Markets; Leeflang, P., Wieringa, J., Bijmolt, T., Pauwels, K., Eds.; International Series in Quantitative Marketing; Springer: Cham, Switzerland, 2017; pp. 3–27. [Google Scholar] [CrossRef]
  73. Kline, R.B. Principles and Practice of Structural Equation Modeling; Guilford Publications: New York, NY, USA, 2023; Volume 1. [Google Scholar]
  74. O’Brien, R.M. A caution regarding rules of thumb for variance inflation factors. Qual. Quant. 2007, 41, 673–690. [Google Scholar] [CrossRef]
  75. Podsakoff, P.M.; Organ, D.W. Self-Reports in Organizational Research: Problems and Prospects. J. Manag. 1986, 12, 531–544. [Google Scholar] [CrossRef]
  76. Hair, J.F., Jr.; Hult, G.T.; Ringle, C.M.; Sarstedt, M.; Danks, N.P.; Ray, S. Partial Least Squares Structural Equation Modeling (PLS-SEM) Using R: A Workbook; Springer: Cham, Switzerland, 2021; ISBN 9783030805180. [Google Scholar] [CrossRef]
  77. Chin, W.W. How to Write Up and Report PLS Analyses. In Handbook of Partial Least Squares; Springer: Berlin/Heidelberg, Germany, 2010; pp. 655–690. [Google Scholar]
  78. Hunt, C.B.; Auster, E.R. Proactive Environmental Management: Avoiding the Toxic Trap. MITSloan Manag. Rev. 1990, 31, 7. [Google Scholar]
  79. Claudy, M.C.; Peterson, M.; O’Driscoll, A. Understanding the Attitude-Behavior Gap for Renewable Energy Systems Using Behavioral Reasoning Theory. J. Macromark. 2013, 33, 273–287. [Google Scholar] [CrossRef]
  80. Akroush, M.N.; Zuriekat, M.I.; Al Jabali, H.I.; Asfour, N.A. Determinants of purchasing intentions of energy-efficient products: The roles of energy awareness and perceived benefits. Int. J. Energy Sect. Manag. 2019, 13, 128–148. [Google Scholar] [CrossRef]
  81. Salim, T.A.; El Barachi, M.; Mohamed, A.A.D.; Halstead, S.; Babreak, N. The mediator and moderator roles of perceived cost on the relationship between organizational readiness and the intention to adopt blockchain technology. Technol. Soc. 2022, 71, 102108. [Google Scholar] [CrossRef]
  82. Alsoufi, A.; Ali, H. Customers’ Perception of M-Banking Adoption in Kingdom of Bahrain: An Extended of TAM. Int. J. Manag. Inf. Technol. 2014, 6, 1–13. Available online: https://arxiv.org/ftp/arxiv/papers/1403/1403.2828.pdf (accessed on 15 April 2024).
Figure 1. Structural model.
Sustainability 16 05052 g001
Table 1. Descriptive statistics of the respondents.
Group A: Respondents’ Firm Profile Group B: Respondents’ Demographic Statistics
Industry TypeFrequency%GenderFrequency%
Financial services519.8Female17434
Manufacturing and agro-processing19037Male34466
Power, mining, energy, and petroleum10019
IT and others (logistics, transport, consultancy etc.)17734
Ownership TypeFrequency%Educational BackgroundFrequency%
Locally owned35368Bachelor’s degree21241
Foreign-owned7915Master’s degree24147
Mixed ownership8416Doctoral degree468.9
Undisclosed20.4Undisclosed193.7
Firm Age: Years in OperationFrequency%AgeFrequency%
Up to 15 years2685226 to 35 years21942
16 to 30 years991936 to 45 years15931
31 to 45 years193.746 to 55 years10220
46 to 60 years254.8Above 55 years387.3
Above 60 years417.9
Undisclosed6613
Table 2. Construct and its indicators.
ItemMeanSD
Attitude towards Sustainability Reporting Intention (ATT)
It is good for my company to engage in sustainability reporting.5.5791.556
It is rewarding for my company to engage in sustainability reporting.5.7271.476
It is valuable for my company to engage in sustainability reporting. 5.7271.464
It is meaningful for my company to engage in sustainability reporting. 5.7671.480
Overall5.7001.494
Subjective Norm (SN)
Most of my company’s stakeholders (shareholders, employees, community, etc.) think that my company should engage in sustainability reporting.5.1681.639
Most of the internal stakeholders (employees and management) would approve of my company engaging in sustainability reporting. 5.2671.609
Most organisations whose opinions are valued by my company engage in sustainability reporting.5.0581.731
Many companies similar to my company engage in sustainability reporting. 5.0311.784
Overall5.1311.691
Perceived Behavioural Control (PBC)
It is easy for my company to engage in sustainability reporting. 4.7971.914
It is possible for my company to engage in sustainability reporting.5.4711.552
The decision to engage in sustainability reporting is under my company’s authority. 5.3371.598
The decision to engage in sustainability reporting is under my company’s control. 5.1471.658
Overall5.1881.681
Sustainability Reporting Intention (INT)
My company is committed to engage in or continue sustainability reporting. 4.9031.723
My company plans to engage in or continue sustainability reporting.4.9211.798
My company has the intention to engage in or continue sustainability reporting. 4.9591.846
My company is willing to engage in or continue sustainability reporting. 4.9881.848
Overall4.9431.804
Dynamic Capabilities (DCs)
My company is aware of developments in corporate sustainability reporting.5.2601.546
My company quickly adapts to new reporting requirements, either mandatory or voluntary.5.2331.526
My company is able to effectively deploy resources, including the appropriate technology to improve reporting requirements. 5.1361.590
My company regularly provides training for employees on topical and contemporary issues, including sustainability reporting.4.9281.812
My company absorbs new knowledge to improve reporting to stakeholders.5.1301.712
Overall5.1371.637
Sustainability Commitment (SC)
My company has a sustainability action plan. 4.8641.953
My company has a written document describing its sustainability action plan. 4.8031.977
My company communicates its sustainability action plan to shareholders or stakeholders. 4.9221.866
My company communicates its sustainability action plan to employees.4.9651.847
My company has an environment, health, and safety (EHS) unit/department.5.2291.755
My company has a board or management committee dedicated to dealing with sustainability issues.4.9401.885
Overall4.9541.881
Perceived Benefit (PB)
Sustainability reporting increases economic benefits to my company.5.1921.607
Sustainability reporting improves the corporate image. 5.5051.514
Sustainability reporting improves monitoring of environmental impacts of my company.5.3901.533
Sustainability reporting will help my company to contribute to sustainable development.5.5291.436
Overall5.4041.523
Perceived Cost (PC)
A significant amount of work is required to adopt sustainability reporting.5.5761.503
A significant learning effort is required to gain sufficient knowledge of sustainability reporting.5.6011.525
It is significantly more expensive to prepare our company’s sustainability reporting when it is adopted. 5.4441.644
It is significantly more expensive to have our sustainability report audited/reviewed/compiled to gain more credibility from stakeholders.5.4351.583
Sustainability reporting increases the complexity of reporting because of the need to restructure my company’s conventional accounting system. 5.2191.636
Overall5.4551.578
Cultural TightnessLooseness (CTL)
There are many social norms in my company that we are supposed to abide by.5.1421.582
In my company, we agree on what behaviours are appropriate versus inappropriate in most situations. 5.4441.530
There are very clear sustainable reporting expectations for how employees should act in most situations in my company.5.2521.617
In my company, if someone acts in an inappropriate way, others will strongly disapprove.5.4451.609
Employees almost always comply with social norms in my company.5.3491.521
Employees have a great deal of freedom in deciding how they want to behave in most situations.4.8491.882
Overall5.2471.624
Table 3. Indicator loadings, CR, AVE, and VIF.
ConstructsIndicatorsIndicator LoadingComposite Reliability (CR.)Convergent Validity (AVE)Variance Inflation Factor (VIF)
Attitude (ATT)ATT 10.9080.9540.8392.034
ATT 20.921
ATT 30.927
ATT 40.908
Subjective Norm (SN)SN 10.8700.9380.7902.528
SN 20.914
SN 30.901
SN 40.871
Perceived Behaviour Control (PBC)PBC 10.8130.9000.6932.428
PBC 20.811
PBC 30.873
PBC 40.833
Dynamic Capabilities (DC)DC 10.8090.9360.7460.746
DC 20.881
DC 30.862
DC 40.880
DC 50.883
Sustainability Commitment (SC)SC 10.8920.9520.7682.912
SC 20.921
SC 30.929
SC 40.906
SC 50.703
SC 60.888
Perceived Benefit (PB)PB 10.8610.9360.7862.411
PB 20.877
PB 30.903
PB 40.905
Perceived Cost (PC)PC 10.8710.9360.7441.733
PC 20.869
PC 30.846
PC 40.871
PC 50.856
Cultural Tightness–Looseness (CT-L)CTL 10.8250.9220.6651.960
CTL 20.847
CTL 30.854
CTL 40.826
CTL 50.837
CTL 60.692
Sustainability Reporting Intentions (INT)INT 10.9160.9670.880
INT 20.950
INT 30.948
INT 40.939
Table 4. Heterotrait–Monotrait Ratio (HTMT)—Matrix.
ATTCTLDCINTPBPBCPCSCSN
ATT
CTL0.490
DC0.5100.626
INT0.4750.5570.754
PB0.5730.6110.7340.628
PBC0.6570.5710.7410.6860.656
PC0.4650.6400.5160.3820.5690.413
SC0.3430.5560.8070.6840.6840.6230.416
SN0.6360.5160.7100.7310.6170.7480.4220.673
Table 5. PLS-SEM Results from hypothesis testing.
PathsCoefficientsT Statisticsp Values
ATT → INT−0.0190.4390.661
CTL → INT0.1092.3600.018
DC → INT0.2603.7710.000
PB → INT0.0741.1850.236
PBC → INT0.1192.5420.011
PC → INT−0.0581.4050.160
SC → INT0.1402.2100.027
SN → INT0.2885.2020.000
Disclaimer/Publisher’s Note: The statements, opinions and data contained in all publications are solely those of the individual author(s) and contributor(s) and not of MDPI and/or the editor(s). MDPI and/or the editor(s) disclaim responsibility for any injury to people or property resulting from any ideas, methods, instructions or products referred to in the content.

