Abstract
Agricultural farming problems are the main concerns for states and local governments in stabilizing and increasing food production. Agricultural mechanization is an important element in this scenario. Thus, we conduct a systematic analysis to examine the agricultural mechanization level and its effect on grain production by using panel data and scientific literature mining for the last two decades in northeastern China. For this purpose, the autoregressive distributed lag model, the stochastic frontier model, and bibliometric analysis are employed. The results show that the development level of agricultural mechanization is stable in the region. In terms of scientific research progress in agricultural mechanization, researchers are mainly studying to solve problems related to carbon emissions, green energy, and environmental protection, and overall, a 4.39% growth rate for research publications was found. Also, the statistical analysis shows that variables such as fertilizers (9.808) and agricultural machinery (0.003) have a significant positive impact on the agricultural industry, which indicates that the development of agricultural mechanization has a certain impact on the efficiency of food production. Thus, technological innovation in climate agricultural practices and small-scale farming could be more beneficial to fulfilling the future food demand.
1. Introduction
The issues related to agriculture, rural areas, and farmers are among the significant challenges in the process of a country’s rapid economic development [1,2,3,4,5]. Developing agriculture, the rural economy, boosting farmers’ income, expanding farmers’ employment channels, and enhancing farmers’ overall quality have emerged as critical to limiting issues related to agriculture, rural areas, and farmers [6]. To fundamentally solve the problems of rural areas and farmers, we must rely on agricultural mechanization [7]; change the traditional production method in agriculture, which mainly relies on manual labor; change the underdeveloped state whereby the agricultural population accounts for a large proportion; and realize the transformation from traditional agriculture to modern agriculture, from extensive management to intensive management, and from over-utilization of resources to sustainable utilization.
Agricultural mechanization is very important for agricultural science and technology in the agricultural field. Without agricultural mechanization, many advanced technologies that improve agricultural grain production capacity, save costs, increase efficiency, and protect the environment cannot be realized. Agricultural mechanization has replaced manual labor and has become an indispensable and important input factor in food production. Its role in stabilizing food production and increasing food output is becoming more and more obvious [8,9,10]. The contribution of agricultural mechanization to the growth of grain production in the context of labor loss has been unanimously recognized by the academic community. Verma, 2006 found a similar scenario whereby farm mechanization helps to increase crop intensity and enhance income [11]. In Benin (2015), it was documented that agricultural mechanization reduces unit labor input, increases productivity, and reduces labor hours, thereby increasing output [12]. The authors in Yamauchi (2016) found that to cope with the problem of rising labor costs in Indonesia, most farmers in Indonesia will expand the scale of planting and choose to replace manual labor with machinery, so large farms have more advantages than small farms [13]. In Gollin et al., (2014), the authors studied the grain production efficiency of eighty countries and showed that the difference in production efficiency is mainly caused by agricultural mechanization [14]. The study Camarena et al., (2004) took five large farms growing wheat and sorghum in Mexico as examples to study the impact of the number of working days required for tractors and implements and the values that change over time on machinery costs [15]. They found that increasing the use density of agricultural machinery can maximize the value of agricultural production. The authors of Po-Chi et al., (2008) used panel data from twenty-nine provinces in China and applied the maximum likelihood estimation method to analyze the main factors and their components that affected the improvement in agricultural total factor productivity and found that the government’s agricultural tax cuts, research and development, public investment in infrastructure, mechanization, and other aspects have provided great assistance to the progress of agricultural technology [16]. Likewise, previous studies [7,17] found that China’s agricultural mechanization level continues to improve. The total power of China’s agricultural machinery has grown from 117.496 million kilowatts to 1027.583 million kilowatts from 1990 to 2018 [18]. On the other hand, the continuous improvement in the level of agricultural mechanization has made up for the adverse impact of agricultural labor shortage on grain production. From 1978 to 2019, China’s grain output still increased by 1.17 times despite the substantial reduction in agricultural labor workforce [19,20]. In grain production, agricultural machinery provides power to improve grain production efficiency, thereby stabilizing grain production and increasing grain output [21]. Previous researchers Liu et al., (2014) and Tian et al., (2020) documented that agricultural mechanization is an important measure to improve comprehensive agricultural production capacity and achieve increases in grain output [22,23]. Even though agricultural mechanization has made great progress, there is still a gap among the requirements for taking the lead in achieving agricultural modernization. To improve the management decision-making level, there are still some outstanding issues in the field of agricultural mechanization management that need to be solved, such as how to evaluate the development level of agricultural mechanization scientifically and comprehensively to accurately grasp the development status and achievements of the agricultural mechanization level, providing a scientific basis for guiding development in different regions. Furthermore, there are environmental factors that are affecting the development of agricultural mechanization, so it is necessary to determine how to integrate the environment with the development of agricultural mechanization to promote the coordinated development of agricultural mechanization and the environment. The solution to these problems is related to understanding agricultural modernization and the new development levels. The existing literature research studies on agricultural mechanization have a certain scope and depth. However, there are great differences due to changes in the practice of agricultural mechanization development in various regions. Regional research on agricultural mechanization is mostly general countermeasure research. There are more qualitative analyses and fewer quantitative analyses. Moreover, few documents directly study the relationship between the development of agricultural mechanization and the grain output and sown area. Therefore, it is important to study the development of agricultural mechanization and its impact on grain production.
Northeastern China is a major agricultural grain base in China (Figure 1). It is the largest main grain production area. Its grain output accounts for on-fifth of China’s total output [24]. The total population is 98.51 million, and the total land area is 791,826 km2, accounting for 8.25% of the country’s total land area. The cultivated land is 35.87 × 10⁶ hectares [25]. The major cultivated area is concentrated in Heilongjiang Province and is about 78.3% of the province’s cultivated land. The cultivated land in the region is flat, which is suitable for mechanized farming. Northeastern China has excellent conditions for realizing agricultural mechanization. The development of agricultural mechanization has made important contributions to ensuring national food security and improving comprehensive grain production capacity. Therefore, it is important to conduct a systematic analysis of the recent development of agricultural mechanization and its effect on grain production in the region. The specific objective of the current study is to examine the development of agricultural mechanization by using bibliometric analysis and establish a panel data model to determine the effects of agricultural machinery and other variables, such as fertilizer, labor, and effective sown area, on grain output in the region. Furthermore, in this study, we only consider crop production, in particular grain production, and do not evaluate or study livestock production.
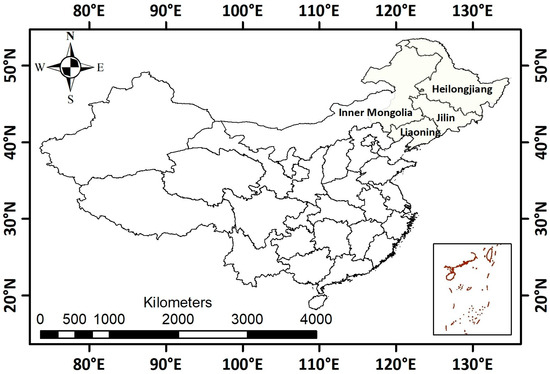
Figure 1.
Location map of the study area including other features. Four northern providers (Heilongjiang, Jilin, Liaoning, and Inner Mongolia) were considered to study the development of agricultural modernization and its effect on crop production.
2. Material and Methods
2.1. Datasets
In this study, the China Agricultural Statistical Yearbook, China Statistics Yearbook, and Agricultural Professional Knowledge Service System (https://www.pwsannong.com/booklib/database?SiteID=123) (accessed on 15 December 2023) were consulted to obtain the data. The most recent year’s statistical indicator data were not freely available; thus, we used 21 years of data from 2000 to 2020 for this analysis. Furthermore, we used provincial panel data to study the effect of agricultural mechanization on grain production. To examine the recent developments in agricultural mechanization, the dataset was concentrated between 2000 and 2017 due to non-availability. The specific definitions of the main variables are mentioned in Section 3.3.1. In addition, the Scopus database was searched to study the scientific research progress in the field of agricultural mechanization. For this purpose, different keywords under TITLE-ABS-KEY were examined in the database, such as agricultural mechanization, sustainable agriculture, farm machinery, mechanized farming, precision agriculture, agricultural automation, sustainable development goals (SDGs), and agricultural economy from 1990 to 2023.
2.2. Methods
2.2.1. Agricultural Mechanization Level Evaluation Indicators
The core of evaluating the development level of agricultural mechanization is to conduct a scientific and reasonable evaluation of the degree of agricultural mechanization operations. The setting of the indicator system should be based on actual needs and be reliable according to the requirements of agricultural modernization. This study established an evaluation index system to examine the development level of agricultural mechanization based on agricultural machinery operations and objectively determined the actual roles of agricultural mechanization and agricultural machinery personnel in grain production and rural development. Below are the evaluation indicators used to assess the level of agricultural mechanization in the study area.
2.2.2. Scientific Research Progress in Agricultural Mechanization
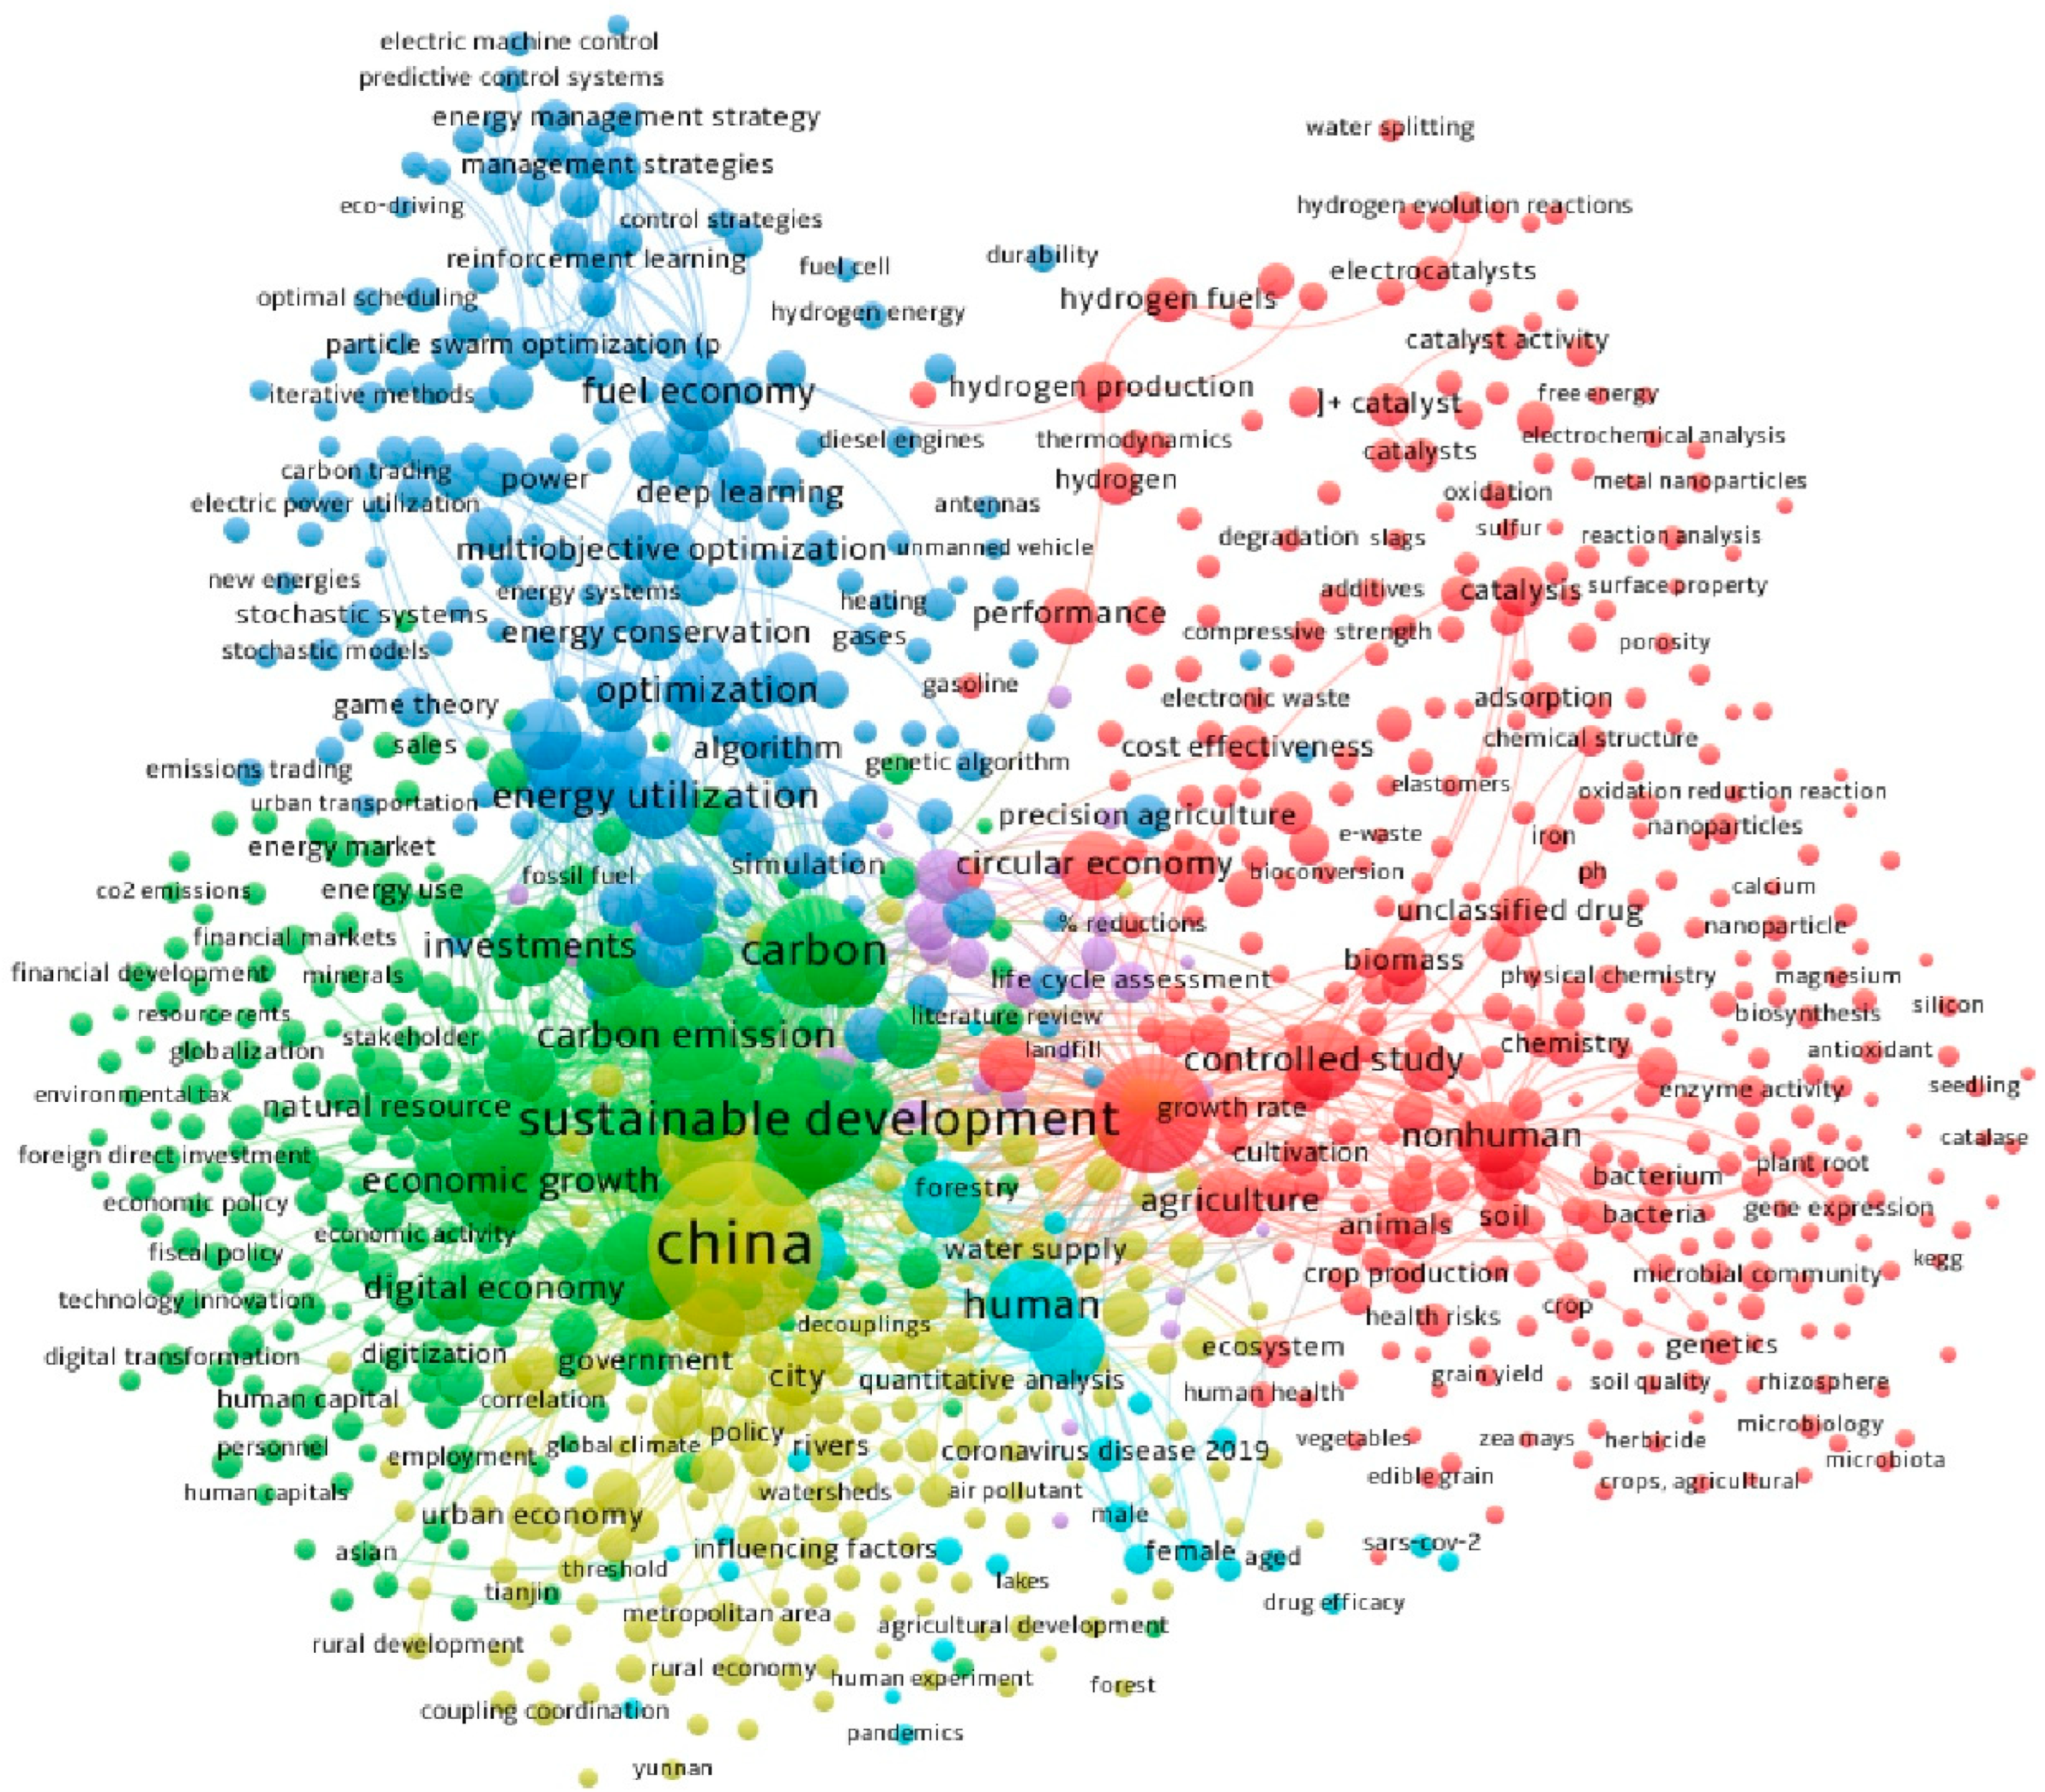
VOSviewer vs 1.6.20 [26] was used to assess and visualize the knowledge background and research progress in agricultural mechanization. This software program creates visual bibliometric knowledge maps based on Scopus extracted data, in addition to providing text mining capabilities [27]. High-frequency-keyword co-occurrence cluster visualization analysis was carried out with VOSviewer. A threshold of 10 occurrences was used to identify high-frequency keywords. Each circular node in the keyword co-occurrence clustering graph represents a keyword, and the size of the node indicates how frequently it occurs. Co-occurrence associations between two terms are shown by lines, where the strength of the link is indicated by the line’s length and thickness. The cluster that a keyword belongs to is indicated by the node color.
2.3. Statistical Analysis
Prior to performing regression, we used the unit root test Levin et al., (2002) to determine whether the variables were stationary in the long run by using the panel data autoregressive distributed lag pool mean group technique [28]. This allowed us to determine whether the variables were either first-order or stationary in level. In addition, to avoid endogeneity between the variables, the two-stage least square method was also employed.
Basic Model for Effect Assessment
As an important statistical model, linear mixed models have been widely used in data analysis in agriculture, and economics [29]. The model contains both fixed effects and random effects. So why is a linear mixed model needed? Because some realistic complex data cannot be processed by traditional linear models. These data contain both random noise caused by individual repeated experiments and random effects caused by individual differences. These random factors cannot be processed. They are observed but cannot be ignored. Therefore, a linear mixed model is needed to predict and regress this type of data, which contain both fixed effects and random effects. This study also examines the impact of agricultural mechanization on grain production in northeastern China. It involves both fixed influencing factors such as agricultural mechanization and random influencing factors of region and time, so choosing a linear mixed model can better explain the actual situation. The basic form of the model is as follows:
In Equation (1), represents different provinces of northeastern China, Y is a dependent variable which represents the proportion of specific crop production (in 10,000 tons), and v is the fixed effect independent variable. The fixed effect independent variables include the core independent variable of large and small agricultural machinery (No.), as well as agricultural labor force, reflected by the size of the rural population. Rural labor flow data at the provincial level are difficult to obtain, and the increase or decrease in the size of the rural population can reflect the flow of rural labor to a certain extent. The size of the rural population indicates the transfer of rural labor force, which is calculated as the data of rural permanent population/(1 + natural population growth rate) at the end of the year to measure rural labor transfer. Moreover, there are other variables, like fertilizer (10,000 tons), effective area (hectares), and irrigation rate (%). Z represents the random effect variable, specifically representing the province and year, and represents the random error term. In addition, stochastic frontier analysis (SFA) was used to measure technical efficiency in grain production. In the actual estimation process, a more flexible translogarithmic production function was selected, and time trend variables were used to reflect the impact of institutional changes and technological progress. Different from the Cobb–Douglas production function, the transcendental logarithmic production function obeys a normal-truncated normal distribution, which can better fit the data and reflect the interaction of the explanatory variables on the explained variables. The specific form is as follows:
where represents the province and t is a time variant. are random error terms.
Technical efficiency in grain production is affected by a variety of exogenous factors. By referring to the relevant literature, we selected the irrigation rate when constructing the influencing factors of the technical efficiency equation. The specific efficiency loss model is as follows:
3. Results and Discussion
3.1. Evaluation of Development Level of Agricultural Mechanization in Northeastern China
The established indicator system and calculation methods for each indicator were compiled by consulting the relevant literature (China Statistical Yearbook 2018; China Agricultural Mechanization Information Network, 2023 (www.pwsannong.com) (accessed on 15 December 2023)). The results show that the development level of agricultural mechanization in northeastern China shows stable growth. The evaluation value of the indicator for the development level of agricultural mechanization shows that the level of agricultural mechanization operation in Heilongjiang Province is relatively high compared with other provinces, with a fast growth rate. The level of agricultural mechanization operation (I4 and I5) is the highest among the three primary indicators, indicating that Heilongjiang Province has achieved certain goals in replacing human labor with agricultural mechanization, which is the core part of the development of agricultural mechanization (Table 1). The development of agricultural mechanization from 2000 to 2006 was very slow. The main reason is that agricultural machinery research and manufacturing technology cannot keep up, and some operational processes do not have corresponding and reasonable machinery, such as rice live broadcast machines, corn harvesters, potato harvesters, water-saving irrigation machinery, etc., resulting in a low degree of mechanization. From 2007 onward, the level of mechanization showed an upward trend, especially in small-sized machinery in Jilin and Heilongjiang Provinces. A previous study conducted a detailed review of small-scale agricultural mechanization and documented that China began its broad mechanized development of agricultural productivity in 2015. This suggests that China’s mechanization had progressed to the point where it was pushing the entire farming operation forward. The Chinese government accelerated the adoption of the household responsibility system in 1995, allowing agricultural machinery private firms to enter the agricultural machinery industry. As a result, the amount of mechanization expanded considerably between 2004 and 2013. In 2004, the establishment of agricultural mechanization regulations and the agricultural machinery purchase subsidy policy were two important driving reasons for this rapid increase [30].

Table 1.
Evaluation index values from 2000 to 2017.
3.2. Scientific Research Progress in Field of Agricultural Mechanization
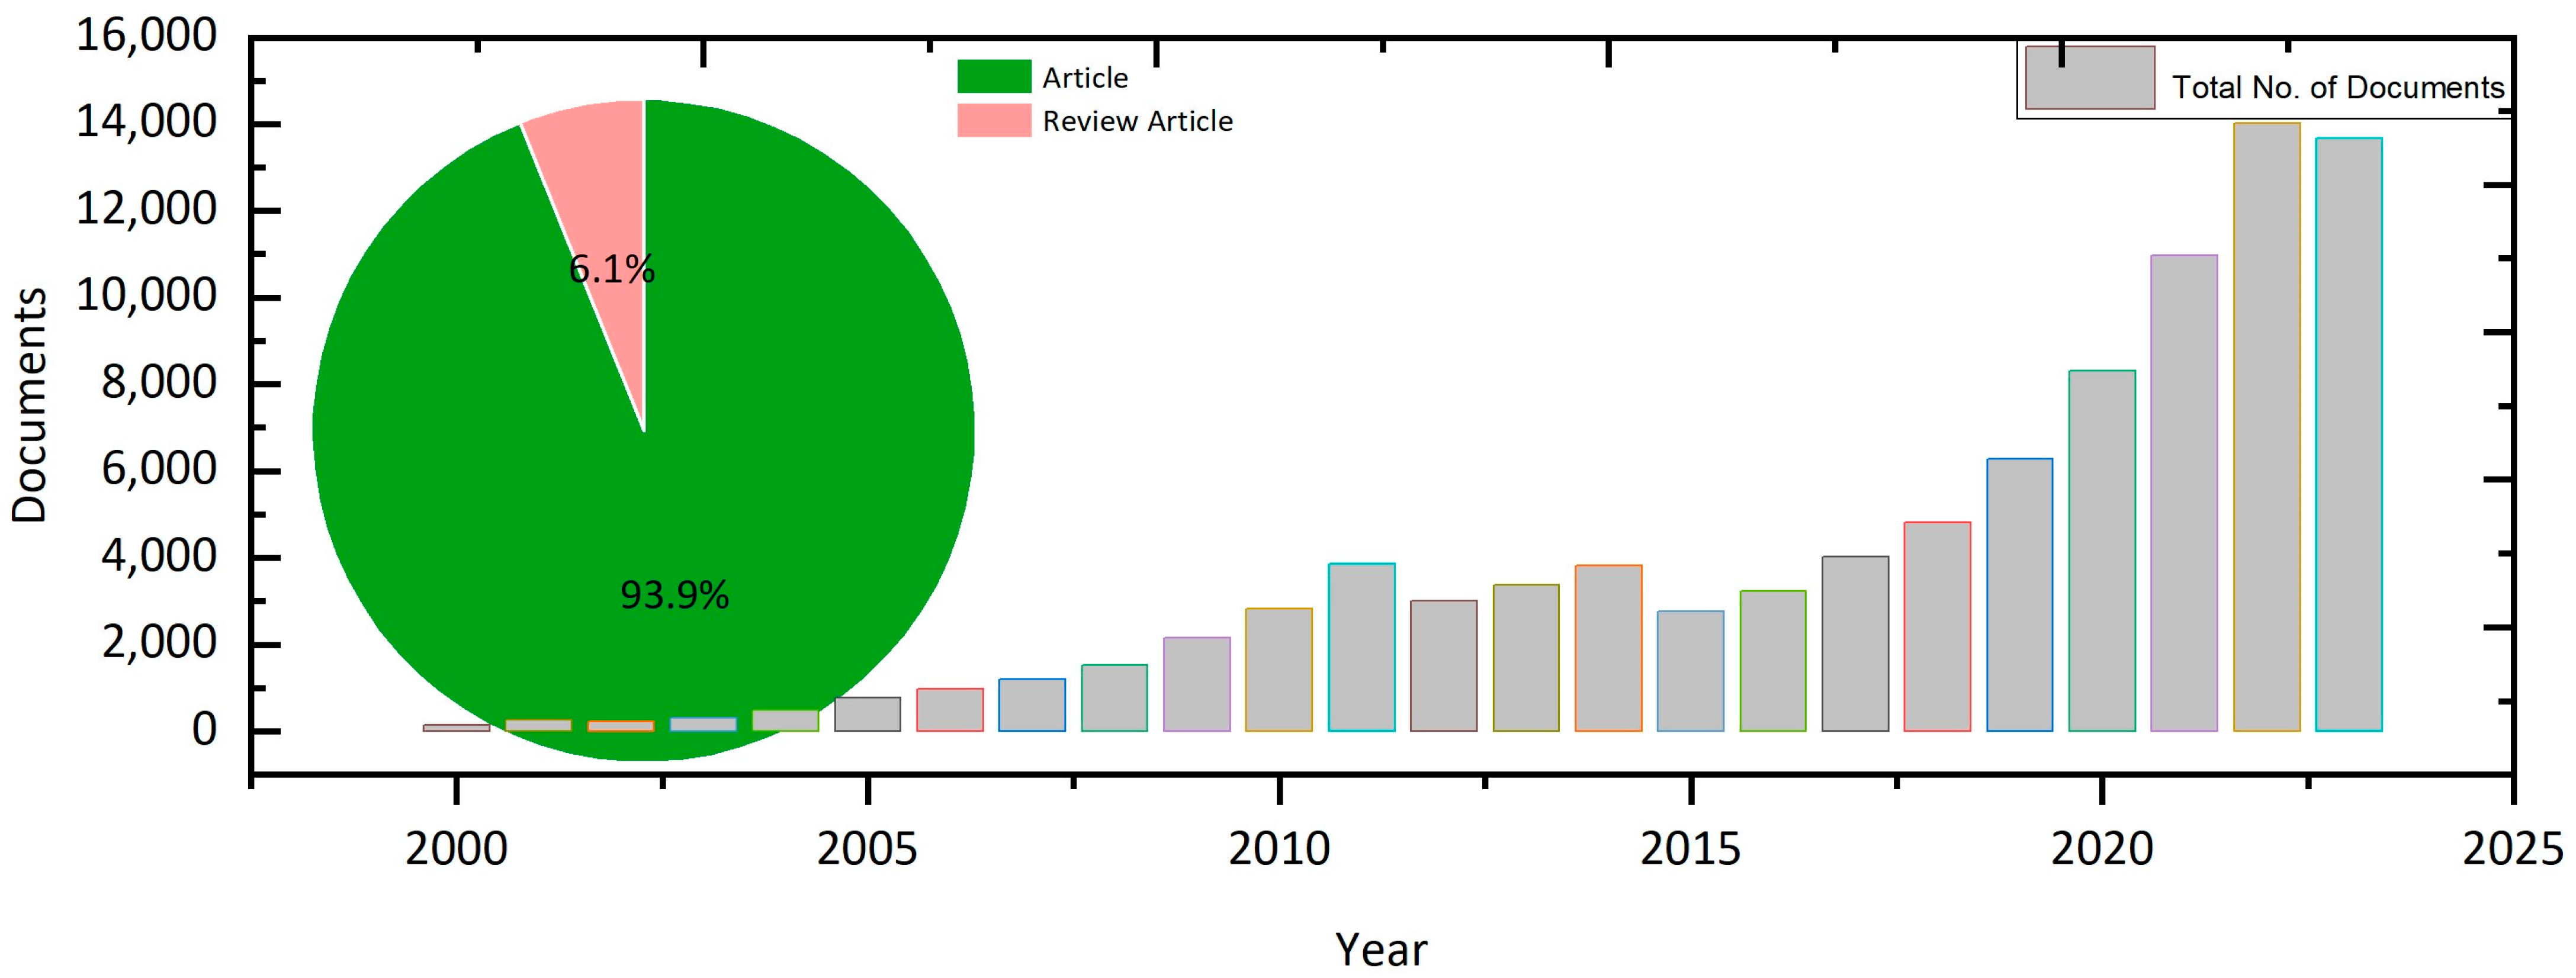
According to the Scopus database, 93385 papers were published under the searched keywords (agricultural mechanization, sustainable agriculture, farm machinery, mechanized farming, precision agriculture, agricultural automation, sustainable development goals, and agricultural economy) from 2022 to 2023 (Figure 2). The database was searched for overall China mainland due to Scopus database limitations on data extraction. The extracted data indicated that most of the published documents were research articles (93.9%). From 2000 to 2014, the number of published articles was 24881, while in the last 10 years, the number exceeded 65,734, with a growth rate of 4.39%. The recent increment in agricultural mechanization research is mostly due to an increased emphasis on studies linked to energy efficiency and lower carbon emissions. Figure 3 presents keyword co-occurrence and associations. It was observed that sustainable development, economics, green economy, emission control, energy efficiency, and sustainable agriculture were the main concerns for researchers from 2000 to 2023. These topics were mainly studied to solve problems related to carbon emissions, green energy, and environmental protection by using different models and methodologies, like life cycle assessment, carbon footprint calculation, and trade-off between environmental benefits and economic costs. During the analysis, it was also found that sustainable development had the highest occurrence (491) and was linked with economies (729 links), with a total association strength of 3725, and to study these links, life cycle assessment (444 links) was employed. Many publications discussed the topic of agricultural robots in the field of agricultural mechanization as of 2019. This was a development of research and tactics that began in 2002 to address the topic of digital agriculture [31]. Several years of study and technological integration have allowed the solutions to mature, which are now being evaluated and enhanced in real-world scenarios [32,33]. The studies published in 2020 and 2019, with almost 485 [34] and 336 citations [35], focused on deep learning in precision farming, which indicates that now, researchers in China mostly focus on automation and robotics. Since 2016, academic and research institutes have been promoting artificial intelligence and automation for more advanced technology in agricultural mechanization [30].
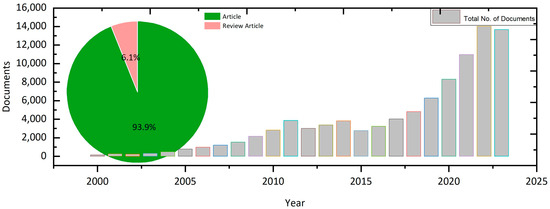
Figure 2.
No. of documents and their types published from 2000 to 2023.
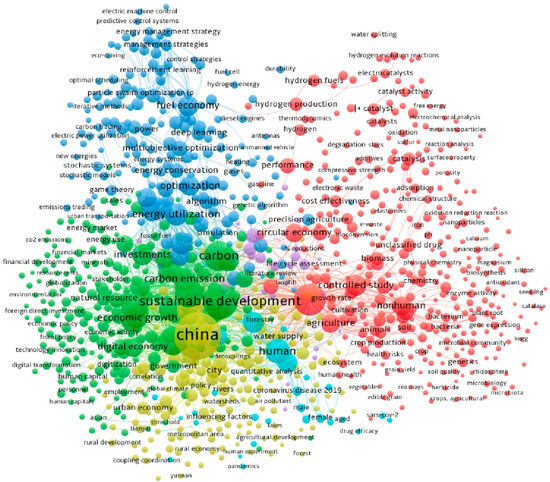
Figure 3.
Keyword occurrence and associations from 2000 to 2023. The Scopus database was used to generate this figure by using VOSviewer software. Cluster colors and keywords in the same shade show publishing occurrence.
3.3. Statistical Analysis of Agricultural Mechanization Effect on Crop Production
3.3.1. Stationarity and Long-Run Cointegration of Variables
The unit root test was conducted before performing regression for dependent and independent variables and found that variables were stationary in first- and second-level differences. The output of total grain (including wheat, maize, and rice) (OG), farm machinery (large and small), irrigation, and the effective area were stationary in the first difference, while the rest of the variables were stationary in the second difference (Table 2). Therefore, the panel data autoregressive model (ARDL) was selected for establishing a long-run relationship among the variables.
Table 2.
Stationarity of data using unit root test.
The panel ARDL model was utilized to examine the long-term cointegration among the variables. The dependent variable is the total amount of grain produced per hectare. The explanatory factors of the study include effective area, farm machinery (small and large) (a proxy for mechanization), irrigation percentage, fertilizer kilogram per hectare, and labor force in millions. All explanatory variables were regressed on the dependent output of total grain per acre. The findings show that labor force (−30.857), irrigation (−1.242), and effective area (−0.637) all had a negative but non-significant relationship with total grain output per hectare. This demonstrates that every 1% increase in these variables may result in a 1% decrease in average crop output. This indicates a low return on cultivated land per capita. However, in the region, fertilizer kilogram per hectare (9.808) and large farm machinery (0.003) showed a favorable link with total grain. Because all these variables are indicators related to technological improvement, the natural return has declined (Table 3).
Table 3.
Long-run cointegration among variables (dependent variable: OG).
3.3.2. Estimation of Effect of Agricultural Mechanization with Different Models
In the estimation results of the stochastic frontier models, the coefficients of the linear terms of effective area, fertilizer, and large agricultural machinery are significantly positive, indicating that the expansion of the effective area and the improvement in agricultural mechanization contributed to the improvement in technical efficiency in grain production. At the same time, the coefficients of labor force in Model 2 and Model 4 are significantly negative, which shows that in the long run, as the grain effective area continues to expand and agricultural machinery continues to increase, there will be a negative effect on technical efficiency in grain production. The coefficients of agricultural chemical fertilizer application amount in all models are significantly positive, indicating that the rational application of chemical fertilizers can promote the improvement in technical efficiency in grain production, while the excessive application of chemical fertilizers is not conducive to improving technical efficiency in grain production. Judging from the parameters of the technical efficiency equation, the coefficient of irrigation is significantly positive, indicating that better irrigation conditions can reduce the technical loss rate, that is, improve food production technology efficiency. This also confirms this research study, that is, the development of agricultural mechanization has a certain impact on technical efficiency in food production, paving the way for the following discussion on how the development of agricultural mechanization can improve efficiency in food production. At the same time, we can also see that the coefficient of small agricultural machinery indicates that the greater the total number of agricultural machines, the greater the impact they have on food production, but this will also bring negative impacts, such as idle agricultural machinery and waste of resources. To test the suitability of the model settings, this study constructed three optional models for testing, as shown in Table 4. Model 4 verifies an inefficiency term in the stochastic frontier model.
Table 4.
Estimation results of different models.
4. Conclusions
This study attempted to assess the degree of mechanized progress and its impact on grain output by using a panel dataset spanning the years 2000 to 2021 in northeastern China. The results indicate that the development level of agricultural mechanization in the region shows stable growth. The evaluation value of the indicator shows that the level of agricultural mechanization operation in Heilongjiang Province is relatively high compared with other provinces, with a fast growth rate. Scientific research progress in the field of agricultural mechanization shows that researchers are mainly studying to solve problems related to carbon emissions, green energy, and environmental protection. We also estimated the results with different statistical models to examine the effect of agricultural mechanization on grain production efficiency. The results show that variables such as fertilizers, irrigation, and machinery are examples of agricultural inputs that have a positive impact on the agricultural industry, which indicates that the development of agricultural mechanization has a certain impact on efficiency in food production.
Based on the study’s findings, the key to accelerating the growth of mechanization in agriculture is having a suitable mechanization theory. The decision to deploy agricultural machinery could be influenced by machines that are appropriate for the local environment, including soil characteristics, crop type, and cost effectiveness for farmers. Additionally, machines with reduced emission rates could also be considered. In addition, the land–labor–machine nexus must be included in new plans or programs promoting mechanization development because the size of farms and the availability of labor are crucial for this process. Furthermore, there is also a need for innovative climate-smart agricultural techniques that stem from the uneven strain on the population in rural and urban areas, related food demands, and the phenomenon of climate change.
Author Contributions
Conceptualization, V.H.T.T. and W.Z.; methodology, V.H.T.T. and W.Z.; software, V.H.T.T.; validation, W.Z.; formal analysis, V.H.T.T.; investigation, V.H.T.T.; resources, W.Z.; data curation V.H.T.T. and W.Z.; writing—original draft preparation, V.H.T.T.; writing—review and editing, V.H.T.T. and W.Z.; visualization, V.H.T.T. and W.Z.; supervision, W.Z.; project administration, W.Z.; funding acquisition, V.H.T.T. All authors have read and agreed to the published version of the manuscript.
Funding
Heilongjiang Provincial Research Project (88658700). The current research study is a part of “Economic Benefit Analysis of Agricultural Mechanization on Grain Production in Northeast China”.
Institutional Review Board Statement
Not applicable.
Informed Consent Statement
Not applicable.
Data Availability Statement
The data is available at China Agricultural Statistical Yearbooks, China Statistics Yearbooks, and Agricultural Professional Knowledge Service System (https://www.pwsannong.com/booklib/database?SiteID=123, accessed on 15 December 2023).
Conflicts of Interest
The authors declare no conflicts of interest.
References
- Emami, M.; Almassi, M.; Bakhoda, H.; Kalantari, I. Agricultural mechanization, a key to food security in developing countries: Strategy formulating for Iran. Agric. Food Secur. 2018, 7, 24. [Google Scholar] [CrossRef]
- Shen, Z.; Wang, S.; Boussemart, J.-P.; Hao, Y. Digital transition and green growth in Chinese agriculture. Technol. Forecast. Soc. Change 2022, 181, 121742. [Google Scholar] [CrossRef]
- Shi, J.; Yang, X. Sustainable development levels and influence factors in rural China based on rural revitalization strategy. Sustainability 2022, 14, 8908. [Google Scholar] [CrossRef]
- Wang, G.; Shi, R.; Mi, L.; Hu, J. Agricultural eco-efficiency: Challenges and progress. Sustainability 2022, 14, 1051. [Google Scholar] [CrossRef]
- Yaqoob, N.; Ali, S.A.; Kannaiah, D.; Khan, N.; Shabbir, M.S.; Bilal, K.; Tabash, M.I. The effects of Agriculture Productivity, Land Intensification, on Sustainable Economic Growth: A panel analysis from Bangladesh, India, and Pakistan Economies. Environ. Sci. Pollut. Res. 2022, 30, 116440–116448. [Google Scholar] [CrossRef] [PubMed]
- Dethier, J.-J.; Effenberger, A. Agriculture and development: A brief review of the literature. Econ. Syst. 2012, 36, 175–205. [Google Scholar] [CrossRef]
- Luo, X.; Liao, J.; Zang, Y.; Zhou, Z. Improving agricultural mechanization level to promote agricultural sustainable development. Trans. Chin. Soc. Agric. Eng. 2016, 32, 1–11. [Google Scholar]
- Benke, K.; Tomkins, B. Future food-production systems: Vertical farming and controlled-environment agriculture. Sustain. Sci. Pract. Policy 2017, 13, 13–26. [Google Scholar] [CrossRef]
- Chui, M.; Manyika, J.; Miremadi, M. Where Machines Could Replace Humans-and Where They Can’t (Yet); McKinsey: Chicago, IL, USA, 2016. [Google Scholar]
- Takeshima, H.; Hatzenbuehler, P.L.; Edeh, H.O. Effects of agricultural mechanization on economies of scope in crop production in Nigeria. Agric. Syst. 2020, 177, 102691. [Google Scholar] [CrossRef]
- Verma, S.R. Impact of agricultural mechanization on production, productivity, cropping intensity income generation and employment of labour. Status Farm Mech. India 2006, 2006, 133–153. [Google Scholar]
- Benin, S. Impact of Ghana’s agricultural mechanization services center program. Agric. Econ. 2015, 46, 103–117. [Google Scholar] [CrossRef]
- Yamauchi, F. Rising real wages, mechanization and growing advantage of large farms: Evidence from Indonesia. Food Policy 2016, 58, 62–69. [Google Scholar] [CrossRef]
- Gollin, D.; Lagakos, D.; Waugh, M.E. Agricultural productivity differences across countries. Am. Econ. Rev. 2014, 104, 165–170. [Google Scholar] [CrossRef]
- Camarena, E.; Gracia, C.; Sixto, J.C. A mixed integer linear programming machinery selection model for multifarm systems. Biosyst. Eng. 2004, 87, 145–154. [Google Scholar] [CrossRef]
- Po-Chi, C.; Ming-Miin, Y.; Chang, C.-C.; Shih-Hsun, H. Total factor productivity growth in China’s agricultural sector. China Econ. Rev. 2008, 19, 580–593. [Google Scholar]
- Zhang, X.; Yang, J.; Thomas, R. Mechanization outsourcing clusters and division of labor in Chinese agriculture. China Econ. Rev. 2017, 43, 184–195. [Google Scholar] [CrossRef]
- Li, H.; Luo, L.; Zhang, X.; Zhang, J. Dynamic change of agricultural energy efficiency and its influencing factors in China. Chin. J. Popul. Resour. Environ. 2021, 19, 311–320. [Google Scholar] [CrossRef]
- Shuqi, S.; Wang, J.; Wang, D. Development of Agricultural Mechanization in China and Its Current Strategic Focus. Agric. Mach. Technol. 2019, 13, 4–7. [Google Scholar] [CrossRef]
- National Bureau of Statistics of China. China Statistical Yearbook; National Bureau of Statistics of China: Beijing, China, 2020. [Google Scholar]
- Gong, B. Agricultural reforms and production in China: Changes in provincial production function and productivity in 1978–2015. J. Dev. Econ. 2018, 132, 18–31. [Google Scholar] [CrossRef]
- Liu, Y.; Hu, W.; Jetté-Nantel, S.; Tian, Z. The influence of labor price change on agricultural machinery usage in Chinese agriculture. Can. J. Agric. Econ. Rev. Can. D’agroeconomie 2014, 62, 219–243. [Google Scholar] [CrossRef]
- Tian, X.; Yi, F.; Yu, X. Rising cost of labor and transformations in grain production in China. China Agric. Econ. Rev. 2020, 12, 158–172. [Google Scholar] [CrossRef]
- Wei, H.; Meng, T.; Ge, J.; Zhang, X.; Shi, T.; Ding, E.; Lu, Y.; Li, X.; Tao, Y.; Chen, Y. Reduced nitrogen application rate with dense planting improves rice grain yield and nitrogen use efficiency: A case study in east China. Crop J. 2021, 9, 954–961. [Google Scholar] [CrossRef]
- Wang, L.; Faye, B.; Li, Q.; Li, Y. A Spatio-Temporal Analysis of the Ecological Compensation for Cultivated Land in Northeast China. Land 2023, 12, 2179. [Google Scholar] [CrossRef]
- Van Eck, N.; Waltman, L. Software survey: VOSviewer, a computer program for bibliometric mapping. Scientometrics 2010, 84, 523–538. [Google Scholar] [CrossRef] [PubMed]
- Sherif, M.; Abrar, M.; Baig, F.; Kabeer, S. Gulf Cooperation Council countries’ water and climate research to strengthen UN’s SDGs 6 and 13. Heliyon 2023, 9, e14584. [Google Scholar] [CrossRef] [PubMed]
- Levin, A.; Lin, C.-F.; Chu, C.-S.J. Unit root tests in panel data: Asymptotic and finite-sample properties. J. Econom. 2002, 108, 1–24. [Google Scholar] [CrossRef]
- Gbur, E.; Stroup, W.; McCarter, K.; Durham, S.; Young., L.; Christman, M.; West, M.; Kramer, M. Analysis of Generalized Linear Mixed Models in the Agricultural and Natural Resources Sciences; John Wiley & Sons: Hoboken, NJ, USA, 2020. [Google Scholar]
- Liao, W.; Zeng, F.; Chanieabate, M. Mechanization of small-scale agriculture in China: Lessons for enhancing smallholder access to agricultural machinery. Sustainability 2022, 14, 7964. [Google Scholar] [CrossRef]
- Tang, S.; Zhu, Q.; Zhou, X.; Liu, S.; Wu, M. A conception of digital agriculture. In Proceedings of the IEEE International Geoscience and Remote Sensing Symposium, Toronto, ON, Canada, 24–28 June 2002; pp. 3026–3028. [Google Scholar]
- Mühl, D.D.; de Oliveira, L. A bibliometric and thematic approach to agriculture 4.0. Heliyon 2022, 8, e09369. [Google Scholar] [CrossRef]
- Unold, O.; Nikodem, M.; Piasecki, M.; Szyc, K.; Maciejewski, H.; Bawiec, M.; Dobrowolski, P.; Zdunek, M. IoT-based cow health monitoring system. In International Conference on Computational Science; Springer: Berlin/Heidelberg, Germany, 2020; pp. 344–356. [Google Scholar]
- Liu, Y.; Ma, X.; Shu, L.; Hancke, G.P.; Abu-Mahfouz, A.M. From Industry 4.0 to Agriculture 4.0: Current status, enabling technologies, and research challenges. IEEE Trans. Ind. Inform. 2020, 17, 4322–4334. [Google Scholar] [CrossRef]
- Zheng, Y.-Y.; Kong, J.-L.; Jin, X.-B.; Wang, X.-Y.; Su, T.-L.; Zuo, M. CropDeep: The crop vision dataset for deep-learning-based classification and detection in precision agriculture. Sensors 2019, 19, 1058. [Google Scholar] [CrossRef]

Disclaimer/Publisher’s Note: The statements, opinions and data contained in all publications are solely those of the individual author(s) and contributor(s) and not of MDPI and/or the editor(s). MDPI and/or the editor(s) disclaim responsibility for any injury to people or property resulting from any ideas, methods, instructions or products referred to in the content. |
© 2024 by the authors. Licensee MDPI, Basel, Switzerland. This article is an open access article distributed under the terms and conditions of the Creative Commons Attribution (CC BY) license (https://creativecommons.org/licenses/by/4.0/).