Abstract
This study investigates the use of biometric technology in public transit to improve trip safety and effectiveness. The incorporation of biometric technology into transit networks improves efficiency and security but also poses substantial challenges of privacy, standardisation, and public acceptability. Conducted via a poll of 25 specialists in Lithuania, the objective was to assess the level of acceptability and practicality of using biometric identification for both drivers and passengers. The results suggest a divided view about the specific demographic that biometric applications should target. However, there is agreement on the considerable potential of these technologies to enhance transportation safety. Face recognition has been the favoured approach due to its non-intrusive nature and simplicity of integration. The statistical research demonstrated significant positive correlations between different biometric approaches, indicating that a multimodal strategy is effective for providing full security coverage. The research highlights the significance of resolving privacy issues, emphasising that public acceptability depends on the open management and strong safeguarding of biometric data. The findings support the deliberate use of biometric technologies in sustainable public transportation, emphasising their ability to improve safety, optimise operations, and even revolutionise the passenger experience. This emphasises the equitable examination of technology, security, and privacy in the progress of sustainable public transportation systems. Biometric technology in public transport, especially for monitoring driver health and ensuring passenger safety, is supported by experts as a means to enhance service quality, reduce accidents, and optimize route planning.
1. Introduction
Ensuring passenger safety is of utmost importance for their decision making and trust, although it is often disregarded while providing information. The variability in the quality, quantity, and scope of services may lead to misunderstandings and incomplete provision of sustainable services. The implementation of information assurance is incomplete, and social media enables the exchange of information, but also presents challenges related to trust, origin, excessive information, and expectation management [1].
Biometric data, obtained from physical and behavioural traits such as fingerprints, facial features, and walking style, has greatly transformed the way identification is managed. Nevertheless, apprehensions over privacy and the improper use of biometric data persist. To tackle these problems, it is necessary to use privacy-enhancing technology and establish government rules [2].
Biometric and genetic information processing technologies play a crucial role in identifying individuals and items in sustainable transportation. Adopting these technologies necessitates the establishment of legal structures and modifications to transport regulations [3]. Efficient mobility in the transport industry requires the establishment of digital profiles for individuals, which are based on a unified biometric system. Hence, it is essential to enhance and align the personal data regulations of each nation with the European and GDPR guidelines, as well as other pertinent legal instruments [4]. The distinct regulations of transport legislation should establish the entitlements, obligations, constraints, transaction regulations, information protection, and limitations. Automated decision-making systems in artificial intelligence need risk assessment, data security, compliance with local rules, and the implementation of independent monitoring methods [5].
Biometric technologies, including fingerprint recognition, iris recognition, face recognition, and hand geometry, are being investigated for their potential use in access control at transportation facilities and border crossings. These technologies aim to address challenges such as time-consuming manual procedures, human error, and privacy concerns [6].
The use of biometric technology in public transport can enhance safety and efficiency, with a study in Lithuania finding strong support for its application among drivers to monitor health and ensure secure travel. Experts agreed on the importance of biometric data for both drivers and passengers, prioritizing face recognition and pulse measurement for effective monitoring. This approach can improve transport service quality, reduce accidents, and optimize route planning, highlighting the potential for biometric systems to transform public transport safety and operations.
In the scientific domain, biometric technology assessment focuses on individual cases, but in passenger transportation, it is mostly researched in the aviation industry or as instances of ticket sales. Hence, the objective of this paper is to assess the use of biometric technologies in public transport for the goal of safeguarding passenger security.
2. Literature Review
Biometrics, a widely used electronic identification technique, offers benefits but also raises problems around identity theft and non-repudiation. Implementing transparent education programmes may enhance the level of air travel safety [7]. To address these issues, it is suggested to distinctly differentiate between the functions of authentication and non-repudiation. It is important to remember that identity management encompasses the integration of systems and the wider social and political implications of biometrics [8].
The proliferation of biometric technology in passenger transport is no longer only an obvious novelty, but is increasingly essential for streamlining passenger management and other operations [9]. Facial biometrics are revolutionising airports and passenger air travel by mitigating lengthy waits and overcrowding, particularly during pandemics. Facial biometrics are used at the M.R. Štefánik International Airport in Bratislava for many purposes, including luggage check-in, passport control, security control, boarding, and restricted areas. The high efficacy of face biometric identification implies a growing number of airports adopting this technology. Airlines, airports, and other stakeholders must take proactive steps to guarantee that the use of face recognition biometrics improves the efficiency and enjoyment of travel for passengers [10]. Kasim et al. (2021) [11] provide evidence to support the claim that face recognition is an essential technology at airports since it effectively decreases processing and waiting durations. Nevertheless, it is essential to resolve concerns around network connections and infrastructure. The check-in and check-out programme at Dublin Airport [11], as well as the face recognition boarding experiment, demonstrated a low percentage of biometric approvals. In order to enhance its performance, CBP (Customs and Border Protection) should collaborate with airline and airport partners to consistently enhance algorithms, establish procedures for enforcement, and formulate strategies for financing and manpower. Implementing transparent education programmes may enhance the level of air travel safety [12].
Automated biometric identification is a contemporary method for meeting air transport security standards. Nevertheless, it is improbable that a solitary solution will suffice to satisfy the requirements of both airport security and airline security. Biometric systems are susceptible to assaults; hence, they need standardisation and impartial evaluation by independent authorities. Critics contend that the use of biometric data is a subject of controversy, lacking widespread public acceptance and insufficiently governed by legal regulations. They contend that engaging with intimate bodily parts is morally wrong and infringes upon individuals’ right to privacy. Moreover, the acquisition of a biometric passport and engagement in air travel is a discretionary endeavour and not a compulsory directive from the government. When evaluating the idea of proportionality of biometric data in air transport, these reasons have significant importance [13].
An additional option to using biometric data is the implementation of a biometric bus ticket system, designed with the aim of enhancing the efficiency of the public bus system. The system employs facial pictures for passenger registration and does facial scans throughout the boarding process. Database records are used to verify the validity, and the ticket fees are then included in the monthly bills [14].
Additionally, several academics suggest implementing a system for electronic ticketing and access control in public transportation, which utilises face recognition for both payment processing and boarding permit verification. The authentication technique entails taking face photos and extracting characteristics by comparing the retrieved attributes with pre-stored features. The installation is performed on a computer running Windows 11 Home Edition version 22H2, using the Python programming language and the OpenCV libraries. The system ensures adherence to legal and constitutional standards by addressing ethical concerns, privacy problems, and data protection. The post-implementation solution eradicates waiting lines and the need for physical tickets, guaranteeing a smooth and uninterrupted biometric identification procedure [15].
Additionally, several studies propose a combination method for public transport ticketing that involves e-ticketing, cash, anonymous credentials, and proxy re-encryption. This method enhances security and enhances passenger privacy by enabling the use of passive RFID transponders and more powerful computer systems. The hybrid solution provides distinct security and privacy characteristics that are advantageous for both passive and active device users [16].
Potential instances of the use of biometric technology in other nations:
- The smart government programme of the UAE Government seeks to revamp public services with a specific emphasis on social and environmental factors. Biometric technologies provide promise across several industries, although their implementation in public transit is not carried out in a methodical manner. This paper presents a theoretical structure for the implementation of biometrics, optimising the process, and establishing a robust central government. Quantitative data gathering is used to assess customer satisfaction [17].
- A significant segment of India’s populace has difficulties in receiving food service deliveries due to outdated technologies that result in security breaches. Implementing biometric authentication and UID-based services has the potential to enhance efficiency and security, hence advancing the goal of achieving a “Digital India” in line with Vision 2020’s vision of a technologically advanced India [18].
Another instance where biometric technology is used is in driver licencing centres. The objective is to establish a robust biometric authentication system, emphasising the need for selecting an appropriate biometric approach to guarantee efficient and secure data safeguarding [19].
One example of this is the use of biometric driver identification in autonomous taxis, which employs artificial intelligence to provide rides without any human involvement [20].
Nevertheless, it is crucial to acknowledge that the biometric sensor plays a vital role in ensuring secure and easy identification, despite the considerable difficulty in monitoring it [21].
Hong Kong citizens favour fingerprints over biometrics because of the ease they provide [22].
The use of biometric technology is being investigated as a novel approach to assess the cognitive effort and perceived safety level of cyclists during the creation of urban transport infrastructure. The system employs biometrics to analyse the actions of cyclists on dynamic roadways, establishing new safety measurements that are rooted in cognitive effort. This technique addresses a deficiency in existing research by including user experience in security measures. This enables planners and engineers to design safer infrastructure that benefits all users [23].
Implementing biometric technology in public transit presents unique issues for both passengers and drivers.
Advantages for passengers. Biometric technologies may enforce passenger accountability, deter fee evasion, and streamline passenger distribution, therefore optimising travel routes and enhancing the overall quality of public transport services.
Face recognition was considered the most appropriate approach due to its efficacy in recognising and monitoring passenger movements and behaviours.
Advantages for drivers. Biometric technology in the context of drivers mainly aims to improve safety by monitoring driver health, avoiding instances of drowsiness or driving under the influence, and providing prompt medical intervention in the event of unforeseen health emergencies. Implementing this measure may greatly decrease the occurrence of traffic accidents and improve overall road safety.
This problem is also pertinent in relation to road users, particularly drivers.
Biometric systems are currently being implemented and used more frequently in air passenger transport. However, their effectiveness in public transport, particularly in ensuring safe passenger transport, has not been extensively studied from a scientific perspective. In this field, more emphasis is placed on the ticket system, payment methods, and passenger identification.
3. Methods and Methodology
Detecting fatigue in public transport drivers using biometrics is a difficulty, but it may be achieved using certain technology and methodologies. It is crucial to take into account the privacy and legal framework of the person and guarantee that such research is carried out in an ethical and lawful manner [24]. The following outlines the approach used in the driver tiredness study to explore potential biometric identification: facial recognition, iris scanning, electroencephalogram (EEG), heart rate monitoring, thermographic cameras, general data evaluations, data processing and interpretation, privacy, and legal regulation [25].
The practical half of the paper will assess some of these factors via expert review, as well as the use of correlation and Pearson’s coefficient computation procedures.
Expert surveys often use instruments drawn from the key informant approach, which is commonly believed to provide more valid insights compared to large-scale surveys [26,27].
The most important part of the study was carefully choosing a group of skilled professionals who specialise in the relevant topic. The experts’ evaluations were anticipated to vary, and these little discrepancies would enable the determination of the relevance of the criteria, which may be stated via average rankings or weights. The consensus of a panel of experts is always more precise than the viewpoint of an individual expert [25,28,29,30].
Choosing specialists proved to be an especially challenging endeavour. A total of 25 individuals were chosen based on the study criteria established via expert evaluation [31]. The study was carried out on a national level in Lithuania. The experts were selected persons who work directly in the passenger transport business in Lithuania and occupy leading positions or are high-ranking administrative employees who may have an impact on decision making. The experts were selected from the passenger transport companies in Lithuania that unite the members of the association. This association has more than 30 members, of which 25 (22 men and 3 women) agreed to participate in the expert evaluation of their own free will and of their own accord (due to the anonymity of the questionnaire). All experts have more than 25 years of experience. The physical age of the respondents is 50 years and above.
Following the expert examination, the correlation and Pearson’s coefficient were assessed using the approach outlined in the publications of the cited authors [30,32].
The need for correlation analysis in the context of expert evaluation is an important tool because it helps reveal relationships between various evaluation criteria and outcomes. Here are some reasons why it is necessary:
- Understanding Data. Correlation analysis helps to understand how one factor is related to another. This is particularly useful when determining which areas of expert evaluation are most closely linked and may reflect the impact of one area on another.
- Identifying Trends. The analysis can uncover trends and patterns in the expert evaluation data, allowing predictions of potential outcomes or identifying areas where further research or attention is needed.
- Hypothesis Testing. Experts may have certain hypotheses about how different evaluation aspects should be related. Correlation analysis provides a means to test these hypotheses using statistical data.
- Setting Priorities. A strong correlation between important criteria may indicate that certain interventions or changes in one area could have a significant impact on other areas. This can help set priorities for actions or investments.
- Supporting Decisions. Identifying strong correlations helps provide scientific evidence that can support or adjust strategic decisions related to the application of biometric technologies in public transport.
- Risk Management. Understanding correlations among potential risks and their consequences can help organizations better manage risk, plan more conservative measures, and respond effectively to potential issues.
While correlation analysis is valuable, it is crucial to understand that correlation does not imply causation. This means that even though two factors may be related, one does not necessarily cause the other. Therefore, conclusions drawn from correlation should be approached with caution and, if possible, supplemented with other types of analyses, such as regression analysis, which can help establish causative links.
The importance of calculating the Pearson correlation coefficient lies in its ability to assess and quantify the linear relationship between two variables. This coefficient ranges from −1 to +1, where −1 indicates a perfect negative correlation, +1 indicates a perfect positive correlation, and 0 indicates no linear correlation. The Pearson coefficient is useful in various contexts such as scientific research, business, engineering, health sciences, and social sciences because it helps to:
- Discover trends and relationships between data variables.
- Determine the strength and direction of the relationship between two variables.
- Make data-driven decisions.
- Understand and predict behaviours or phenomena.
Methodology for Calculating the Pearson Correlation Coefficient
Data Collection: Before calculating the correlation, data for the pair of variables to be compared must be collected.
Data Preparation: Check that the data are suitable for correlation analysis: The variables should be continuous and normally distributed. Also, remove outliers that could distort the results.
Evaluation of the Correlation: The calculated Pearson coefficient is evaluated based on how close it is to −1, 0, or +1 to determine the strength and direction of the correlation.
Statistical Significance: It is determined whether the correlation is statistically significant. Often a p-value test is used, which helps to ascertain whether the observed correlation coefficient is likely due to chance or is statistically reliable. Typically, if the p-value is less than 0.05, the correlation is considered statistically significant.
Interpretation and Practical Application: Finally, it is important to correctly interpret the obtained correlation coefficient and assess its practical significance for the research or decision-making process.
Calculating the Pearson correlation coefficient is a crucial step in data analysis, which aids in discovering and interpreting relationships between variables, but it should always be considered in context and alongside other potential interactions between variables.
The acquired findings allowed the identification of the most adaptable biometric technology approaches in the public transport industry.
4. Results and Discussion
Residents in every country are urged to use public transit as a means to decrease the quantity of private automobiles in urban areas, thereby lowering CO2 emissions and promoting sustainable mobility. Ensuring the safe transportation of people necessitates the safe execution of the voyage. Biometric technology is a tool that may be used for many purposes. An expert assessment was conducted to examine passenger transport businesses in Lithuania, using this information. The research included the participation of 25 specialists in all.
The primary objective was to determine whether the scanning of biometric data should be implemented for drivers or passengers (Figure 1).
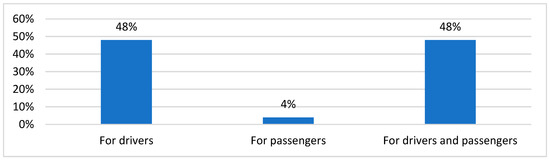
Figure 1.
The need for the application of biometric technologies in public transport.
The survey findings revealed an almost equal distribution: 48 percent thought the application should be focused on drivers, while 48 percent suggested it should include both drivers and passengers. Considering that experts identified the drivers in both incidents, it was important to determine whether biometric data scanning technologies would guarantee secure transportation for passengers (Figure 2).
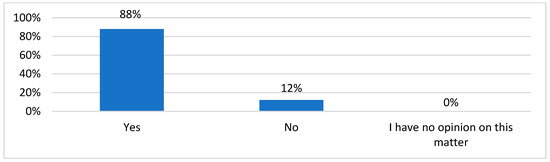
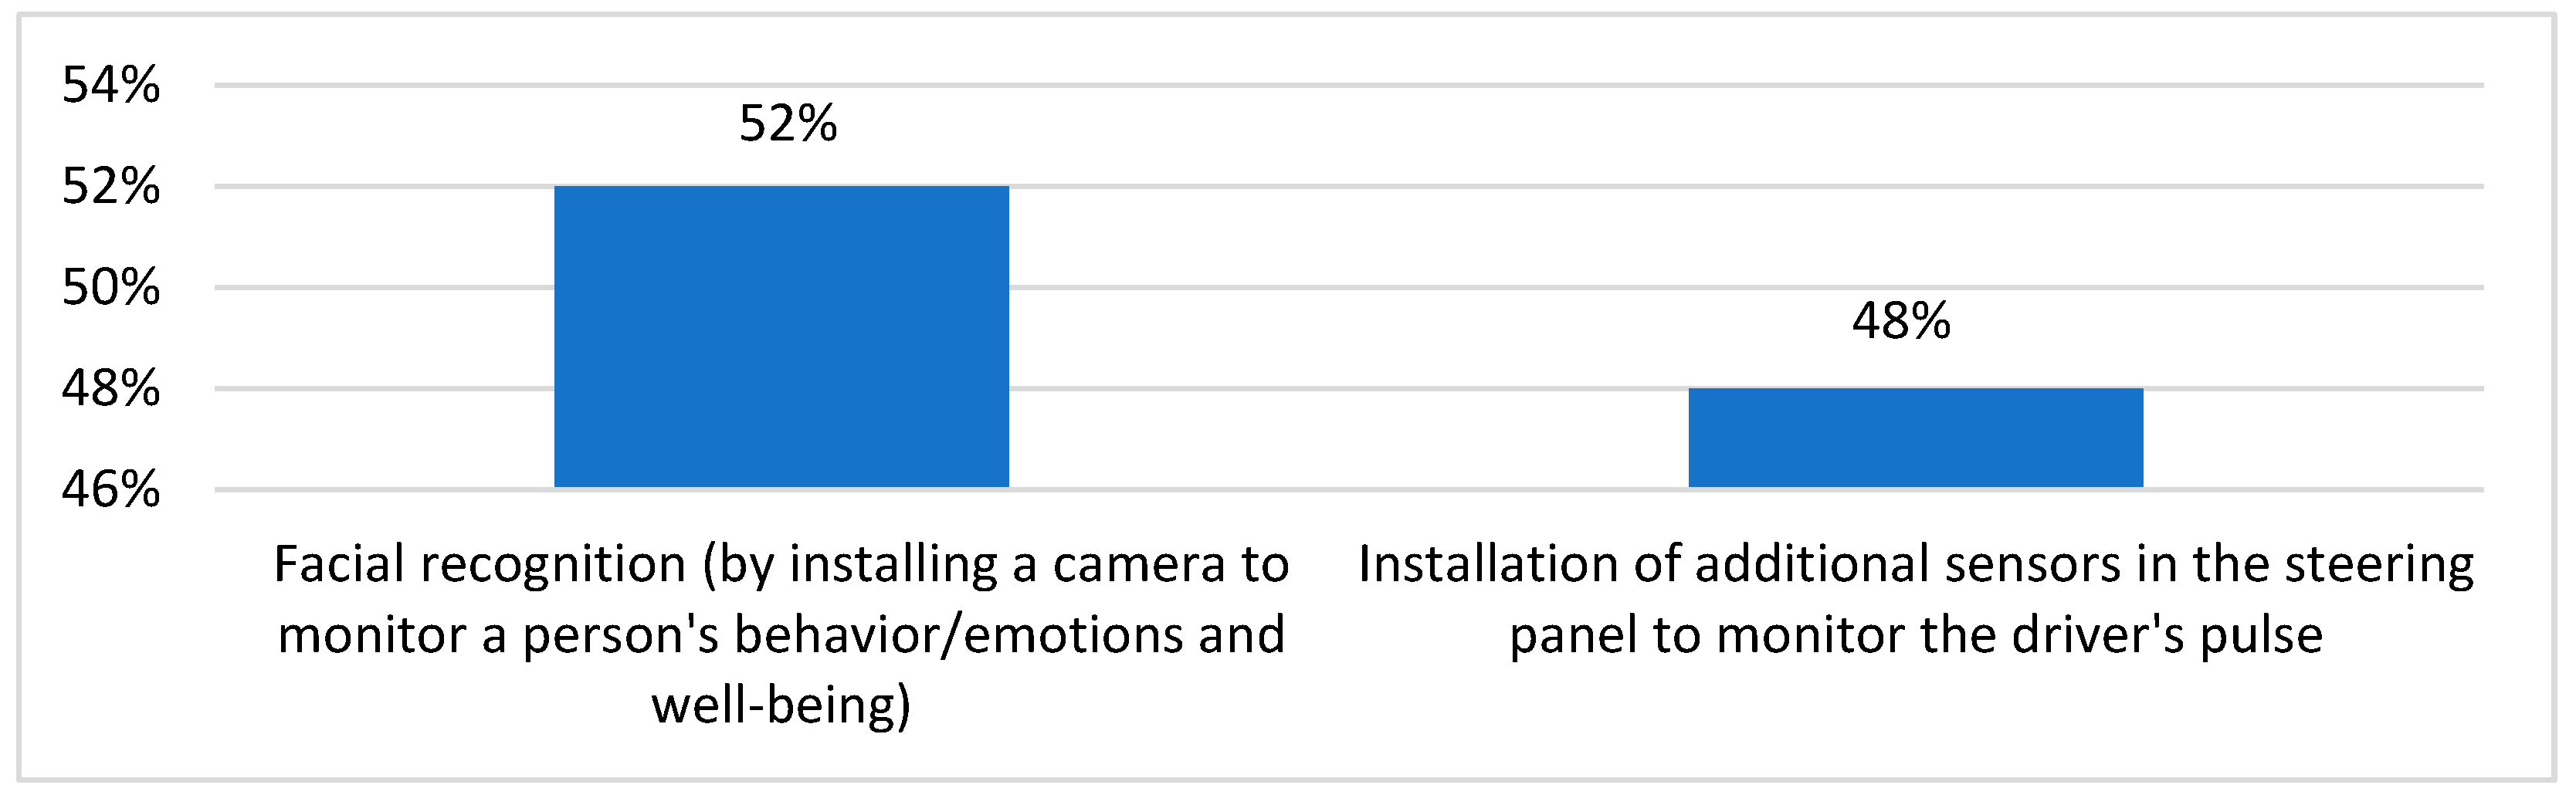
Figure 2.
The need for a biometric data scanning system that would detect driver health problems in time and ensure safe passenger transportation in public transport.
The study discovered that using biometric technology would enable the secure transportation of people [33]. Hence, it was crucial to determine which biometric data recognition techniques can be used in public transport to guarantee secure passenger transit. Given that the study offered 5 primary potential options, the experts were required to assess the significance of their order by ranking. The findings are summarised and produced using the specified technique, which includes the computation of rankings and priority ratings (Table 1). Prior to prioritising the findings, an evaluation of the compatibility of viewpoints was conducted. The findings obtained (W = 0.1718; χ2 = 17.1840; Wmin = 0.0949) indicate that the experts’ judgements are in agreement, enabling a more thorough evaluation of the significance of the technique layout.

Table 1.
Evaluation of the application of biometric data recognition methods in public transport.
The calculations demonstrated a consensus among experts about the prioritisation of biometric data recognition techniques for ensuring safe passenger movement in public transport. The approaches are ranked in the following order, from highest to lowest importance:
- Face recognition,
- Pulse measurement,
- Iris scanning,
- Voice recognition,
- Fingerprint and palm print recognition.
The findings indicate that the most suitable methods would be face recognition and pulse monitoring.
In the context of correlation analysis, Figure 3 provides relevant information.
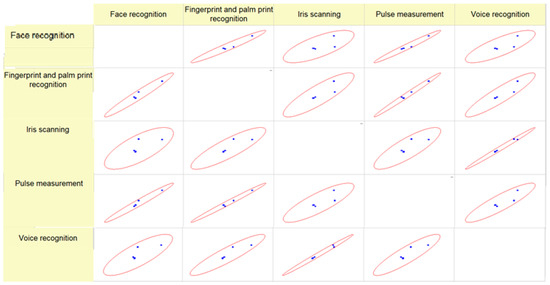
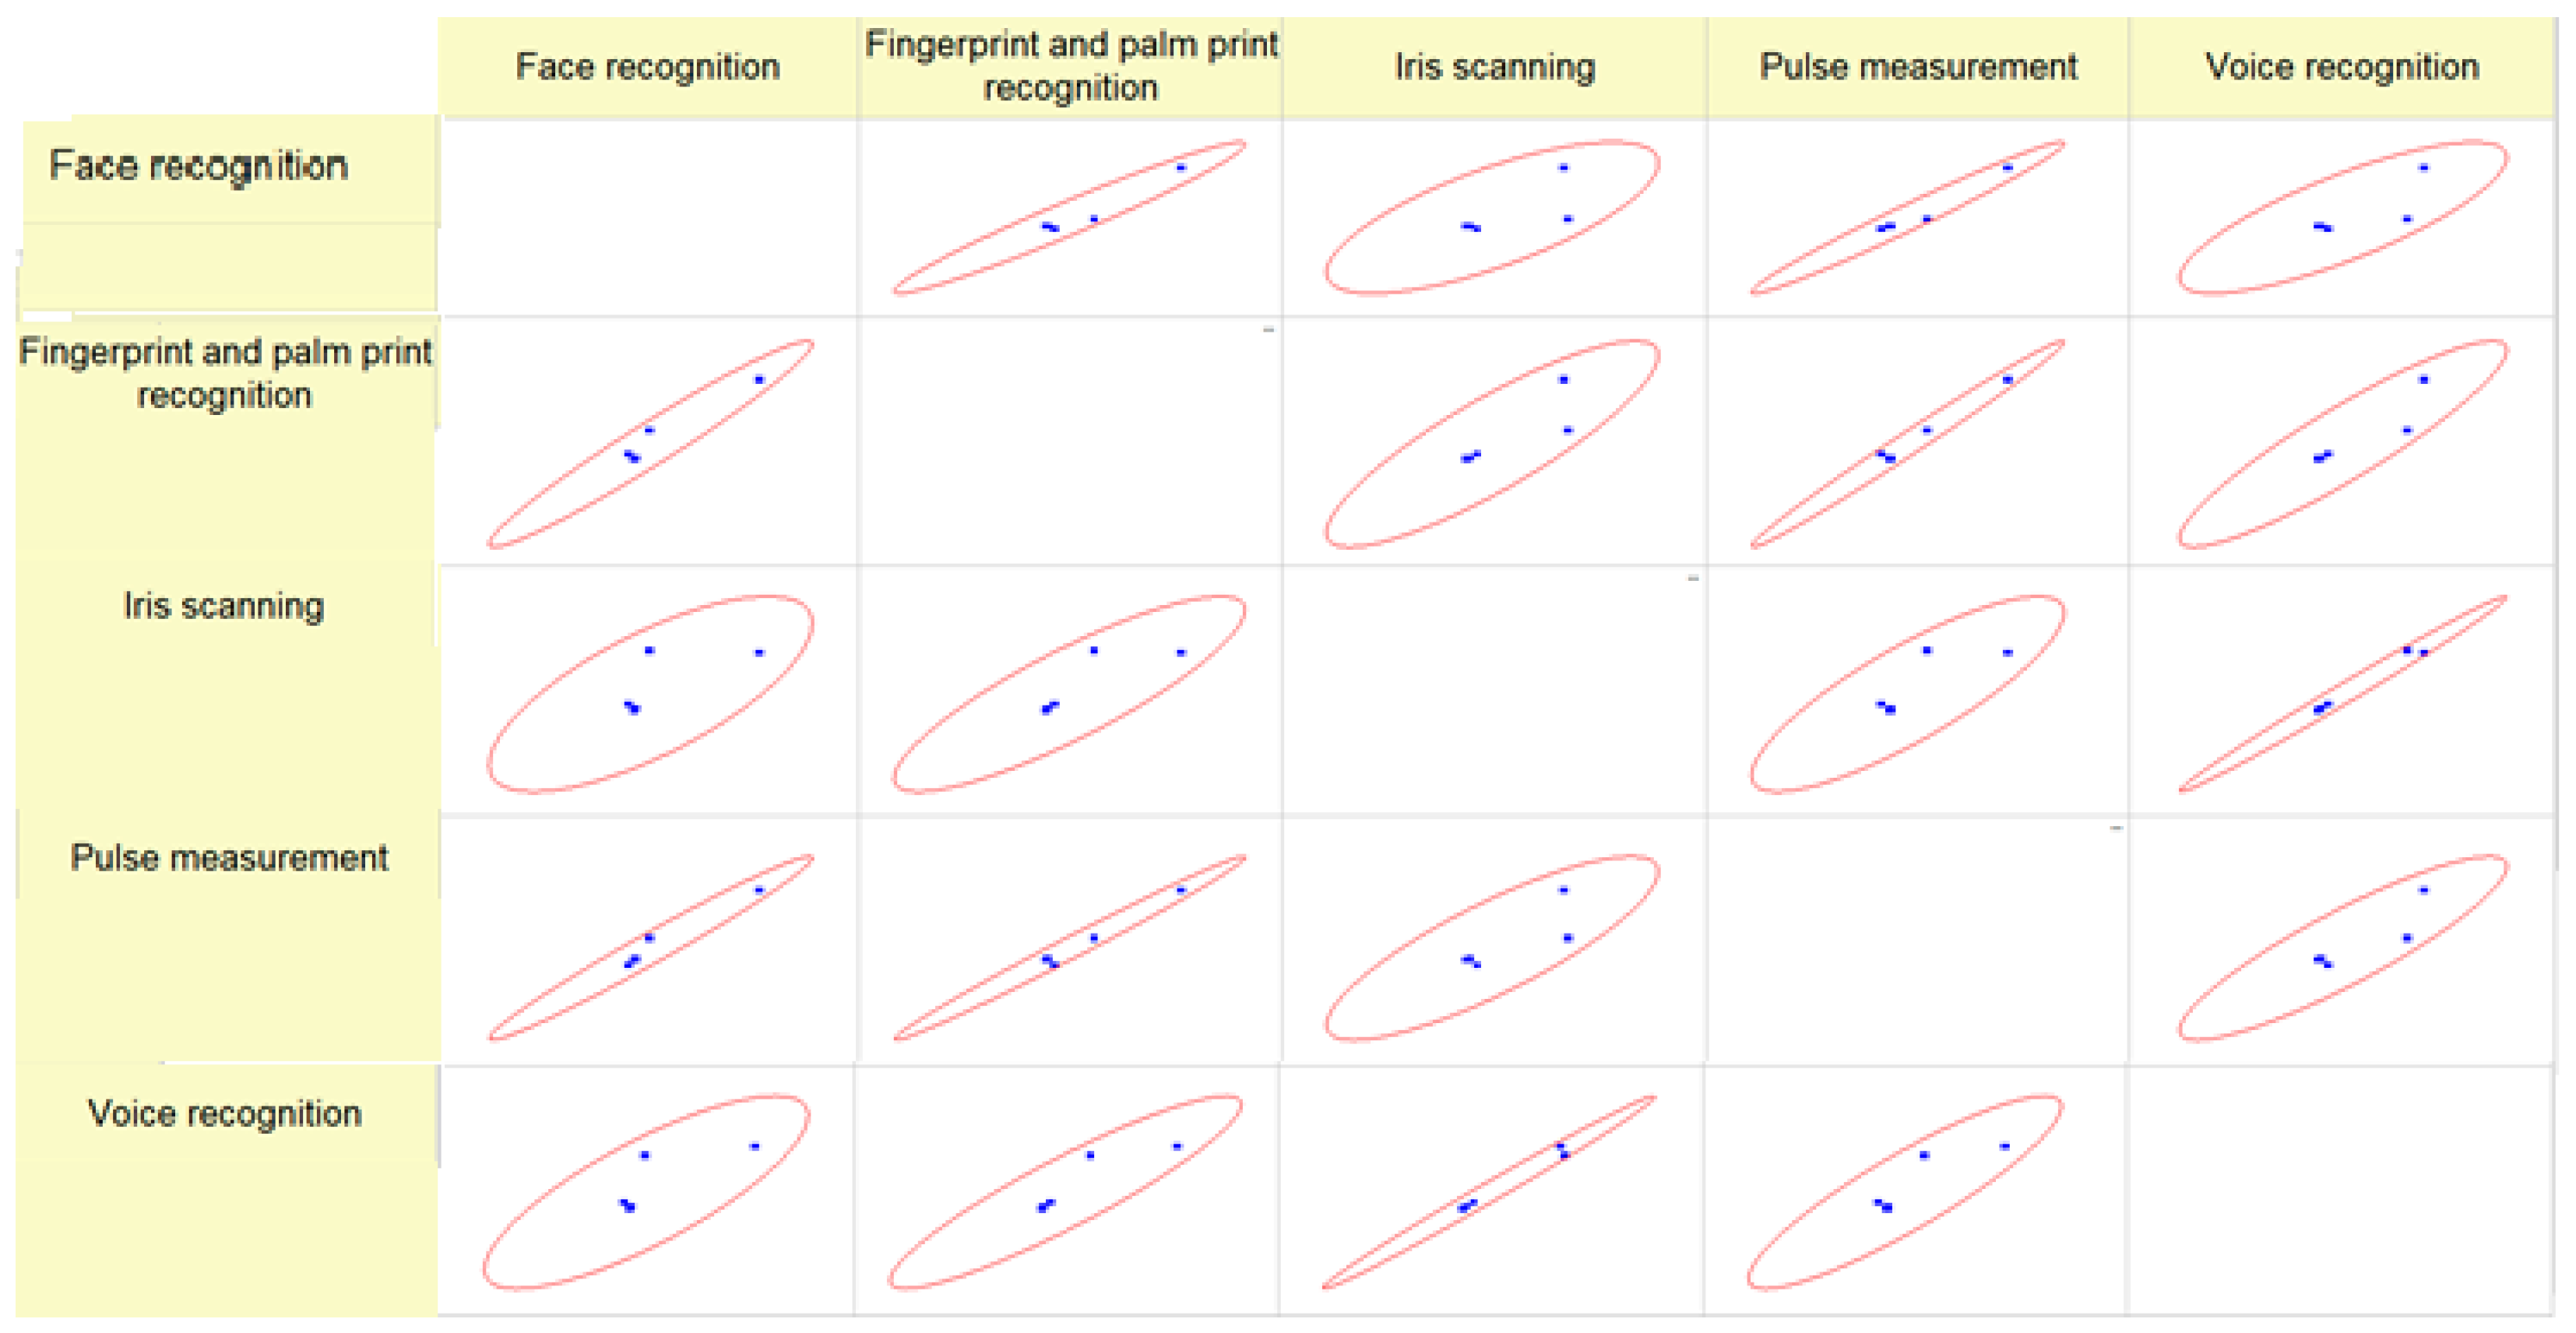
Figure 3.
Tendencies correlation when assessing the importance of the biometric data recognition methods.
The figure indicates a positive link between face recognition and fingerprint and Palm Print Recognition, as seen by the tilt of the ellipse. The data points exhibit a moderate dispersion, with the majority falling inside the ellipse. This indicates that there is some degree of unpredictability, but overall, a positive linear connection can be seen between these two methodologies. The figure demonstrates a positive connection between face recognition and iris scanning approaches, shown by an extended ellipse. This suggests a moderate to strong association between the two methods.
The correlation between face recognition and pulse measurement is not well-defined. The data points exhibit a wide distribution, and the ellipse is stretched, indicating a certain level of positive association. However, the dispersion of the data points suggests a significant amount of variability. The figure demonstrates a substantial positive correlation between face recognition and voice recognition. The data points are closely packed around the ellipse, indicating a consistent and robust association between these two biometric approaches compared to others. Fingerprint and palm print recognition, as well as iris scanning, show a positive and potentially substantial connection based on the elongated ellipse and closely matched data points. The analysis of fingerprint and palm print recognition, as well as pulse measurement, indicates a favourable link. However, the ellipse representing the correlation is less elongated, indicating a weaker correlation. The figure demonstrates a positive correlation with an extended ellipse, indicating a robust association between fingerprint and palm print recognition, as well as voice recognition. The figure demonstrates a positive correlation with an extended ellipse, indicating a moderate to strong link between iris scanning and pulse measurement. Iris scanning and voice recognition: The connection exhibits a positive correlation, as seen by the orientation of the ellipse, with the data points closely aligning with the direction of the ellipse. Measuring pulse and recognising voice: The plot indicates a direct relationship with an enlarged ellipse. Nevertheless, the dispersion of data points is rather wide, suggesting that while there is an overall upward trend, there is substantial variability. To summarise, all the correlations shown are good, but they differ in terms of their strength. The ellipses provide a graphical depiction of these correlations. When you see a more elongated ellipse that is closely matched with the data points, you may deduce a stronger association. On the other hand, if the ellipse is more circular or the data points are widely separated, it indicates a less strong association.
Table 2 presents a correlation matrix with associated significance values, detailing the relationships between different biometric recognition methods: Face recognition, fingerprint and palm print recognition, iris scanning, pulse measurement, and voice recognition. Correlation coefficients (Pearson Corr.) Face recognition and fingerprint and palm print recognition: Very high positive correlation (0.97084). This suggests that changes in one variable are strongly associated with changes in the other. Face recognition and Iris scanning: Moderate positive correlation (0.74293). This indicates a fair degree of association where, as one increases, the other tends to increase as well, but not as strongly as the first pair. Face recognition and pulse measurement: Very high positive correlation (0.98193), suggesting a strong relationship between these two methods. Face recognition and voice recognition: High positive correlation (0.79955), indicating a strong, positive association. Fingerprint and palm print recognition and Iris scanning: High positive correlation (0.86202), which is a strong indication that they are related. Fingerprint and palm print recognition and Pulse measurement: Very high positive correlation (0.99118), one of the strongest correlations in the matrix, suggesting a very strong linkage. Fingerprint and palm print recognition and Voice recognition: High positive correlation (0.91535), indicating a strong relationship. Iris scanning and pulse measurement: High positive correlation (0.83663), which is a strong indication of a relationship. Iris scanning and voice recognition: High positive correlation (0.99315), suggesting a very strong association between the two. Pulse measurement and Voice recognition: High positive correlation (0.89291), indicating a strong relationship. Significance values (Sig.) The significance values tell us whether the correlations are statistically significant, with lower values indicating a higher level of significance. For all pairs, the significance levels are very low (ranging from 0.00000145 to 0.01723), suggesting that the correlations are statistically significant. The convention is that a significance level below 0.05 (or 5%) is considered statistically significant. Tendencies: From the matrix, we can infer that all of the biometric methods have statistically significant positive correlations with each other. Some pairs show very strong correlations (values close to 1), such as fingerprint and palm print recognition with pulse measurement. This could mean that if one method is reliable in a given scenario, the other is likely to be reliable as well. The significance values support the correlations’ validity, indicating that the likelihood of these relationships being due to chance is extremely low. In application, these findings could suggest that a multimodal biometric system incorporating several of these methods would be very effective, as the methods seem to complement each other well, assuming the correlations indicate similar performance in terms of recognition accuracy or reliability.
Table 2.
Values of Pearson’s correlation coefficient when assessing the importance of the biometric data recognition methods.
During the research, it was also aimed to evaluate which type of biometric data scanning system is the best to apply in public transport (Figure 4).
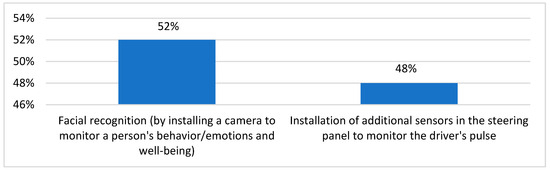
Figure 4.
Applicability assessment of types of biometric data scanning system in public transport.
The research revealed that most experts supported the use of face recognition technology. However, they also acknowledged the potential benefits of incorporating supplementary sensors on the steering wheel panel to monitor the driver’s pulse. These technologies are interconnected with the goal of enhancing road safety and ultimately decreasing the occurrence of traffic accidents (Figure 5).
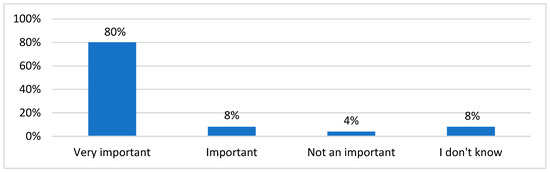
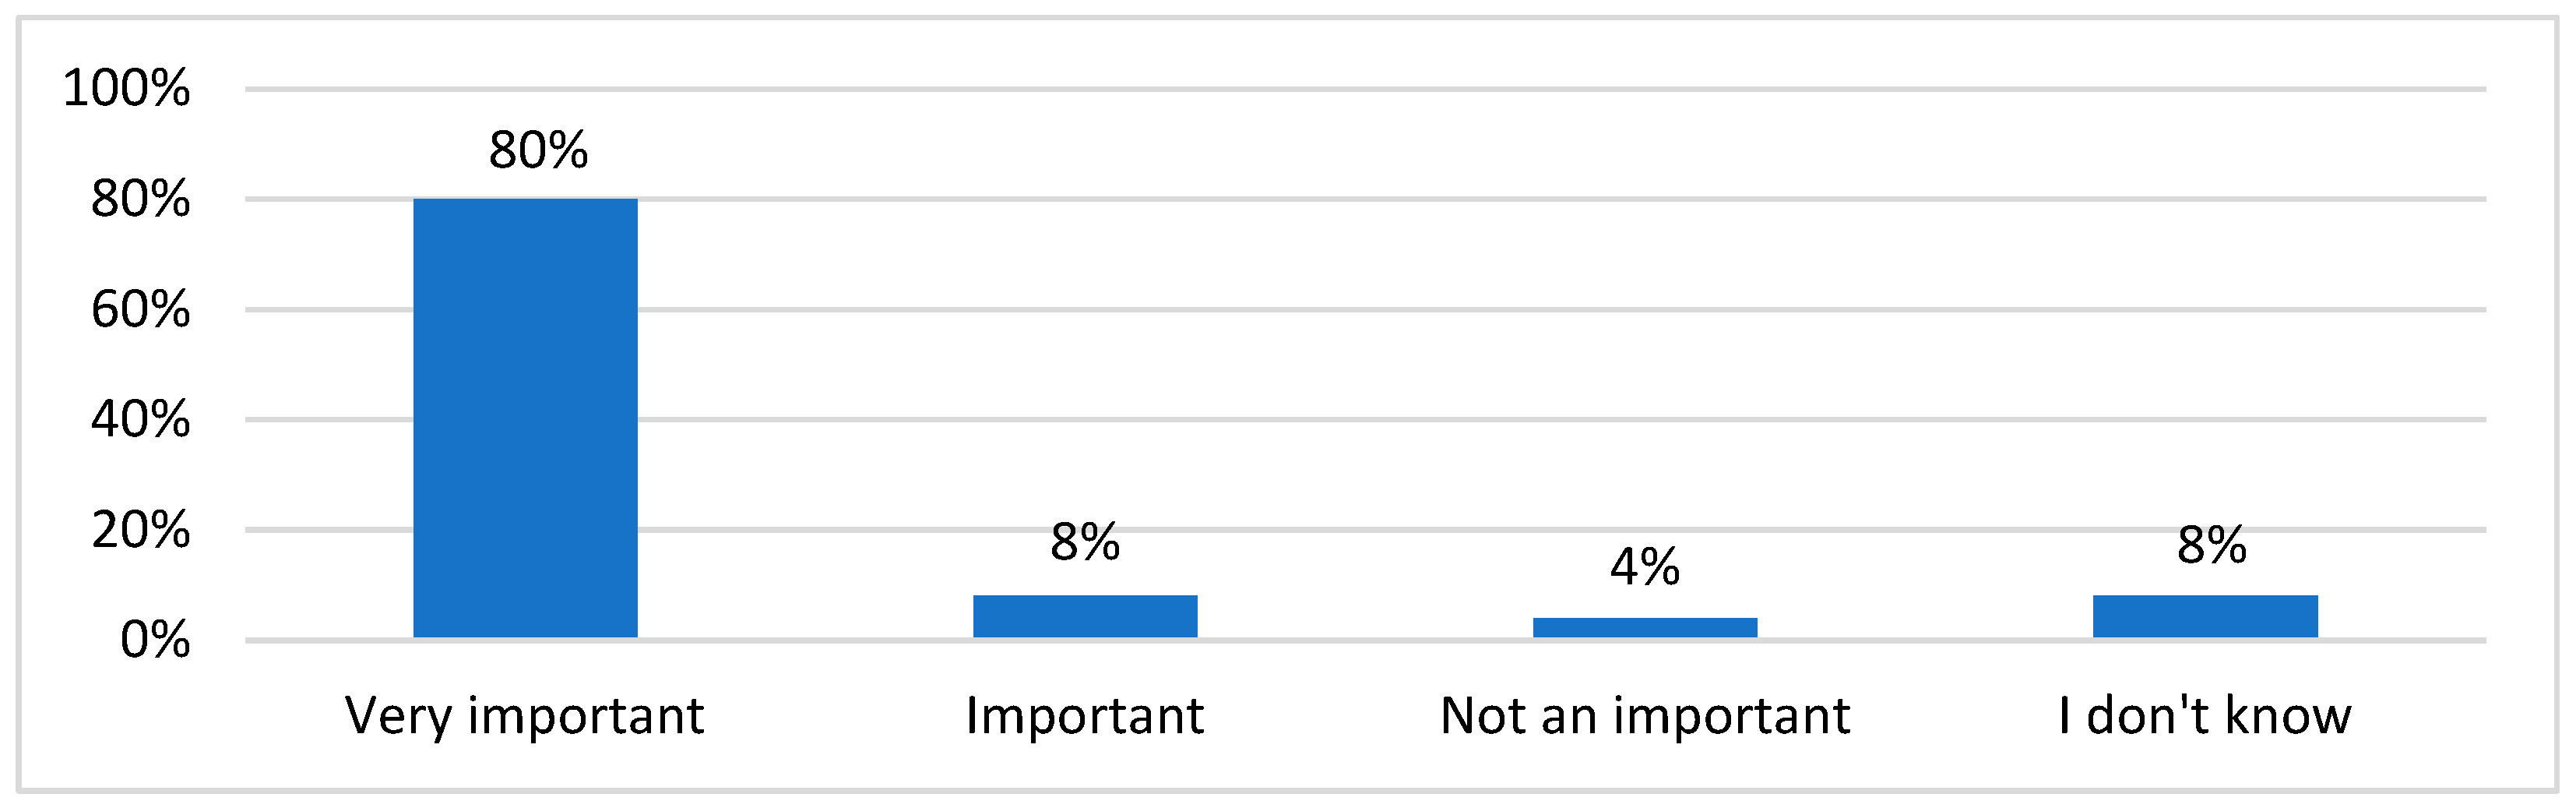
Figure 5.
Assessment of biometric data as a security element in increasing traffic safety.
In order to determine the effectiveness of biometric technologies as a security measure in public transport, it was crucial to assess the potential contributions of several well-known biometric data scanning techniques to ensuring safe travel (Table 3). Taking this into account, experts were asked to evaluate/rank 5 known technologies from 1 to 5, where 1 is the most applicable and 5 the least (numbers could not be repeated). The calculations conducted revealed that the experts’ viewpoints on the matter being examined are in agreement (W = 0.3056; χ2 = 30.5600; Wmin = 0.0949), enabling a more thorough evaluation of the significance of the layout of the pathways.
Table 3.
Evaluation of biometric data scanning methods to ensure safe travel in public transport.
The conducted calculations enabled the identification of the factors that would have the greatest impact on ensuring a safe journey: (1) Driver condition monitoring and quick response; (2) early identification and application of possible preventive measures (driver or passenger health disorders); (3) quick detection and response to emergency situations. How much less would it affect: effective monitoring and management of passenger flow and passengers can undergo identification and authentication.
The inquiry into guaranteeing a secure voyage underscores the pivotal significance of monitoring the driver’s condition [34], proactively dealing with any medical concerns, and promptly reacting to crises. These important criteria are interconnected with the overall objective of effective monitoring and control over passenger movement, including comprehensive verification and validation procedures. By including these variables, the research suggests a comprehensive safety framework that effectively mitigates the hazards linked to travel. The relationship between ongoing surveillance, proactive health interventions, and the effectiveness of emergency response systems is identified as the basis for improved travel safety. In conclusion, this strategy not only guarantees the welfare of passengers and drivers but also enhances the general credibility of transportation safety regulations (Figure 6).
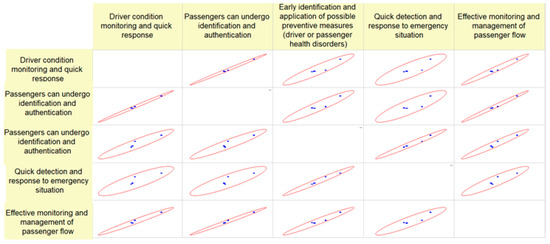
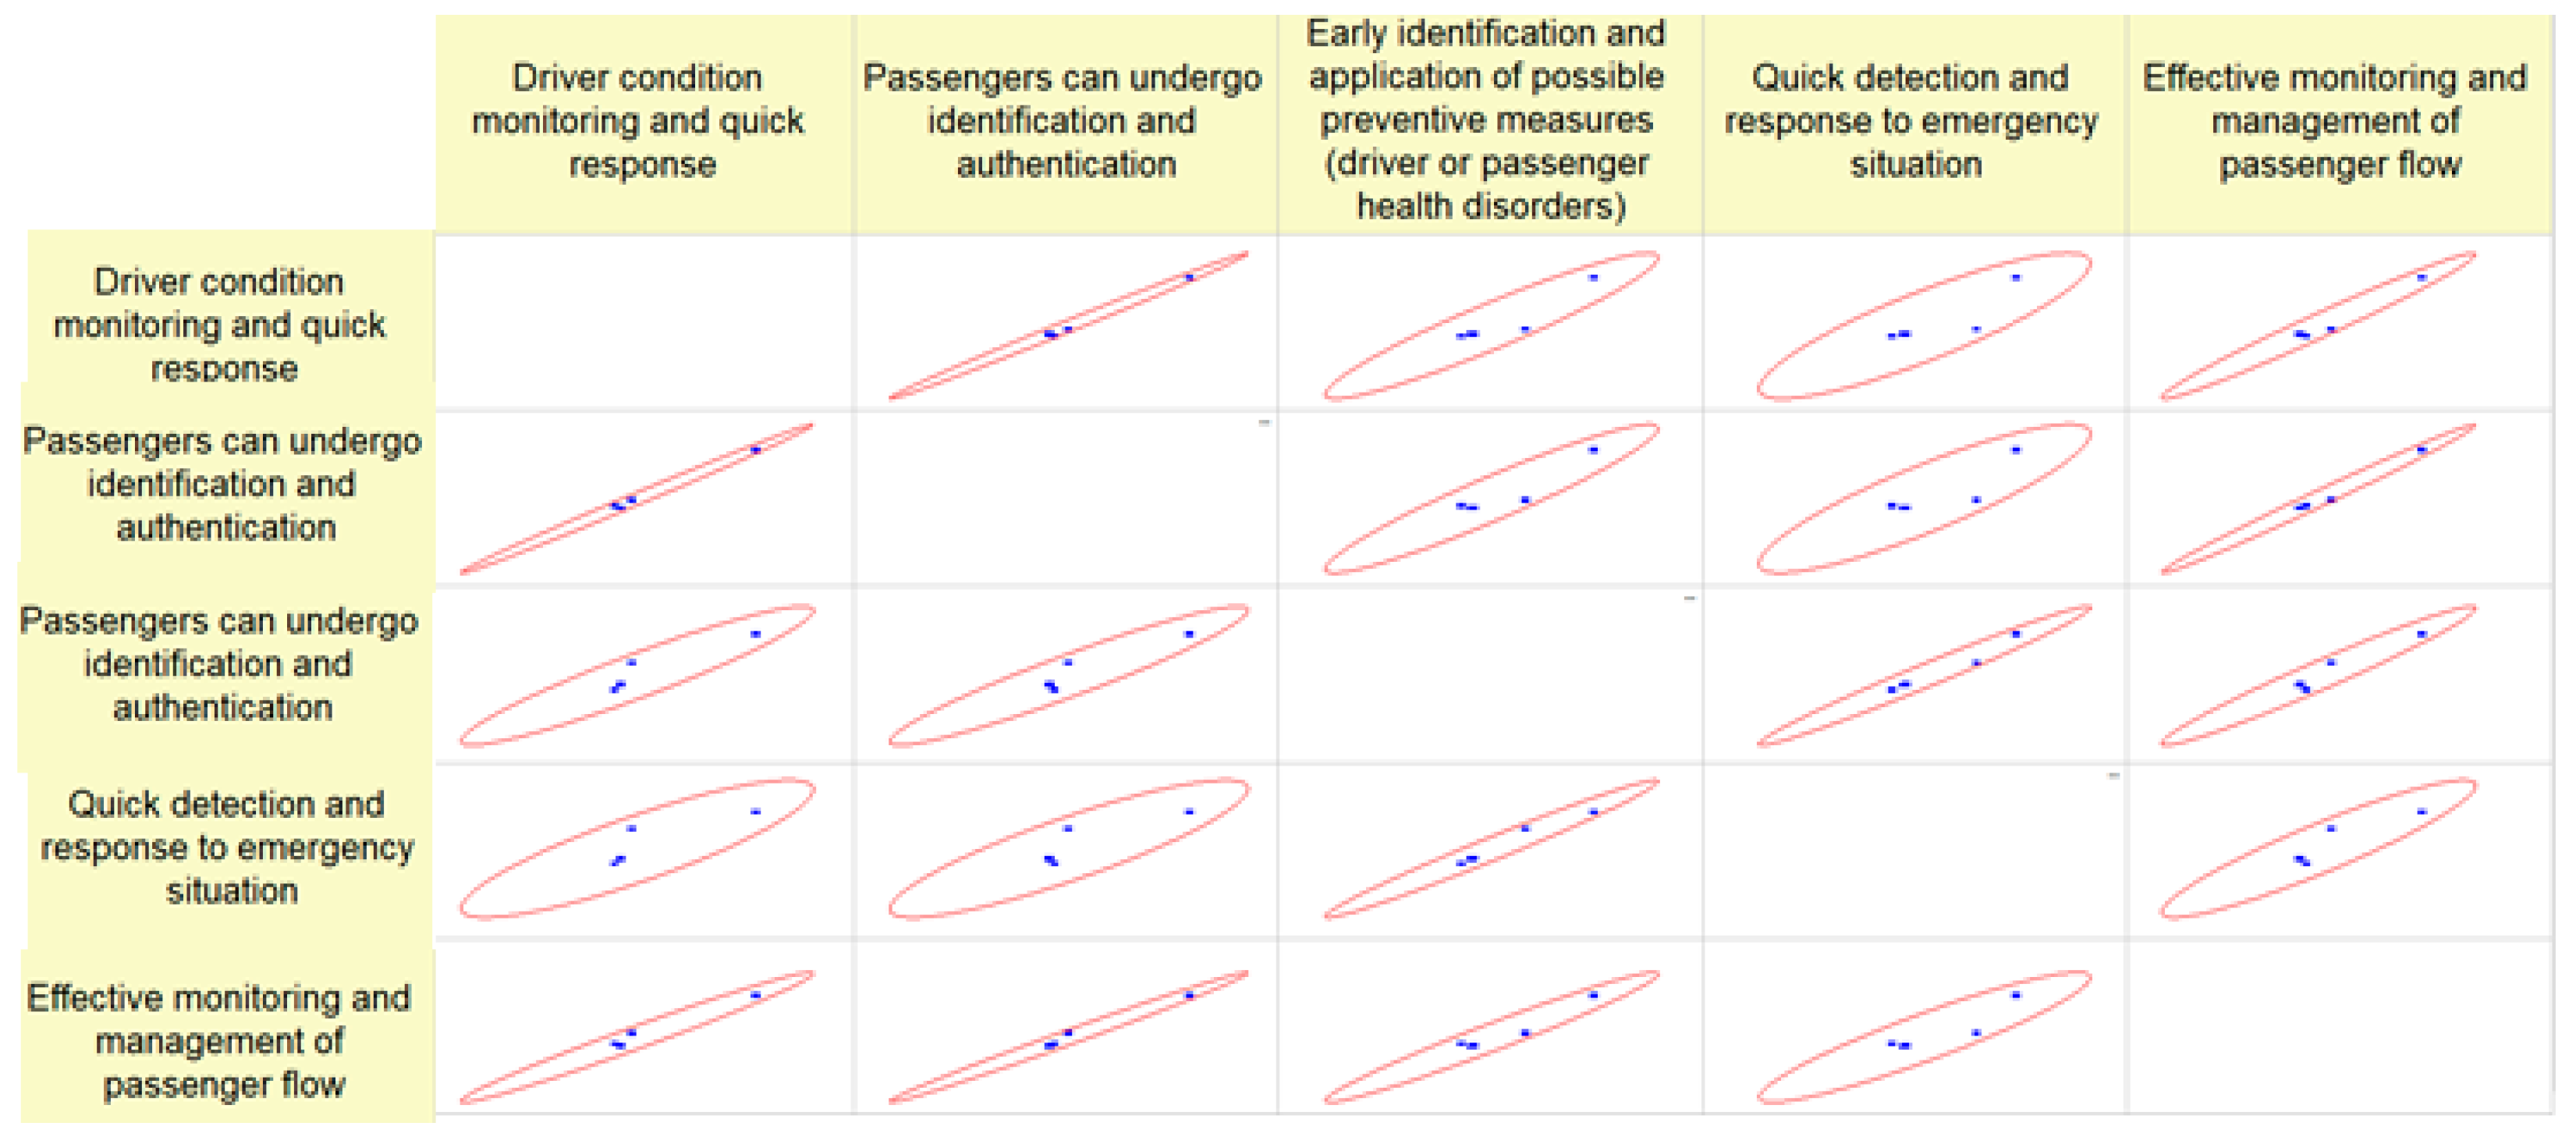
Figure 6.
Tendencies correlation when assessing the importance of the way of reading biometric data.
There seems to be a good link between driver condition monitoring and rapid reaction and all other factors. The orientation of the ellipses suggests a positive correlation between the two variables, meaning that when one measure grows, the other variable also increases. The association is quite pronounced in terms of “Quick detection and response to emergency situation”, as shown by the elliptical shape being narrow and the data points being closely clustered around the primary axis. There is a direct relationship between passengers undergoing identification and authentication and the early identification and implementation of potential preventative actions, as well as the effective monitoring and control of passenger flow. The data points exhibit more dispersion compared to the first row, indicating a less robust but still positive correlation. Timely recognition and implementation of potential preventative measures has a comparable positive relationship with both “Prompt identification and response to emergency situations” and “Efficient surveillance and control of passenger movement”. The elongated ellipses indicate a connection that ranges from moderate to strong.
The ability to rapidly identify and react to emergency situations is closely linked to the efficient monitoring and control of passenger movement [35], as shown by the concentrated elliptical shape and the alignment of data points along the ellipse’s main axis. These findings suggest that there is a strong correlation between efficient surveillance and prompt emergency intervention in this particular situation. Each plot with a “−” shows that the corresponding variables are not compared with each other due to the lack of significant information that would be derived from such a comparison. In general, the patterns indicate a positive correlation between these variables, indicating that enhancements or rises in one domain are likely linked to enhancements or rises in another. Considering the interdependence of these aspects is crucial when building systems, since improving one component may positively impact others, ultimately resulting in enhanced transportation safety and efficiency.
Table 4 displays a table presenting Pearson correlation coefficients between several parameters associated with driver and passenger monitoring and response systems, along with their corresponding significant levels. Here is an in-depth analysis of the relationships: Pearson correlation values assigned to variables in an equation.
Table 4.
Values of Pearson’s correlation coefficient when assessing the importance of the way of reading biometric data.
Driver condition monitoring and rapid reaction have a very high positive correlation (0.99622) with passengers undergoing identification and verification. This indicates that these two criteria are tightly associated.
The correlation coefficient of 0.94092 indicates a strong positive relationship between driver condition monitoring and the ability to identify and apply preventive measures. This suggests that improvements in driver condition monitoring directly contribute to the early identification and application of preventive measures.
Driver condition monitoring and rapid reaction. The analysis shows a strong positive correlation (0.86425) between the effectiveness of driver condition monitoring and rapid response systems and the ability to quickly identify and respond to emergency situations. This means that as these systems become more efficient, the speed and accuracy of emergency detection and reaction also improve. There is a substantial positive correlation (0.98318) between driver condition monitoring systems and successful passenger flow management, indicating that these systems are closely linked to the efficient monitoring and control of passenger flow. Passengers may go through the process of identification and authentication, which involves verifying their identity. This process is highly correlated with the early identification and implementation of preventive measures. The correlation coefficient of 0.94744 indicates a strong positive relationship, suggesting that the systems used for passenger identification are useful in identifying potential preventive measures at an early stage. Passengers may go through the process of identification and authentication, as well as experience speedy detection and reaction to emergency situations. There is a high positive correlation (0.87655), which indicates a significant association between passenger identification systems and the ability to respond quickly to emergencies. Passengers may go through the process of identification and authentication, which involves verifying their identity. Additionally, there is a strong positive correlation (0.99279) between properly managing passenger flow and the identification of passengers, indicating that these two factors are closely connected. The prompt identification and implementation of potential preventative measures, as well as the swift detection and reaction to emergency situations, exhibit a strong positive association (0.98352). This suggests that early identification of problems significantly enhances the ability to respond quickly in crises. The early identification and implementation of potential preventive measures, as well as the efficient monitoring and control of passenger flow, exhibit a very strong positive connection (0.97442). This indicates that the implementation of preventive measures is crucial for effectively managing passenger flow. The correlation coefficient of 0.92379 suggests a strong positive relationship between the quick detection and reaction to emergency situations and the effective monitoring and management of passenger flow. This indicates that an efficient emergency response is closely linked to the successful management of passenger flow.
All the significance values in the table are below the commonly accepted threshold of 0.05, suggesting that all the relationships given are statistically significant. The significance values, ranging from 0.00010 to 0.00428, indicate a very low probability that the correlations between these variables are a result of random chance. This provides strong evidence against the null hypothesis. Overview of Patterns: In summary, the table demonstrates a strong positive correlation among all the elements, implying that enhancements in one aspect are likely to coincide with enhancements in the other ones. The robustness of these interactions is substantiated by highly significant values, affirming the statistical strength of the correlations. This information might be quite important for anyone seeking to improve transportation safety systems, as it shows that adopting a comprehensive strategy that takes into account all of these aspects together could be advantageous.
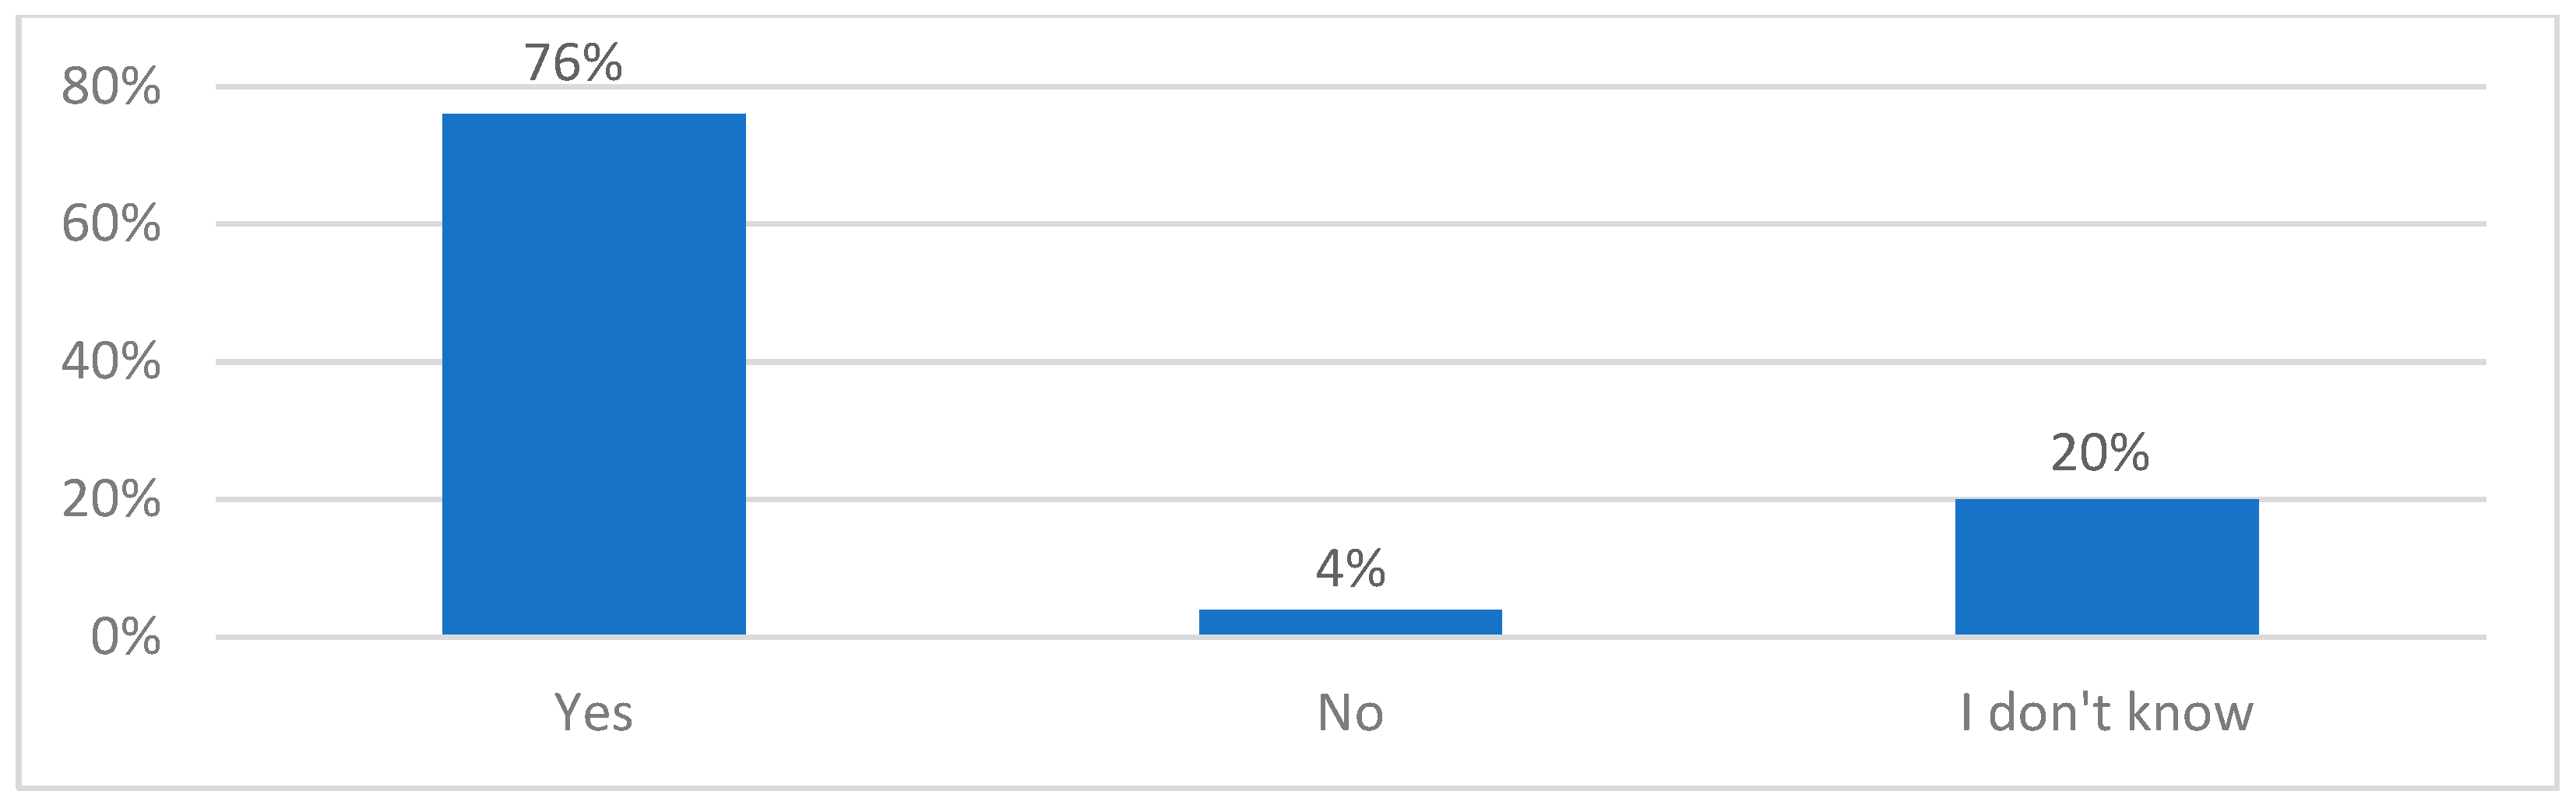
The data privacy legislation is a topic of much discussion, but it is crucial to evaluate the experts’ perspectives on the feasibility of using a biometric system in public transit to enhance travel security (Figure 7).

Figure 7.
Assessment of the need for the implementation of biometric systems in public transport in order to increase the safety of public transport.
Considering the viewpoints of specialists, most people would support the use of biometric systems in public transport, as long as it enhances the security of travel. Experts were asked to identify the circumstances under which they would authorise the gathering, surveillance, and use of biometric data in public transportation (Table 5). Given that the experts have rated the potential criteria, it is crucial to evaluate the comparability of their viewpoints. The computations (W = 0.3741; χ2 = 28.0560; Wmin = 0.1042) confirmed the alignment of the experts’ viewpoints and enabled the assessment of the order of significance (Table 5).
Table 5.
Assessment of the collection, monitoring, and use of biometric data in public transport.
Expert analysis suggests that the use of biometric data may be achieved by: (1) Enhancing the quality of public transport services; (2) reducing the occurrence of traffic accidents; and (3) facilitating the design, justification, and implementation of new route choices.
The examination into the use of biometric data in public transport systems demonstrates its potential to transform service quality, safety, and efficiency. By using biometric technology, public transit may make substantial improvements in how it provides services, customising experiences to meet the specific requirements and preferences of each person. Furthermore, the data demonstrate a clear link between the use of biometric technology and a decrease in traffic accidents. This may be attributed to enhanced safety protocols and customised travel circumstances. Moreover, the utilisation of biometrics plays a crucial role in the strategic development of new routes, facilitating data-based determinations for route validation and execution.
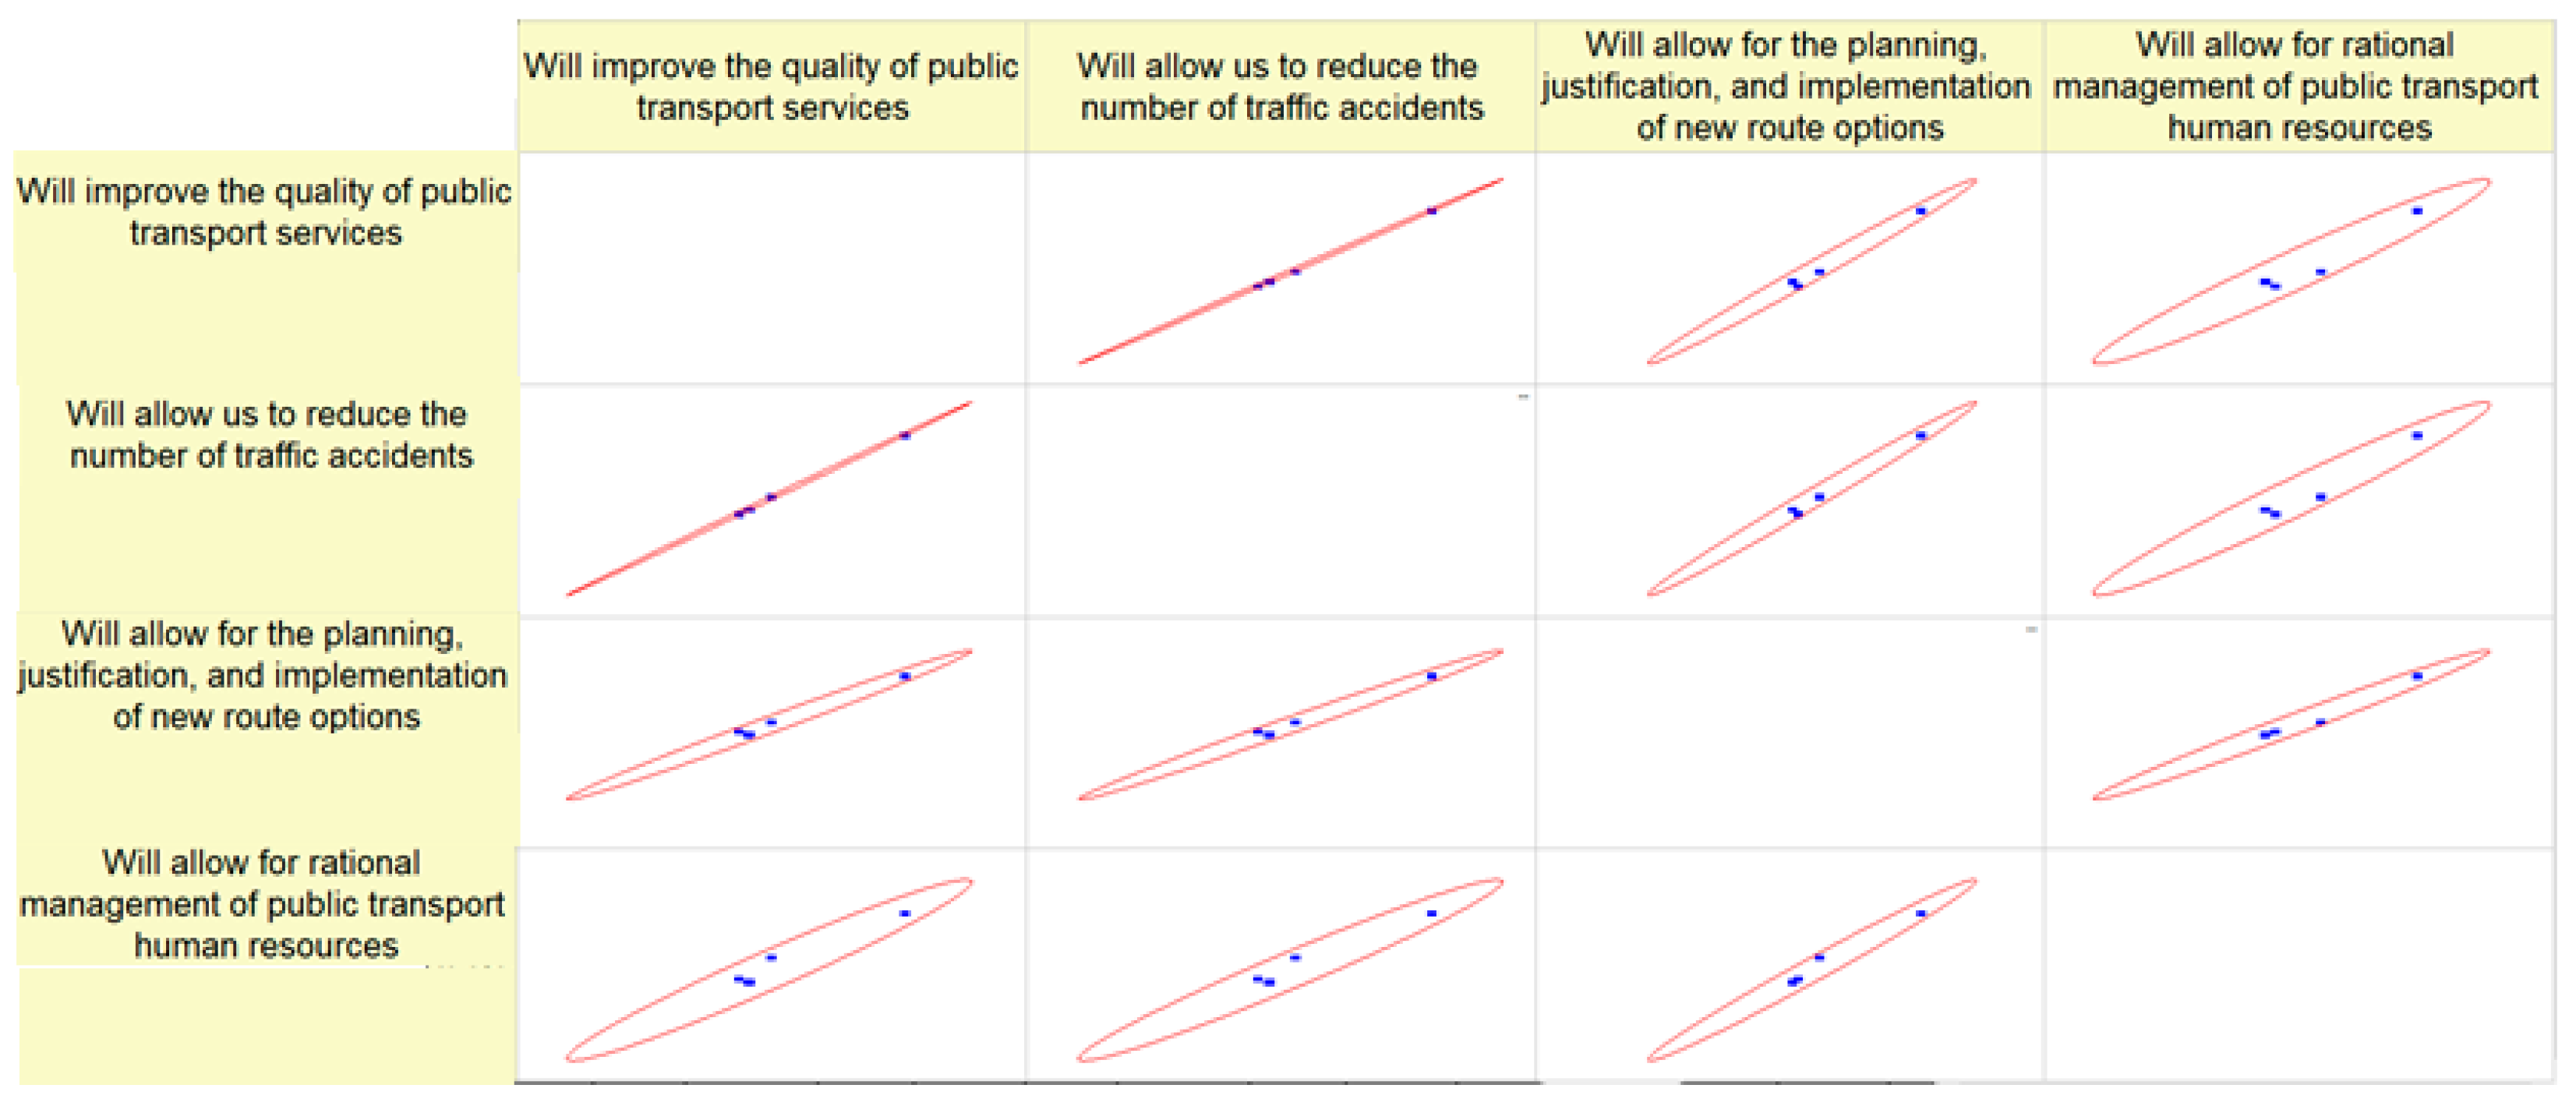
Figure 8 shows a sequence of scatter plots that examine the correlations between several factors linked to public transport services. Each figure displays a comparison between two variables, with the associations represented by the arrangement of data points and the red ellipses, which are likely to reflect the confidence intervals of the correlations. Here is an analysis of the connections shown in each plot [36]. Enhancing the quality of public transport services would enable us to decrease the frequency of traffic accidents. The figure indicates a robust positive association. The data points show a strong positive correlation, with a small and positively inclined ellipse [37]. This suggests that as the quality of public transport services improves, there is a commensurate drop in the frequency of road accidents.

Figure 8.
Tendencies correlation when assessing the collection, monitoring and use of biometric data in public transport would be carried out.
This initiative aims to enhance the standard of public transport services and simplify the process of devising, validating, and executing new route alternatives. The presence of a similar pattern of data points and the alignment of the ellipse show a significant positive connection once again. Enhancing the quality of public transport services and implementing effective management strategies for human resources in the public transport sector. The correlation is positive, as seen by the data points closely grouped within the ellipse, demonstrating a robust and direct association between enhancing public transport services and more effective human resource management. The other variables are compared in a similar way in the other figures. Enabling us to decrease the frequency of traffic collisions and facilitating the development, validation, and execution of alternative route choices: The storyline demonstrates a direct relationship. Nevertheless, the matrix does not include any data points that directly compare these two variables, since it consists of the same variable being compared to itself [38]. Enabling us to decrease the frequency of traffic accidents and facilitating the efficient use of human resources in public transit. The data points demonstrate a positive correlation, showing that when one variable grows, the other variable also increases. This will enable the process of strategizing, rationalising, and executing new alternatives for routes. Enables efficient and logical administration of human resources in public transport: The figure exhibits a positive correlation, shown by the direction of the ellipse, indicating that these two elements are likely to have a mutually beneficial impact on each other. In general, the trends indicate a favourable correlation between the factors associated with enhancing public transportation services, decreasing accidents, designing new routes, and overseeing human resources. This suggests that endeavours in any of these domains are likely to yield positive outcomes in the others, which may be significant for policymakers and managers of public transport when making choices to enhance public transport networks [39].
Table 6 displays Pearson correlation coefficients, which quantify the linear association between variable pairs, as well as the importance of these correlations. The variables under consideration are associated with enhancements and management tactics in public transportation.
Table 6.
Values of Pearson’s correlation coefficient when assessing the collection, monitoring, and use of biometric data in public transport would be carried out.
Enhancing the quality of public transport services would enable us to decrease the frequency of traffic accidents. The correlation coefficient of 0.99974 indicates an extremely strong positive relationship between improving the quality of public transport services and reducing road accidents. This initiative aims to enhance the calibre of public transport services and facilitate the development, validation, and execution of novel route alternatives. The data show a significant positive connection (0.99286) between improved public transport services and the capacity to develop and execute new routes. Enhance the quality of public transport services and enable efficient administration of human resources in public transport: The data show a high positive correlation (0.97239), demonstrating a significant and direct link between the development of public transport services and the effective and logical use of human resources. This will enable us to decrease the frequency of traffic accidents and facilitate the development, validation, and execution of new route alternatives. The data show an exceptionally strong positive correlation (0.99343), indicating that the measures taken to decrease traffic accidents are closely aligned with the development and execution of new transit routes. Implementing this solution will enable us to decrease the frequency of traffic accidents and efficiently manage the human resources in public transit. The data show a high positive correlation (0.97617), suggesting a significant connection between decreasing accidents and properly managing human resources.
This will facilitate the process of devising, validating, and executing new route alternatives. Additionally, it will enable the efficient allocation and utilisation of human resources in the administration of public transportation. The data show a high positive correlation (0.98903), indicating a significant and robust connection between the development of new routes and the management of human resources in public transport. Statistical significance values:
The p-values associated with each Pearson correlation coefficient are very small (varying from 4.16 × 10⁻¹¹ to 3.27 × 10⁻⁶), much below the customary threshold of 0.05 for statistical significance. This strongly suggests that the observed relationships are not a result of random chance.
The research indicates a strong and substantial positive correlation among all the stated improvements and management practices in public transit. This implies that actions taken in one domain are likely to be linked with advantages in the other domains, and endeavours to enhance one component of public transport might potentially lead to a chain reaction of beneficial outcomes in other areas. The significance values provide strong evidence for these correlations, indicating that they are statistically credible conclusions [40]. This data has significant potential for transport policy and administration, suggesting that adopting a unified strategy in all domains might result in substantial enhancements to public transport systems.
After evaluating the circumstances in which biometric technologies can guarantee the secure transportation of passengers, an assessment was conducted to determine whose biometric data (passengers (Table 7) and/or drivers (Table 8)) would be suitable for collection, processing, and monitoring. The experts’ viewpoints were reconciled in both situations involving passengers (W = 0.1168; χ2 = 5.8400; Wmin = 0.0921) and drivers (W = 0.0064; χ2 = 0.3200; Wmin = 0.0042). This allowed for evaluations to be made about the applicability and prioritisation of these cases, based on their significance (Table 9).
Table 7.
Translation of the expediency of collecting, processing, and monitoring passenger biometric data.
Table 8.
Translation of the expediency of collecting, processing, and monitoring biometric data of public transport drivers.
Table 9.
Collection, monitoring, and use of biometric data of passengers and public transport drivers Identification of the need for public transport.
As we can see, the research data made it possible to identify that the biometric data of passengers could be collected and managed if “Will ensure passenger control, behave respectfully and responsibly during the trip, and the collection of driver biometric data”—“Will ensure quick and timely medical assistance to the driver in the event of a sudden health disorder”.
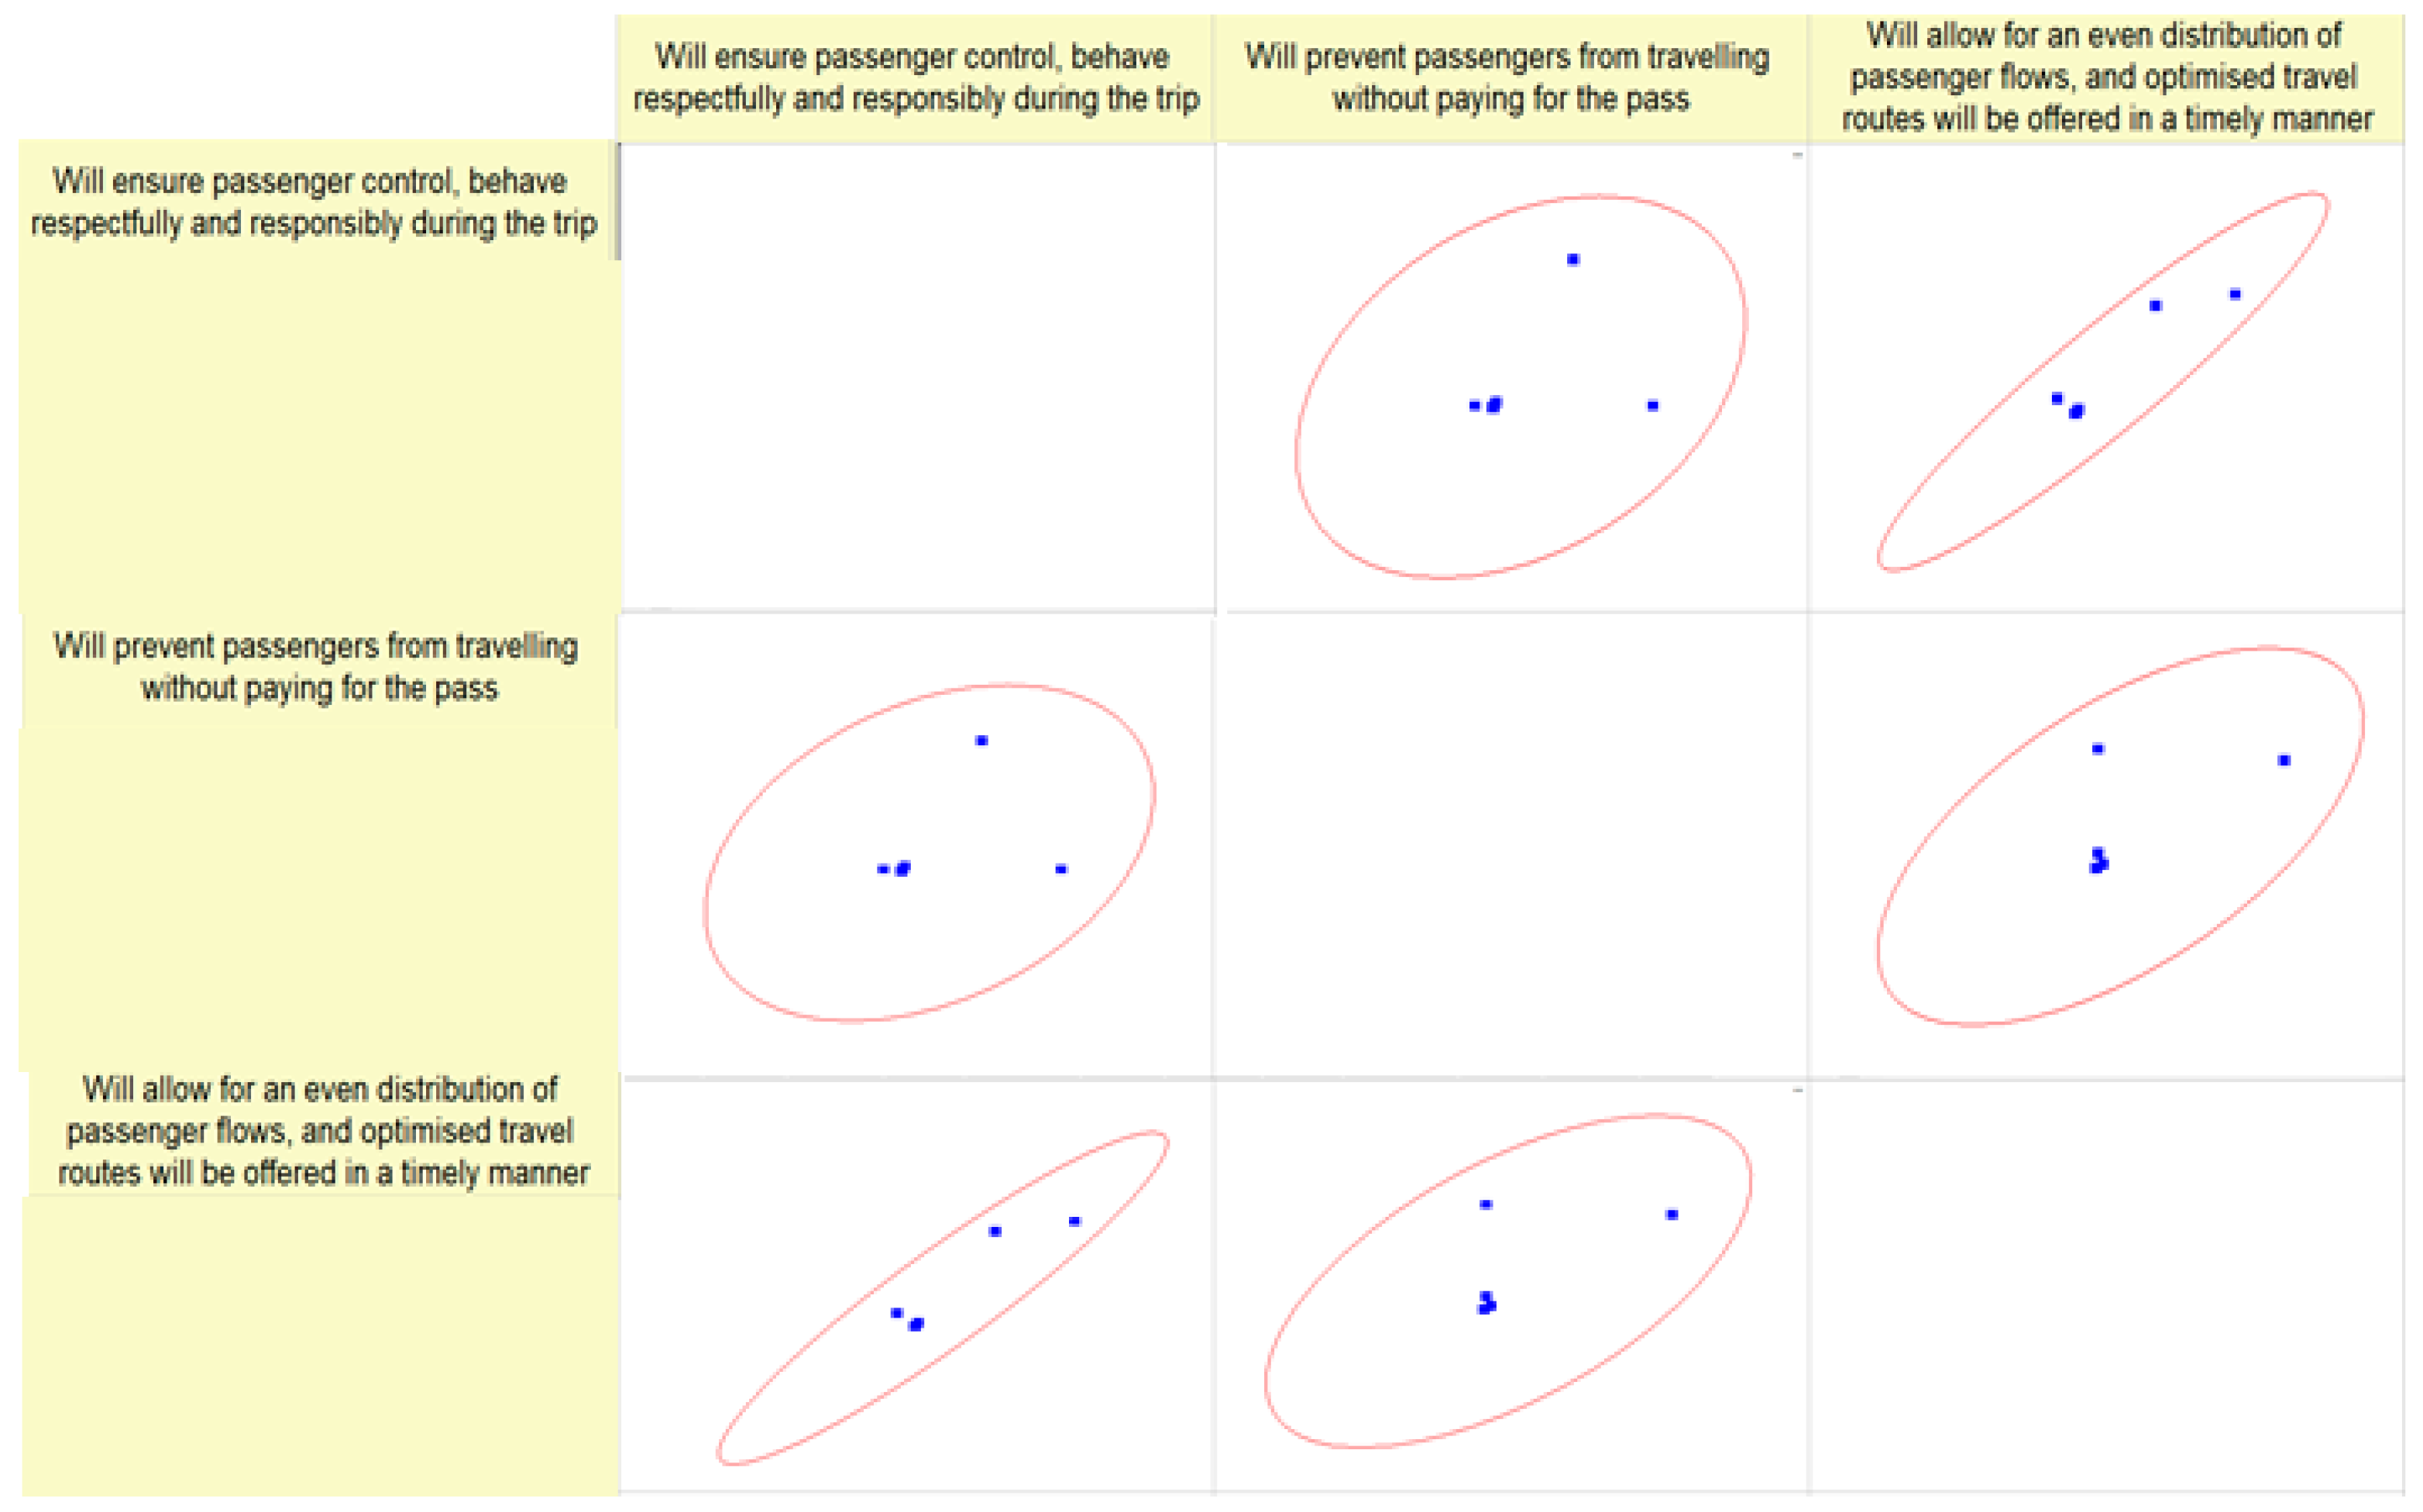
Figure 9 displays scatter plots illustrating the correlations between three pairs of factors associated with passenger management in public transport: It will guarantee the supervision of passengers, maintaining a courteous and responsible demeanour during the journey. Additionally, I will check that all passengers have paid for their passes before allowing them to ride. The figure indicates a modest to feeble positive association. The data points are distributed across the ellipse, which has a modest elongation. This suggests that while there may be a correlation between measures aimed at passenger control and the prevention of fare evasion, the connection is not very robust. I will guarantee passenger management by ensuring polite and responsible behaviour during the journey. Additionally, I will facilitate an equitable allocation of passenger traffic and provide timely optimal travel routes. The link in this case seems to be feeble; the ellipse is somewhat broad, and the data points are scattered, indicating that promoting passenger control and respectful behaviour may not have a significant direct influence on the distribution of passenger flows and the optimisation of travel routes.
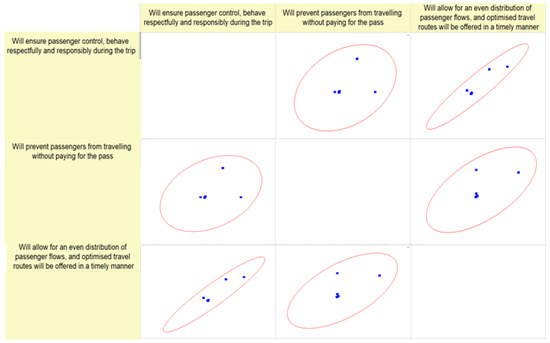
Figure 9.
Tendencies correlation when the collection, monitoring, and use of biometric data of passengers in public transport if it is.
This system “Will deter customers from travelling without purchasing a pass and ensure that passenger flows are evenly distributed”. Additionally, it will provide timely optimum travel routes. This figure exhibits a tenuous link as well. The elongation of the ellipse is less prominent, and the data points are somewhat dispersed, suggesting that there is not a clear correlation between avoiding fare evasion and achieving an evenly distributed flow of passengers and optimised routes. In general, the plots suggest that there are some positive associations among the variables, albeit they are not notably robust. The methods used to enforce passenger control and deter fee evasion may have a certain impact on optimising passenger flows and routes [41]. However, it is important to note that there are other crucial aspects that are not represented in this analysis.
Table 10 is presented that shows Pearson correlation coefficients between variables associated with public transport management. These variables pertain to passenger control, fare evasion prevention, and the distribution and optimisation of passenger flows and travel routes. The table also includes the significance values for these correlations.
Table 10.
Values of Pearson’s correlation coefficient when the collection, monitoring, and use of biometric data of passengers in public transport if it is.
This measure will provide effective passenger control and prohibit unauthorised travel without payment. The data show a modest positive correlation (0.35088), indicating that measures aimed at passenger control are slightly linked to the prevention of people travelling without paying. This system will guarantee effective passenger management and provide a balanced distribution of passenger traffic. Additionally, it will provide timely and optimal travel routes. The data show a substantial positive connection (0.93642) between assuring passenger control and both the equitable distribution of passenger flows and the timely supply of optimal travel routes. This system will deter customers from going without purchasing a pass and ensure that passenger flows are evenly distributed. Additionally, it will provide timely optimum travel routes. There is a modest positive correlation (0.61083) indicating that there is a connection between preventing fare evasion and optimising and evenly distributing travel routes. However, this link is not as strong as the one seen with passenger control.
This measure will guarantee effective passenger control and prohibit anyone from travelling without purchasing a valid pass. The p-value (0.3941) exceeds the customary threshold of 0.05, indicating that this association may not be statistically significant. This system will guarantee effective passenger management and provide a balanced distribution of passenger traffic. Additionally, it will provide timely and optimal travel routes. The p-value (6.12262 × 10⁻⁴) is much lower than the threshold of 0.05, suggesting that this link is statistically significant and unlikely to be attributed to random chance. This system will deter customers from going without purchasing a pass and ensure that passenger flows are evenly distributed. Additionally, it will provide timely optimum travel routes. The p-value (0.10769) exceeds the customary threshold, indicating that this link may not be statistically significant [42].
The table demonstrates a notable and robust association between assuring passenger control and the equitable distribution and optimisation of passenger flows and travel routes. Although there is a positive association between fare evasion prevention and the distribution and optimisation of travel routes, it is quite weak and may not have statistical significance. This suggests that although steps to restrict passengers may have a substantial influence on the overall efficiency and flow of transportation, efforts to prevent fare evasion may have a less pronounced or indirect effect on these elements.
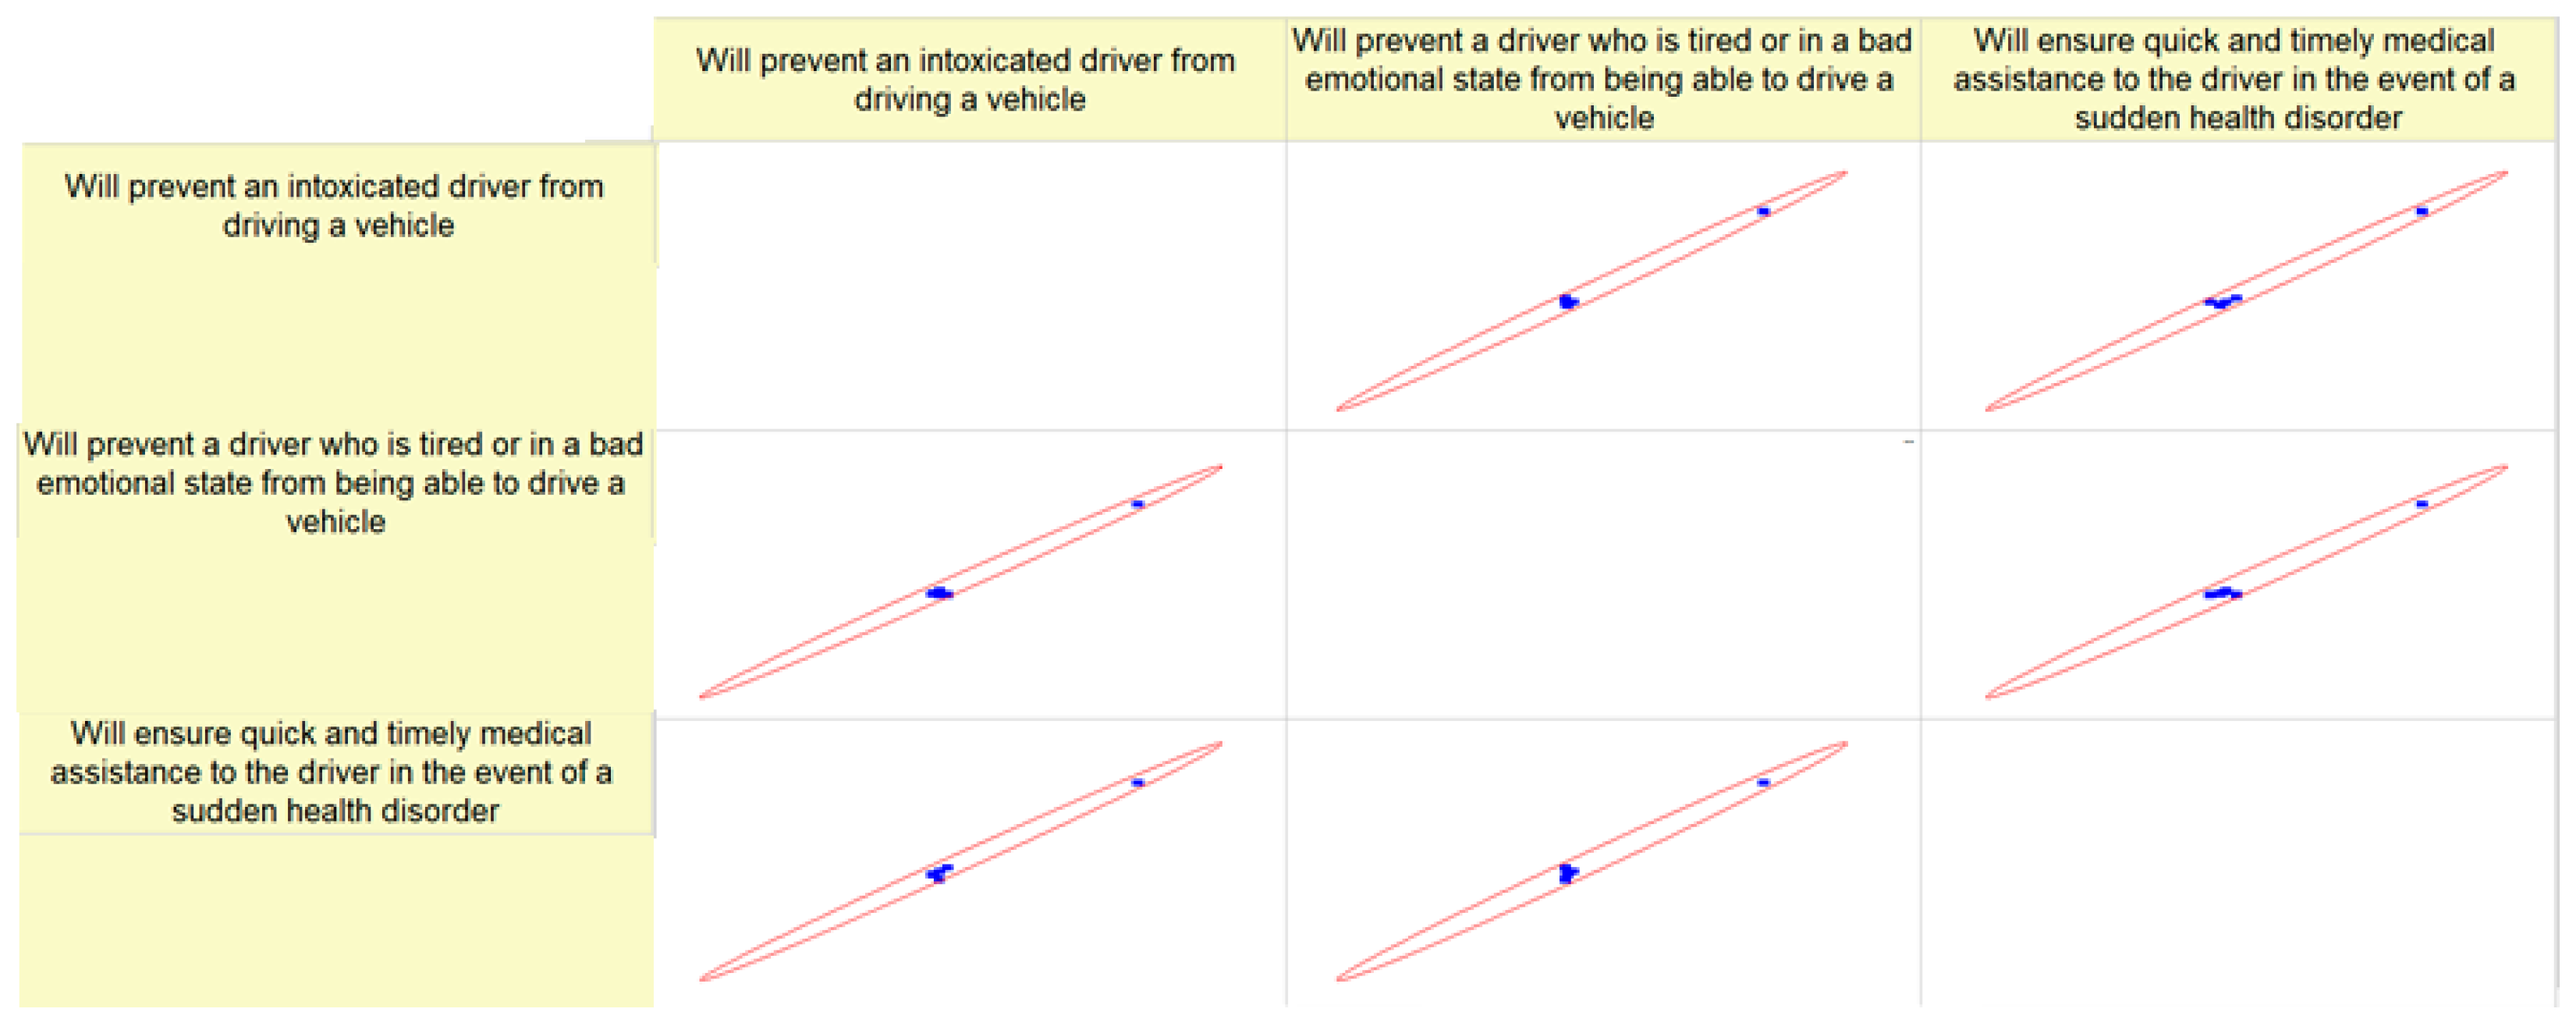
Figure 10 displays a correlation plot matrix illustrating the relationship between three safety metrics in the context of vehicles. Each figure in the matrix illustrates the connection between two safety metrics, displaying data points and a red ellipse that presumably indicates the confidence interval of the correlation. Will prohibit an inebriated driver from operating a vehicle and will prevent a motorist who is fatigued or in a negative emotional state from being capable of driving a vehicle: The figure demonstrates a robust positive correlation, as seen by the narrow, elongated ellipse and the alignment of data points along the primary axis of the ellipse. This implies that strategies that are successful in avoiding drunk driving are also successful in preventing driving when fatigued or emotionally impaired.
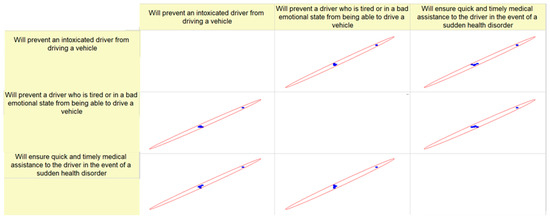
Figure 10.
Tendencies correlation when the collection, monitoring, and use of biometric data of drivers in public transport if it.
This system will effectively deter an inebriated driver from operating a car and would promptly provide necessary medical aid to the driver in case of an abrupt health ailment. The figure exhibits a robust positive connection. The slender elongated ellipse and densely grouped data points indicate a strong correlation between efforts to prevent drunk driving and the provision of prompt medical assistance for unexpected health emergencies.
“Will impede a fatigued or emotionally distressed motorist from operating a vehicle” and “Will guarantee prompt and fast medical aid to the driver in case of an abrupt health ailment”: This figure exhibits a robust positive association. The parallel alignment of the thin ellipses suggests a substantial correlation between tactics aimed at preventing driving when fatigued or emotionally distressed and the capacity to promptly give medical aid. The strong positive correlations observed in all three cases indicate that measures pertaining to a specific safety aspect of driving, such as preventing driving under the influence or providing medical assistance, are likely to be associated with improvements in other safety aspects. This can be attributed to a comprehensive safety approach within the examined system, where enhancements in one area lead to or indicate enhancements in other areas.
Table 11 displays Pearson correlation coefficients and significant values, illustrating the connections between several safety measures aimed at preventing driving under compromised situations and providing medical help to drivers. Pearson correlation coefficients: “Will inhibit an inebriated driver from operating a vehicle” and “Will hinder a motorist who is fatigued or in a negative emotional state from being capable of driving a vehicle”: The data show an exceptionally strong positive correlation (0.99669), indicating that the measures used to prevent drunk driving are almost completely associated with those aimed at preventing driving when fatigued or emotionally impaired. This system will effectively deter an inebriated individual from operating a car and would promptly provide necessary medical aid in case of an unforeseen health complication. There is another very strong positive correlation (0.99662) between initiatives to prevent drunk driving and strategies to provide medical aid for unexpected health problems, showing an almost perfect association between the two.
Table 11.
Values of Pearson’s correlation coefficient when the collection, monitoring, and use of biometric data of drivers in public transport if it.
This system will effectively incapacitate a fatigued or emotionally distressed driver, preventing them from operating a vehicle. Additionally, it will promptly provide necessary medical aid to the driver in the case of an unforeseen health complication. The data show a high positive correlation (0.99507), indicating a significant connection between efforts to avoid driving when fatigued or emotionally distressed and the provision of prompt medical help.
The significance values range from 9.05723 × 10⁻⁸ to 2.98376 × 10⁻⁷, which is much lower than the traditional threshold of 0.05. This suggests that the relationships are statistically significant and unlikely to be attributed to random chance [42]. Tendencies Summary: The data indicate that the implementation of safety measures across various scenarios is tightly interconnected and uniform. Measures that prove effective in one domain (such as deterring drunk driving) are nearly as effective in others (such as discouraging driving while fatigued or ensuring prompt medical aid), indicating the existence of a comprehensive and unified safety system. The statistical significance of these relationships emphasises their dependability and implies that they are not chance discoveries but rather indicative of a well-planned safety strategy.
5. Conclusions
There is a significant agreement among experts on the widespread use of biometric technology in public transport, as shown by the study. This partnership demonstrates trust in biometric data to enhance travel security and also signifies a shared ambition to use technology for safer and more efficient public transportation networks.
Experts actively advocate for the incorporation of biometric technology in public transport, namely for the purpose of monitoring drivers’ health and ensuring passenger safety. This integration has the potential to greatly improve the safety, efficiency, and overall quality of public transit services. Face recognition is a highly favoured method of biometric identification. The majority of experts prioritise facial recognition technology because of its apparent efficacy in guaranteeing passenger safety. Due to its non-intrusive nature and simplicity of integration into current systems, face recognition is regarded as the most feasible choice for rapid application in public transit situations.
The research demonstrates substantial positive correlations between various biometric identification approaches, suggesting that these technologies might mutually reinforce one another in improving travel security. These connections indicate the possibility of creating a multimodal biometric system that integrates many recognition approaches to provide a thorough security solution.
The statistical significance of correlations is confirmed by the low significance values obtained from the study, indicating the dependability of the correlations between various biometric approaches. The statistical resilience of these technologies highlights their potential usefulness in real-world applications, which further supports the viability of implementing a biometrically enhanced public transit system.
Expert endorsement of dual application for both drivers and passengers: The divided expert opinions on the use of biometrics for both drivers and passengers highlight the need for a comprehensive strategy to transport security. This indicates an acknowledgment of the need for not just monitoring passengers for security reasons but also monitoring drivers for health and safety considerations.
The research recognises the need to resolve data privacy issues, notwithstanding the technological viability and expert support of biometric systems. To get public support for biometric monitoring in public transit, it is crucial to clearly communicate the advantages of enhanced security and efficiency, while also maintaining a careful balance with privacy protections.
This research offers empirical evidence to support policy and management choices in the realm of public transit. The results support the integration of biometric technology into public transport systems to improve safety, efficiency, and passenger experience by showcasing their efficacy and public acceptability.
However, these studies also have limitations related to the data protection law, data legality, legal regulation, and the reliability of technological parameters. Therefore, the direction of further research could be related to the analysis of the legal base and modelling of the situation, testing the integration of biometric technologies in public transport that received the highest rating during the expert evaluation.
Author Contributions
Conceptualization, J.M., K.Č., M.P. and J.Z.; methodology, J.M., K.Č. and M.P.; software, J.M., K.Č. and M.P.; validation, J.M., K.Č., M.P. and J.Z.; formal analysis, J.M., K.Č. and M.P.; investigation, J.M., K.Č. and M.P.; resources, J.M., K.Č., M.P. and J.Z.; data curation, J.M., K.Č., M.P. and J.Z.; writing—original draft preparation, J.M., K.Č. and M.P.; writing—review and editing, J.M. and K.Č.; visualization, J.M., K.Č. and M.P.; supervision, K.Č. and M.P.; project administration, J.M. and K.Č.; funding acquisition, J.M. All authors have read and agreed to the published version of the manuscript.
Funding
This research received no external funding.
Institutional Review Board Statement
Not applicable.
Informed Consent Statement
Not applicable.
Data Availability Statement
The data could be provided after request to authors.
Conflicts of Interest
The authors declare no conflicts of interest.
References
- Beecroft, M.; Pangbourne, K. Personal security in travel by public transport: The role of traveller information and associated technologies. IET Intell. Transp. Syst. 2015, 9, 167–174. [Google Scholar] [CrossRef]
- Muaaz, M.; Chelli, A.; Gerdes, M.W.; Pätzold, M. Wi-Sense: A passive human activity recognition system using Wi-Fi and convolutional neural network and its integration in health information systems. Ann. Telecommun. 2022, 77, 163–175. [Google Scholar] [CrossRef]
- Selech, J.; Ulbrich, D.; Wlodarczyk, K.; Kowalczyk, J.; Adamkiewicz, J. The prototype of stream amplifier used in transport of polydisperse medium. Procedia Eng. 2017, 192, 777–781. [Google Scholar] [CrossRef]
- Zefreh, M.M.; Torok, A. Theoretical Comparison of the Effects of Different Traffic Conditions on Urban Road Environmental External Costs. Sustainability 2021, 13, 3541. [Google Scholar] [CrossRef]
- Rassolov, I.M.; Chubukova, S.G.; Shagieva, R.V. Problems of Legal Regulation in The Circulation with Biometric Data and Genetic Information in the Transport Sector. JPSP 2022, 6, 2003–2009. [Google Scholar]
- Nakanishi, Y.J.; Western, J. Evaluation of Biometric Technologies for Access Control at Transportation Facilities and Border Crossings. Transp. Res. Rec. 2005, 1938, 1–8. [Google Scholar] [CrossRef]
- Rybicka, I.K.; Caban, J. The Use of a Plate Conveyor for Transporting Aluminum Cans in the Food Industry. Adv. Sci. Technol. Res. J. 2020, 14, 26–31. [Google Scholar] [CrossRef]
- Schouten, B.; Jacobs, B. Biometrics and their use in e-passports. Image Vis. Comput. 2009, 27, 305–312. [Google Scholar] [CrossRef]
- Zöldy, M.; Csete, M.; Kolozsi, P.P.; Bordás, P.; Torok, A. Cognitive Sustainability. Cog. Sust. 2022, 1, 82–85. [Google Scholar] [CrossRef]
- Horkay, J.; Al-Rabeei, S.; Korba, P.; Hovanec, M.; Tymofiiv, V. Opportunities for the Use of Biometric Technology in Air Transport. In Proceedings of the 9th International Conference on Mobility, IoT and Smart Cities, Bratislava, Slovakia, 15–16 December 2022; Knapcikova, L., Zohrehvandi, S., Eds.; EAI/Springer Innovations in Communication and Computing. Springer: Cham, Switzerland, 2023. [Google Scholar] [CrossRef]
- Kasim, K.O.; Winter, S.R.; Liu, D.; Keebler, J.R.; Spence, T.B. Passengers’ perceptions on the use of biometrics at airports: A statistical model of the extended theory of planned behaviour. Technol. Soc. 2021, 67, 101806. [Google Scholar] [CrossRef]
- Khan, N.; Efthymiou, M. The use of biometric technology at airports: The case of customs and border protection (CBP). Int. J. Inf. Manag. Data Insights 2021, 1, 100049. [Google Scholar] [CrossRef]
- Teodorović, S. The Role of Biometric Applications in Air Transport Security. NBP–Nauka Bezb. Polic. 2016, 21, 139–158. [Google Scholar] [CrossRef]
- Balu, A.; Raja, K.; Thamaraiselvi, G.; Prabha, R.; Narasimman, V. Biometrics Based Bus Ticketing System. In Proceedings of the International Conference on Technological Innovations in Electronics and Management, Aurangabad, India, 26–27 February 2018. [Google Scholar]
- Achimba, T.; Iwasokun, G. Design of a Biometric-based E-Ticketing and Access Control Framework for Public Transportation. Int. J. Innov. Comp. 2023, 13, 83–90. [Google Scholar] [CrossRef]
- Heydt-Benjamin, T.S.; Chae, H.J.; Defend, B.; Fu, K. Privacy for Public Transportation. In Privacy Enhancing Technologies; PET Lecture Notes in Computer Science; Danezis, G., Ed.; Springer: Berlin/Heidelberg, Germany, 2006. [Google Scholar]
- Riaz, S.; Mushtaq, A.; Pham, H.; Mookim, S.; Phan, T. Analysis of Perceived Usability, Satisfaction and Adoption of Biometric Systems in the Public Transportation Sector of U.A.E. In Proceedings of the Third International Conference on Sustainable Computing. Advances in Intelligent Systems and Computing, Jaipur, India, 19–20 March 2021; Springer: Singapore, 2022; Volume 1404, pp. 1–12. [Google Scholar] [CrossRef]
- Chatterjee, P.; Nath, A. Biometric Authentication for UID-based Smart and Ubiquitous Services in India. In Proceedings of the Fifth International Conference on Communication Systems and Network Technologies, Gwalior, India, 4–6 April 2015; pp. 662–667. [Google Scholar] [CrossRef]
- Maeko, M.E.; van der Haar, D. A Model for Biometric Selection in Public Services Sector. In Artificial Intelligence Research. Proceedings of the SACAIR 2022. Communications in Computer and Information Science. Third Southern African Conference, SACAIR 2022, Stellenbosch, South Africa, 5–9 December 2022; Springer: Cham, Switzerland, 2022; Volume 1734, pp. 323–334. [Google Scholar] [CrossRef]
- Gupta, S.; Crispo, B. A Perspective Study Towards Biometric-based Rider Authentication Schemes For Driverless Taxis. In Proceedings of the 2019 International Conference on Innovation and Intelligence for Informatics, Computing, and Technologies (3ICT), Sakhier, Bahrain, 22–23 September 2019; pp. 1–6. [Google Scholar] [CrossRef]
- Li, S.Z.; Schouten, B.; Tistarelli, M. Biometrics at a Distance: Issues, Challenges, and Prospects. In Handbook of Remote Biometrics; Advances in Pattern Recognition; Tistarelli, M., Ed.; Springer: London, UK, 2009. [Google Scholar] [CrossRef]
- Mok, S.; Kumar, A. Addressing biometrics security and privacy related challenges in China. In Proceedings of the 2012 BIOSIG—International Conference of Biometrics Special Interest Group (BIOSIG), Darmstadt, Germany, 6–7 September 2012; pp. 1–8. [Google Scholar]
- Ryerson, M.S.; Long, C.S.; Fichman, M.; Davidson, J.H.; Scudder, K.N.; Kim, M.; Katti, R.; Poon, G.; Harris, M.D. Evaluating cyclist biometrics to develop urban transportation safety metrics. Accid. Anal. Prev. 2021, 159, 106287. [Google Scholar] [CrossRef] [PubMed]
- Zefreh, M.M.; Baranyai, D.; Torok, A. Assessing the Possibility of Presenting a Semi-Stochastic Speed-Density Function. In Proceedings of the 2016 5th International Conference on Transportation and Traffic Engineering, Lucerne, Switzerland, 6–10 July 2016; p. 5, EDP Sciences. [Google Scholar] [CrossRef]
- Lazko, I. Development of a Method for Ranking Factors That Influence the Maturity of Project Quality Management Processes. East. Eur. J. Enterp. Technol. 2018, 4, 14–28. [Google Scholar] [CrossRef]
- Deaux, E.; Callaghan, J.W. Estimating Statewide Health-Risk Behavior: A Comparison of Telephone and Key Informant Survey Approaches. Eval. Rev. 1984, 8, 467–492. [Google Scholar] [CrossRef]
- Christopoulos, D. Peer Esteem Snowballing: A Methodology for Expert Surveys; ResearchGate: Berlin, Germany, 2007. [Google Scholar]
- Sivilevičius, H.; Martišius, M. The Significance of the Factors Increasing the Asphalt Pavement Recycling Rate in the Country, Determined Using Multiple-Criteria Decision-Making Methods. Appl. Sci. 2023, 13, 12226. [Google Scholar] [CrossRef]
- Atabekov, K.; Sarymsakov, B.; Voinash, S.; Troyanovskaya, I.; Sayfutdinova, A.; Balabanova, Y. Expert Assessment of the Factors of the Impact of Road Capacity on the Environment. Transp. Res. Procedia 2023, 68, 925–930. [Google Scholar] [CrossRef]
- Čižiūnienė, K.; Matijošius, J.; Liebuvienė, J.; Sokolovskij, E. Comparison of the Relative Importance of Factors Affecting the Conveyance of Bulk and Liquid Cargo. Appl. Sci. 2024, 14, 1151. [Google Scholar] [CrossRef]
- Sokolovskij, E.; Małek, A.; Caban, J.; Dudziak, A.; Matijošius, J.; Marciniak, A. Selection of a Photovoltaic Carport Power for an Electric Vehicle. Energies 2023, 16, 3126. [Google Scholar] [CrossRef]
- Čižiūnienė, K.; Matijošius, J.; Sokolovskij, E.; Balevičiūtė, J. Assessment of Implementing Green Logistics Principles in Railway Transport: The Case of Lithuania. Sustainability 2024, 16, 2716. [Google Scholar] [CrossRef]
- Zaranka, J.; Matijosius, J.; Radvilaite, U.; Caban, J.; Dudziak, A. Establishing Emergency Sections on Land Roads in Order to Improve the Quality of Transport Services, Creating Comfortable Conditions for International and Local Traffic. Adv. Sci. Technol. Res. J. 2023, 17, 75–85. [Google Scholar] [CrossRef]
- Bortolini, A.; Miguel, L.F.F.; Becker, T. Measurement and evaluation of whole-body vibration exposure in drivers of cargo vehicle compositions. Hum. Factors Ergon. Manuf. Serv. Ind. 2018, 29, 253–264. [Google Scholar] [CrossRef]
- KilikevičIenė, K.; Skeivalas, J.; KilikevičIus, A.; Pečeliūnas, R.; Bureika, G. The analysis of bus air spring condition influence upon the vibration signals at bus frame. Eksploat. Niezawodn.—Maint. Reliab. 2015, 17, 463–469. [Google Scholar] [CrossRef]
- Kozłowski, E.; Antosz, K.; Mazurkiewicz, D.; Sep, J.; Żabiński, T. Integrating advanced measurement and signal processing for reliability decision-making. Eksploat. Niezawodn.—Maint. Reliab. 2021, 23, 777–787. [Google Scholar] [CrossRef]
- Kozłowski, E.; Borucka, A.; Oleszczuk, P.; Jałowiec, T. Evaluation of the maintenance system readiness using the semi-Markov model taking into account hidden factors. Eksploat. Niezawodn.—Maint. Reliab. 2023, 25, 172857. [Google Scholar] [CrossRef]
- Kozłowski, E.; Borucka, A.; Świderski, A. Application of the logistic regression for determining transition probability matrix of operating states in the transport systems. Eksploat. Niezawodn.—Maint. Reliab. 2020, 22, 192–200. [Google Scholar] [CrossRef]
- Warguła, Ł.; Kukla, M.; Krawiec, P.; Wieczorek, B. Reduction in Operating Costs and Environmental Impact Consisting in the Modernization of the Low-Power Cylindrical Wood Chipper Power Unit by Using Alternative Fuel. Energies 2020, 13, 2995. [Google Scholar] [CrossRef]
- Kozłowski, E.; Antosz, K.; Sęp, J.; Prucnal, S. Integrating Sensor Systems and Signal Processing for Sustainable Production: Analysis of Cutting Tool Condition. Electronics 2024, 13, 185. [Google Scholar] [CrossRef]
- Flügel, S.; Veisten, K.; Rizzi, L.I.; de Dios Ortúzar, J.; Elvik, R. A comparison of bus passengers’ and car drivers’ valuation of casualty risk reductions in their routes. Accid. Anal. Prev. 2019, 122, 63–75. [Google Scholar] [CrossRef]
- Borucka, A.; Kozłowski, E.; Antosz, K.; Parczewski, R. A New Approach to Production Process Capability Assessment for Non-Normal Data. Appl. Sci. 2023, 13, 6721. [Google Scholar] [CrossRef]


Disclaimer/Publisher’s Note: The statements, opinions and data contained in all publications are solely those of the individual author(s) and contributor(s) and not of MDPI and/or the editor(s). MDPI and/or the editor(s) disclaim responsibility for any injury to people or property resulting from any ideas, methods, instructions or products referred to in the content. |
© 2024 by the authors. Licensee MDPI, Basel, Switzerland. This article is an open access article distributed under the terms and conditions of the Creative Commons Attribution (CC BY) license (https://creativecommons.org/licenses/by/4.0/).