
Investigating the Energy Potential and Degradation Kinetics of Nine Organic Substrates: Promulgating Sustainability in Developing Economies


Abstract
1. Introduction
2. Materials and Methods
2.1. Experimental Materials
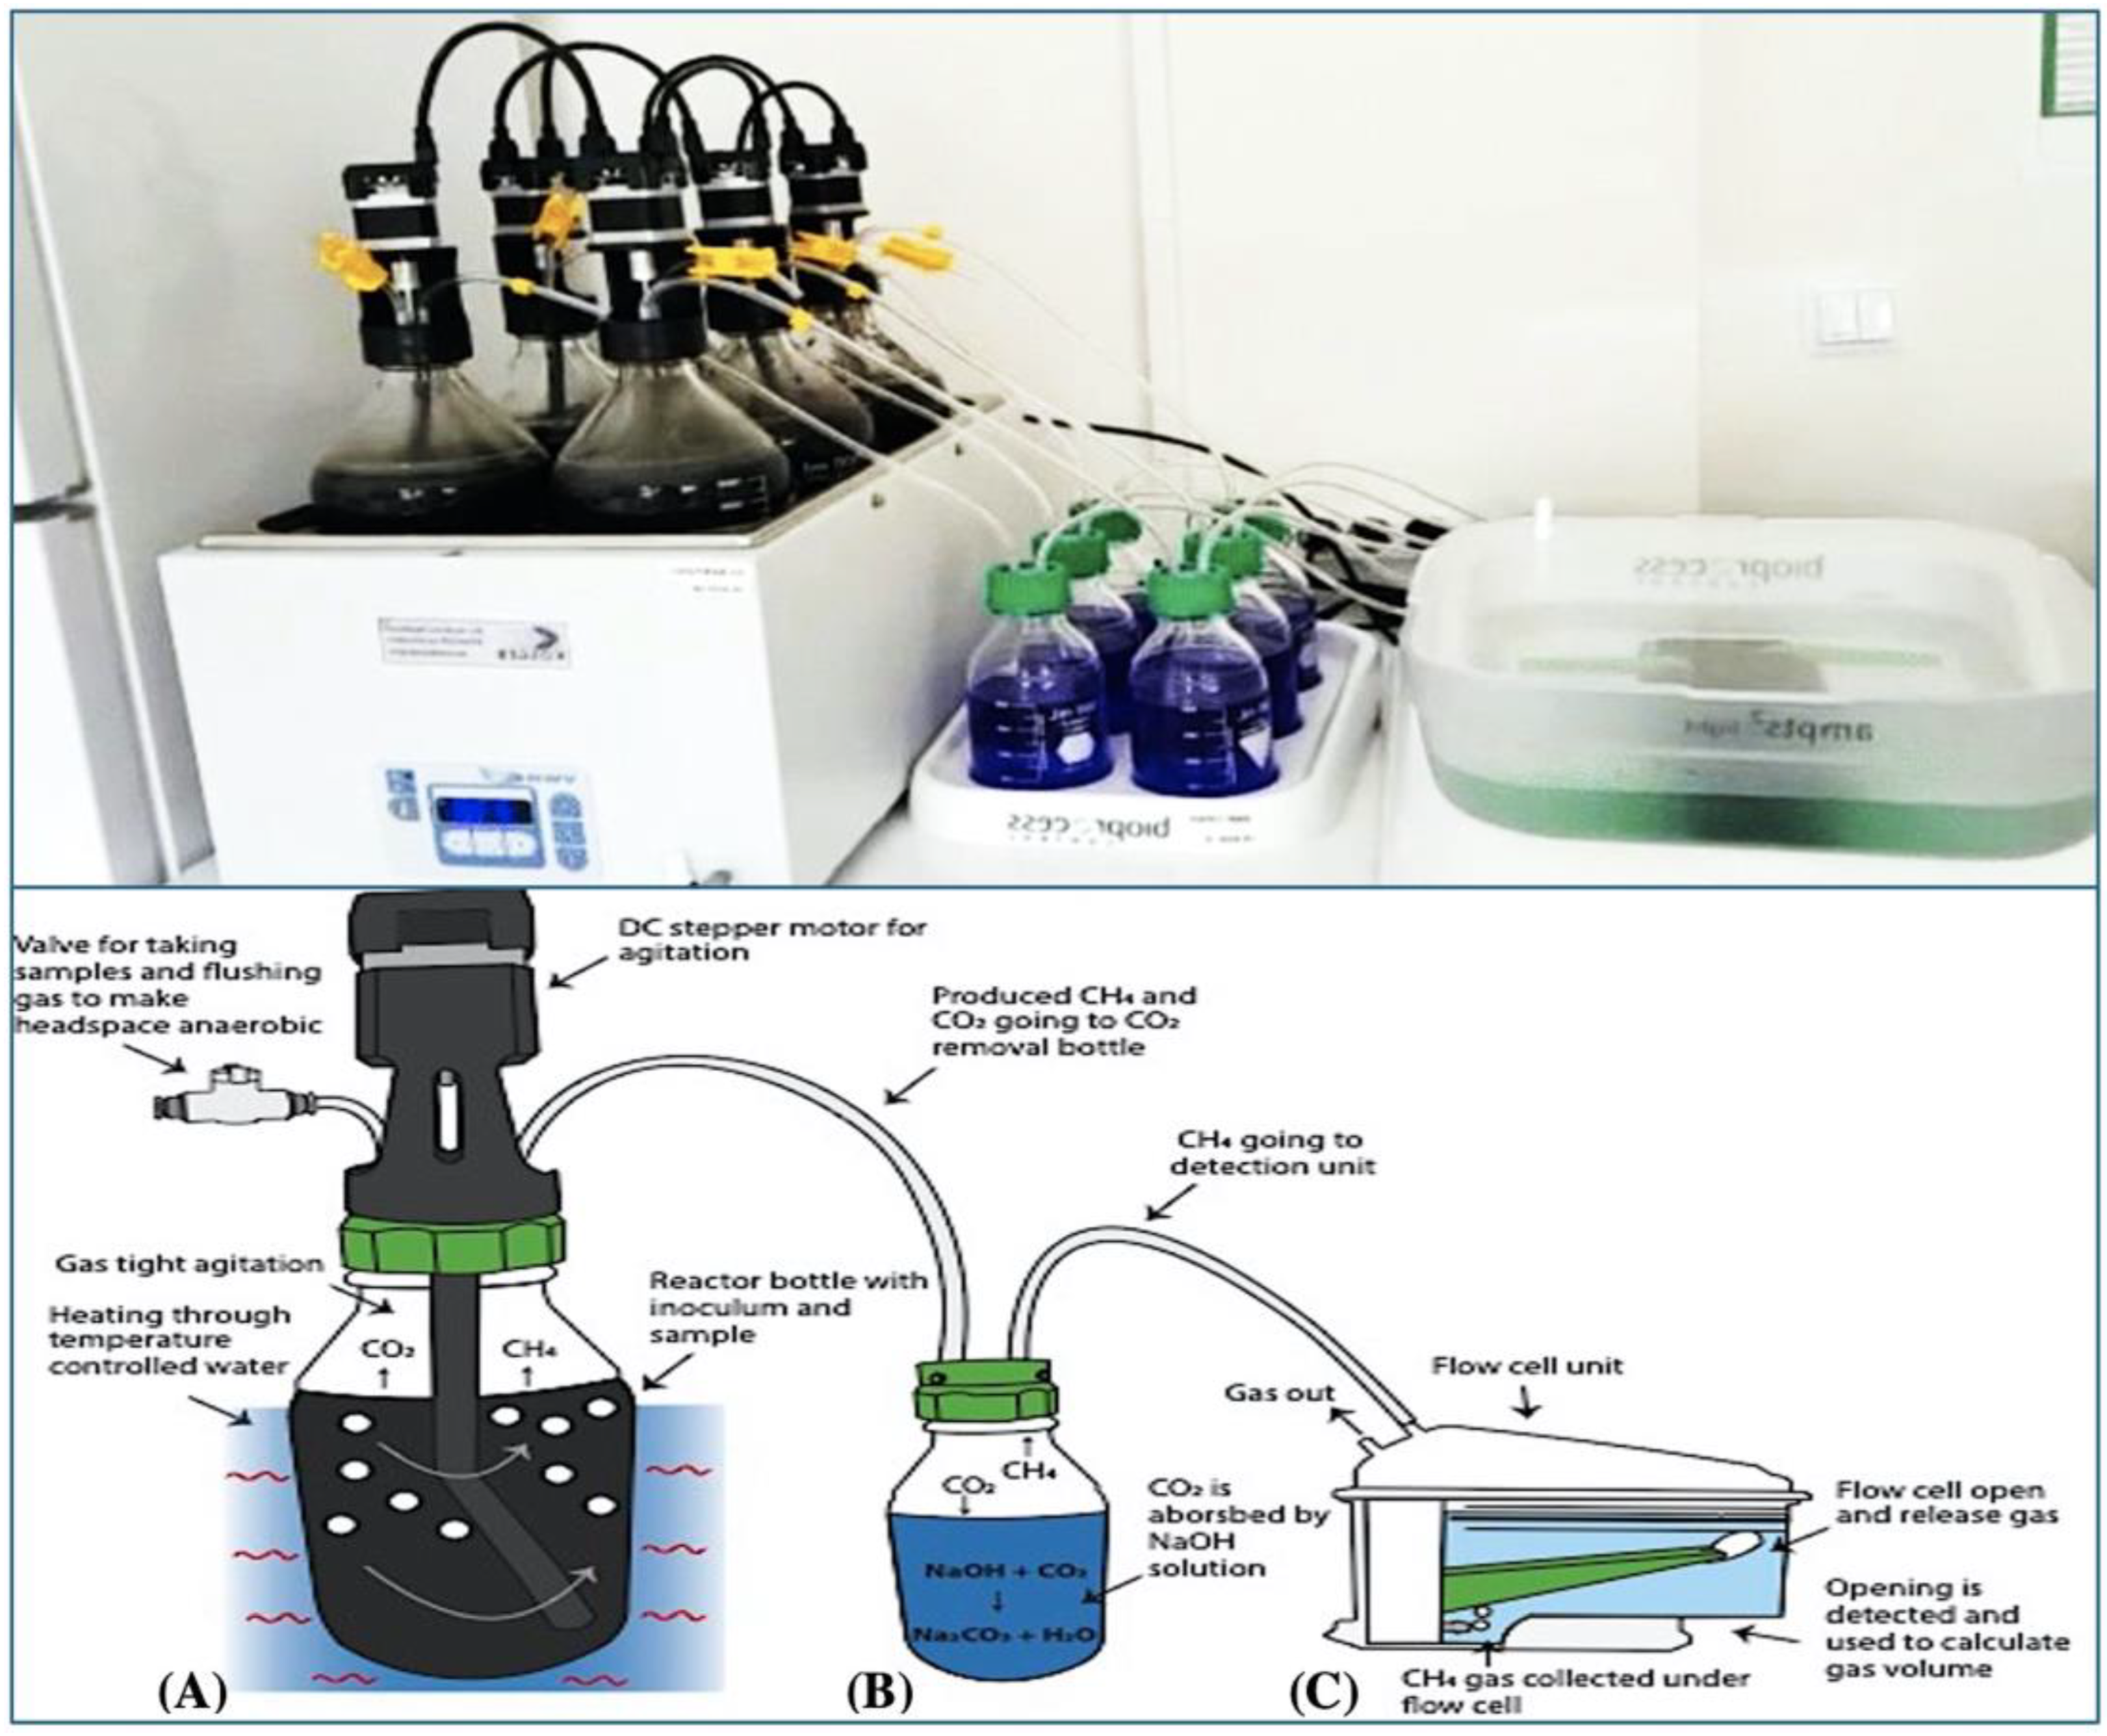
2.2. Experimental Procedure
2.3. Analytic Procedure
3. Results
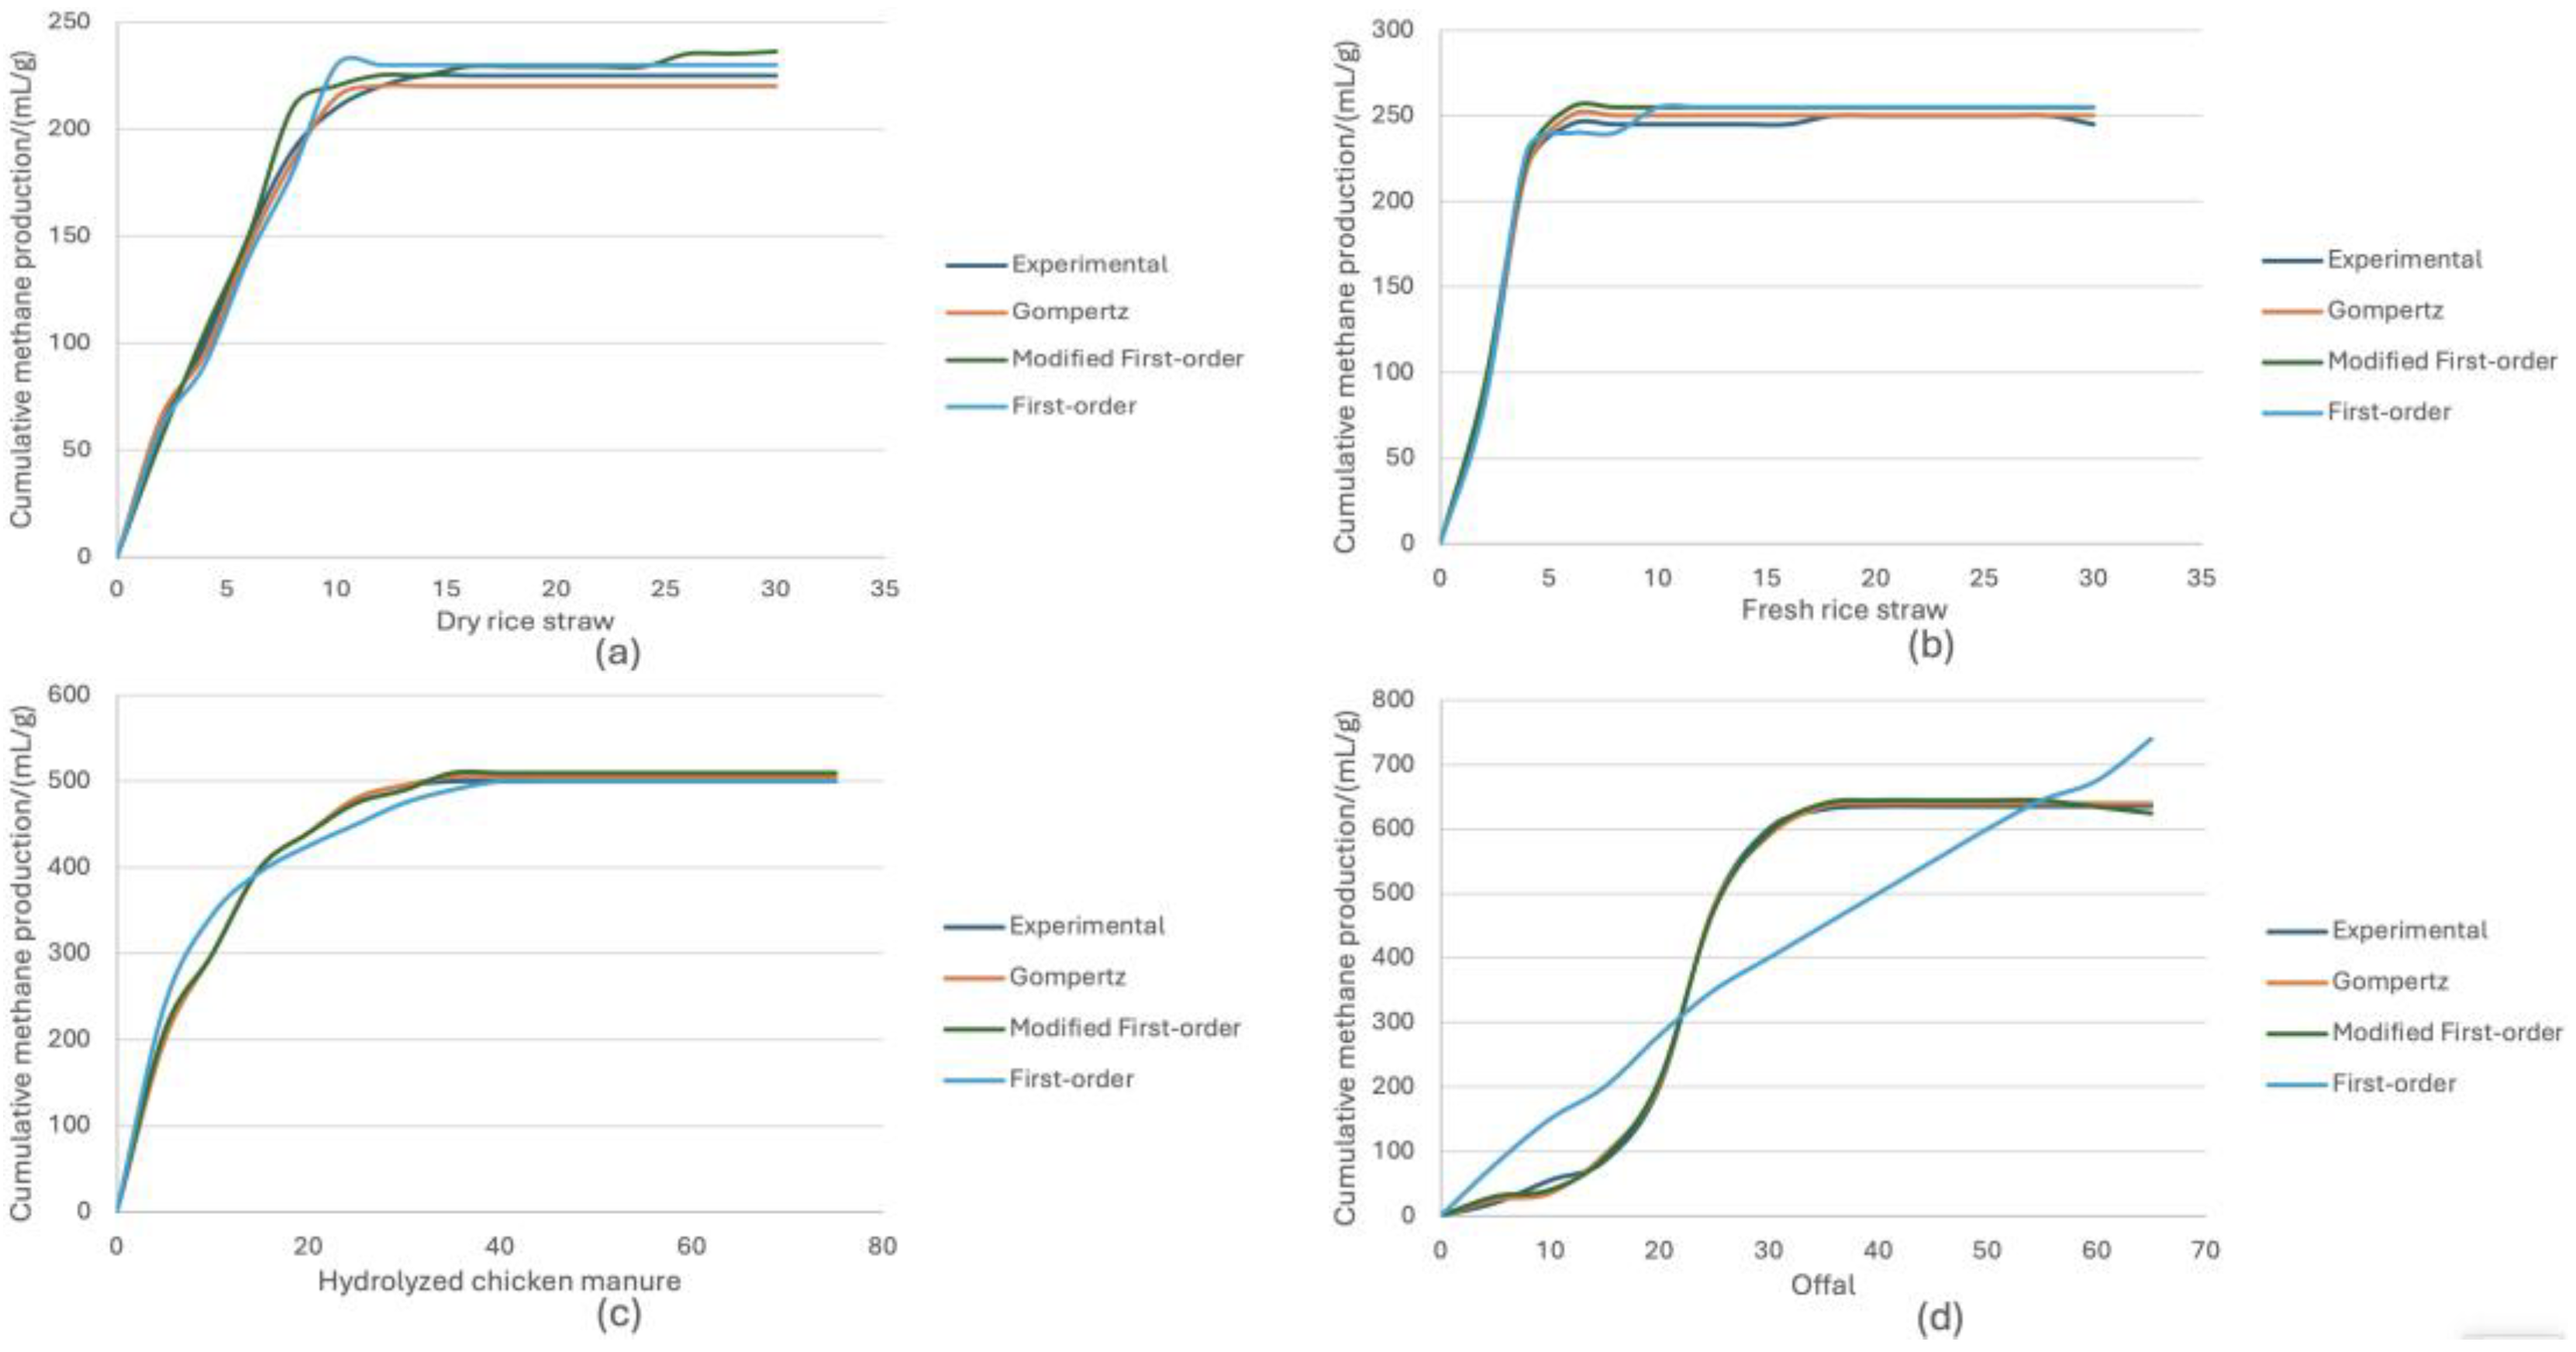
3.1. Methane Potential and Cumulative Methane Potential Curve Model Fitting for Different Materials
3.2. Determination of BMP Values for Selected Materials—BMP1%
4. Discussion
- It relatively shortens the experiment time.
- It provides a quantifiable standard for BMP determination, not relying on subjective operator judgment, making it more objective.
- BMP1% compares BMP values at the same fermentation level, facilitating comparison experiment results with different fermentation times.
5. Conclusions
Author Contributions
Funding
Institutional Review Board Statement
Informed Consent Statement
Data Availability Statement
Conflicts of Interest
References
- Onu, P.; Mbohwa, C. Agricultural Waste Diversity and Sustainability Issues: Sub-Saharan Africa as a Case Study; Elsevier Science: Amsterdam, The Netherlands, 2021; ISBN 9780323854023. [Google Scholar]
- Yusuf, A.A.; Peter, O.; Hassan, A.S.; Tunji, L.A.; Oyagbola, I.A.; Mustafa, M.M.; Yusuf, D.A. Municipality Solid Waste Management System for Mukono District, Uganda. Procedia Manuf. 2019, 35, 613–622. [Google Scholar] [CrossRef]
- Rodriguez, C.; Alaswad, A.; Benyounis, K.Y.; Olabi, A.G. Pretreatment Techniques Used in Biogas Production from Grass. Renew. Sustain. Energy Rev. 2016, 68, 1193–1204. [Google Scholar] [CrossRef]
- Onu, P.; Mbohwa, C.; Pradhan, A. Artificial Intelligence-Based IoT-Enabled Biogas Production. In Proceedings of the 2023 International Conference on Control, Automation and Diagnosis, ICCAD, Rome, Italy, 10–12 May 2023. [Google Scholar]
- Rego, A.S.C.; Leite, S.A.F.; Leite, B.S.; Grillo, A.V.; Santos, B.F. Artificial Neural Network Modelling for Biogas Production in Biodigesters. Chem. Eng. Trans. 2019, 74, 25–30. [Google Scholar] [CrossRef]
- Aklilu, E.G.; Waday, Y.A. Optimizing the Process Parameters to Maximize Biogas Yield from Anaerobic Co-Digestion of Alkali-Treated Corn Stover and Poultry Manure Using Artificial Neural Network and Response Surface Methodology. Biomass Convers. Biorefin. 2021, 13, 12527–12540. [Google Scholar] [CrossRef]
- Muñoz, R.; Meier, L.; Diaz, I.; Jeison, D. A Review on the State-of-the-Art of Physical/Chemical and Biological Technologies for Biogas Upgrading. Rev. Environ. Sci. Bio/Technol. 2015, 14, 727–759. [Google Scholar] [CrossRef]
- Mao, C.; Feng, Y.; Wang, X.; Ren, G. Review on Research Achievements of Biogas from Anaerobic Digestion. Renew. Sustain. Energy Rev. 2015, 45, 540–555. [Google Scholar] [CrossRef]
- Filer, J.; Ding, H.H.; Chang, S. Biochemical Methane Potential (BMP) Assay Method for Anaerobic Digestion Research. Water 2019, 11, 921. [Google Scholar] [CrossRef]
- Fang, X.; Li, Q.; Lin, Y.; Lin, X.; Dai, Y.; Guo, Z.; Pan, D. Screening of a Microbial Consortium for Selective Degradation of Lignin from Tree Trimmings. Bioresour. Technol. 2018, 254, 247–255. [Google Scholar] [CrossRef] [PubMed]
- Sawant, S.S.; Salunke, B.K.; Kim, B.S. Degradation of Corn Stover by Fungal Cellulase Cocktail for Production of Polyhydroxyalkanoates by Moderate Halophile Paracoccus Sp. LL1. Bioresour. Technol. 2015, 194, 247–255. [Google Scholar] [CrossRef]
- Maile, I.; Muzenda, E.; Mbohwa, C.; Al, E. Biochemical Methane Potential of OFMSW for City of Johannesburg. In Proceedings of the International Conference on Biology, Environment and Chemistry, San Francisco, CA, USA, 26–28 October 2016. [Google Scholar]
- Njuguna Matheri, A.; Mbohwa, C.; Ntuli, F.; Belaid, M.; Seodigeng, T.; Catherine Ngila, J.; Kinuthia Njenga, C. Waste to Energy Bio-Digester Selection and Design Model for the Organic Fraction of Municipal Solid Waste. Renew. Sustain. Energy Rev. 2018, 82, 1113–1121. [Google Scholar] [CrossRef]
- Jacob, S.; Banerjee, R. Modeling and Optimization of Anaerobic Codigestion of Potato Waste and Aquatic Weed by Response Surface Methodology and Artificial Neural Network Coupled Genetic Algorithm. Bioresour. Technol. 2016, 214, 386–395. [Google Scholar] [CrossRef]
- Nwaigwe, K.N.; Agarwal, A.; Anyanwu, E.E. Biogas Potentials Evaluation of Household Wastes in Johannesburg Metropolitan Area Using the Automatic Methane Potential Test System (AMPTS) II. In Proceedings of the ASME 2018 12th International Conference on Energy Sustainability, Lake Buena Vista, FL, USA, 24–28 June 2018. [Google Scholar]
- Onu, P.; Pradhan, A.; Mbohwa, C. The Potential of Industry 4.0 for Renewable Energy and Materials Development—The Case of Multinational Energy Companies. Heliyon 2023, 9, e20547. [Google Scholar] [CrossRef] [PubMed]
- Rashama, C.; Ijoma, G.N.; Matambo, T.S. Elucidating Biodegradation Kinetics and Biomethane Potential Trends in Substrates Containing High Levels of Phytochemicals: The Case of Avocado Oil Processing By-products. Waste Biomass Valorization 2022, 13, 2071–2081. [Google Scholar] [CrossRef]
- Kaur, H.; Kommalapati, R.R. Biochemical Methane Potential and Kinetic Parameters of Goat Manure at Various Inoculum to Substrate Ratios. Sustainability 2021, 13, 12806. [Google Scholar] [CrossRef]
- Koch, K.; Hafner, S.D.; Astals, S.; Weinrich, S. Evaluation of Common Supermarket Products as Positive Controls in Biochemical Methane Potential (BMP) Tests. Water 2020, 12, 1223. [Google Scholar] [CrossRef]
- Cabrita, T.M.; Santos, M.T. Biochemical Methane Potential Assays for Organic Wastes as an Anaerobic Digestion Feedstock. Sustainability 2023, 15, 11573. [Google Scholar] [CrossRef]
- Li, P.; Li, W.; Sun, M.; Xu, X.; Zhang, B.; Sun, Y. Evaluation of Biochemical Methane Potential and Kinetics on the Anaerobic Digestion of Vegetable Crop Residues. Energies 2019, 12, 26. [Google Scholar] [CrossRef]
- Rahimi, E.; Liu, S.; Wang, M. Investigation of Methane-Rich Gas Production from the Co-Bioconversion of Coal and Anaerobic Digestion Sludge. Fuel 2024, 357, 129565. [Google Scholar] [CrossRef]
- Montalvo, S.; Vielma, S.; Borja, R.; Huiliñir, C.; Guerrero, L. Increase in Biogas Production in Anaerobic Sludge Digestion by Combining Aerobic Hydrolysis and Addition of Metallic Wastes. Renew. Energy 2018, 123, 541–548. [Google Scholar] [CrossRef]
- Kovalev, A.A.; Kovalev, D.A.; Zhuravleva, E.A.; Laikova, A.A.; Shekhurdina, S.V.; Vivekanand, V.; Litti, Y.V. Biochemical Hydrogen Potential Assay for Predicting the Patterns of the Kinetics of Semi-Continuous Dark Fermentation. Bioresour. Technol. 2023, 376, 128919. [Google Scholar] [CrossRef]
- Shitophyta, L.M.; Arnita, A.; Wulansari, H.D.A. Evaluation and Modelling of Biogas Production from Batch Anaerobic Digestion of Corn Stover with Oxalic Acid. Res. Agric. Eng. 2023, 69, 151–157. [Google Scholar] [CrossRef]
- Omondi, E.A.; Ndiba, P.K.; Chepkoech, G.K.; Kegode, A.A. Modeling Anaerobic Co-Digestion of Water Hyacinth with Ruminal Slaughterhouse Waste for First Order, Modified Gompertz and Logistic Kinetic Models. Int. J. Renew. Energy Dev. 2023, 12, 627–634. [Google Scholar] [CrossRef]
- Boluda-Aguilar, M.; López-Gómez, A. Production of Bioethanol by Fermentation of Lemon (Citrus Limon L.) Peel Wastes Pretreated with Steam Explosion. Ind. Crops Prod. 2013, 41, 188–197. [Google Scholar] [CrossRef]
- Dong, C.; Chen, J. Optimization of Process Parameters for Anaerobic Fermentation of Corn Stalk Based on Least Squares Support Vector Machine. Bioresour. Technol. 2019, 271, 174–181. [Google Scholar] [CrossRef] [PubMed]
- Han, M.; Kang, K.E.; Kim, Y.; Choi, G.-W. High Efficiency Bioethanol Production from Barley Straw Using a Continuous Pretreatment Reactor. Process Biochem. 2013, 48, 488–495. [Google Scholar] [CrossRef]
- Xia, X.; Zhang, L. Industrial Energy Systems in View of Energy Efficiency and Operation Control. Annu. Rev. Control 2016, 42, 299–308. [Google Scholar] [CrossRef]
- Feng, C.; Gao, X.; Wu, J.; Tang, Y.; He, J.; Qi, Y.; Zhang, Y. Greenhouse Gas Emissions Investigation for Towns in China: A Case Study of Xiaolan. J. Clean. Prod. 2015, 103, 130–139. [Google Scholar] [CrossRef]
- Yusuf, A.A.; Inambao, F.L. Bioethanol Production from Different Matooke Peels Species: A Surprising Source for Alternative Fuel. Case Stud. Therm. Eng. 2019, 13, 100357. [Google Scholar] [CrossRef]


| Types of Substrates | TS/% | VS/% | Added Inoculum/g | Added Substrate/g | Added Inoculum VS/g | Added Substrate VS/g |
|---|---|---|---|---|---|---|
| Inoculum | 2.81 ± 0.41 | 1.43 ± 0.43 | 400 | 0 | 5.57 | 0 |
| Fresh rice straw | 23.72 ± 0.49 | 21.954 ± 0.42 | 376.89 | 12.09 | 5.42 | 2.76 |
| Dry rice straw | 15.10 ± 0.51 | 13.41 ± 0.53 | 370.04 | 17.94 | 5.34 | 2.72 |
| Maize stalk | 30.09 ± 0.56 | 29.43 ± 1.73 | 387.48 | 10.50 | 5.44 | 2.78 |
| Maize leaf | 79.35 ± 0.98 | 81.85 ± 0.21 | 383.51 | 4.47 | 5.52 | 2.81 |
| Soybean straw | 93.32 ± 2.27 | 92.37 ± 1.32 | 383.99 | 3.99 | 5.53 | 2.81 |
| Food waste | 11.44 ± 0.46 | 9.45 ± 0.98 | 358.60 | 29.38 | 5.18 | 2.64 |
| Chicken offal | 27.62 ± 1.44 | 26.33 ± 3.35 | 377.31 | 10.63 | 5.44 | 2.76 |
| Chicken feather | 38.42 ± 1.37 | 27.21 ± 2.54 | 377.68 | 10.01 | 5.45 | 2.78 |
| Hydrolyzed chicken manure | 5.38 ± 0.83 | 2.71 ± 0.57 | 310.34 | 77.64 | 4.53 | 2.31 |
| Cellulose | Animal Manure | Fat and Protein | ||||||||
|---|---|---|---|---|---|---|---|---|---|---|
| Models | Parameters | Dry rice | Maize leaf | Fresh rice | Soybean straw | Maize stalk | Hydrolyzed chicken manure | Chicken Feathers | Food waste | Chicken offal |
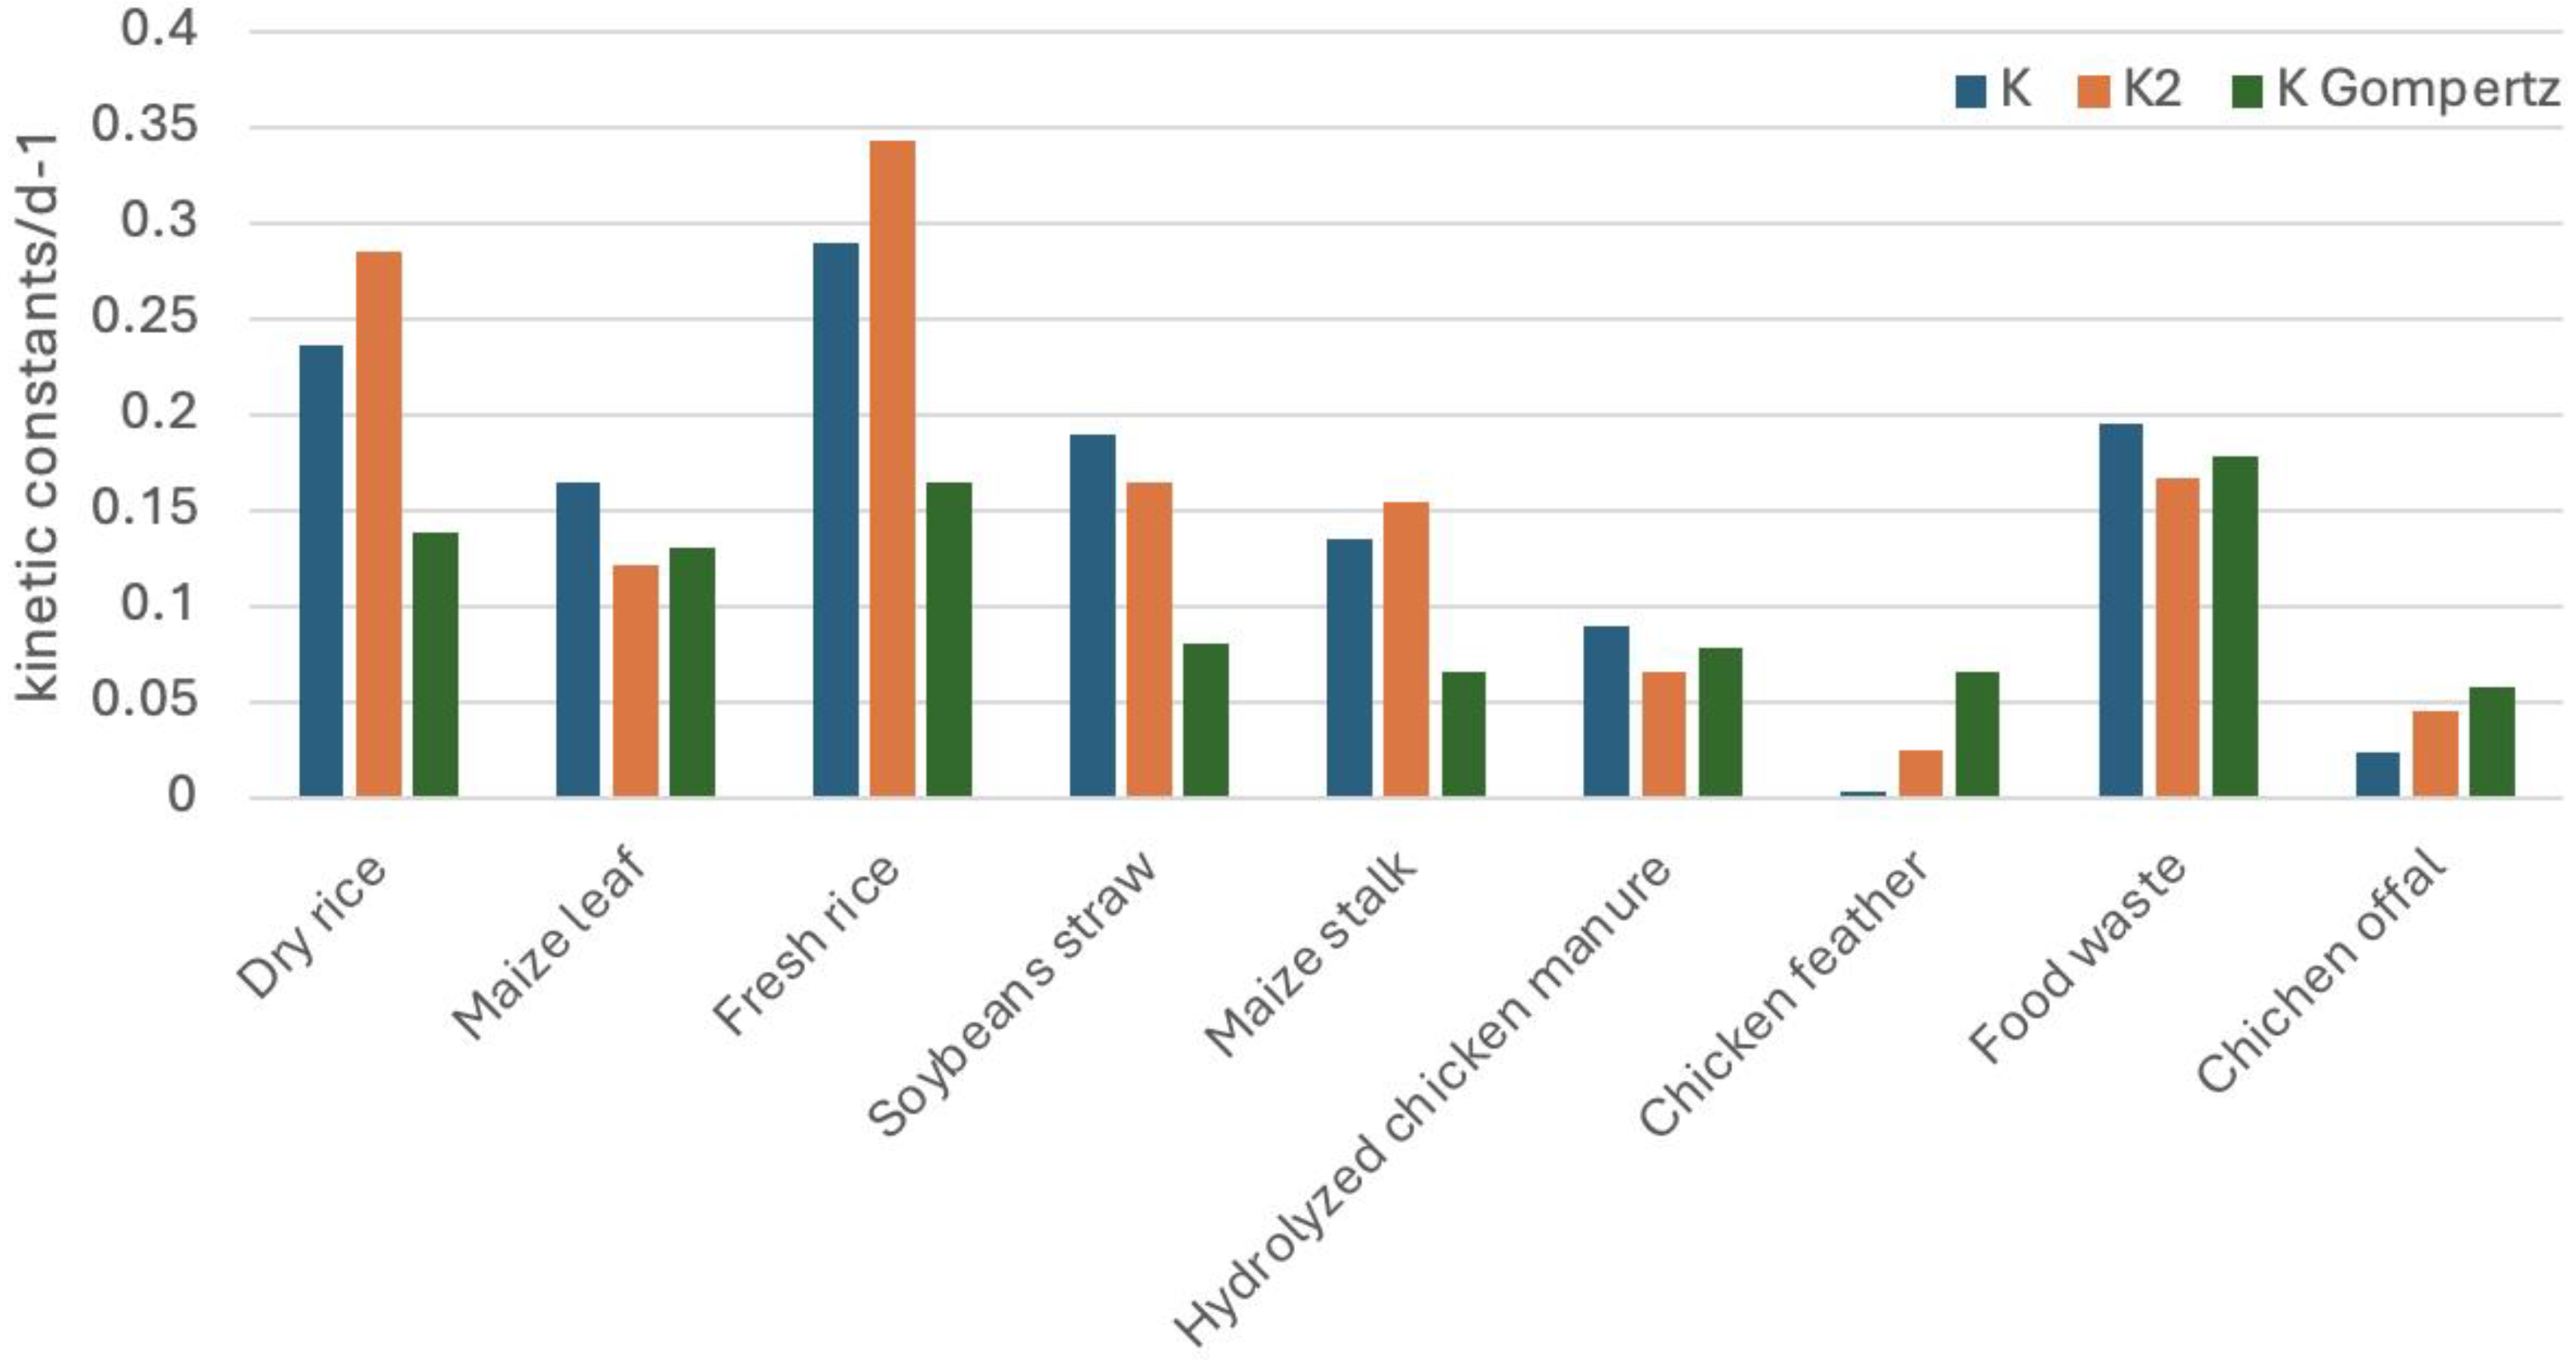
| First-order | BMP∞/(mL·g−1) | 229.20 | 259.00 | 256.80 | 321.02 | 334.90 | 542.40 | 3.75E05 | 687.40 | 1324.00 |
| k/d−1 | 0.227 | 0.150 | 0.243 | 0.177 | 0.101 | 0.085 | 2.1E-05 | 0.181 | 0.013 | |
| R2 | 0.9712 | 0.9600 | 0.9875 | 0.9308 | 0.9882 | 0.7340 | 0.8122 | 0.9663 | 0.9532 | |
| RMSE | 4.93 | 12.37 | 8.02 | 9.44 | 8.97 | 74.57 | 107.6 | 39.10 | 80.01 | |
| Modified first-order | BMP∞/(mL·g−1) | 235.20 | 249.10 | 255.01 | 314.90 | 393.80 | 474.60 | 109.06 | 605.50 | 341.70 |
| k/d−1 | 0.264 | 0.123 | 0.350 | 0.159 | 0.199 | 0.058 | 0.014 | 0.137 | 0.023 | |
| R2 | 0.9833 | 0.9975 | 0.9396 | 0.9559 | 0.995 | 0.9950 | 0.9441 | 0.9862 | 0.9213 | |
| RMSE | 1.89 | 3.29 | 3.57 | 5.74 | 6.09 | 9.99 | 27.32 | 25.62 | 17.18 | |
| Gompertz | BMP∞/(mL·g−1) | 221.20 | 251.10 | 250.30 | 322.90 | 325.20 | 524.70 | 585.70 | 651.90 | 649.70 |
| Rm/(mL·g−1·d−1) | 29.93 | 31.29 | 43.87 | 25.70 | 18.2 | 40.28 | 31.04 | 93.48 | 30.21 | |
| kGompertz/d−1 | 0.141 | 0.129 | 0.716 | 0.079 | 0.060 | 0.079 | 0.065 | 0.148 | 0.051 | |
| R2 | 0.8993 | 0.9947 | 0.8991 | 0.9283 | 0.9720 | 0.9970 | 0.8599 | 0.9924 | 0.9209 | |
| RMSE | 2.90 | 4.77 | 9.54 | 12.47 | 14.17 | 8.24 | 32.44 | 19.00 | 21.64 | |
| Daily Biogas < 1% | Test End | BMP1%/% | Reduced Fermentation Time/% | |||
|---|---|---|---|---|---|---|
| BMP1%/ (mL·g−1) | Fermentation Time/d | BMP/ (mL·g−1) | Fermentation Time/d | |||
| Dry rice | 234.14 | 17 | 241.23 | 33 | 97.01 | 48.48 |
| Maize leaf | 241.01 | 16 | 257.58 | 41 | 93.59 | 60.98 |
| Fresh rice | 253.34 | 15 | 271.48 | 30 | 93.32 | 50.00 |
| Soybean straw | 321.40 | 24 | 338.11 | 33 | 95.10 | 27.27 |
| Maize stalk | 305.80 | 26 | 339.27 | 42 | 90.13 | 38.10 |
| Hydrolyzed chicken manure | 508.41 | 19 | 532.47 | 68 | 95.48 | 72.06 |
| Chicken feathers | 510.10 | 35 | 553.18 | 65 | 92.21 | 46.15 |
| Food waste | 630.70 | 12 | 646.80 | 18 | 97.21 | 33.33 |
| Chicken offal | 621.32 | 46 | 691.23 | 63 | 89.88 | 26.98 |
Disclaimer/Publisher’s Note: The statements, opinions and data contained in all publications are solely those of the individual author(s) and contributor(s) and not of MDPI and/or the editor(s). MDPI and/or the editor(s) disclaim responsibility for any injury to people or property resulting from any ideas, methods, instructions or products referred to in the content. |
© 2024 by the authors. Licensee MDPI, Basel, Switzerland. This article is an open access article distributed under the terms and conditions of the Creative Commons Attribution (CC BY) license (https://creativecommons.org/licenses/by/4.0/).
Share and Cite
Onu, P.; Pradhan, A. Investigating the Energy Potential and Degradation Kinetics of Nine Organic Substrates: Promulgating Sustainability in Developing Economies. Sustainability 2024, 16, 5101. https://doi.org/10.3390/su16125101
Onu P, Pradhan A. Investigating the Energy Potential and Degradation Kinetics of Nine Organic Substrates: Promulgating Sustainability in Developing Economies. Sustainability. 2024; 16(12):5101. https://doi.org/10.3390/su16125101
Chicago/Turabian StyleOnu, Peter, and Anup Pradhan. 2024. "Investigating the Energy Potential and Degradation Kinetics of Nine Organic Substrates: Promulgating Sustainability in Developing Economies" Sustainability 16, no. 12: 5101. https://doi.org/10.3390/su16125101
APA StyleOnu, P., & Pradhan, A. (2024). Investigating the Energy Potential and Degradation Kinetics of Nine Organic Substrates: Promulgating Sustainability in Developing Economies. Sustainability, 16(12), 5101. https://doi.org/10.3390/su16125101