Article

Deactivation Patterns of Potassium-Based γ-Alumina Dry Sorbents for CO2 Capture

1
Department of Chemical Engineering, Kyungpook National University, 80 Daehakro, Bukgu, Daegu 41566, Republic of Korea
2
Research Institute of Advanced Energy Technology, Kyungpook National University, 80 Daehakro, Bukgu, Daegu 41566, Republic of Korea
*
Authors to whom correspondence should be addressed.
Sustainability 2024, 16(12), 5117; https://doi.org/10.3390/su16125117
Submission received: 30 April 2024 / Revised: 30 May 2024 / Accepted: 11 June 2024 / Published: 16 June 2024

Abstract

:
Gamma-alumina (γ-Al2O3) is an essential support material in dry sorbents used to capture CO2 from flue gas. This study explores the deactivation of potassium-based γ-Al2O3 sorbents due to by-products such as KAl(CO3)(OH)2 during CO2 capture. We synthesized sorbents with K2CO3 loadings of 5, 10, 20, and 30 wt% and subjected them to repeated capture and regeneration cycles. The results show significant variations in the deactivation degree: the sorbent with 5 wt% K2CO3 exhibited a 100% deactivation rate, while the 30 wt% variant showed a markedly reduced rate of 44.6%. These findings highlight the impact of the formation of KAl(CO3)(OH)2 at the interface between K2CO3 and γ-Al2O3 on sorbent deactivation. An equation that can be used to predict the final CO2 capture capacity based on the ratio of active material to support was proposed using these results.

1. Introduction

Carbon dioxide (CO2), a principal greenhouse gas, is predominantly released into the atmosphere through the combustion of fossil fuels [1]. Its accumulation is a significant contributor to global warming, presenting a grave environmental challenge with potentially catastrophic repercussions. As such, effective strategies for CO2 capture from flue and waste gas streams are critically needed to mitigate its impact. Traditional methods, including membrane separation, solvent capture, and molecular sieve capture, have been extensively employed for this purpose, albeit with associated drawbacks such as high operational costs and considerable energy demands [2,3,4,5,6,7]. In response to these challenges, the chemical capture of CO2 using dry regenerable sorbents has emerged as a promising alternative. The solid sorbent-based CO2 capture process has been studied extensively in recent years as a cost-effective and efficient CO2 capture technology [8,9]. This approach is heralded for its potential cost-effectiveness and energy efficiency, positioning it as a compelling option for CO2 capture [8,10,11,12,13,14,15,16,17,18,19]. The CO2 capture capability of the sorbent, which is based on 35 wt% K2CO3 as the active material and uses various raw materials including gamma alumina as supports, was measured over time during long-term operation in a 10 MW scale dry CO2 capture facility. Initially, it demonstrated a high capture capacity of 66.7 mg CO2/g sorbent, but after 150 days, this capacity decreased to 23.2 mg CO2/g sorbent, indicating that more than 60% of the sorbent had been deactivated [20,21,22]. This suggests that the inclusion of gamma alumina among the various sorbents could have contributed to the deactivation of K2CO3. These findings provide an important benchmark for evaluating the long-term operational performance and stability of sorbents in dry CO2 capture processes. Among various materials, γ-Al2O3 is recognized for its critical role as a support or additive in the development of dry sorbents for CO2 capture from flue gases [15,23,24,25,26]. Nonetheless, the application of γ-Al2O3-based sorbents, particularly those incorporating K2CO3, is impeded by issues of deactivation through the formation of undesired by-products like KAl(CO3)(OH)2 during CO2 capture [10,23]. This study is dedicated to exploring the deactivation mechanism of potassium-based γ-Al2O3 sorbents in the context of CO2 capture. By preparing sorbents with varied K2CO3 loadings (5, 10, 20, and 30 wt%) and subjecting them to repeated capture–regeneration cycles, our aim was to dissect the relationship between K2CO3 loading and sorbent deactivation. This investigation is intended to shed light on the chemical intricacies at play, particularly focusing on the impact of potassium presence on the surface of γ-Al2O3 and its role in by-product formation and consequent sorbent deactivation. Our empirical findings underscore a notable correlation between potassium loading and the reduced incidence of sorbent deactivation during CO2 capture. This observation suggests that side reactions involving potassium are instrumental in influencing by-product formation and thereby modulating sorbent deactivation. Extrapolating from these results, we propose a model for predicting the CO2 capture capacity of potassium-based γ-Al2O3 sorbents based on the ratio of active material to support. The insights gleaned from this study are pivotal for the rational design and optimization of CO2 capture materials, heralding advancements in the efficiency and sustainability of CO2 capture technologies.

2. Materials and Methods

The alkali metal-based sorbent used in this study was prepared by the impregnation method. A typical preparation procedure for the sorbent supported on γ-Al2O3 (Aldrich (Seoul, Republic of Korea), 99%) was as follows: Specific amounts of γ-Al2O3 were added to a solution containing the desired ratio of anhydrous potassium carbonate (K2CO3, Aldrich) in 25 mL of deionized water. The amounts used for each compound were as follows: 9.5 g of γ-Al2O3 and 0.5 g of K2CO3 for 5KAlI, 9.0 g of γ-Al2O3 and 1.0 g of K2CO3 for 10KAlI, 8.0 g of γ-Al2O3 and 2.0 g of K2CO3 for 20KAlI, and 7.0 g of γ-Al2O3 and 3.0 g of K2CO3 for 30KAlI. Then, the content was mixed with a magnetic stirrer for 24 h at room temperature [7,9,18,23]. After stirring, the mixture was dried in a rotary evaporator at 60 °C. The dried samples were calcined in a furnace with N2 flow (100 mL/min) for 6 h at 400 °C. The ramping rate of the temperature was maintained at 5 °C/min [27,28]. The sorbents are denoted as follows: 5KAlI, 10KAlI, 20KAlI, and 30KAlI where K represents K2CO3, Al represents γ-Al2O3 (Aldrich), I denote the impregnation method, and 5, 10, 20, and 30 represents the K2CO3 loaded. The amount of alkali metal impregnated was identified by using inductively coupled plasma–atomic emission spectrometry (ICP-AES; GBC Scientific (Keysborough, Australia), Integra KL) Power X-ray diffraction (XRD; Philips (Amsterdam, The Netherlands), X’PERT) at the Korea Basic Science Institute (Daegu, Republic of Korea) was also carried out in order to confirm the structure using Cu Kα radiation. The TPD experiment was conducted in a nitrogen atmosphere, and the sample was heated from 100 °C to 500 °C at a heating rate of 1 °C/min.
CO2 capture and regeneration processes were performed in a fixed-bed quartz reactor with a diameter of 0.75 in, which was placed in an electric furnace under atmospheric pressure. Half (0.5) a gram of the sorbent was packed into the reactor, and space velocity (SV) was maintained at 3000 h−1 to minimize severe pressure drops and channeling phenomena. All volumetric gas flows were measured under standard temperature and pressure (STP) conditions. The conditions of CO2 capture and regeneration and the composition of mixed gases are shown in Table 1. Outlet gases from the reactor were automatically analyzed every 4 min by a thermal conductivity detector (TCD; Donam Systems Inc., Deajeon, Republic of Korea), which was equipped with Porapak Q (1/8 in. stainless).
The CO2 capture capacity was calculated from the CO2 breakthrough curve, which indicates the amount of CO2 captured until the output concentration of CO2 reaches 10 vol%, which is the same as the inlet concentration. The CO2 capture capacity is determined by the amount of CO2 captured per 1 g of sorbent (mg CO2/g sorbent). The CO2 capture capacity was calculated according to Equation (1) as follows:
CO 2   capture   capacity = ( P × V C O 2 R × T × M C O 2 × t ,   mg ) / ( g   sorbent ) ( P Pressure   of   CO 2   ( Pa ,   Pascal ) ;   V C O 2 Volume   of   CO 2   ( m 3 ) ;   R Gas   constant   ( J / ( mol · K ) ) ; T Temperature   ( K ,   Kelvin ) ;   M C O 2 Molar   mass   of   C O 2 ( g / mol ) ;   t Time   ( s ,   seconds ) )

3. Results

3.1. CO2 Capture Capacity of 5KAlI, 10KAlI, 20KAlI, and 30KAlI Sorbents

Figure 1 shows the breakthrough curves of the sorbents after one to five cycles. The 5KAlI, 10KAlI, 20KAlI, and 30KAlI sorbents were prepared usingK2CO3 loading 5, 10, 20 and 30, respectively. In the cases of the 5KAlI, 10KAlI, 20KAlI, and 30KAlI sorbents, the breakthrough times were approximately 0, 4, 8, and 12 min, respectively. It can be seen that the breakthrough time of one cycle increases in proportion to the amount of K2CO3 loaded. However, a noticeable degradation in the capture performance was observed with subsequent cycles. Specifically, the 5KAlI and 10KAlI sorbents exhibited a negligible capture capacity beyond the second cycle. Furthermore, the breakthrough time of the 20KAlI sorbent significantly decreased to 4–8 min in subsequent cycles, down from an initial 16 min. Similarly, the 30KAlI sorbent experienced a reduction in its breakthrough time to approximately 12 min from an initial 28 min, indicating a loss of more than half of its capture capacity.
Figure 2 shows the CO2 capture capacities of the 5KAlI, 10KAlI, 20KAlI, and 30KAlI sorbents during the multiple tests for sorption (60 °C) and regeneration (200 °C). The CO2 capture capacities of the sorbents were calculated from the breakthrough curves during multiple tests. The CO2 capture capacities of the 5KAlI, 10KAlI, 20KAlI, and 30KAlI sorbents decreased after two cycles. In the cycle results after two cycles, the reduction decreases and the capture capacity converges. The capture capacities after one cycle were 15.8, 30.5, 60.3, and 88.2 mg CO2/g sorbent for the 5KAlI, 10KAlI, 20KAlI, and 30KAlI sorbents, respectively. The final capture capacities were 0, 2.0, 24.9, and 50.4 mg CO2/g sorbents for the 5KAlI, 10KAlI, 20KAlI, and 30KAlI sorbents, respectively. And you can see that the capture capacity remains constant as the cycle continues. Therefore, it can be assumed that the capture capacity after five cycles is the final capture capacity. The 30KAlI sorbent’s performance is consistent with the results reported in references [6,10].

3.2. Deactivation Degree According to K2CO3 Loading Amount

Figure 3a shows the amount of CO2 captured per 1 g of sorbent during 1 cycle (I) and 5 cycles (II) as a function of the loading amount of K2CO3. In both cases, the total CO2 capture capacity of the sorbent increased with the loading amount of K2CO3. In order to investigate the effects of the loadings of K2CO3 on the total CO2 capture capacities of the sorbents in detail, the amount of CO2 captured per 1 g of K2CO3 was calculated from Figure 3a. These results are shown in Figure 3b. The theoretical value of the sorbent, which was calculated from moles of K2CO3 involved in the sorbent, was 3.18 mg CO2/g K2CO3 as shown in Figure 3b. The theoretical value of the sorbent was calculated from the number of moles of K2CO3 contained in the sorbent when 1 mole of K2CO3 captures a stoichiometric amount equivalent to 1 mole of CO2. The initial capture capacity was similar to the theoretical value, but the final capture capacity was found to fall short of the theoretical value. In particular, the initial capture capacity and the CO2 capture capacity of the 5KAlI and 10KAlI sorbents were confirmed to be approximately 95 to 100% of the theoretical value (3.18 mg CO2/g K2CO3). However, during regeneration, the sorbent was not regenerated and the capture ability was almost lost. The initial CO2 capture capacity of the 20KAlI and 30KAlI sorbents was confirmed to be approximately 92–95% of the theoretical value, and the final capture capacities were 38% and 57%. The area (I) shown in Figure 2a,b shows the difference between the initial capture capacity and the final capture capacity. As shown in Figure 3a, the gap in the CO2 capture amount decreased per 1 g of the 5KAl, 10KAl, 20Kal, and 30KAl sorbents. However, if you look at the graph in Figure 3b showing the decrease in the amount of CO2 captured per g K2CO3, you can see that as the loading amount of K2CO3 increases, the CO2 captured per g K2CO3 decreases. Based on this area (I), the deactivation degree of each sorbent was calculated and is shown in Table 2. The formula for calculating the degree of deactivation is Equation (2) as follows:
Degree   of   deactivation   ( % )   =   [ ( Initial   capture   capacity Final   capture   capacity ) / Initial   capture   capacity ] × 100
An analysis of Table 2 reveals that the deactivation degrees of the 5KAlI, 10KAlI, 20KAlI, and 30KAlI sorbents were 100%, 76.6%, 62.0%, and 44.6%, respectively. It can be seen that the degree of deactivation decreases depending on the K2CO3 loading amount, and the amount that it decreases also appears to gradually decrease. This observation hints at the layered deposition of K2CO3 on the γ-Al2O3 support during sorbent manufacturing. Moreover, it implies potential surface reactions between alumina and K2CO3, contributing to the regeneration process. Consequently, achieving complete regeneration at a temperature of 200 °C may be challenging due to the intricate nature of these surface interactions.

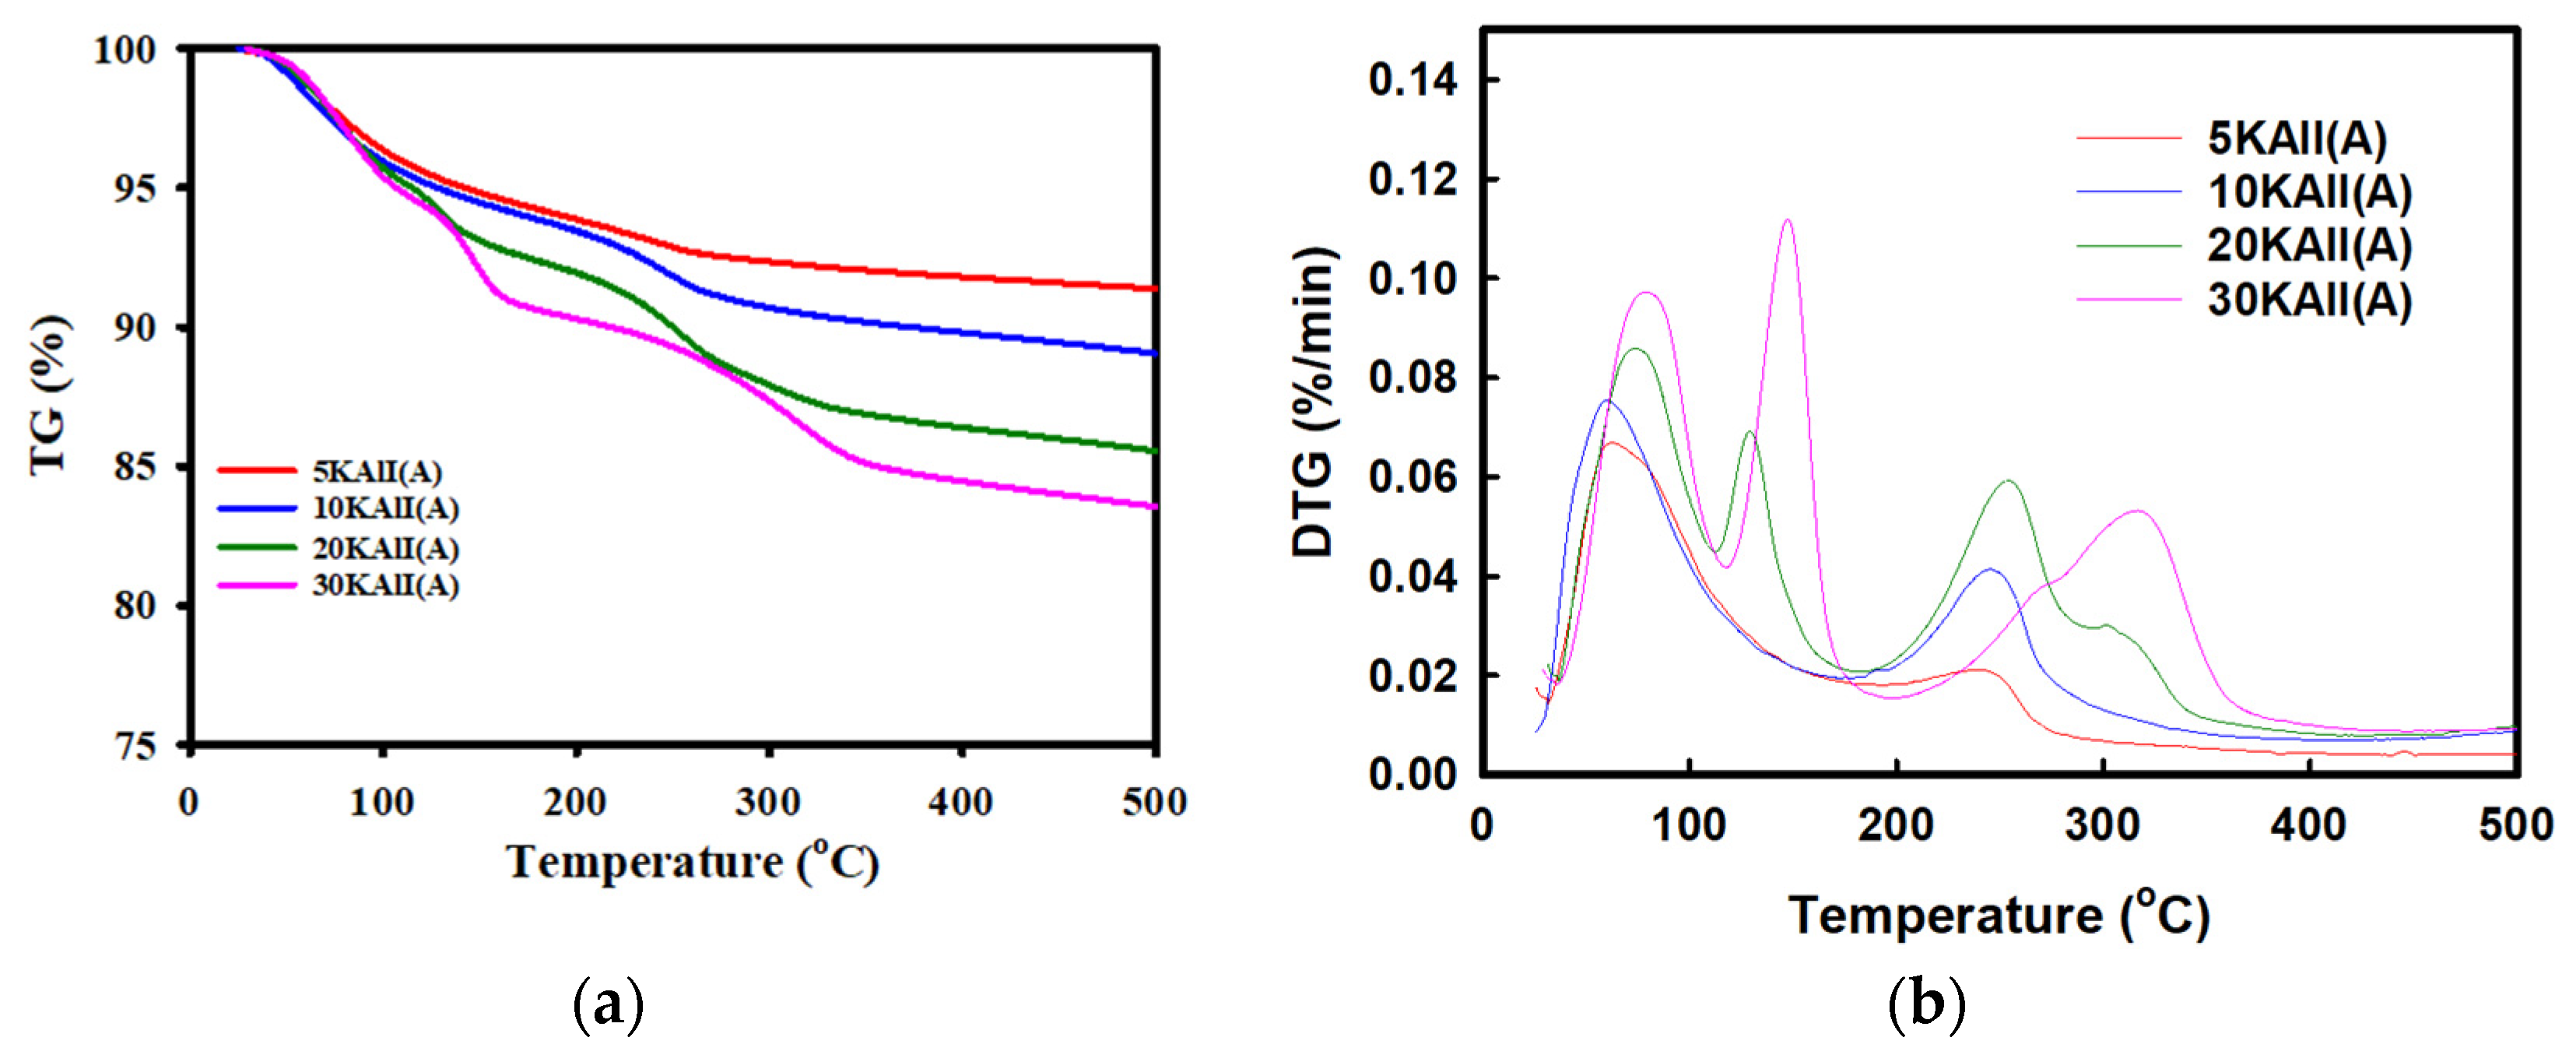
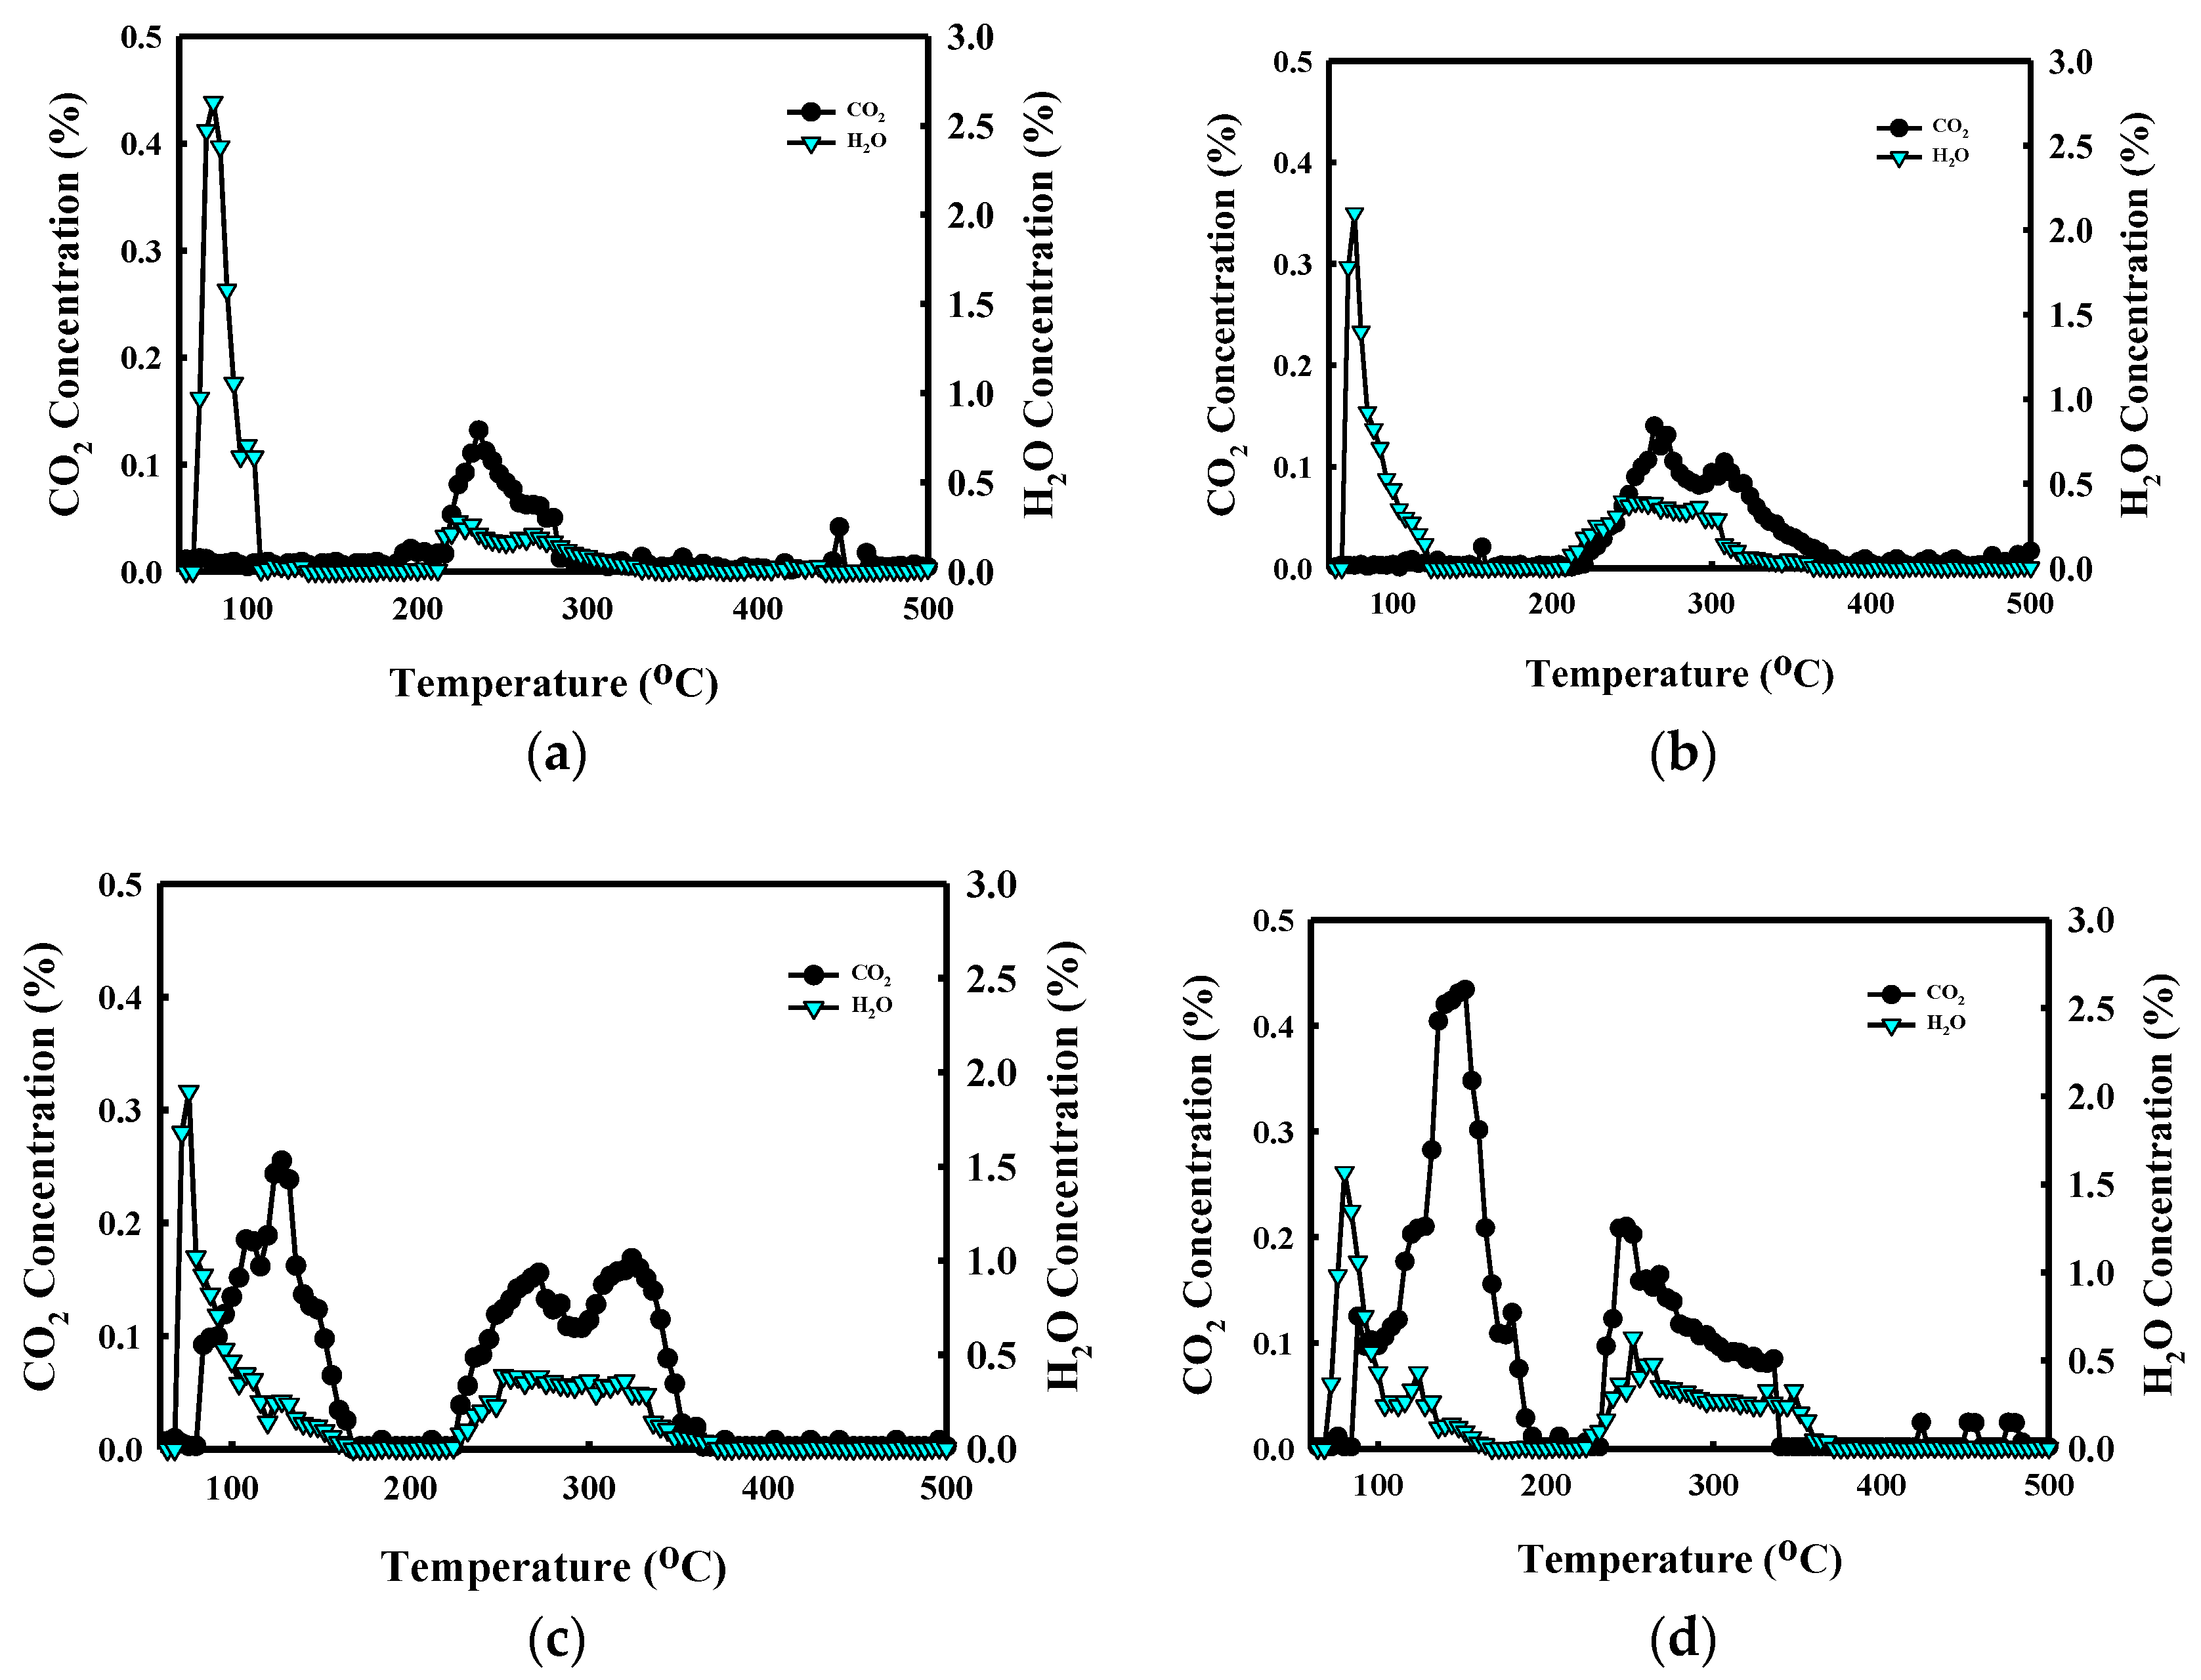
3.3. Structure Identification of the 5–30KAlI Sorbents

Figure 4 shows XRD patterns of structural changes in fresh 5KAlI, 10KAlI, 20KAlI, and 30KAlI sorbents and the sorbents after being regenerated at 200 °C. In the case of the sorbents before the reaction, only peaks in K2CO3 (JCPDS No. 16-0820) and γ-Al2O3 (JCPDS No. 10-0425) were observed, and it can be seen that the peaks become sharper as the loading amount of K2CO3 increases. In the case of the sorbents that were regenerated at 200 °C, KAl(CO3)(OH)2 (JCPDS No. 15-3303) peaks can be seen in addition to the K2CO3 and γ-Al2O3 peals [24,29]. Also, in the case of K2CO3∙1.5H2O (JCPDS No. 11-0655) and K4H2(CO3)3∙1.5H2O, K2CO3 and water vapor will react and act like active species [28,30,31]. When CO2 is captured, a phase change in K2CO3 and γ-Al2O3 occurs in the form of KAl(CO3)(OH)2. These results also imply that KAl(CO3)(OH)2 is not converted to its original active substance, K2CO3. Therefore, as the cycle test continues, the CO2 capture capacity of the sorbents can be seen to decrease. These results suggest that by-products such as KAl(CO3)(OH)2 are influenced by the structure of alumina and that the regeneration ability of potassium-based alumina sorbents is directly related to the by-products.

3.4. Physical Properities of the 5–30KAlI Sorbents According to BET

The study rigorously examines the impact of varying K2CO3 loadings on the physical properties of K2CO3/γ-Al2O3 sorbents, as depicted in Table 3 and Figure 5. This examination zeroes in on two crucial characteristics: the Brunauer–Emmett–Teller (BET) specific surface area and the Barrett–Joyner–Halenda (BJH) pore volume. A conspicuous trend that is discernible from Table 2 highlights a reciprocal relationship between the increase in K2CO3 sorbent loading and both the BET specific surface area and BJH pore volume. The initial results for the γ-Al2O3 support stood at 158.74 m2/g and 0.296 cc/g for BET surface area and BJH pore volume, respectively. It was observed that, with escalating K2CO3 loadings, these values inversely diminished. Specifically, the sorbent labeled as 5KAlI showcased the highest BET surface area and BJH pore volume at 150.5 m2/g and 0.270 cc/g, respectively. Contrary to the expected reduction in the capture capacity due to diminished surface area and pore volume, the 10KAlI sorbents showed enhanced CO2 capture capabilities when compared to the 5KAlI samples. This paradoxical finding suggests that the concentration of K2CO3 plays a pivotal role in augmenting the sorbents’ capture efficiency, surpassing the effects of surface area and pore volume reductions. Moreover, the 30KAlI sorbents exhibited markedly reduced BET surface areas and BJH pore volumes, recorded at 60.56 m2/g and 0.117 cc/g, respectively. This indicates a shift in the capture mechanism towards chemical interactions at higher K2CO3 loadings. Further elucidation are provided by the pore size distribution analysis presented in Figure 6. A noticeable decline in porosity was observed with increasing K2CO3 loading, particularly impacting the medium to large pores within the size range of 3.5 to 5.0 nm. Among the analyzed variants, the 5KAlI sorbents demonstrated the most significant peak in the rate of pore volume change, underscoring their superior ability to retain larger pore volumes. This thorough analysis elucidates the complex interplay between K2CO3 loading and the physicochemical properties of K2CO3/γ-Al2O3 sorbents, offering insights into their intricate effects on CO2 capture performance. Based on these results, the relationship between the BET surface area value and CO2 capture capacity in various alumina phases will be revealed in a future paper.

3.5. Surface Morphology of the 5–30KAlI Sorbents According to SEM

Figure 6a shows an image of the fresh sorbents indicating that K2CO3 is uniformly distributed on the surface of γ-Al2O3 in a needle-like structure. As the amount of K2CO3 increases, these needle-like structures appear to be more densely packed. S. Toufigh Bararpour et al. (2019) [26] also showed that K2CO3 exhibits a needle-like structure as it is loaded. Figure 6b shows an image of the spent sorbents after use. Compared to the fresh sorbents in Figure 6a, the spent sorbents exhibit significant morphological changes. The needle-like structures of K2CO3 on γ-Al2O3 appear to be less dense and more irregular. These alterations in morphology suggest a decline in the sorbent’s reactivity and efficiency over time.

3.6. Regeneration Properties of the 5–30KAlI Sorbents

TGA and DTG were conducted on the spent 5–30KAlI sorbents after five cycles of CO2 adsorption. These analyses were performed across a temperature spectrum of 20 to 500 °C at a ramp rate of 5 °C/min, as depicted in Figure 7. The initial reduction in weight is attributable to the desorption of H2O. Both the TGA and DTG results identified two pronounced mass loss regions, at approximately 100–200 °C and 250–400 °C. According to prior studies, these regions are indicative of the desorption of KHCO3 and the decomposition of KAl(CO3)(OH)2 [23,27]. Specifically, in the DTG curve (Figure 7b), there is an absence of peaks for the 5KAlI and 10KAlI sorbents within the 100–200 °C range, whereas the peaks for the 20KAlI and 30KAlI sorbents are prominent, with the 30KAlI peak being markedly larger than its 20KAlI counterpart. At elevated temperatures, ranging from 250 to 400 °C, all of the sorbents exhibited peaks, with the magnitude of mass loss being amplified in conjunction with increased K2CO3 loadings. This observation suggests the desorption of CO2 and H2O from the decomposition of KAl(CO3)(OH)2.
In this study, the results of the TPD experiments conducted using the 5–30KAlI sorbents are presented in Figure 8. These experiments facilitated a deeper understanding of the sorbent’s regeneration characteristics. The TPD curves were measured by heating at a rate of 1 °C per minute in a N2 atmosphere to analyze the desorption characteristics of CO2 and H2O. This methodology enabled a precise determination of the decomposition temperatures of the KHCO3 and KAl(CO3)(OH)2 structures, the desorption temperature of H2O, and the amounts of CO2 and H2O desorbed at each temperature. The accuracy of the TG and DTG results was corroborated by a GC analysis, which confirmed the clear separation of the CO2 and H2O peaks. The data obtained from these experiments are invaluable for optimizing the regeneration process of the KAlI5–30 sorbents. The TPD results for the 5KAlI and 10KAlI sorbents displayed a single peak between 250 and 400 °C, whereas the 20KAlI and 30KAlI sorbents exhibited two peaks within the 100 to 400 °C range. The peak between 100 and 200 °C corresponds to CO2 desorption from the decomposition of KHCO3 (Equation (3)), and the peak between 250 and 350 °C results from the decomposition of KAl(CO3)(OH)2 (Equation (4)). In the case of sorbents with a lower K2CO3 content, such as 5KAlI and 10KAlI, the decomposition of KAl(CO3)(OH)2 structures leads to CO2 desorption. For adsorbents with a higher K2CO3 content, like 20KAlI and 30KAlI, the decomposition of both the KHCO3 and KAl(CO3)(OH)2 structures produced CO2 peaks. Furthermore, the decomposition of the KHCO3 and KAl(CO3)(OH)2 structures, as described by the following equations, resulted in H2O peaks observed at 100 °C and between 100 °C to 200 °C and 250 to 400 °C, respectively:
2KHCO3 → K2CO3+ CO2 + H2O
2KAl(CO3)(OH)2 → K2CO3 + Al2O3 + CO2 + 2H2O
The decomposition of KHCO3 and KAl(CO3)(OH)2 occurs, respectively, at 100 °C to 200 °C and 250 °C to 400 °C. Notably, as K2CO3 loading increases, the CO2 peak from KHCO3 decomposition also increases proportionally; however, the difference in the size of the CO2 peak from KAl(CO3)(OH)2 decomposition is relatively minor. This supports the observation that deactivation decreases with increasing K2CO3 loading at a regeneration temperature of 200 °C, as illustrated in Figure 3. Additionally, complete regeneration of γ-Al2O3-based sorbents is possible at temperatures above 400 °C. The desorption capacities obtained from these TPD results can be quantified as follows: the desorption capacity is 16.2, 30.5, 61.1, and 88.5 mg CO2/g sorbent for the 5KAlI, 10KAlI, 20KAlI, and 30KAlI sorbents, respectively. These figures closely match the CO2 capture capacities shown in Figure 2. The calculated desorption capacities between 250 °C to 400 °C for one cycle are 16.2, 30.5, 40.1, and 44.5 mg CO2/g sorbent for the 5KAlI, 10KAlI, 20KAlI, and 30KAlI sorbents, respectively. These results are nearly identical to the difference between the initial and final capture capacities shown in Figure 3, indicating a decrease in the absorption capacity due to the non-decomposition of KAl(CO3)(OH)2 at 200 °C.
Table 4 presents a quantitative evaluation of the thermal stability and desorption properties of the 5KAlI, 10KAlI, 20KAlI, and 30KAlI sorbents evaluated after five CO2 capture cycles. The data are categorized into two temperature ranges, below approximately 200 °C (I) and between 250 and 400 °C (II), with mass loss and CO2 and H2O desorption observed in the TGA and TPD analyses. The amount of desorption was expressed as a percentage of the amount of CO2 and H2O desorbed per g sorbent for easy comparison. In the lower temperature range (I), the observed mass loss was predominantly associated with the desorption of physically adsorbed water and the decomposition of KHCO3. Conversely, in the higher temperature range (II), the desorption ratios of CO2 to H2O were approximately in a 2:1 molar ratio, suggesting that the mass loss was primarily due to the decomposition of KAl(CO3)(OH)2. Importantly, the sum of the desorption capacities for CO2 and H2O matches the total weight loss recorded in the TGA analysis, which underscores the accuracy of the thermogravimetric and TPD measurements

3.7. Derivation of the Predictive Model for Capture Capacity Based on K2CO3 Loading Amounts

Figure 9 illustrates the relationship between the initial and final CO2 capture capacities as a function of the loading amount of K2CO3. Each graph represents the CO2 capture capacities on the y-axis as related to the K2CO3 loading ratio on the x-axis, and the data points are explained visually through the fitting of linear and quadratic regression equations. Figure 9 (I) demonstrates that the initial CO2 capture capacity increases linearly with the increase in the K2CO3 loading ratio. The formula for calculating the initial CO2 capture capacity is expressed by Equation (5) as follows:
y = 3.18x
This linear relationship shows that the initial CO2 capture capacity increases directly in proportion to the increase in the K2CO3 loading ratio, aligning well with the data points. Conversely, Figure 9 (II) depicts a nonlinear relationship for the final CO2 capture capacity. The formula for the final CO2 capture capacity is given in Equation (6) as follows:
y = 0.0296x2 + 1.247x − 13.05
The model predicts an almost perfect accuracy for the data, showing that the final capture capacity is zero when the loading amount of K2CO3 is at or below 8 wt% and increases proportionally above this threshold. This formula allows for the prediction of CO2 capture capacity based on the loading amount of K2CO3. To validate the model, the study measured the actual CO2 capture capacities of sorbents loaded with varying weight percentages of K2CO3 (12, 25, 35 wt%), marked by red points, confirming a good fit with the regression models. Based on these data, these models can serve as crucial tools for optimizing the K2CO3 loading ratio and maximizing the efficiency of the CO2 capture process.

4. Discussion

This study has delineated the complex interaction between K2CO3 loading and γ-Al2O3 supports and its effects on CO2 capture, confirming that more K2CO3 loading initially enhances the sorption capacity of the tested sorbents. However, the formation of KAl(CO3)(OH)2 by-products during sorbent operation has been identified as a major impediment, challenging the sorbent’s long-term stability and functionality. Intriguingly, by-product formation does not increase proportionately with K2CO3 loading, suggesting that there are intricate chemical dynamics at play. Specifically, we observed a marked disparity in the deactivation rates between different loading levels. The 5KAlI demonstrates a deactivation rate of 100%, whereas the 30KAlI shows a significantly reduced rate of approximately 44.6%. The interface between K2CO3 and γ-Al2O3 emerges as a key factor in sorbent deactivation, with only the K2CO3 that is directly in contact with the γ-Al2O3 undergoing a transformation to KAl(CO3)(OH)2, while the remaining layers form KHCO3 and retain their CO2 absorption capacity. These findings have led to the development and validation of a predictive model for CO2 capture capacity based on K2CO3 loading amounts, establishing a robust framework for future sorbent optimization strategies. Our findings are consistent with those reported for CO2 capture performance observed using potassium-based γ-Alumina dry sorbents [6,16,23]. However, our study extends this knowledge by specifically examining the effect of varying K2CO3 loadings on deactivation mechanisms, providing a deeper understanding of these processes. Moving forward, further investigations are needed to refine the predictive model and explore alternative modifications to the sorbent materials that might inhibit or delay the formation of deactivating by-products. Additionally, assessing the scalability and economic viability of optimized sorbent systems in industrial applications will be crucial for advancing CO2 capture technology.

Author Contributions

Conceptualization, S.Y.I. and S.C.L.; formal analysis, S.Y.I. and J.H.M.; investigation, S.Y.I. and J.H.M.; supervision, S.C.L. and J.C.K.; Validation, S.Y.I. and J.H.M.; writing—original draft, S.Y.I. and S.C.L.; writing—review and editing, J.C.K. and S.C.L. All authors have read and agreed to the published version of the manuscript.

Funding

This research was funded by the Korea Institute of Energy Technology Evaluation and Planning (KETEP) and the Ministry of Trade, Industry & Energy (MOTIE) of the Republic of Korea (No. 20213030030240).

Institutional Review Board Statement

Not applicable.

Informed Consent Statement

Not applicable.

Data Availability Statement

Data are contained within the article.

Conflicts of Interest

The authors declare no conflicts of interest.

References

  1. Samanta, A.; Zhao, A.; Shimizu, G.K.H.; Sarkar, P.; Gupta, R. Post-combustion CO2 capture using solid sorbents: A review. Ind. Eng. Chem. Res. 2012, 51, 1438–1463. [Google Scholar] [CrossRef]
  2. Wei, K.; Guan, H.; Luo, Q.; He, J. Recent advances in CO2 capture and reduction. nanoscale. Nanoscale 2022, 14, 11869–11891. [Google Scholar] [CrossRef] [PubMed]
  3. Hou, R.; Fong, C.; Freeman, B.D.; Hill, M.R.; Xie, Z. Current status and advances in membrane technology for carbon capture. Sep. Purif. Technol. 2022, 5, 121863. [Google Scholar] [CrossRef]
  4. Gkotsis, P.; Peleka, E.; Zouboulis, A. Membrane-Based Technologies for Post-Combustion CO2 Capture from Flue Gases: Recent Progress in Commonly Employed Membrane Materials. Membranes 2023, 13, 898. [Google Scholar] [CrossRef] [PubMed]
  5. Siriwardane, R.V.; Stevens, R.W., Jr. Novel regenerable magnesium hydroxide sorbents for CO2 capture at warm gas temperatures. Ind. Eng. Chem. Res. 2009, 48, 2135–2141. [Google Scholar] [CrossRef]
  6. Lee, S.C.; Kwon, Y.M.; Chae, H.J.; Jung, S.Y.; Lee, J.B.; Ryu, C.K.; Yi, C.K.; Kim, J.C. Improving regeneration properties of potassium-based alumina sorbents for carbon dioxide capture from flue gas. Fuel 2013, 104, 882–885. [Google Scholar] [CrossRef]
  7. Yong, Z.; Mata, V.; Rodrigues, A.E. Adsorption of carbon dioxide at high temperature—A review. Sep. Purif. Technol. 2002, 26, 195–205. [Google Scholar] [CrossRef]
  8. Seo, Y.W.; Jo, S.H.; Ryu, H.J.; Bae, D.H.; Ryu, C.K.; Yi, C.K. Effect of water pretreatment on CO2 capture using a potassium-based solid sorbent in a bubbling fluidized bed reactor. Korean J. Chem. Eng. 2007, 24, 457–460. [Google Scholar] [CrossRef]
  9. Li, L.; Li, Y.; Wen, X.; Wang, F.; Zhao, N.; Xiao, F.; Wei, W.; Sun, Y. CO2 capture over K2CO3/MgO/Al2O3 dry sorbent in a fluidized bed. Energy Fuels 2011, 25, 3835–3842. [Google Scholar] [CrossRef]
  10. Lee, S.C.; Kim, J.C. Dry potassium-based sorbents for CO2 capture. Catal. Surv. Asia 2007, 11, 171–185. [Google Scholar] [CrossRef]
  11. Wang, J.; Huang, L.; Yang, R.; Zhang, Z.; Wu, J.; Gao, Y.; Wang, Q.; O’Hare, D. Recent advances in solid sorbents for CO2 capture and new development trends. Energy Environ. Sci. 2014, 7, 3478–3518. [Google Scholar] [CrossRef]
  12. Qi, G.; Wang, Y.; Estevez, L.; Duan, X.; Anako, N.; Park, A.H.A. CO2 capture by solid sorbents: A review of current developments. Ind. Eng. Chem. Res. 2011, 50, 5151–5164. [Google Scholar]
  13. Lee, K.B.; Lee, J.H.; Lee, C.H.; Kim, J.H.; Yoon, J.H. A study on CO2 breakthrough adsorption capacity of dry sorbents. Chem. Eng. J. 2010, 162, 883–892. [Google Scholar]
  14. Sanna, A.; Maroto-Valer, M.M. Development of novel dry regenerable sorbent synthesized via ultrasonic spray pyrolysis for CO2 capture. Environ. Sci. Technol. 2012, 46, 8014–8021. [Google Scholar]
  15. Jo, S.B.; Lee, S.C.; Chae, H.J.; Cho, M.S.; Lee, J.B.; Baek, J.I.; Kim, J.C. Regenerable potassium-based alumina sorbents prepared by CO2 thermal treatment for post-combustion carbon dioxide capture. Korean J. Chem. Eng. 2016, 33, 3207–3215. [Google Scholar] [CrossRef]
  16. Zhao, C.; Chen, X.; Zhao, C.; Wu, Y.; Wu, D. K2CO3/Al2O3 for capturing CO2 in flue gas from power plants. Part 3: CO2 Capture Behaviors of K2CO3/Al2O3 in a Bubbling Fluidized-Bed Reactor. Energy Fuels 2012, 26, 3062–3068. [Google Scholar] [CrossRef]
  17. Choi, S.H.; Drese, J.H.; Jones, C.W. Adsorbent materials for carbon dioxide capture from large anthropogenic point sources. ChemSusChem 2009, 2, 796–854. [Google Scholar] [CrossRef] [PubMed]
  18. Ma, J.; Xu, Y.; Wu, Y.; Chen, X.; Cai, T.; Liu, D. Continuous CO2 capture performance of K2CO3/Al2O3 sorbents in a novel integrated bubbling-transport fluidized reactor. Ind. Eng. Chem. Res. 2019, 58, 19733–19740. [Google Scholar] [CrossRef]
  19. Zhao, C.W.; Chen, X.P.; Zhao, C.S. CO2 absorption using dry potassium-based sorbents with different supports. Energy Fuels 2009, 23, 4683–4687. [Google Scholar] [CrossRef]
  20. Park, Y.C.; Jo, S.-H.; Ryu, C.K.; Yi, C.-K. Demonstration of pilot scale carbon dioxide capture system using dry regenerable solid sorbents to the real coal-fired power plant in Korea. Energy Procedia 2011, 4, 1508–1512. [Google Scholar] [CrossRef]
  21. Park, Y.C.; Jo, S.-H.; Kyung, D.-H.; Kim, J.-Y.; Yi, C.-K.; Ryu, C.K.; Shin, M.S. Test operation results of the 10 MWe-scale dry-solid sorbent CO2 capture process integrated with a real coal-fired power plant in Korea. Energy Procedia 2014, 63, 2261–2265. [Google Scholar] [CrossRef]
  22. Park, Y.C.; Jo, S.-H.; Lee, S.-Y.; Moon, J.-H.; Ryu, C.K.; Lee, J.B.; Yi, C.-K. Performance analysis of K-based KEP-CO2P1 solid solid sorbents in a bench-scale continuous dry-solid sorbent CO2 capture process. Korean J. Chem. Eng. 2016, 33, .73–79. [Google Scholar] [CrossRef]
  23. Lee, S.C.; Cho, M.S.; Jung, S.Y.; Ryu, C.K.; Kim, J.C. Effects of alumina phases on CO2 sorption and regeneration properties of potassium-based alumina sorbents. Adsorption 2014, 20, 331–339. [Google Scholar] [CrossRef]
  24. Fernandez-Carrasco, L.; Puertas, F.; Blanco-Varela, M.T.; Vazquez, T.; Rius, J. Synthesis and crystal structure solution of potassium dawsonite: An intermediate compound in the alkaline hydrolysis of calcium aluminate cements. Cem. Concr. Res. 2005, 32, 641–646. [Google Scholar] [CrossRef]
  25. Panwar, N.L.; Kaushik, S.C.; Kothari, S. Role of renewable energy sources in environmental protection: A review. Renew. Sustain. Energy Rev. 2011, 15, 1513–1524. [Google Scholar] [CrossRef]
  26. Bararpour, S.T.; Karami, D.; Mahinpey, N. Investigation of the effect of alumina-aerogel support on the CO2 capture performance of K2CO3. Fuel 2019, 242, 124–132. [Google Scholar] [CrossRef]
  27. Hayashi, H.; Taniuchi, J.; Furuyashiki, N.; Sugiyama, S.; Hirano, S.; Shigemoto, N.; Nonaka, T. Efficient recovery of carbon dioxide from flue gases of coal-fired power plants by cyclic fixed-bed operations over K2CO3-on-carbon. Ind. Eng. Chem. Res. 1998, 37, 185–191. [Google Scholar] [CrossRef]
  28. Hirano, S.; Shigemoto, N.; Yamaha, S.; Hayashi, H. Cyclic fixed-bed operations over K2CO3-on- carbon for the recovery of carbon dioxide under moist conditions. Bull. Chem. Soc. Jpn. 1995, 68, 1030–1035. [Google Scholar] [CrossRef]
  29. Wang, Y.; Zhu, J.H.; Huang, W.Y. Synthesis and characterization of potassium-modified alumina superbases. Phys. Chem. Chem. Phys. 2001, 3, 2537–2543. [Google Scholar] [CrossRef]
  30. Zhao, C.; Chen, X.; Zhao, C. Carbonation behavior of K2CO3 with different microstructure used as an active component of dry sorbents for CO2 capture. Ind. Eng. Chem. Res. 2010, 49, 12212–12216. [Google Scholar] [CrossRef]
  31. Lee, S.C.; Chae, H.J.; Choi, B.Y.; Jung, S.Y.; Ryu, C.Y.; Park, J.J.; Baek, J.I.; Ryu, C.K.; Kim, J.C. The effect of relative humidity on CO2 capture capacity of potassium-based sorbents. Korean J. Chem. Eng. 2011, in press. [Google Scholar] [CrossRef]
Figure 1. Breakthrough curves of 5KAlI, 10KAlI, 20KAlI, and 30KAlI sorbents in presence of 10 vol% H2O and 1 vol% CO2 at 60 °C during multiple tests. (a) 5KAlI (b) 10KAlI (c) 20KAlI and (d) 30KAlI.
Sustainability 16 05117 g001
Figure 2. The total CO2 capture capacity according to multiple tests (a), 5KAlI, 10KAlI, 20KAlI and 30KAlI sorbents during multiple tests (b). The different colors in (b) represent sequential cycles, from 1 cycle to 5 cycles.
Sustainability 16 05117 g002
Figure 3. The total CO2 capture capacity per 1 g of sorbent (a) per 1 g of K2CO3 (b) for the gap between the initial and final CO2 capture capacities (I) and the final CO2 capture capacity (II) as function of the loading amount of K2CO3.
Sustainability 16 05117 g003
Figure 4. The XRD patterns of the fresh 5KAlI, 10KAlI, 20KAlI, and 30KAlI sorbents (a) and those after regeneration (b). (●) K2CO3; (△) γ-Al2O3; (▼) KAl(CO3)(OH)2; (◆) K2CO3∙1.5H2O.
Sustainability 16 05117 g004
Figure 5. The pore size distributions of (a) 5KAlI, (b) 10KAlI, (c) 20KAlI (d), 30KAlI sorbents, (e) γ-Al2O3, and (f) all of them.
Sustainability 16 05117 g005
Figure 6. SEM images of (a) fresh sorbents and (b) sorbents after CO2 capture.
Sustainability 16 05117 g006
Figure 7. The TG curves (a) and DTG curves (b) of 5KAlI, 10KAlI, 20KAlI, and 30KAlI sorbents under N2.
Sustainability 16 05117 g007
Figure 8. The TPD results for the 5KAlI, 10KAlI, 20KAlI, and 30KAlI sorbents after CO2 capture under N2. (a) 5KAlI (b) 10KAlI (c) 20KAlI and (d) 30KAlI.
Sustainability 16 05117 g008
Figure 9. Derivation of the predictive model for CO2 capture capacity based on K2CO3 loading amounts: (red point); additional verification data, (green point); original data.
Sustainability 16 05117 g009
Table 1. Experimental conditions.
CO2 CaptureRegeneration
Temperature (°C)60200
Pressure (atm)11
Flow rate (mL/min)6060
Gas composition (vol%)CO2: 1, H2O: 10, N2: balanceN2: balance
Table 2. Deactivation degree according to K2CO3 loading amount.
SorbentInitial Capture Capacity
(mg CO2/g Sorbents)
Final Capture Capacity
(mg CO2/g Sorbents)
Degree of
Deactivation (%)
5KAlI15.80100
10KAlI30.52.026.7
20KAlI60.324.962
30KAlI88.250.444.6
Table 3. BET results of γ-Al2O3,5–30KAl sorbents and K2CO3.
Surface Area
(m2/g)
Pore Volume
(cc/g)
Pore Diameter
(nm)
γ-Al2O3158.740.2966.529
5KAlI150.50.274.9
10KAlI121.250.2123.834
20KAlI77.2370.1513.832
30KAlI60.5590.1173.828
K2CO30.5920.0013.058
Table 4. Comparative analysis of weight loss and desorption capacities of CO2 and H2O at two temperature intervals for 5KAlI, 10KAlI, 20KAlI, and 30KAlI sorbents after 5 CO2 capture cycles below approximately 200 °C: (I) and between 250 and 400 °C: (II).
SorbentWeight Loss (%)CO2 Desorption Capacity (%)H2O Desorption Capacity (%)
5KAlI(I)5.2105.15
(II)30.91.621.29
10KAlI(I)5.5905.53
(II)5.213.052.51
20KAlI(I)6.942.14.82
(II)9.764.013.29
30KAlI(I)8.074.024.09
(II)7.494.453.66
Disclaimer/Publisher’s Note: The statements, opinions and data contained in all publications are solely those of the individual author(s) and contributor(s) and not of MDPI and/or the editor(s). MDPI and/or the editor(s) disclaim responsibility for any injury to people or property resulting from any ideas, methods, instructions or products referred to in the content.

