Review

Research Foundation and Hotspot Analysis of Urban Road Ecology—A Bibliometric Study Based on CiteSpace

1
Chang’an Dublin International College of Transportation, Chang’an University, Xi’an 710064, China
2
College of Forestry, Guizhou University, Guiyang 550025, China
*
Author to whom correspondence should be addressed.
Sustainability 2024, 16(12), 5135; https://doi.org/10.3390/su16125135
Submission received: 22 March 2024 / Revised: 18 May 2024 / Accepted: 12 June 2024 / Published: 17 June 2024
(This article belongs to the Special Issue Advances in Transportation Planning and Management)

Abstract

:
Urban road ecology focuses on the reciprocal interactions between urban road construction and the ecological environment, aiming to provide valuable insights into sustainable urban road construction. The study of road ecology has established a comprehensive research framework since the early 20th century, with urban road ecology emerging as its sub-discipline that emphasizes the strategic planning of urban roads and the internal dynamics within urban ecosystems. In order to demonstrate the broader research focus and development prospects of urban road ecology, as well as to explore its distinguishing features compared to traditional road ecology, this study conducted a bibliometric analysis of urban road ecology using CiteSpace software version 6.2.R7 based on the Web of Science (WOS) database for the literature in the last 30 years. The analysis reflected the current state of research in this field across three dimensions: collaborative analysis, co-citation analysis, and keyword analysis. The results of the study revealed a scarcity of key terms and publications between 1993 and 2010, followed by an exponential surge in research activities after 2010. However, both collaborative and keyword analyses indicate a lack of long-term, in-depth research in this area, highlighting the absence of a unified system. On this basis, this paper presents three expectations for future research and briefly discusses the limitations of this study.

1. Introduction

Urban road ecology is a multi-field, interdisciplinary area of study encompassing the coordinated development of urban road construction and urban ecology within the context of urbanization. It involves various fields, including urban landscape, ecology, road engineering, and transportation. Road ecology is a dynamic and multidisciplinary area of research in environmental science, aiming to proactively prevent, minimize, and mitigate the impacts associated with road use [1]. Road ecology examines the interactions between road transport systems and their surroundings from the perspectives of ecology and landscape architecture. The contradiction between urban road construction, urban ecology, and urban landscape was a concern until the 1970s, when an increasing number of scholars specializing in road construction and ecological assessment began to pay attention to the research in the field of road ecology [2]. As urban road ecology is generally characterized by a wide range of studies and numerous disciplines, conducting a comprehensive review solely through the traditional literature methods poses significant challenges. Therefore, bibliometric methods of data collection, data analysis, and visualization of the results are excellent for multidisciplinary, and cutting-edge analysis [3]. This method facilitates an accurate summarization of the current direction and intensity in this field and improves the precise comprehension of research frontiers and emerging trends. Subjectively, an easy-to-understand visual presentation of the results can help readers quickly understand the research in this field, thereby enhancing its readability and scholarly appeal.
As the parent field of urban road ecology, road ecology already has a considerable theoretical foundation. It involves scientific exploration of the interactions between organic and inorganic environments associated with roads and vehicles [2]. Typically, the study of road ecology has been categorized into three research phases, namely the germination, growth, and maturity periods along the temporal axis [4]. The period spanning from the mid-19th century to the 1980s is considered to be the germinal period of road ecology research. At this stage, scientific research gradually shifts its focus from the ecologically relevant functional problems caused by large-scale infrastructures to road construction concepts that align more closely with aesthetic values and the concept of sustainability as the road infrastructure continues to develop. Between the 1980s and the beginning of the 21st century, research in road ecology witnessed significant advancements. Notably, numerous scholars focused on investigating potential ecological impacts resulting from road traffic, thereby characterizing this phase as the growth period of road ecology. Richard and Lauren emphasized the pivotal role of road ecology in the planning, conservation, management, and policy of scientific research and social development. They also provided a comprehensive overview of key research areas within road ecology at that time, including the interaction between roadside organisms and road traffic, the relationship between transport pollution and the water cycle, and the ecological landscape impacts resulting from road networks, as well as related policy interventions [5]. At this stage, an endeavor has been made to apply ecological knowledge and principles to analyze the correlation between transport and ecology. Owing to the limited urbanization process, there has been a more comprehensive analysis of the ecological research on rural roads compared to those on urban roads. By considering the correlation between road network planning and design in rural areas, highways, and rural roads, some studies on road ecology in rural areas can contribute to the specifications of road design and the improvement of policies [6]. The publication of Road Ecology in 2003 [7] marked the formation of a complete and systematic theoretical framework for the field. Therefore, the period after 2003 is referred to as the maturity period of the field of road ecology. At this point, road ecology clarifies the focus of research on the interactions between roads, traffic, and the surrounding environment, specifically the collisions between wildlife and vehicles and the impact of animal behavior [8]; the interactive effects of road traffic on ecology from physical and chemical perspectives [2]; and the analysis of the impact and changes between landscape ecology and road network construction [9,10].
However, due to the need for more specific conceptual and research scope exploration in urban road ecology, there is currently a demand for a comprehensive compendium and overview of this field. Although urban road ecology can be considered a subset within the broader discipline of road ecology, the difference between them is not only reflected in the restrictive role of “urban” as an adjective but also in the apparent difference in research content. First, the study of urban roads should not be confused with the study of roads. Urban roads are of significant research value and are distinct from other types of roads. For example, in road research in China, a clear distinction is made between urban roads and highways and roads with other functions, including: factory roads, forest roads, travel scenic roads, airport roads, port roads, defense roads, and other special-purpose roads, because there are significant differences based on China’s specifications. Among them, urban roads have the broadest application. Compared with other types of roads, urban roads are significantly different in many aspects, such as pavement structure, design methods, and how they interact with the environment. Specifically, urban roads focus on more targeted issues, such as the urban heat island effect, flood prevention for permeable pavements, and noise reduction by changing the interaction between urban pavement and tires. When analyzing the differences in travel time and variability between roads and highways, Yazici et al. also highlighted significant differences between urban roads and highways in terms of geometric parameter design, road pricing policies, and traffic volume characteristics [11]. Second, urban road ecology places particular emphasis on the study of urban roads and landscapes involving aspects such as urban land planning, which are not the primary focus within the field of road ecology. Zhang et al. reviewed various methods for analyzing urban regional divisions and proposed an analytical framework for assessing urban ecological land, building land, and road land. Such studies are essential components of urban road ecology [12]. Third, the uniqueness of urban ecosystems is significantly reflected in the study of urban road ecology compared to other ecosystems. Urbanization has contributed to the evolution of natural ecosystems, leading to the emergence of novel ecosystem types characterized by internal properties rather than external structures within human–natural patterns [12,13]. However, the field of road ecology encompasses a broader range of ecological research domains, including wetland ecosystems, desert ecosystems, forest ecosystems, farm ecosystems, and urban ecosystems [2]. As a result, the field of road ecology does not place a strong emphasis on the uniqueness of urban ecosystems. Based on the above analysis, it is necessary to conduct independent research on urban road ecology to provide a more suitable theoretical basis for urban construction.
This paper will discuss the entire process of quantitative literature research on the discipline of urban road ecology, with a focus on elucidating the current research status and identifying hot topics in this research. Considering the review nature of this article, which is driven by data and visualization of results, this paper provides a more in-depth and specific investigation of urban road ecology as a more independent part of road ecology. Instead of completely following the more general research topics in road ecology, the barriers between urban road ecology and other sub-topics of road ecology research are strengthened.

2. Methodology

2.1. Data Collection

In this study, core studies were searched in the Web of Science (WOS) database for the period of 1 January 1993 to 30 December 2023 using the keywords “urban road ecology” and “city road ecology”. During the literature search, the “search scope” was set to “Web of Science core collection”, thereby ensuring that the selected studies can be considered core studies. A total of 554 core studies were identified, of which 284 were relevant to the study of urban road ecology research based on relevance between the two fields. In terms of the standard for selecting literature, the 554 studies were first reviewed one by one to remove significantly unrelated articles, such as those related only to roads, ecology, urban construction, or completely unrelated. For example, articles about political roads may be retrieved due to “roads”. Then, the literature was carefully read and further screened. If the article was significantly related to the three keywords of urban road ecology, the literature was directly selected. For articles related to both topics, those related to the concept of sustainable development in urban road construction were selected based on professional knowledge. The data, such as titles, keywords, abstracts, authors, and references, obtained by extracting and exporting the literature, were considered as the original dataset for this study.

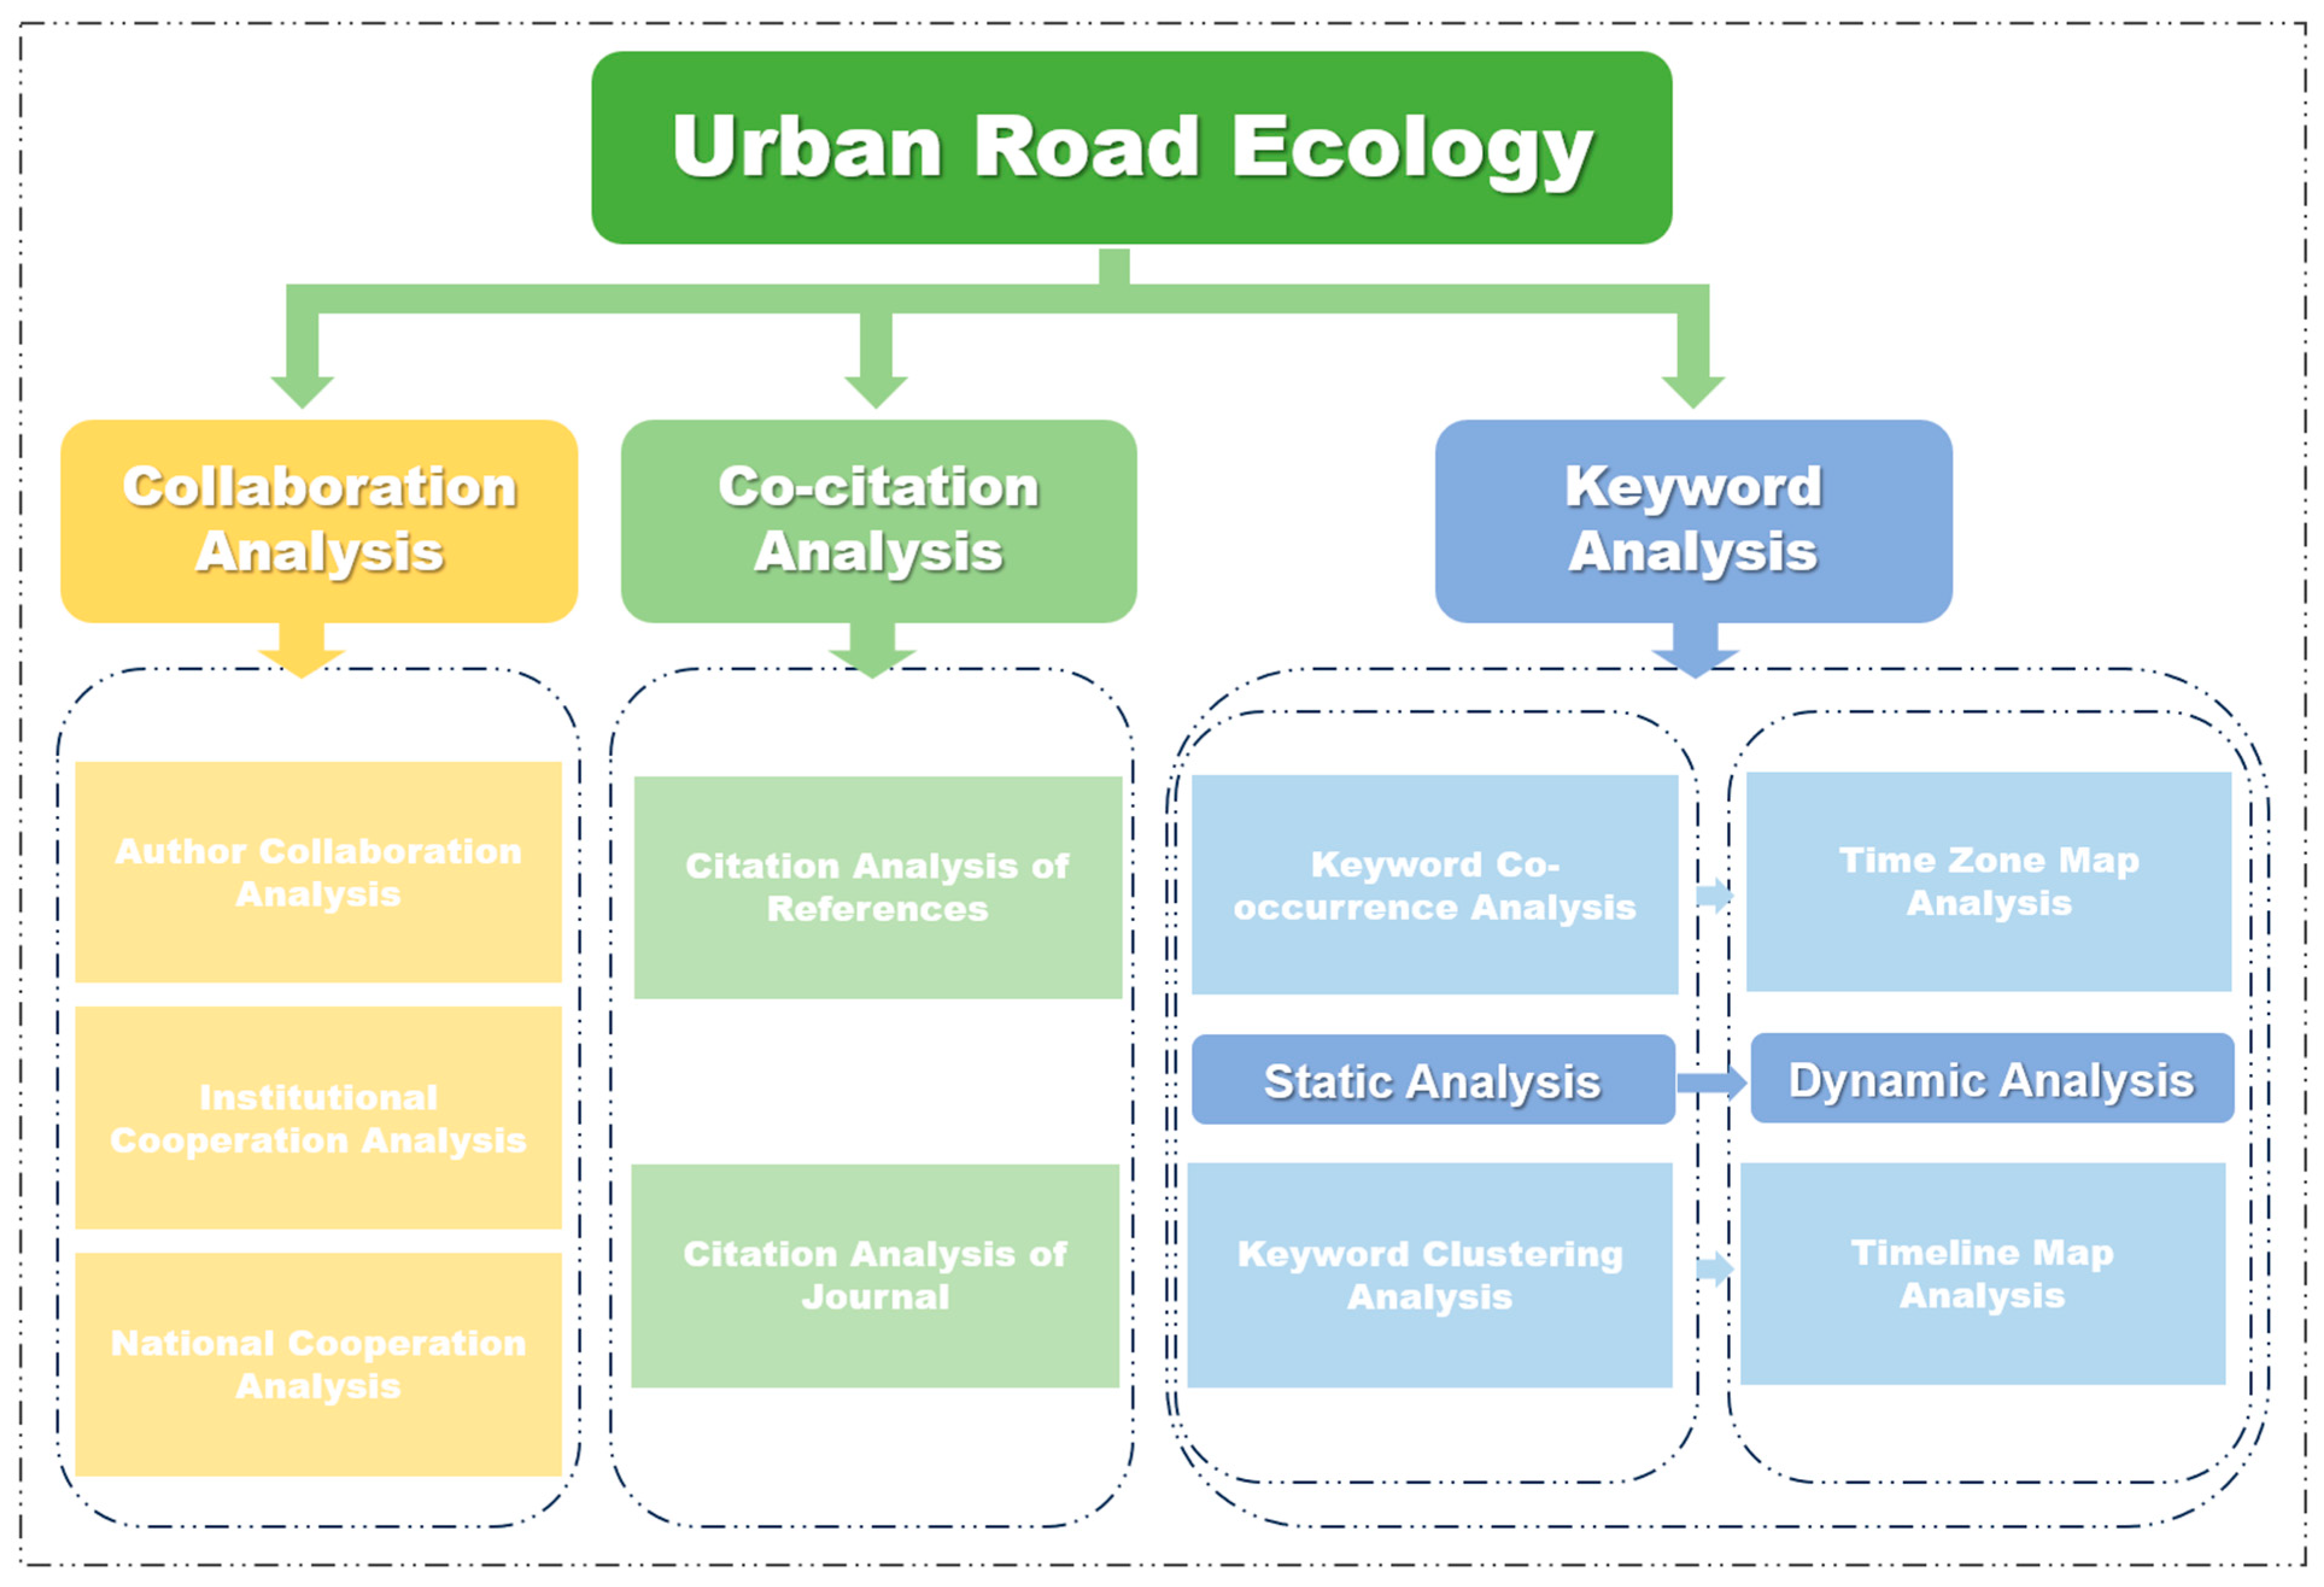
2.2. Method Overview

In this study, CiteSpace version 6.2.R7 software was adopted as a research tool for bibliometric visualization and analysis. This software is a scientific knowledge graph software developed by Dr. Chen Chaomei using the Java programming language [14]. It aims to analyze the research frontiers and intellectual foundations in both dynamic and static dimensions. A total of nine node types were set up here, including Author, Institution, and Country; Keywords, Term, and Category; References, Cited Authors, and Cited Journals. After a series of parameter-adjusting operations (e.g., time slicing), static associations of nodes can be obtained. As per Chen’s definition, the “research frontier” encompasses both the collection of citing articles (state-of-the-art thinking) and the collection of cited articles that constitutes the intellectual foundation. Moreover, the analysis was further enhanced by incorporating clustering and timeline analyses, thereby elevating it from a static to a dynamic perspective [14]. Therefore, this study will discuss the research frontiers and intellectual foundations of urban road ecology at three levels: collaborative analysis, co-citation analysis, and keyword analysis. In terms of keyword analysis, the discussion will be carried out from the static dimension that combines co-occurrence analysis and clustering analysis to the dynamic dimension consisting of both time zone map analysis and timeline map analysis. In this case, time zone map analysis and timeline map analysis are based on the results of keyword co-occurrence analysis and keyword clustering analysis, respectively. The logical framework diagram of the methodology is shown in Figure 1.
Based on the three central dimensions mentioned in the above figure, collaborative analysis can be used to present the current research status in the field, including the number of publications, collaborative relationships, the size of the research system, and whether there is a relatively stable research team. Co-citation analysis can present the research categories of highly cited papers and which journals are favored in this field. Keyword analysis is even more critical as it aims to trace the development trajectory of the entire field and present the development situation and research hotspots. From these three dimensions, it is possible to understand the main topics in this field, which helps to emphasize the content that urban road ecology pays more attention to compared to road ecology, as well as hot topics worth further research.
Because of the small number of articles published before 1999, only visualization analysis of studies conducted between January 1999 and December 2023 could be performed in the collaborative analysis and co-citation analysis.

2.3. Discussion on Analytical Methods

2.3.1. Collaboration Analysis

When conducting collaborative analysis among authors, institutions, and countries, they were analyzed in similar ways. First, the corresponding node type was selected, and the time was set from January 1993 to December 2023. Then, the number of time slices was set to 3 after iterative trials. When the time slice is set to 1 or 2, the time network is too dense, and the resulting graph is not concise enough. If the time slice is too large, the time network will be too sparse, leading to poor analysis accuracy. Choosing a time slice of 3 based on the outcomes of consecutive trials can guarantee the accuracy and efficiency of the analysis. The G-index (k = 25) was kept at its default value. The main difference among the three in terms of software settings lies only in the selection of node types, while other aspects remain comparable.
It is worth mentioning that the Price formula can be used to solve for the critical importance of partitions. In this section, the institutional cooperation analysis is taken as an example. Compared to analyzing the publications of scholars in core journals, analyzing the publications of institutions in core journals is more helpful in presenting the distribution and correlation of research resources. In this study, the Price formula is used to measure the institutions that publish in the core journals central to this field:
N i = 0.749 × N m
where N m is the highest number of publications by the institution; N i is the standard value for the minimum number of publications.

2.3.2. Co-Citation Analysis

The setting method of co-citation analysis is similar to that of cooperative analysis. The important difference in methodology between them is evident through the notable divergence in map adjustment techniques. However, these two analysis methods are similar when it comes to presenting the analysis findings.

2.3.3. Keyword Analysis

Firstly, the node type was set to “keyword”, and other setting methods for keyword co-occurrence analysis in the collaborative analysis were considered. Based on the keyword co-occurrence graph, the LLR (Log Likelihood Ratio) was selected, and “display the maximum number of k-clusters” was defined as 12 categories for clustering analysis. This process allows for the selection of the top 12 clustering results from the 13 clustering results obtained from the analysis. Afterward, the time zone analysis was selected from the layout to comprehensively analyze temporal variations. Similarly, the timeline analysis can be conducted by selecting the timeline option on the layout. An important parameter when setting up the burst analysis is the γ value. A reasonable γ value means that an appropriate number of burst words can be analyzed. After continuous adjustment through trial and error, a γ value of 0.5 was selected to obtain a total of 6 burst words.

3. Results and Discussion

3.1. Collaborative Analysis

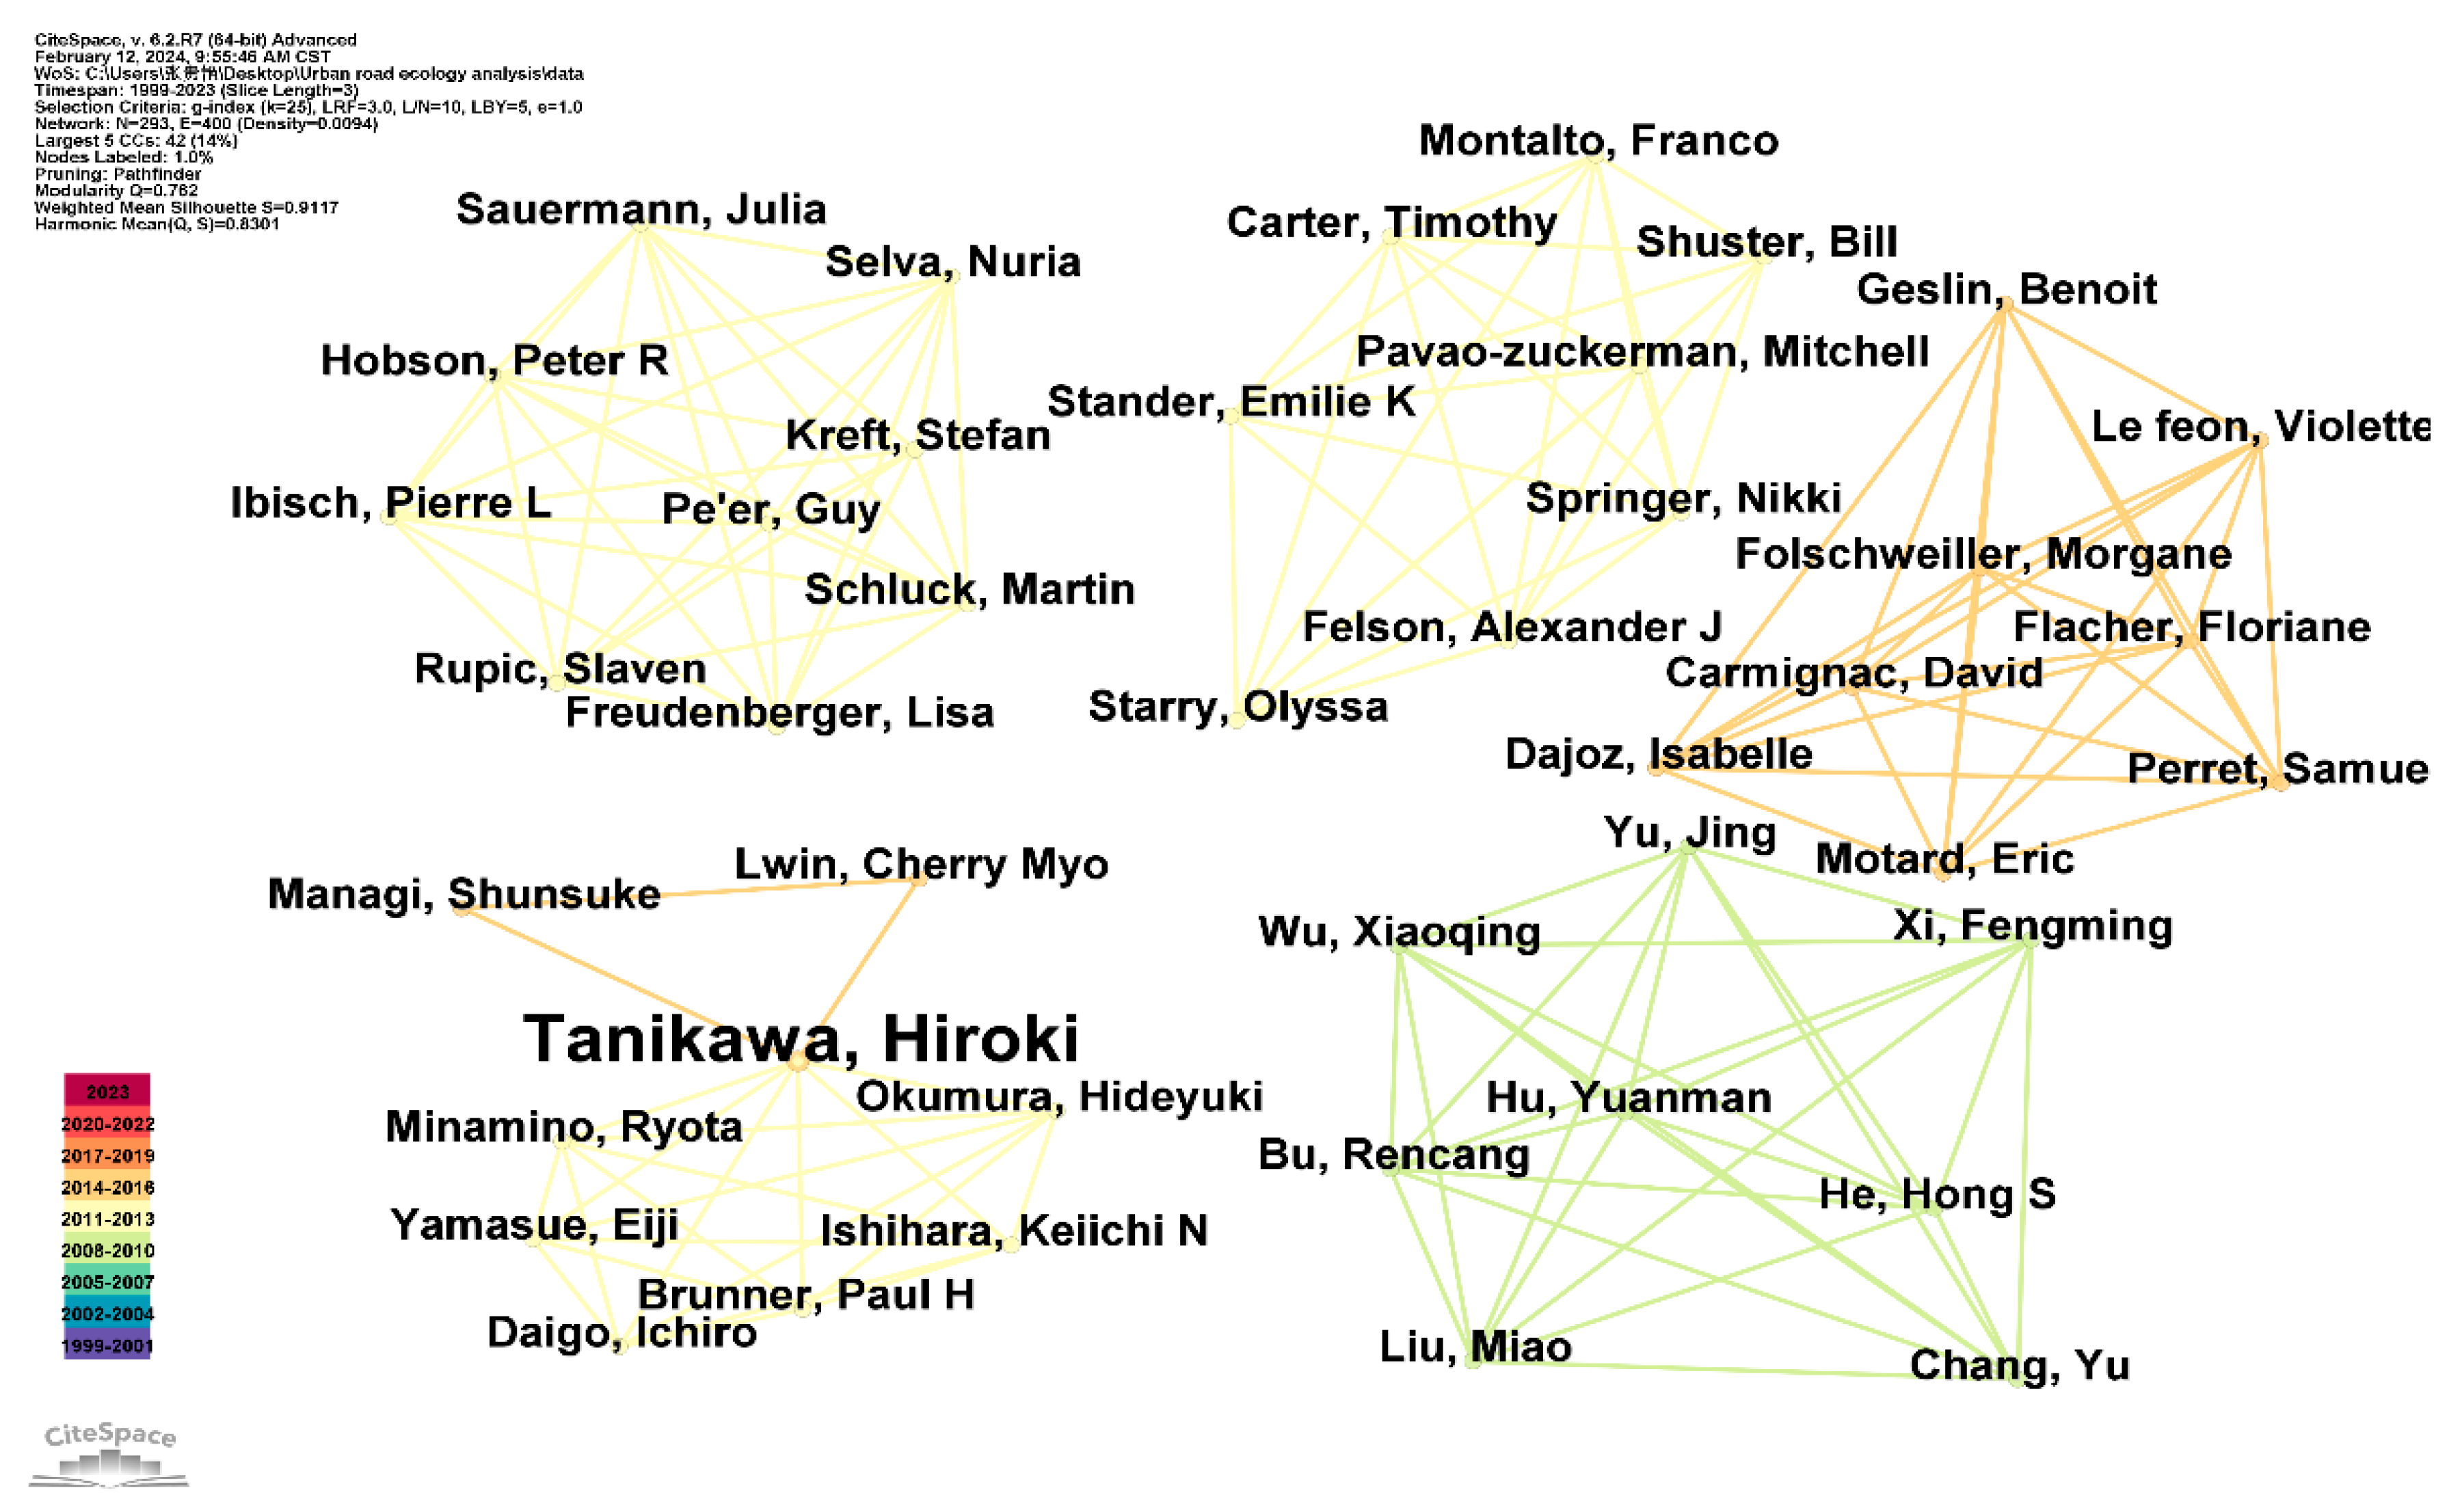
3.1.1. Author Collaboration Analysis

The number of articles published in core journals by core authors often reflects the extent and direction of development of a specific field [15], as shown in Figure 2.
Most authors have published one article in a core journal in the field of urban road ecology, and only three scholars, including Tanikawa Hiroki, have published two articles. Moreover, the majority of authors exhibit a centrality of approximately zero, indicating that research in this field has not yet formed a closely connected network of collaborative relationships. It is worth mentioning that centrality is an indicator reflecting the degree of association between an element and other elements. For example, in the results of Figure 2, the centrality of an author refers to the extent of association between an author and other authors. It is manifested through two aspects: firstly, the number of authors associated with the author; secondly, the frequency of collaborations with co-authors. It is evident that there are many people involved in this cross-cutting area of research, but there is a lack of scholars who have persistently and intensively studied this area over a long period.

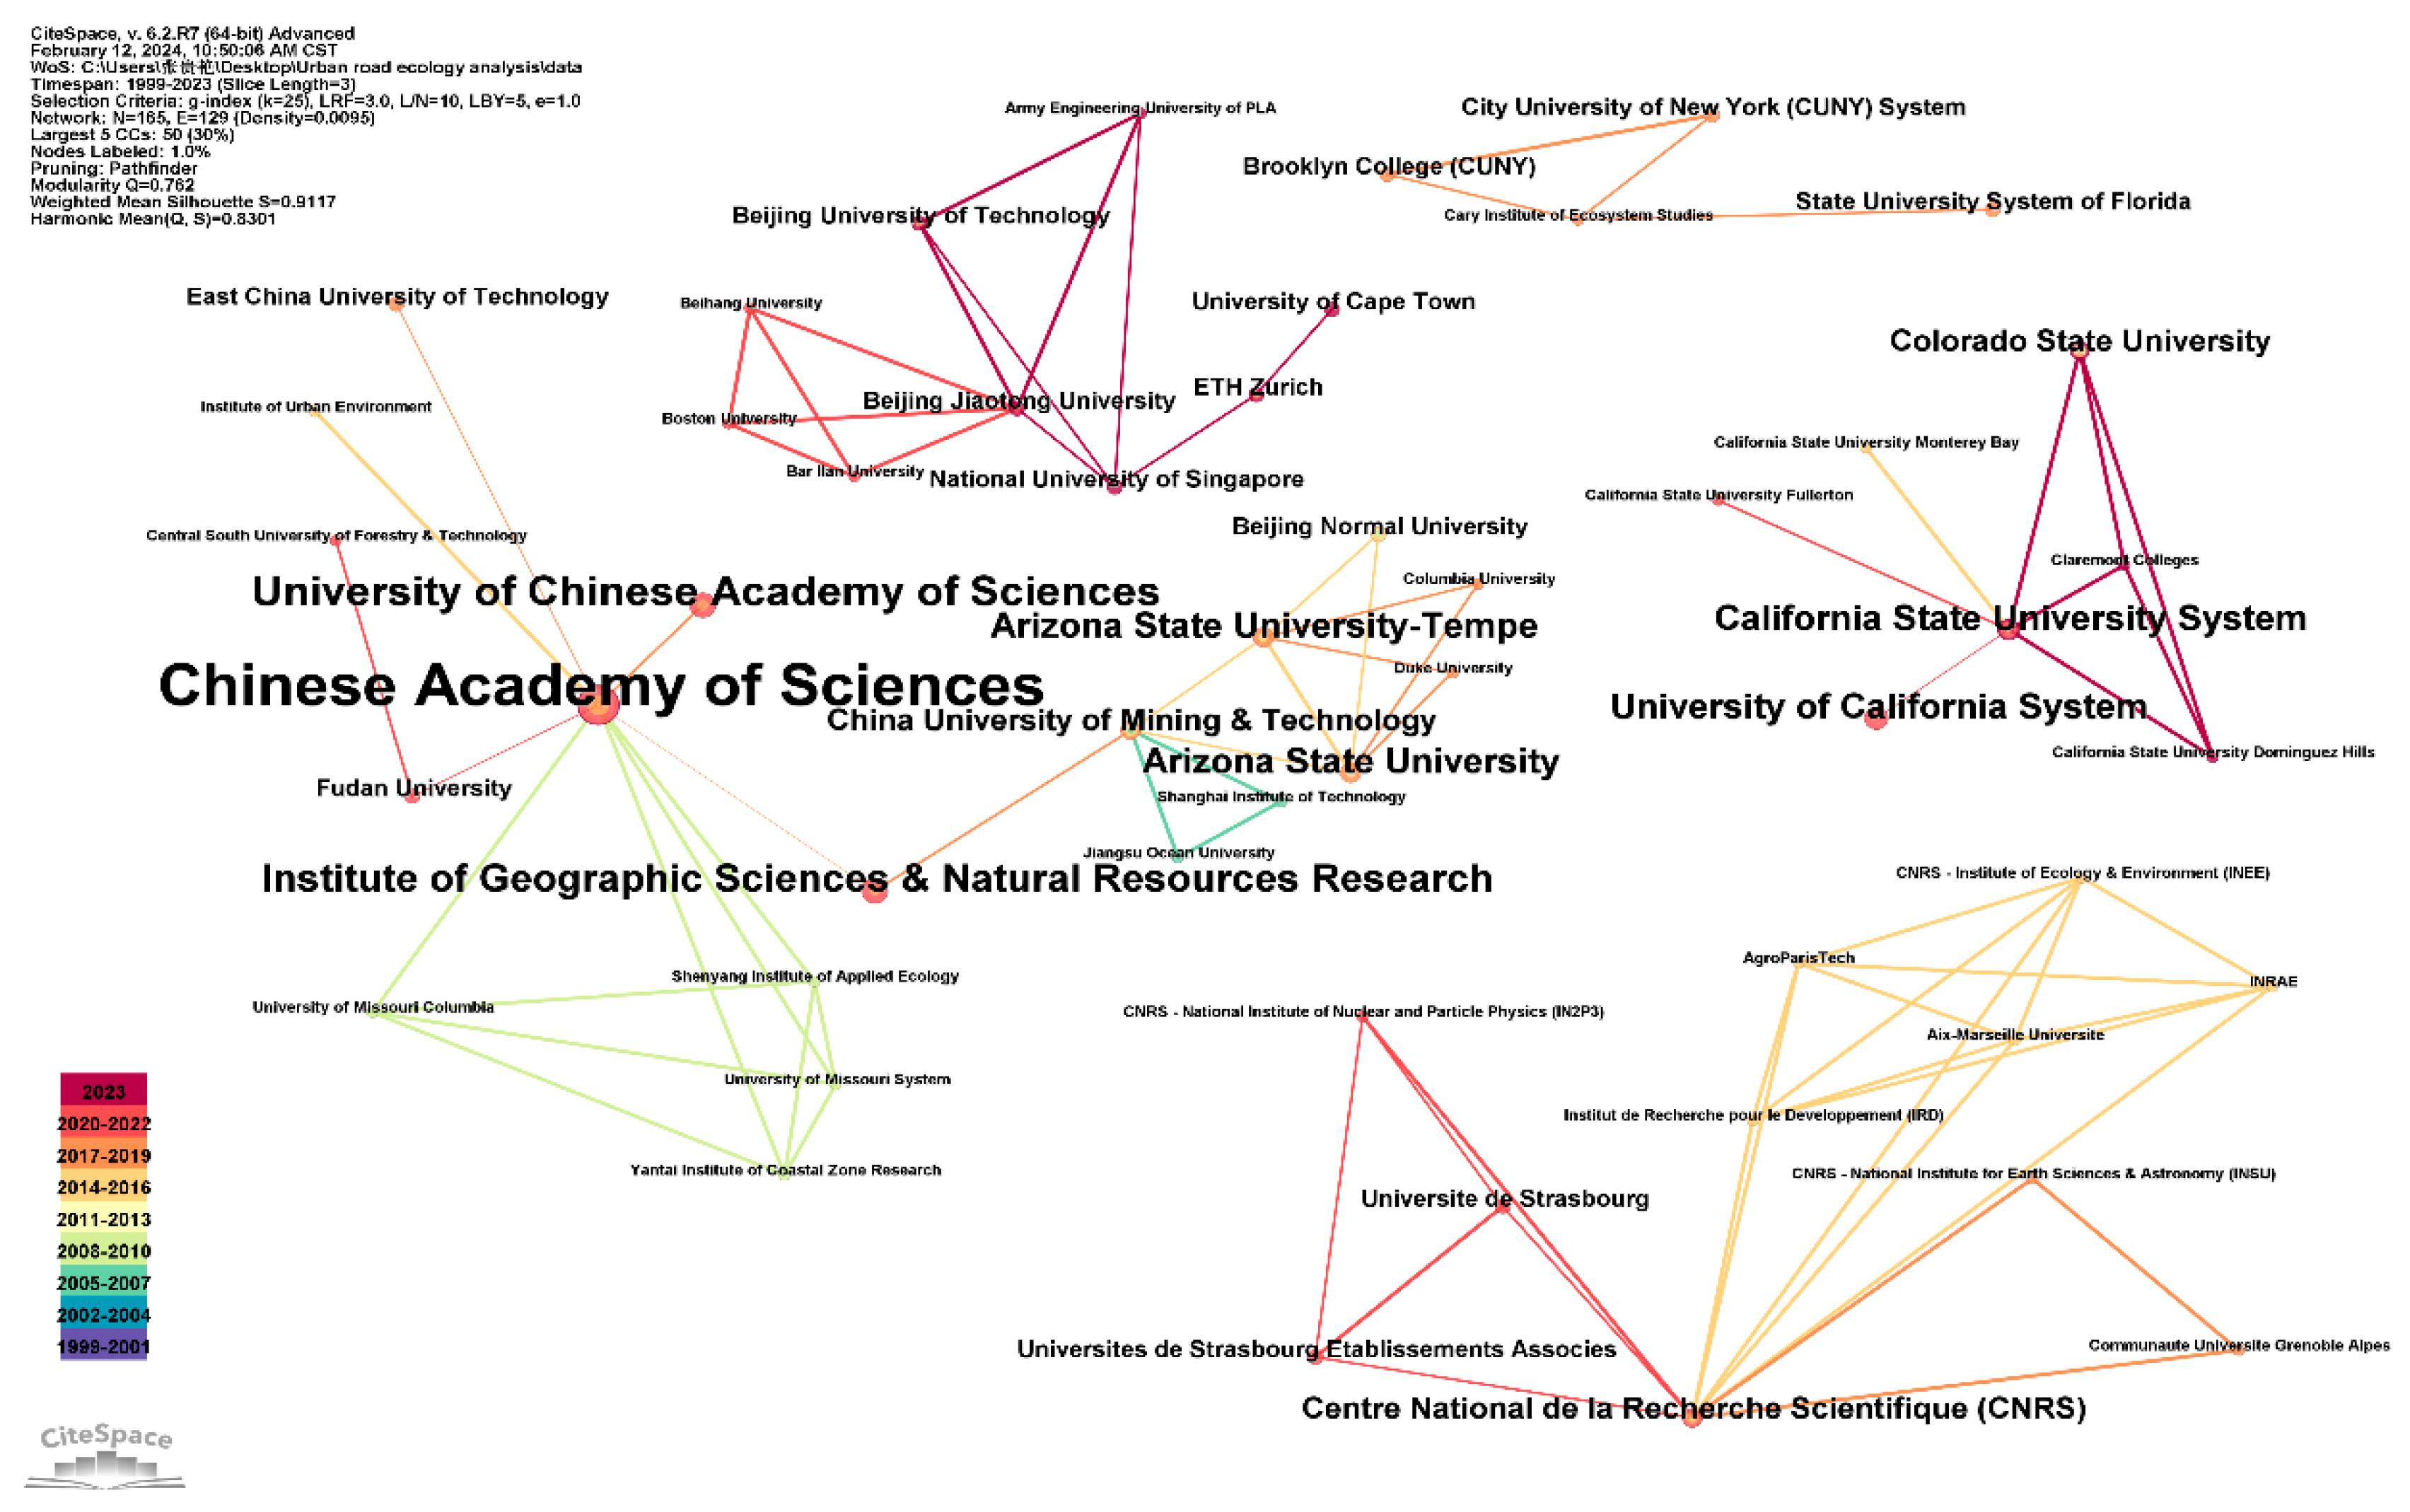
3.1.2. Institutional Cooperation Analysis

According to the Price formula, N m is the highest number of publications by the institution. In this study, it refers to the number of articles published in core journals by the Chinese Academy of Sciences, which is 15. N i represents the minimum number of publications for the core journal-issuing institutions in this specific field, which is approximated as three. Table 1 lists the publications of the 13 core journal-issuing institutions in the field of urban road ecology. The Chinese Academy of Sciences has a significant advantage in the number of articles published in core journals. In terms of the number of articles published in core journals, the University of Chinese Academy of Sciences and the Institute of Geographic Sciences and Natural Resources Research rank second and third, respectively.
Based on the fact that most institutions have published only one or two articles with low overall centrality, it is not difficult to see a similar research trend to that of single-author publications, i.e., a wider range of research in the field but not enough in-depth research (Figure 3).

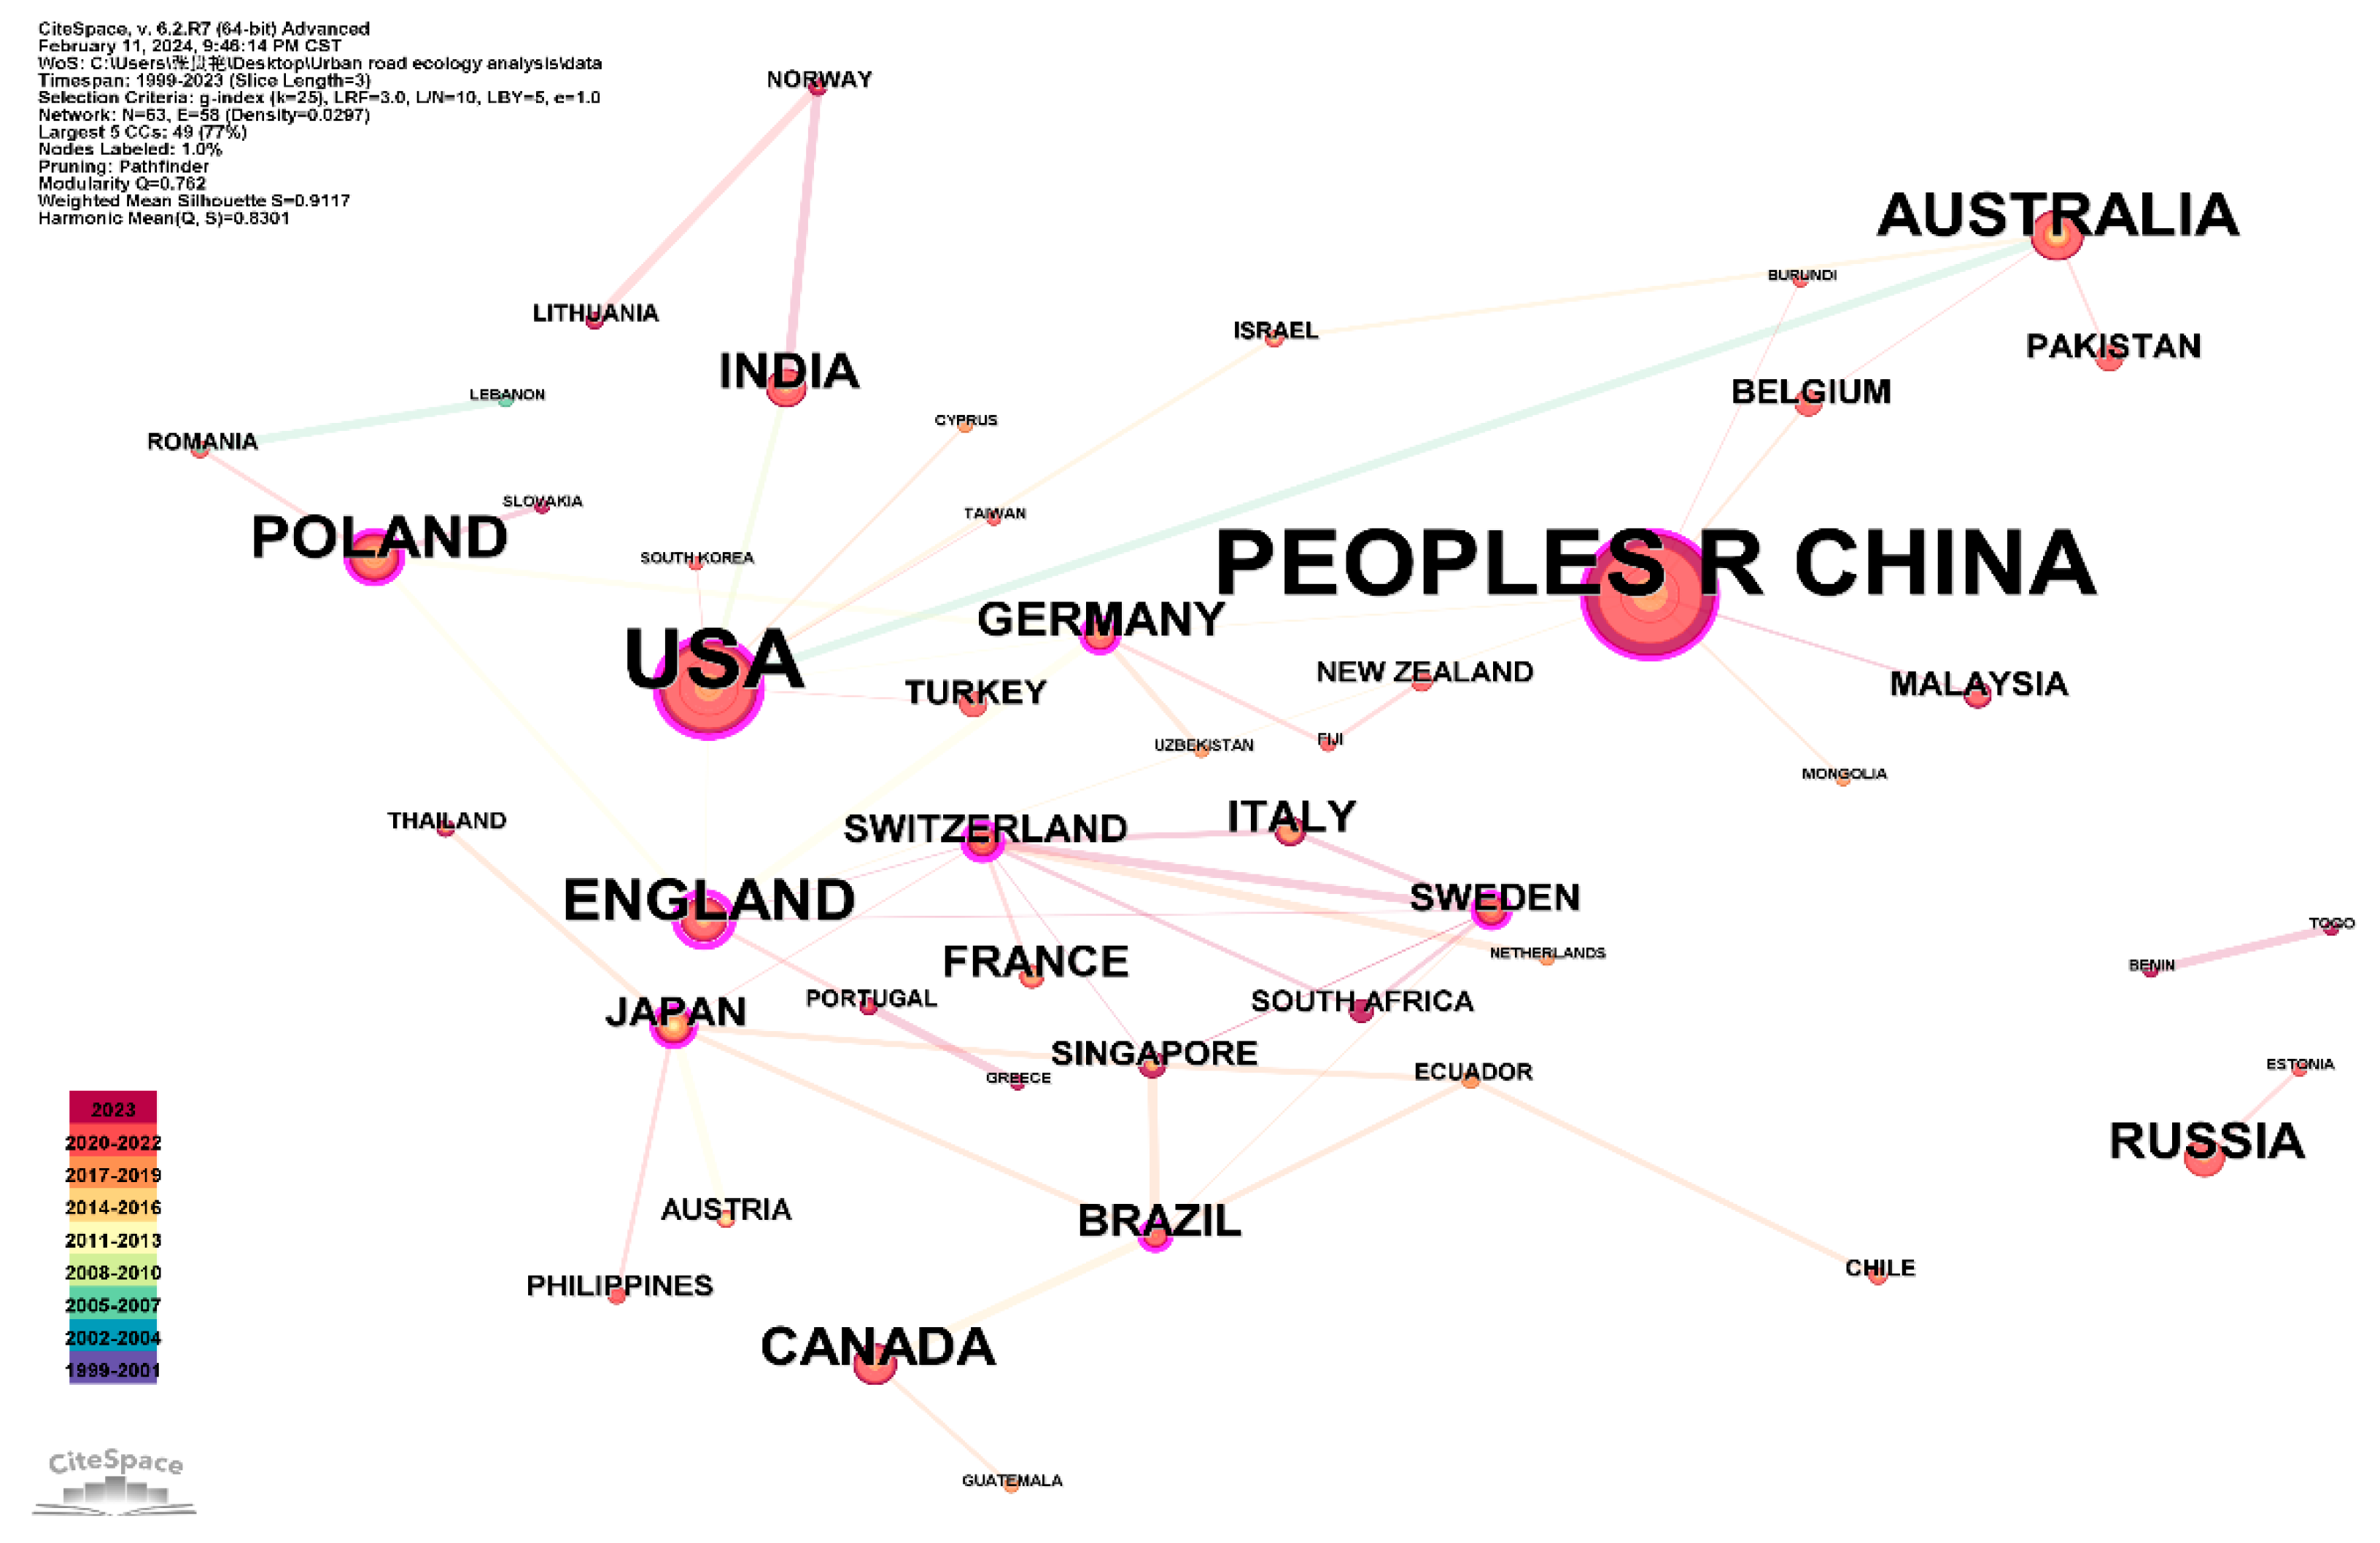
3.1.3. National Cooperation Analysis

Figure 4 illustrates how many countries have published core journal papers in this area, showing the contribution and role of each country in this field. China and the United States are not only the two countries with the highest number of publications in this field but also have the closest cooperation with other countries. Figure 5 and Figure 6 quantitatively display the publication status of the countries from a numerical perspective.
Chinese scholars have the highest number of publications, involving 106 core journal publications. However, the centrality of China is 0.23, which is still lower than that of the United States, which has a centrality of 0.37. It can be seen that China has contributed more to the research in this field, while the United States has the highest importance and core level in the entire research system.

3.2. Co-Citation Analysis

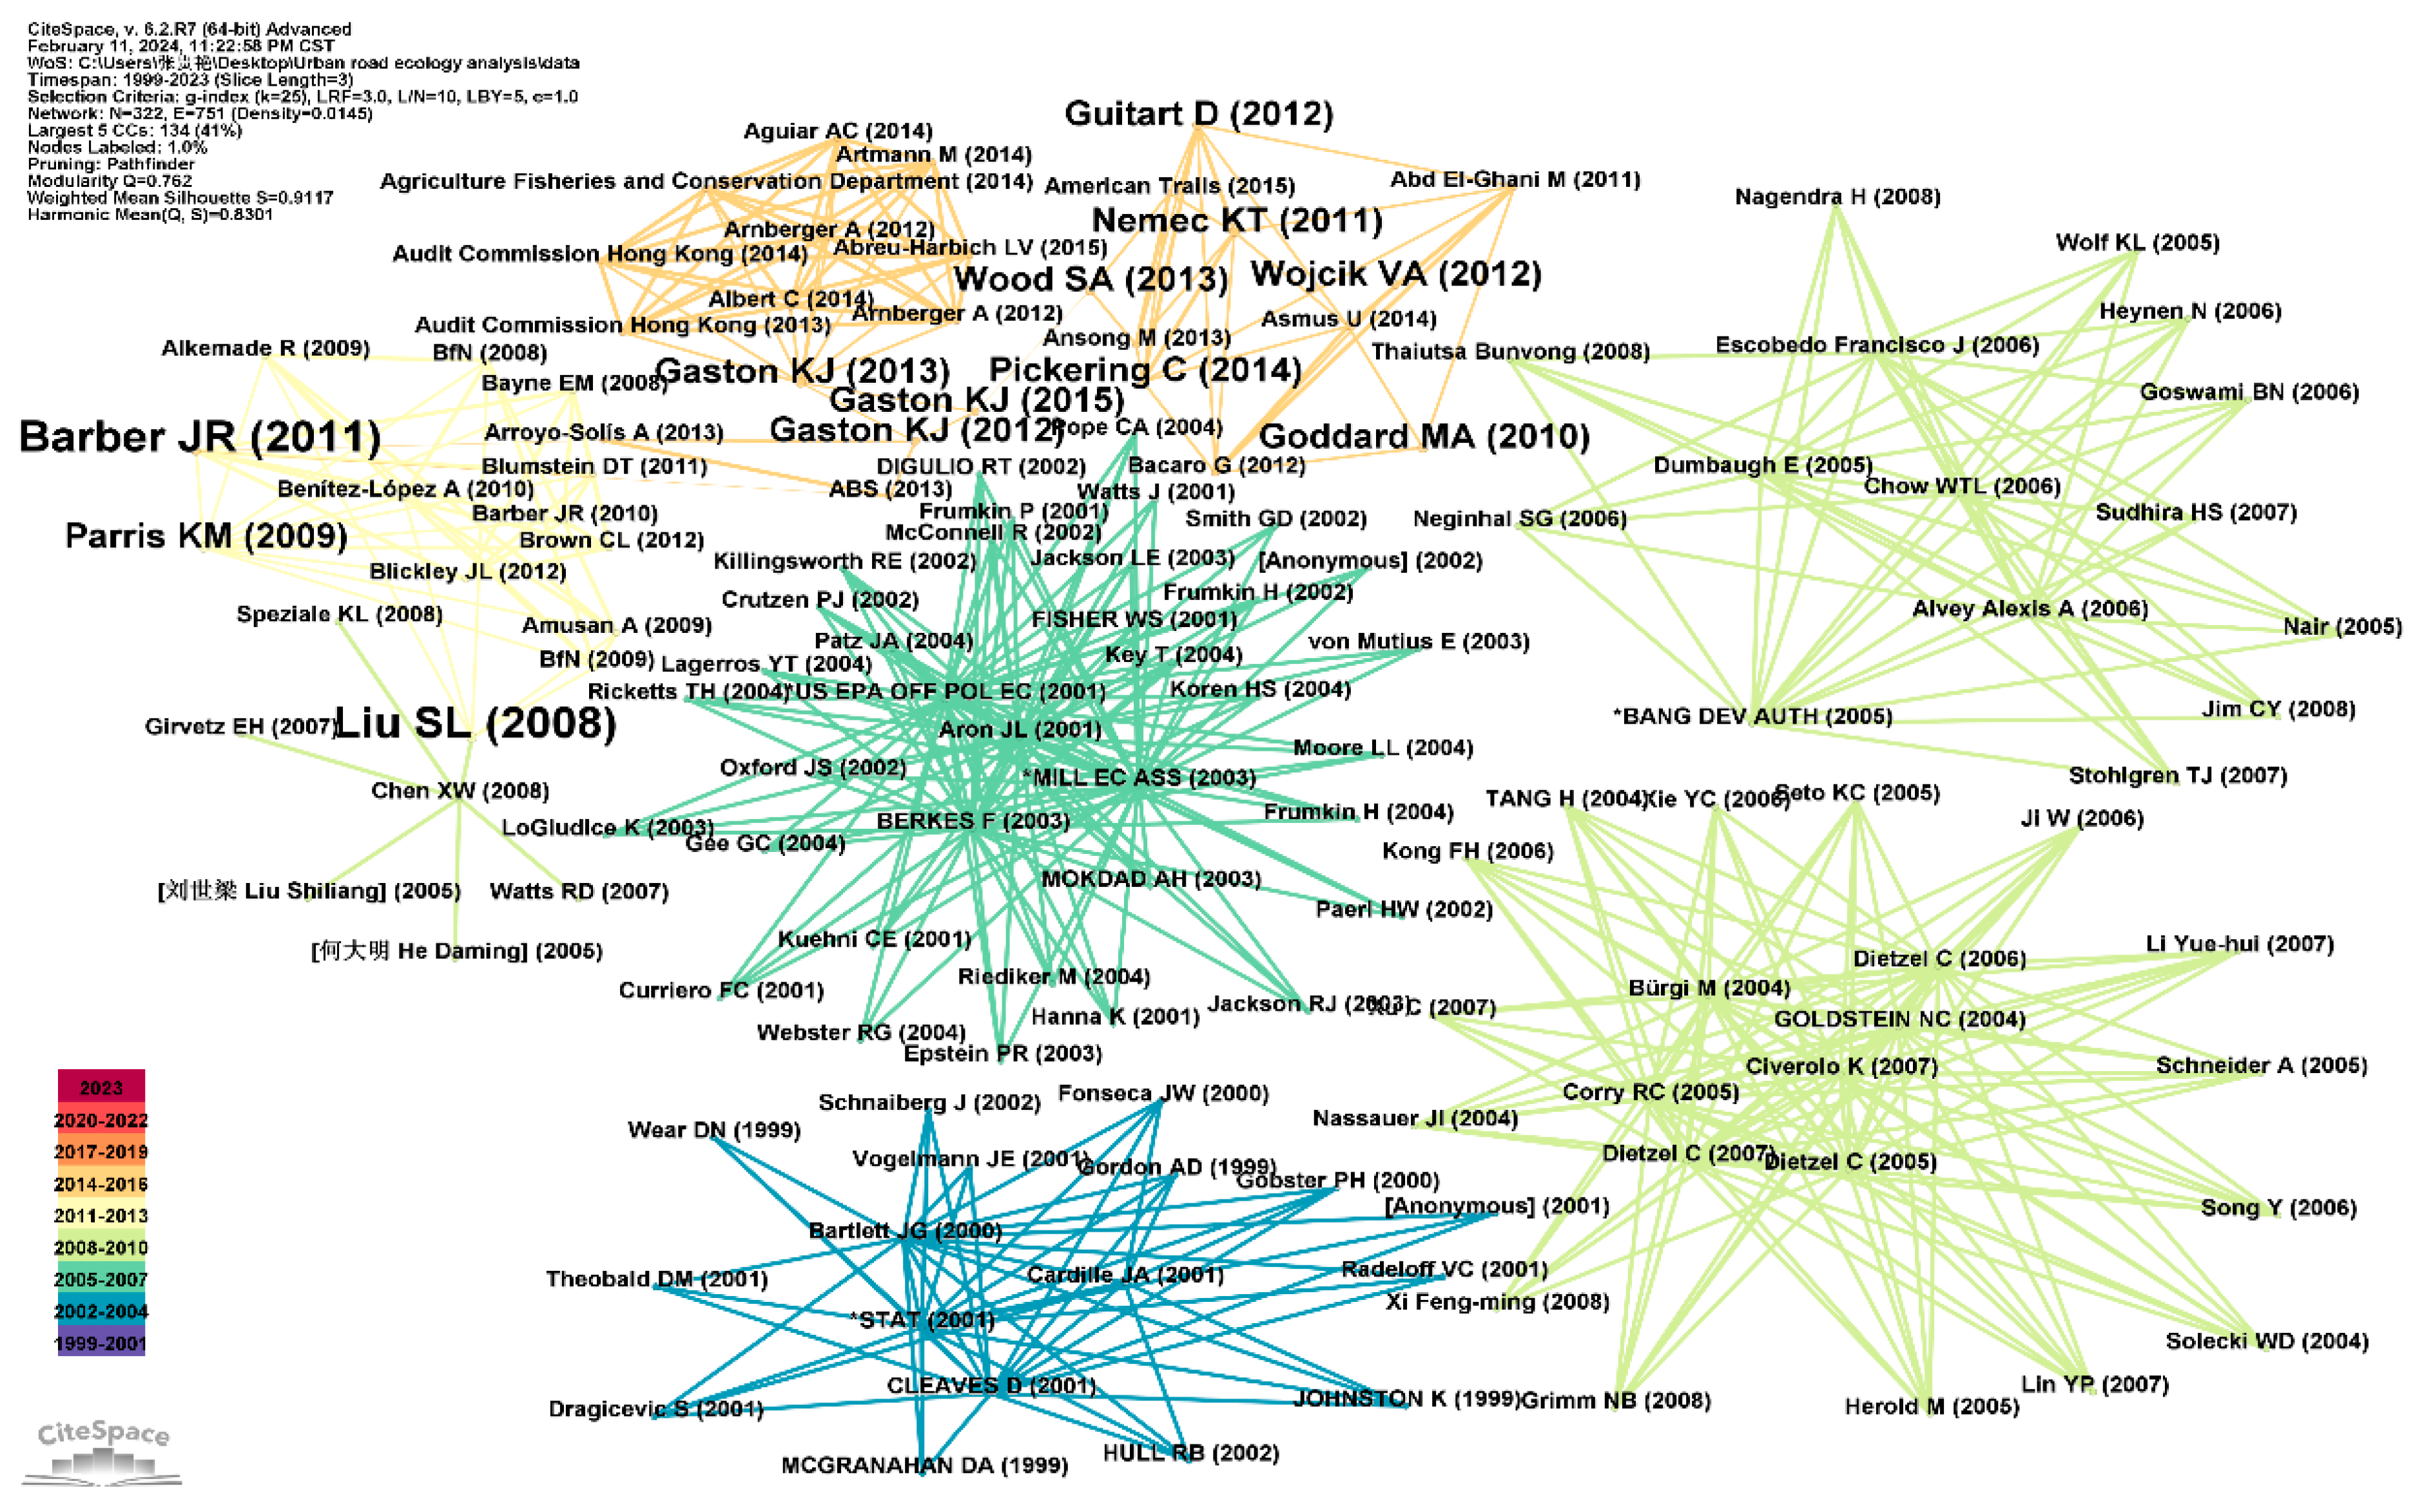
3.2.1. Citation Analysis of References

Reference co-citation analysis involves examining the references in the analyzed article. The number of citations and centrality are considered to identify the most influential literature in this field. The 322 co-cited papers that have been cited more than twice are presented in this study, as shown in Table 2.
According to Table 2, the article “Effects of landscape composition and pattern on land surface temperature: An urban heat island study in the megacities of Southeast Asia” was categorized as highly cited in the WOS database for being cited 636 times. In this article, the relationship between land surface temperature (LST) and the abundance and spatial pattern of impermeable surfaces and urban green spaces in several major cities was studied through Landsat data [16]. In addition, the keyword analysis shows that this article is the most frequently cited co-cited piece of literature. “Global socioeconomic material stocks rise 23-fold over the 20th century and require half of annual resource use” is classified as a highly cited piece of literature in the WOS database for being cited 329 times. This article analyzes the quantitative relationship between carbon dioxide emissions and changes in infrastructure construction material libraries, significantly contributing to the relationship between urban infrastructure construction and carbon emissions [17].
“Guidelines for the use of acoustic indices in environmental research” introduced a series of indices that describe ecological acoustics, allowing ecological acoustics to be quantitatively evaluated [18]. “Anthropogenic noise exposure in protected natural areas: estimating the scale of ecological consequences” analyzed the impact of artificial noise caused by roads and other factors on wildlife through simulation and predictions [19]. “GIS-based Analysis of Vienna’s Material Stock in Buildings” analyzed the inventory and the spatial distribution of the construction material stockpiles in a city through GIS technology using Vienna as an example [20]. “Evaluating the influence of road networks on landscape and regional ecological risk—A case study in Lancang River Valley of Southwest China“ performed a landscape impact analysis of roads in the Lancang River Basin using methods such as GIS buffer, spatial comparison, and scenario analysis [21]. “Taking Stock of Built Environment Stock Studies: Progress and Prospects” conducted a bibliometric analysis of the stock of building environments [22]. “A global strategy for road building” is a highly cited document (512 citations in the WOS database) that proposed a strategy based on road partitioning to maintain a balance between road expansion and the ecological environment [23].
The overall trend shows that co-cited literature has been cited fewer times and generally has lower centrality. All of these results demonstrate that research in the field of urban road ecology started relatively late and has not yet formed a highly correlated system, which is in a stage of rapid development (Figure 7).

3.2.2. Analysis of Cited Journals

The citation frequency of a cited article reflects the academic contribution of the journal in which it is cited, and the centrality of the cited article indicates the importance and influence of the journal within its respective field [15]. Figure 8 illustrates the node relationships of some of the highly cited journals, and Table 3 presents the specific data of the 20 most frequently cited journals. It can be seen that Landscape and Urban Planning is the most highly cited journal, demonstrating excellent value for academic research. It also has a significant advantage in its centrality compared to other journals. Therefore, it can be concluded that Landscape and Urban Planning is one of the most core journals in the field of urban road ecology. Similarly, the results also demonstrate that Biological Conservation and Science have made outstanding contributions in this research area (Figure 8).

3.3. Keyword Analysis

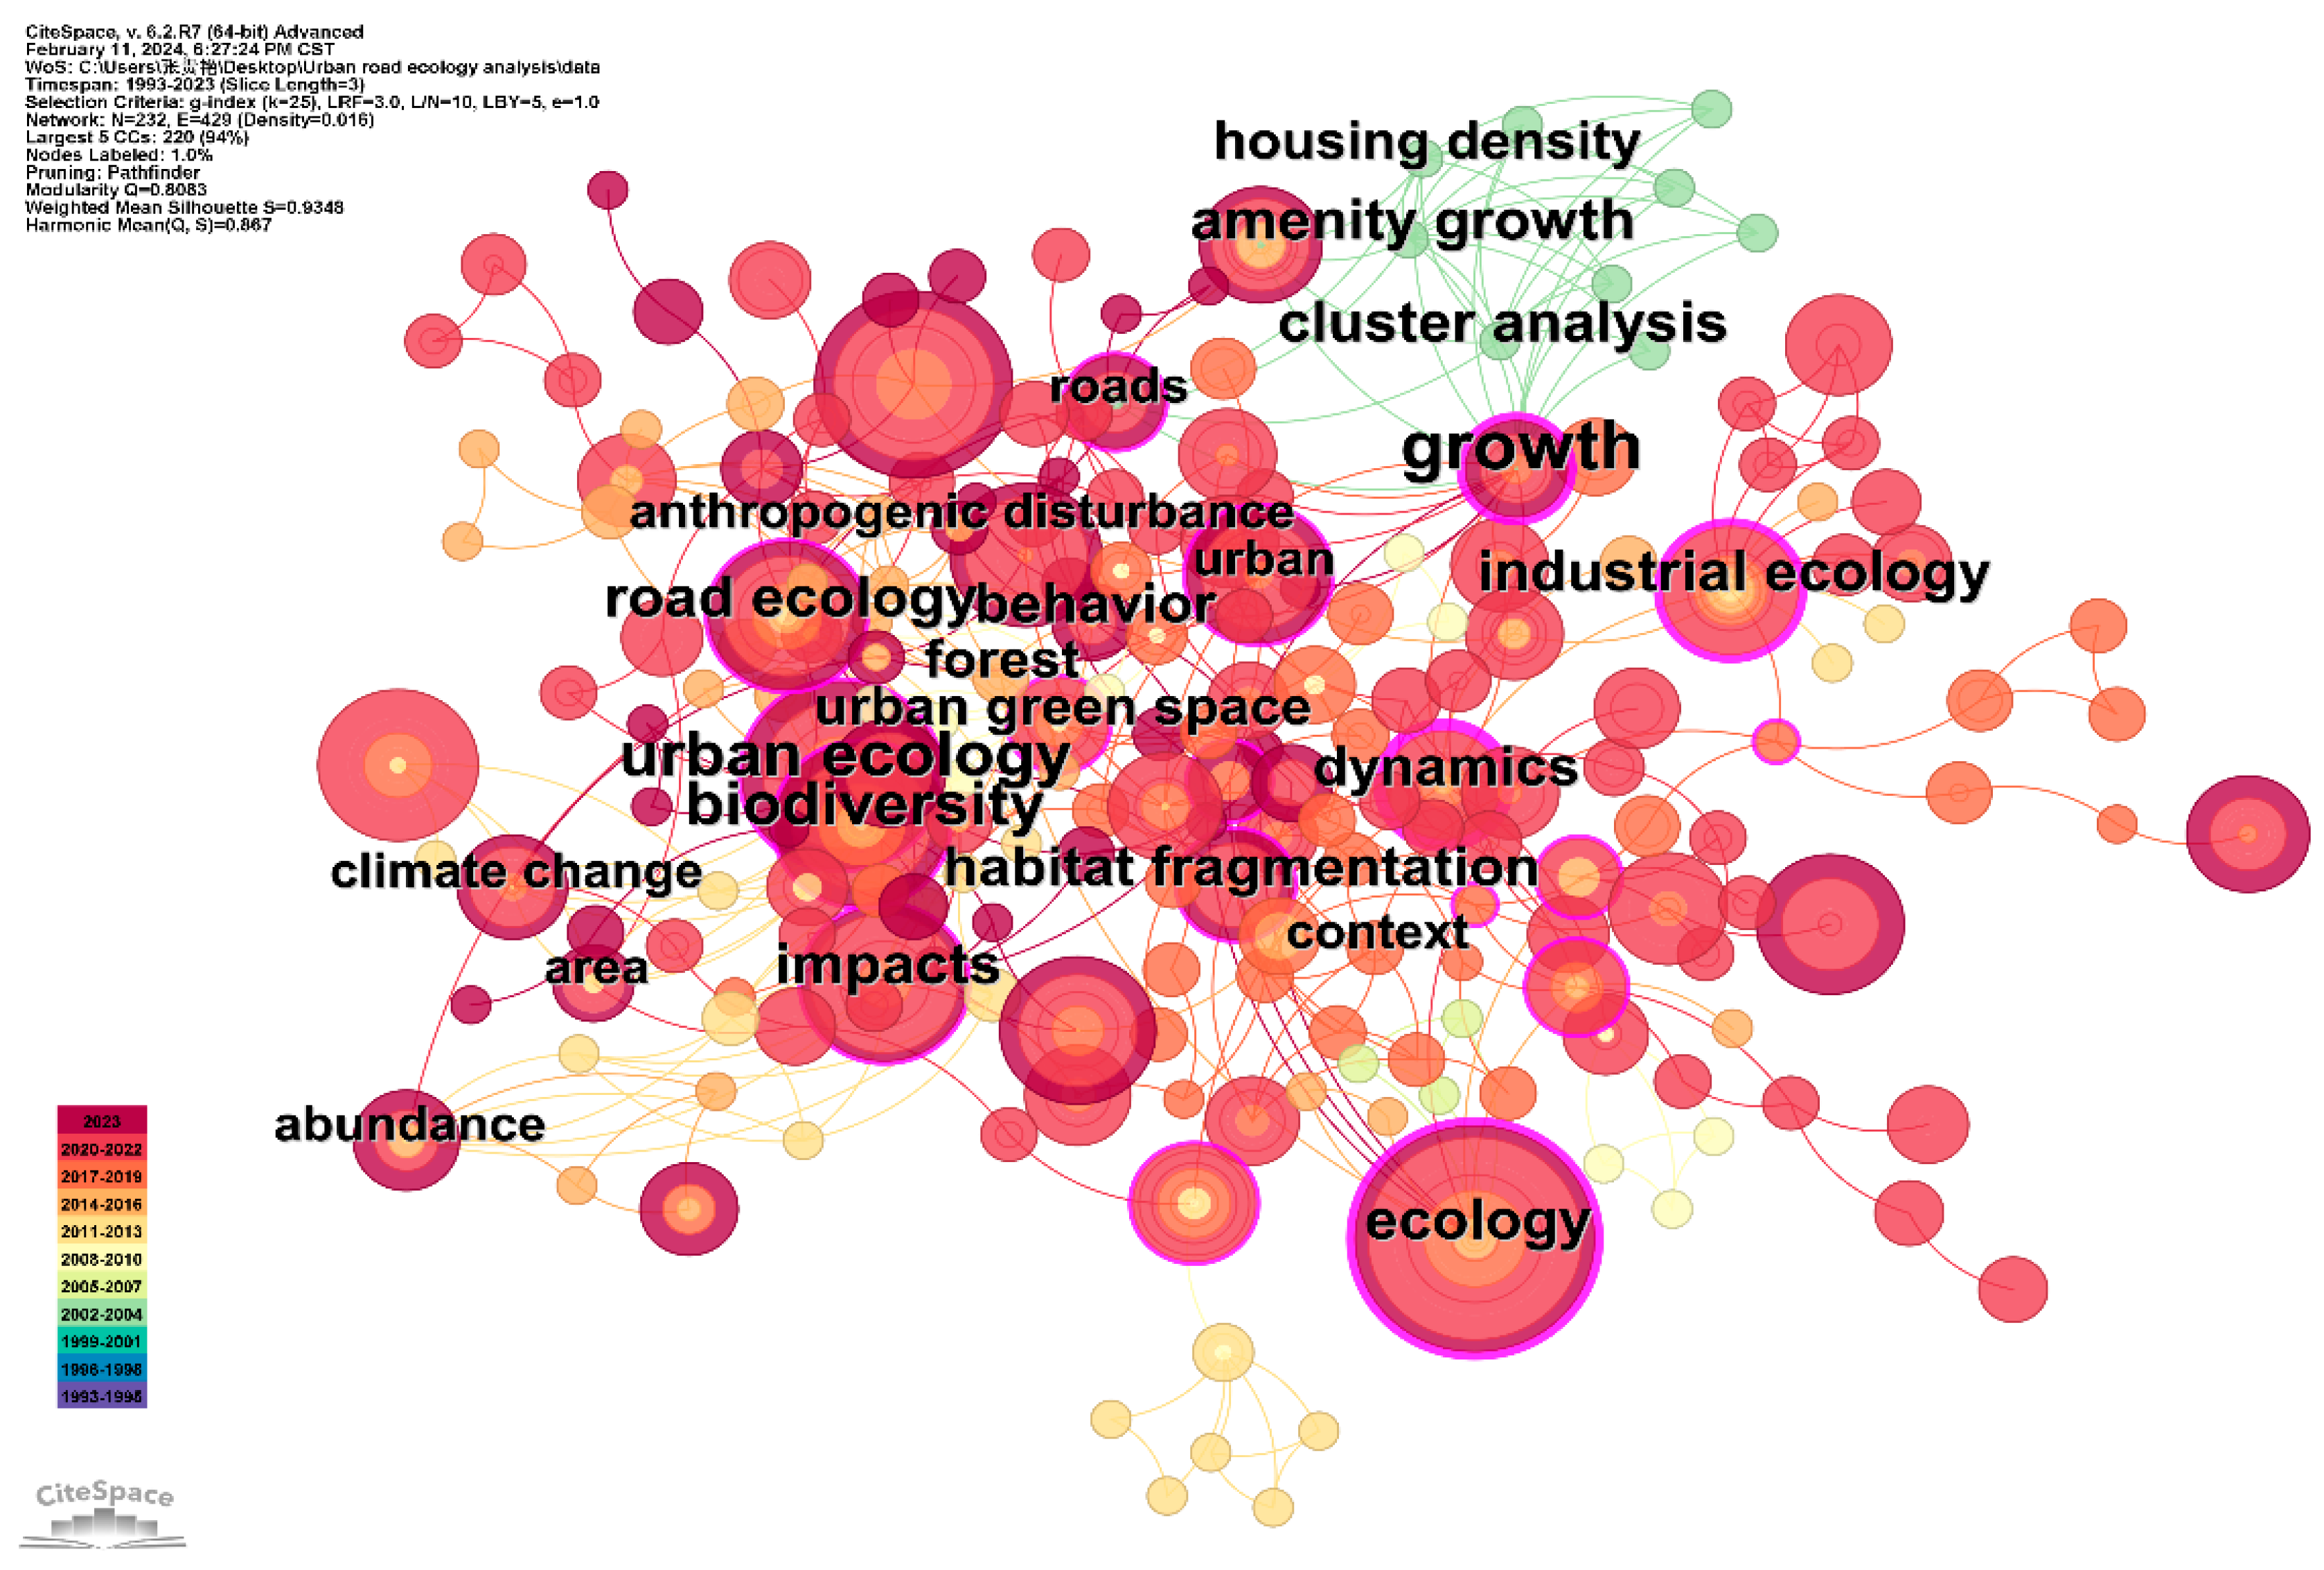
3.3.1. Keyword Co-Occurrence Analysis

As the highly summarized points of the article, keywords consist of two indicators that can measure the popularity and importance of the study in its corresponding field. Firstly, the frequency of a keyword is an important indication of how popular this keyword is in the corresponding field. As shown in Figure 9, a higher frequency of a keyword leads to a larger size of the circle of the node in which it is located and a larger font size. Ecology is the keyword with the highest frequency of occurrence. Secondly, centrality can measure the importance and connectivity of the keyword in the entire network. Its direct manifestation in the keyword co-occurrence analysis map is the sparseness of the connectivity. It is worth noting that the legend in the lower left corner allows for the determination of the approximate time period in which the keyword was researched based on the color of the shape in the keyword co-occurrence analysis map. The time zone map analyses in the following text will provide a more explicit and accurate representation of the time zones in which the keywords appear (Figure 9).
Table 4 lists the top ten keywords in terms of frequency, as well as their frequency values and centrality values. Among them, “ecology”, “urban ecology”, “city”, and “road ecology” are the core keywords because they are directly related to the searched terms. In addition to the above words, “biodiversity” and “impacts” have become high-frequency and highly important keywords. The earliest relevant piece of literature related to “Biodiversity” appeared in 2010, and the earliest piece of literature related to “impacts” appeared in 2013. This result indicates that more scholars began to pay attention to the studies on the impact of urban transportation infrastructure construction on biodiversity in 2010. Subsequently, the scope of research on this impact gradually developed into more dimensions, such as noise and air pollution, suggesting that some research topics and tools in the field of roads and ecology have been extensively applied in the study of urban road ecology. Notably, the keywords “model” and “ecosystem services” appeared in 2019 and 2020, respectively, and are relatively high-frequency topics among the keywords that have emerged in recent years. However, the relatively low centralities of these two keywords may be due to more models for the evaluation of ecological environments, such as multivariate logistic regression models and multicriteria assessment models. Furthermore, the value of ecosystems is also a hot topic in ecological environment assessment this year. As articles discussing this topic have a relatively short appearance and low relevance to other articles in this field, this topic is in a developmental stage and is of value for further research.

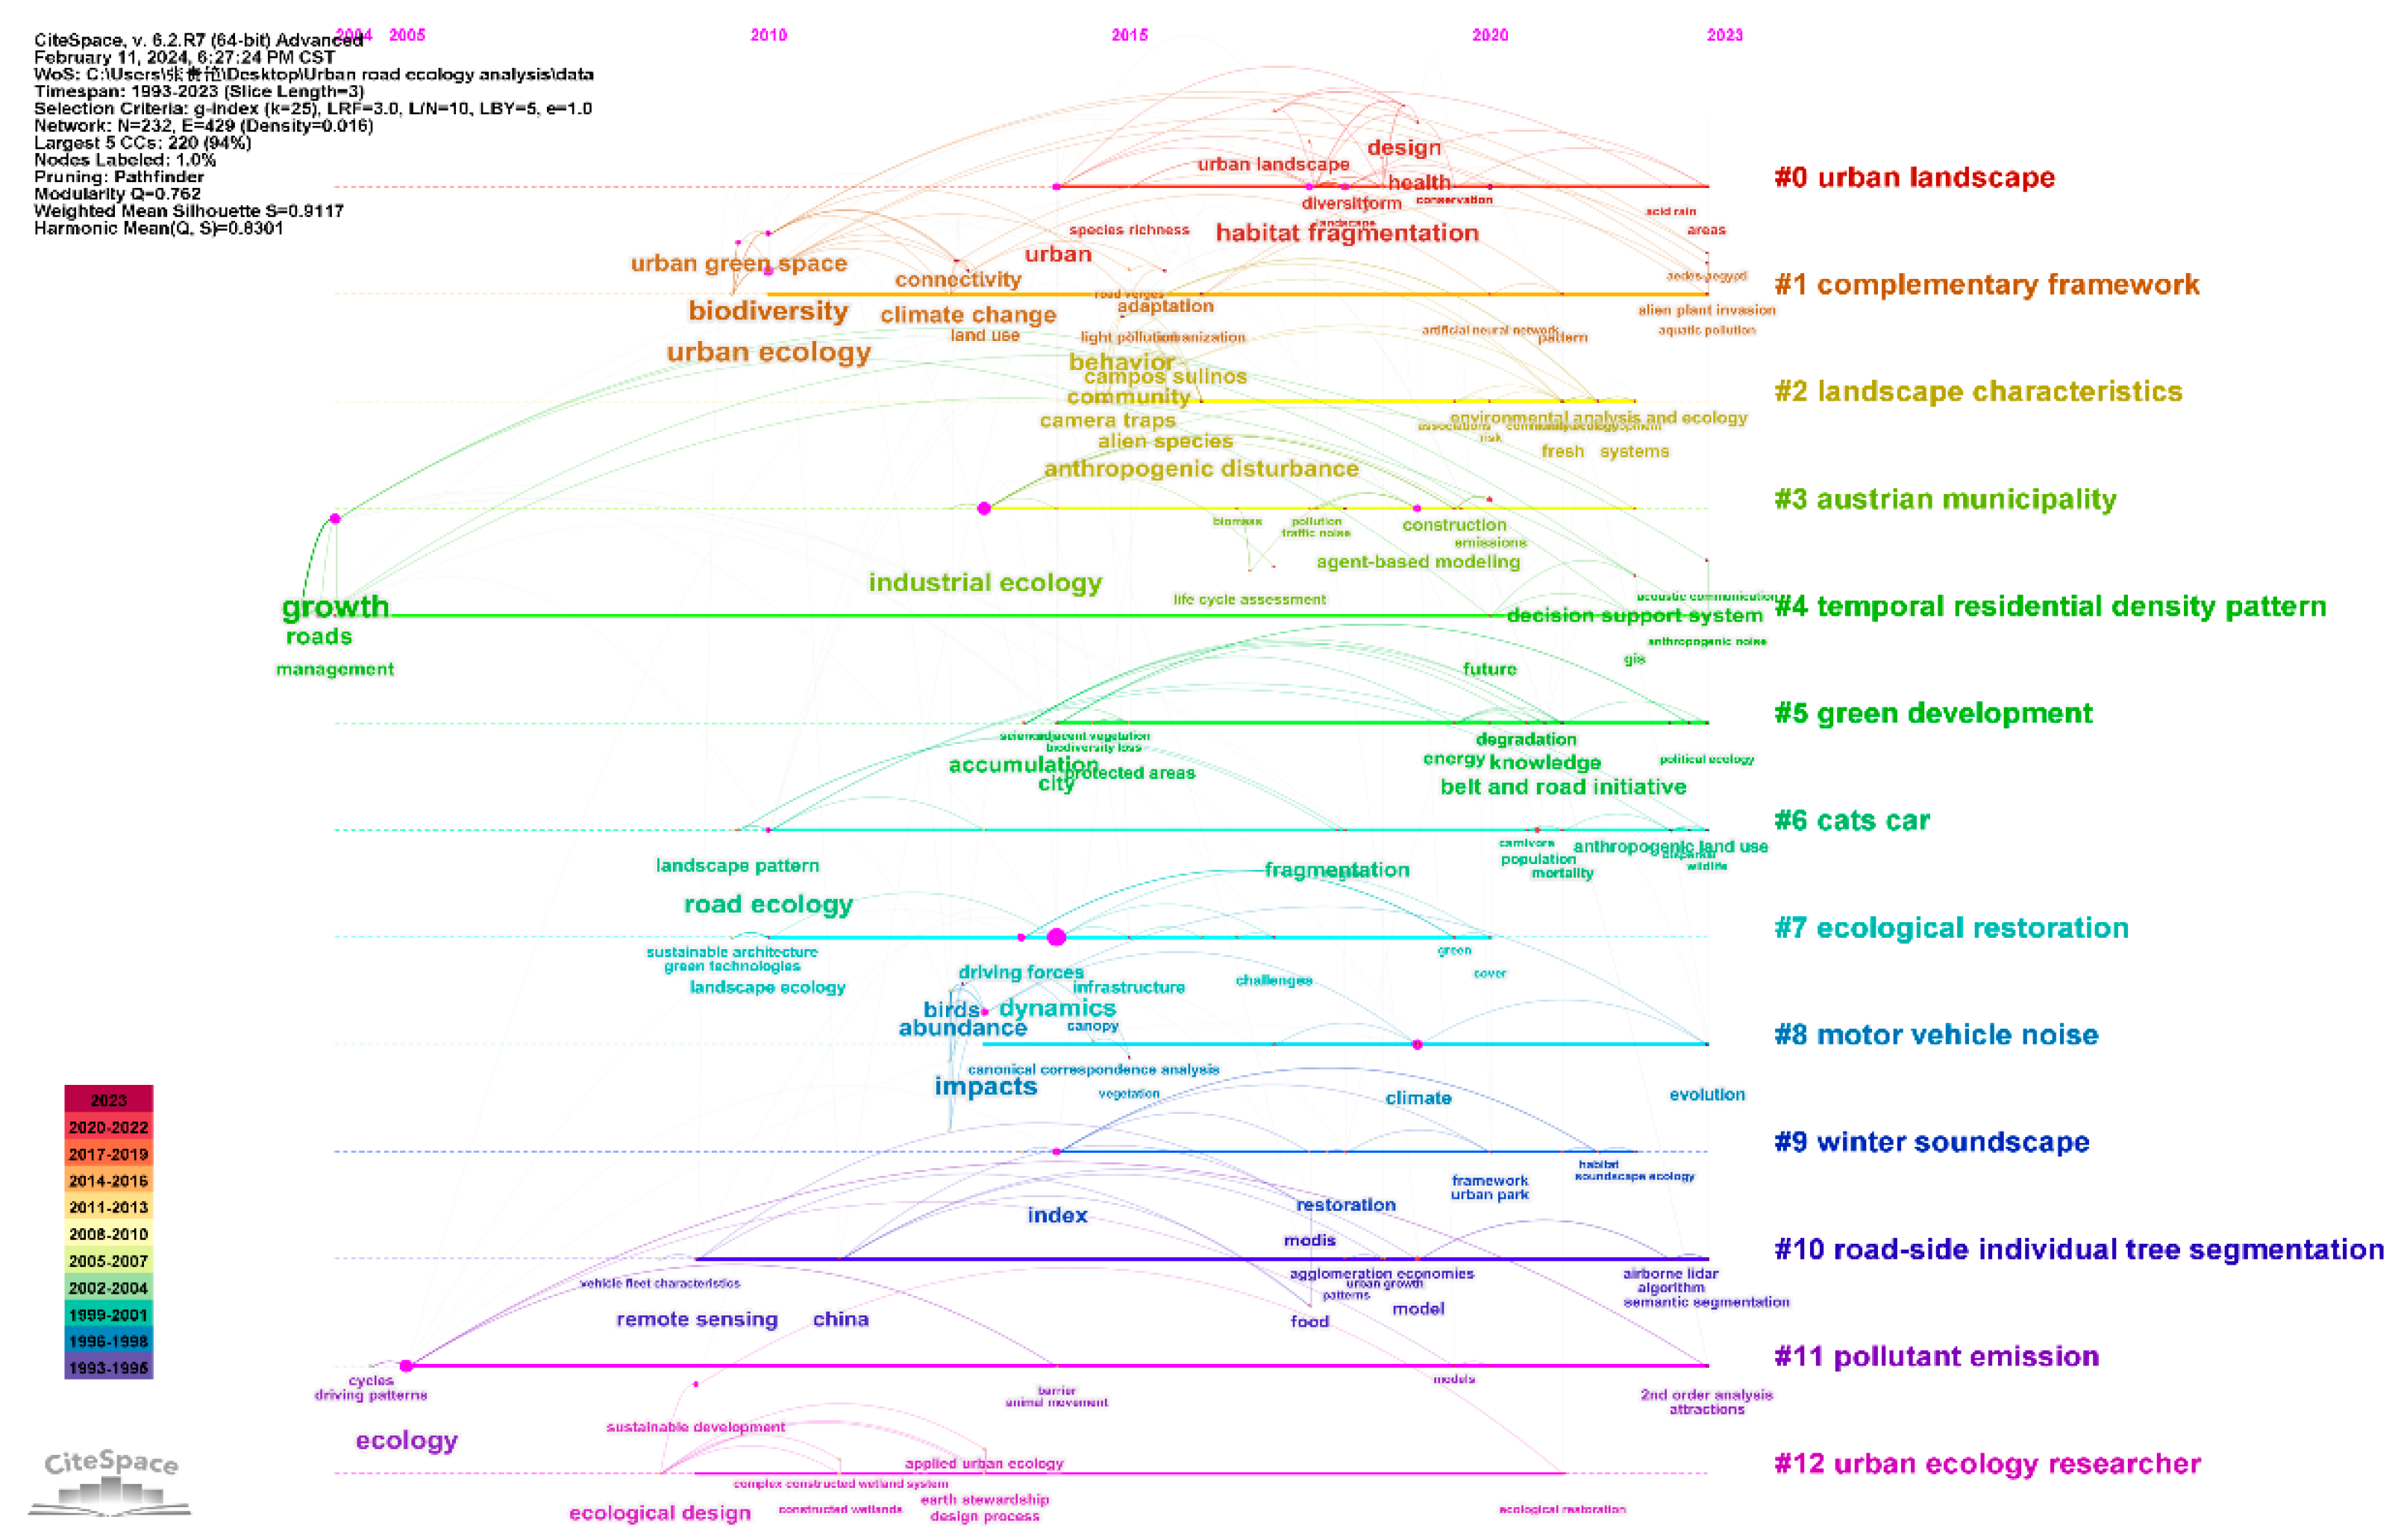
3.3.2. Keyword Clustering Analysis

In order to deeply explore the research hotspots presented in this field, this paper adopted the LLR (Log Likelihood Ratio) algorithm to perform the clustering analysis. A total of 13 clustered sections were obtained, as shown in Figure 10. According to the theory proposed by Chen Chaomei, the cluster analysis demonstrates a modular value (Q value) of 0.726, where a Q value greater than 0.3 indicates a significant clustering result. Additionally, the average contour value (S value) of this clustering analysis is 0.9117, suggesting highly convincing clustering results (S value above 0.7). On this basis, it is evident that the obtained clustering results are trustworthy (Figure 10).
Based on the results presented in Figure 10 and Table 5, 13 clustering results were divided into four major categories, including concept analysis (green highlight in Table 5, focusing on some core concepts in this field); framework optimization analysis (blue highlight in Table 5, focusing on optimization frameworks); problem and current situation analysis (orange highlight in Table 5, focusing on existing issues and corresponding solutions); and research method analysis (purple highlight in Table 5, focusing on methods, with many methods proposed and introduced from other disciplines).
Clusters #0, #5, and #6 highlight the interpretation of some core concepts (green). Cluster #0 refers to the urban landscape, which focuses on topics such as ecosystem service, landscape friction, accessible food resources, and reported life satisfaction. Bruce et al. proposed that transformed landscape zones, such as roads or vegetation, may be habitats for animals, making it necessary to quantitatively analyze the impact of these habitats on animals [25]. Dallara et al. proposed a multi-standard approach for projects related to open spaces along urban road networks, with particular emphasis on green spaces at roundabouts [26]. Frohlich et al. discussed the impact of urban noise pollution on the spatial distribution of long-eared owl (Asio otus) populations [27]. Johansson emphasized the need for infrastructure construction to consider its impact on biological habitats. The viewpoint that bees are very sensitive to interference from large roads was analyzed from three perspectives: total number of food habitats, weighted total number of food habitats, and friction of surrounding landscapes [28]. Cluster #5 refers to green development, focusing on topics such as green belts and roads, political ecology perspective, extended infrastructure landscape, and gateway projects. Jarasuniene and Bazaras conceptually explained the meaning of green logistics and suggested some conceptual perspectives to improve transportation sustainability [29]. Ballantyne and Pickering assessed the impact of urban trails on the environment, including soil and vegetation [30]. Li et al. conducted a graded assessment of urban road green space pollution caused by deicing salt [31]. Cluster #6 refers to cars for cats, mainly discussing topics such as endangered felines, road networks, urban landscape patterns, and road centrality. Lin et al. developed the geographically weighted regression (GWR) model to quantitatively analyze landscape patterns and landscape ecological risk (LER) using the road network of the Minjiang River in Fujian as an example [32]. Based on traditional quantitative parameters of road network impacts, such as road density and buffer zones, Fu et al. innovatively proposed the RV (roadless volume) index and discovered some quantitative relationships between road network disturbance and urban ecological landscape [10].
Both Cluster #1 and Cluster #7 highlight the concept of an optimized framework that provides recommendations for ecologically sustainable urban development (dark blue). Cluster #1 refers to the complementary framework, which focuses on subjects such as street trees, density diversity composition, potential cases, and urban parrots. Kattel et al. proposed a supplementary framework for urban ecology called “E-LAUD”, aiming at promoting coordinated development between urban ecology and urban infrastructure construction [33]. He et al. explored the spatial and temporal characteristics of urban scent landscapes [34]. Izuddin and Webb developed a generalized linear mixed model to analyze the factors associated with epiphyte diversity in roadside trees [35]. Wemple et al. conducted a case study with seven cities as cases to explore the impact of tropical urban roads on ecological hydrology, providing pertinent recommendations for construction [36]. Cluster #7 refers to ecological restoration, focusing on subjects such as urban green areas, north-western Italy, integrated expansibility, and comprehensive analytical frameworks. Zhang et al. constructed a comprehensive analysis framework for ecological land use based on GIS spatial analysis, the landscape index, the Moran index, and multiple logistic regression models. This framework enabled the simulation of historical trajectories, the analysis of driving factors, and the prediction of future changes. Therefore, a case study was conducted in Guangzhou using this framework [12]. Xu et al. studied the response of urban management efficiency for production factors and identified four characteristics of urban management efficiency. Based on this, a series of policy recommendations were put forward to promote urban governance and sustainable development [37].
Clusters #2, #8, #9, #11, and #12 place more emphasis on evaluating and analyzing the current situation and potential problems (orange). Cluster #2 mainly discusses landscape characteristics, involving subjects such as noise pollution, road density light, squirrel glider, and urban encroachment. Cordero et al. evaluated and analyzed traffic configurations and road landscapes for canary cultivation using binary logistic regression models combined with remote sensing [38]. Cluster #8 refers to motor vehicle noise, focusing on topics such as the novel landscape index, the spatial road disturbance index, Brandenburg, Germany, and conservation planning. In order to evaluate the negative impact of road construction on the ecosystem, Freudenberger et al. proposed the spatial road disturbance index (SPROADI) based on three subindices, including traffic intensity, vicinity impact, and fragmentation grade [39]. Brown et al. discussed another method for detecting the noise generated by road motor vehicles and statistically categorized the noise [40]. Cluster #9 refers to the winter soundscape, focusing on subjects such as different road types, variable effects, study design rationale, and acoustic quality. Quinn et al. analyzed sound recorded at 19 locations near roads using eight soundscape indices related to traffic and land cover [41]. Cluster #11 covers pollutant emissions, which mainly discusses subjects such as the de-France region, operating conditions, utilization pressures, and urban commons. André et al. used the French region as an example to establish connections between bus operation data and geographic and urban characteristic functions to evaluate bus emissions and pollution [42]. Cluster #12 refers to urban ecology researchers with an emphasis on topics such as design process, urban wastewater treatment, innovative direction, and new challenges. Cui and Jiang proposed a highway landscape strategy related to urban highway resource management [43].
Cluster #3, Cluster #4, and Cluster #10 are associated with some research methods (light blue). Cluster #3 introduces the Austrian municipality, focusing on subjects such as material flow analysis study, the transport sector, material stock development, and noise footprint. Grossegger quantitatively analyzed the material flow and inventory of asphalt in the road network of a city in Austria [44]. Cluster #4 discusses the temporal residential density pattern, with a main emphasis on subjects such as North Central, the analytical hierarchy process, urban sprawl susceptibility analysis, and Sialkot city. Hammer et al. explored the dynamic process of housing density changes in the central and northern regions of the USA through cluster analysis using data from 1940 to 1990 for two indicators, including the attributes of housing density and housing growth per decade [45]. Akmal et al. used remote sensing (RS) and geographic information systems (GISs) to identify, calculate, analyze, and map the sensitivity of urban sprawl. Specifically, they established a multicriteria evaluation model and input indicators, including the land cover, the digital elevation model (DEM), the population density, and the road proximity in the model. The weights of these indicators were estimated based on the dynamics of urban sprawl between each decade. Moreover, the Analytical Hierarchy Process (AHP) was adopted to assess the sensitivity of urban sprawl and patterns in Sialkot City [46]. Cluster #10 discusses roadside individual tree segmentation, encompassing topics such as metric learning, urban mobile laser scanning (MLS) point clouds, city-level comparison, and the global belt. Wang et al. proposed a deep learning framework combining semantic and instance segmentation for extracting individual roadside trees from vehicle-mounted MLS point clouds [47]. Liu et al. proposed a research method based on a large amount of data, including logical models for quantifying urbanization processes, partial ternary analysis methods for examining the dynamic relationship between rural population migration and urbanization, and random forest algorithms for determining the relationship between urbanization and spatial driving forces [48].

3.3.3. Keyword Timeline Analysis Based on Cluster Results

The clustering results in Section 3.3.2 are presented on a timeline axis, as shown in Figure 11. It can be seen that all 13 types of research are characterized by a late start. Cluster #4 and Cluster #11 have a relatively long research history. Prior to 2010, there was a significant research focus on “grows” and “road” within Cluster #4, as well as on “driving patterns” within Cluster #11. Most of the studies in the other clusters started around 2010, which is consistent with the analysis results that research in this field started late and is still in the development stage (Figure 11).

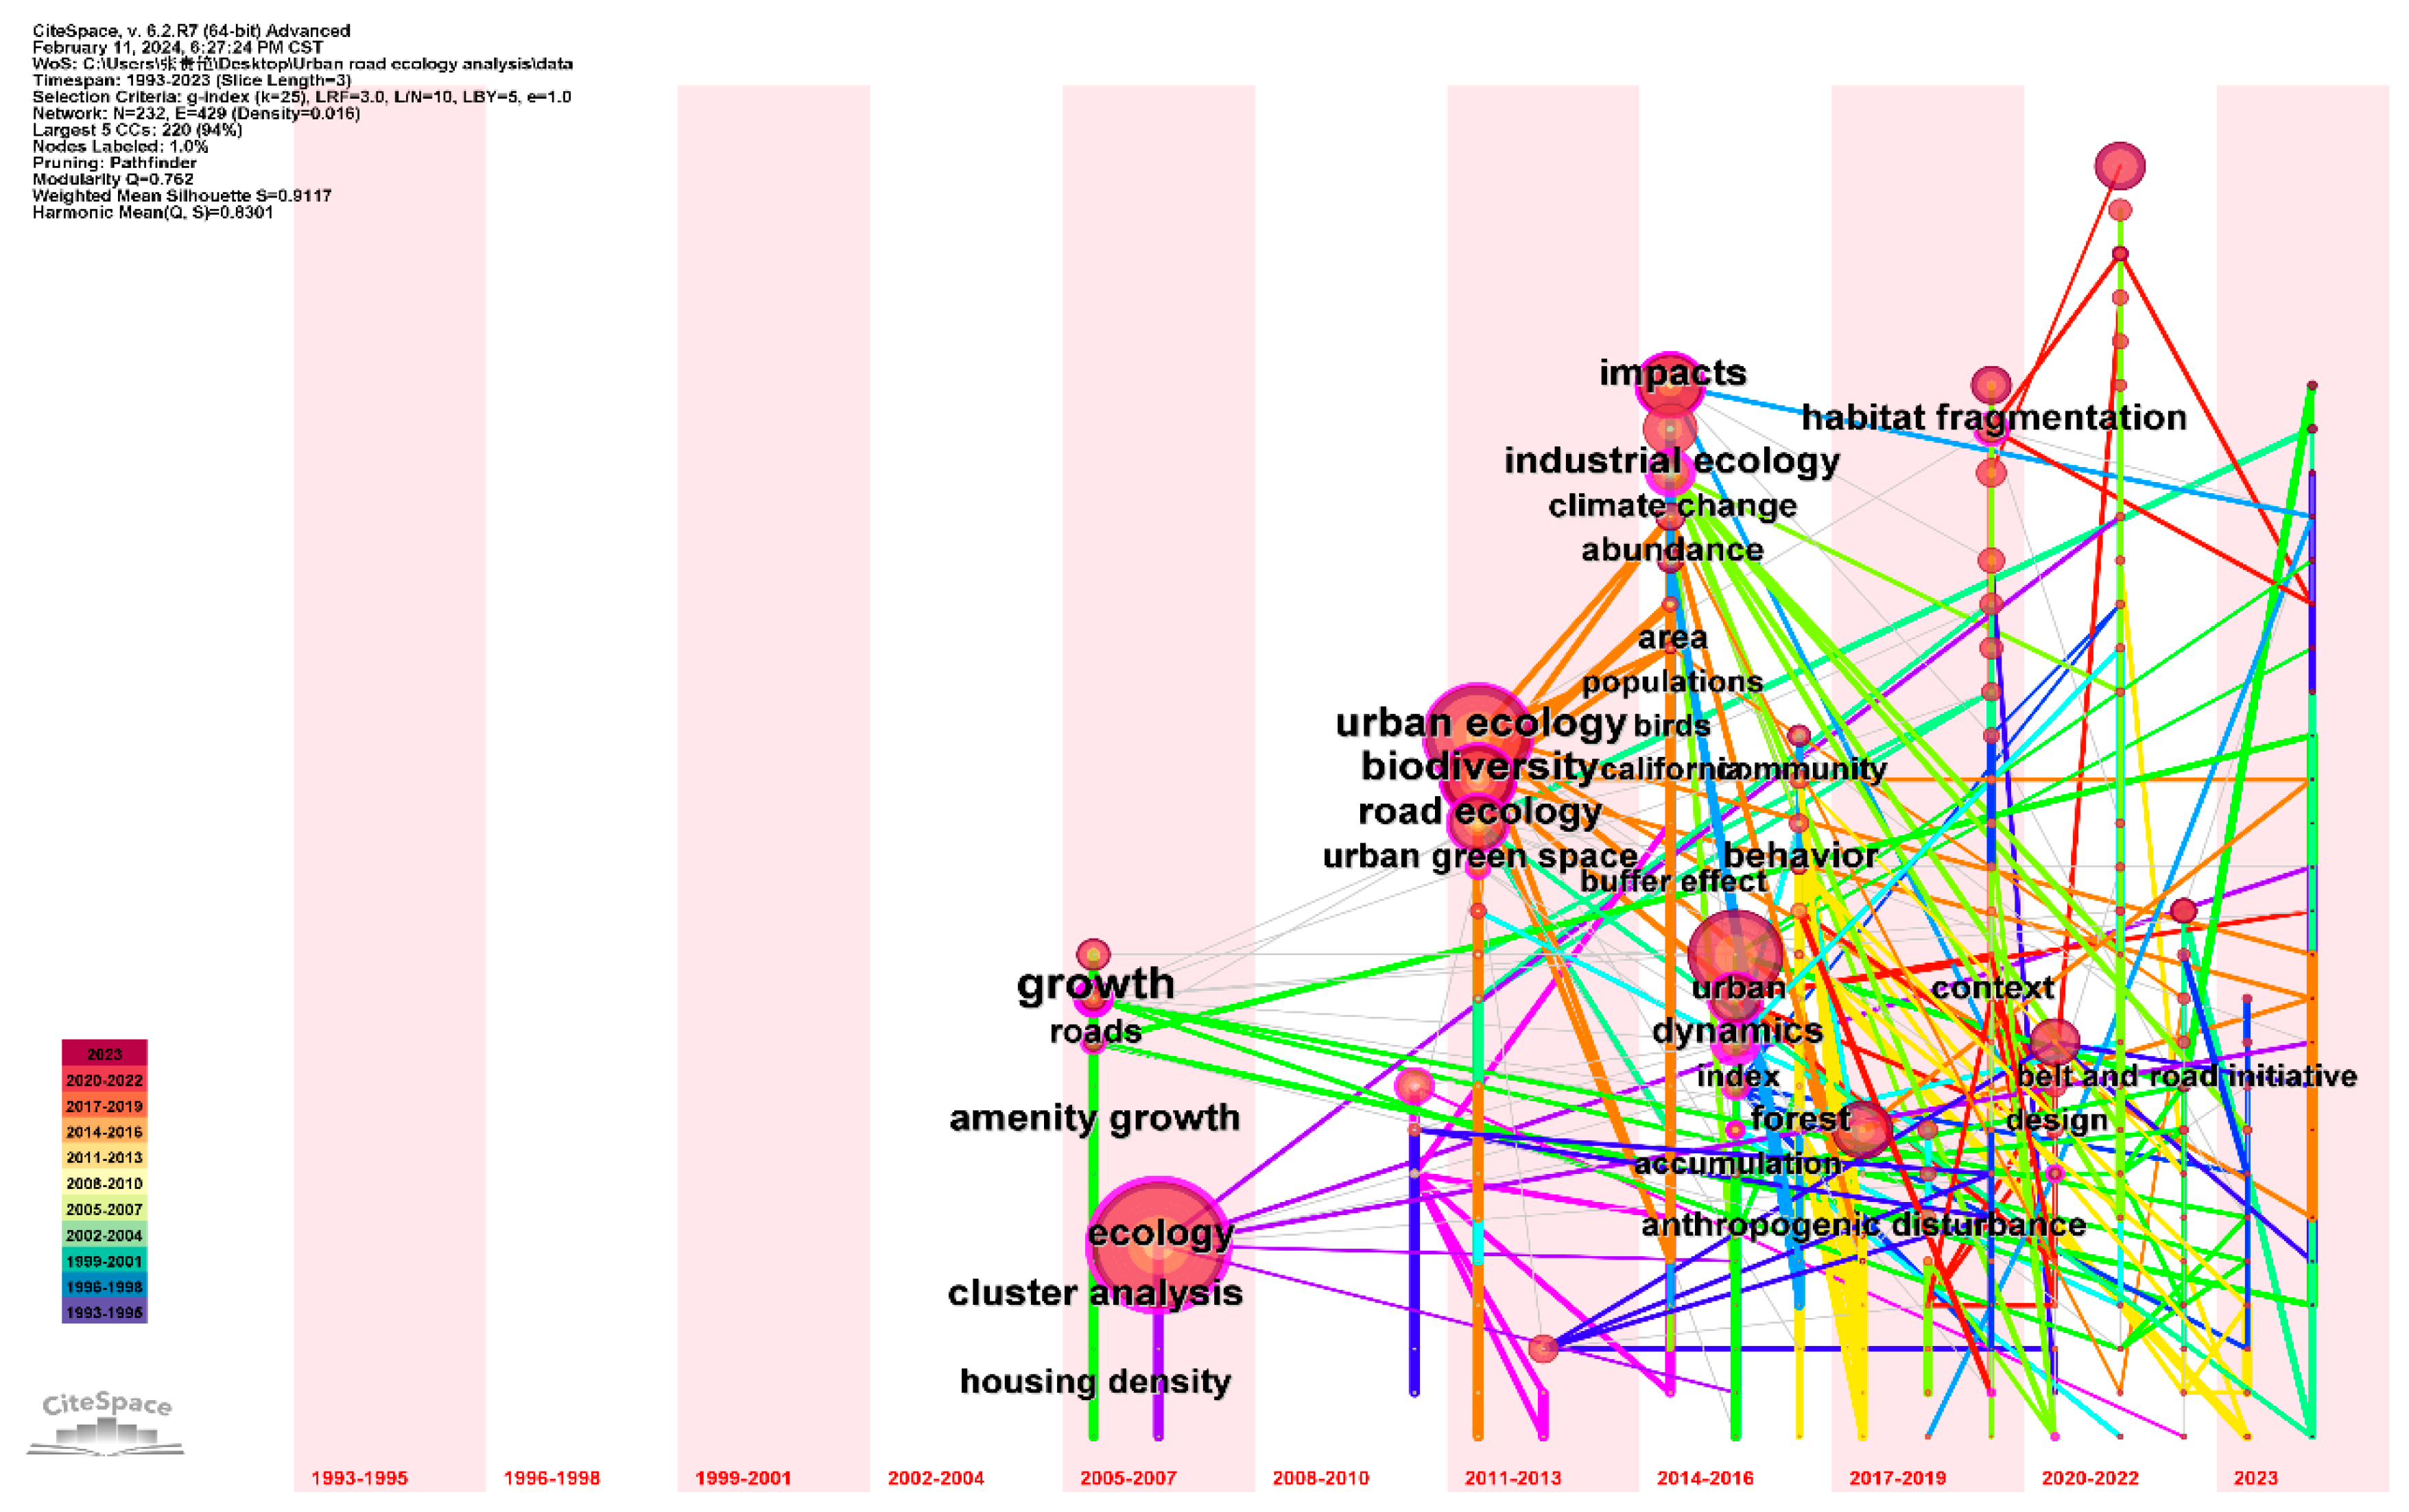
3.3.4. Keyword Time Zone Map

As can be seen from Figure 12, almost no literature was published between 1993 and 2001. Owing to the publication of the book Road Ecology in 2003, the research of road ecology came into maturity after 2011. More and more scholars are paying attention to this field, which has led to the explosive emergence of keywords in this field.
It can be seen that the earliest studies centered around keywords such as “growth”, “roads”, and “housing density”. After 2000, with the rapid development of construction, a large number of studies attempted to provide some methods and recommendations for the planning of urban buildings and roads. For example, Hammer et al. employed cluster analysis and introduced the time density model to identify patterns of urban development based on changes in housing density over recent decades, with the aim of providing a foundation for evidence-based policy-making in urban development [45]. Afterward, more research was conducted on the relationship between urban planning, road construction, and ecological environment, thereby augmenting the knowledge base in this domain. Initially, considerable attention was devoted to the segmentation effect of road traffic on the areas it passes through, especially focusing on highly flexible expressways that exhibit a more pronounced segmentation effect. Some changes in roadside plants can also affect the survival and habitat of some local animals. Subsequently, more specific and in-depth analysis of the impacts of road traffic, such as sound (e.g., the road noise classification study conducted by Brown et al. [40]), lighting, economy (e.g., Grossegger’s study on urban asphalt depots [44]), materials (e.g., Du and Murray’s study on the impact of road deicing salts on mosquitoes [49]), and other impacts on ecosystems, received more attention. Some ecological research methods and mathematical models have also been used to evaluate road ecology, such as the SPROADI model based on some ecological indices introduced by Freudenberger et al. [39].

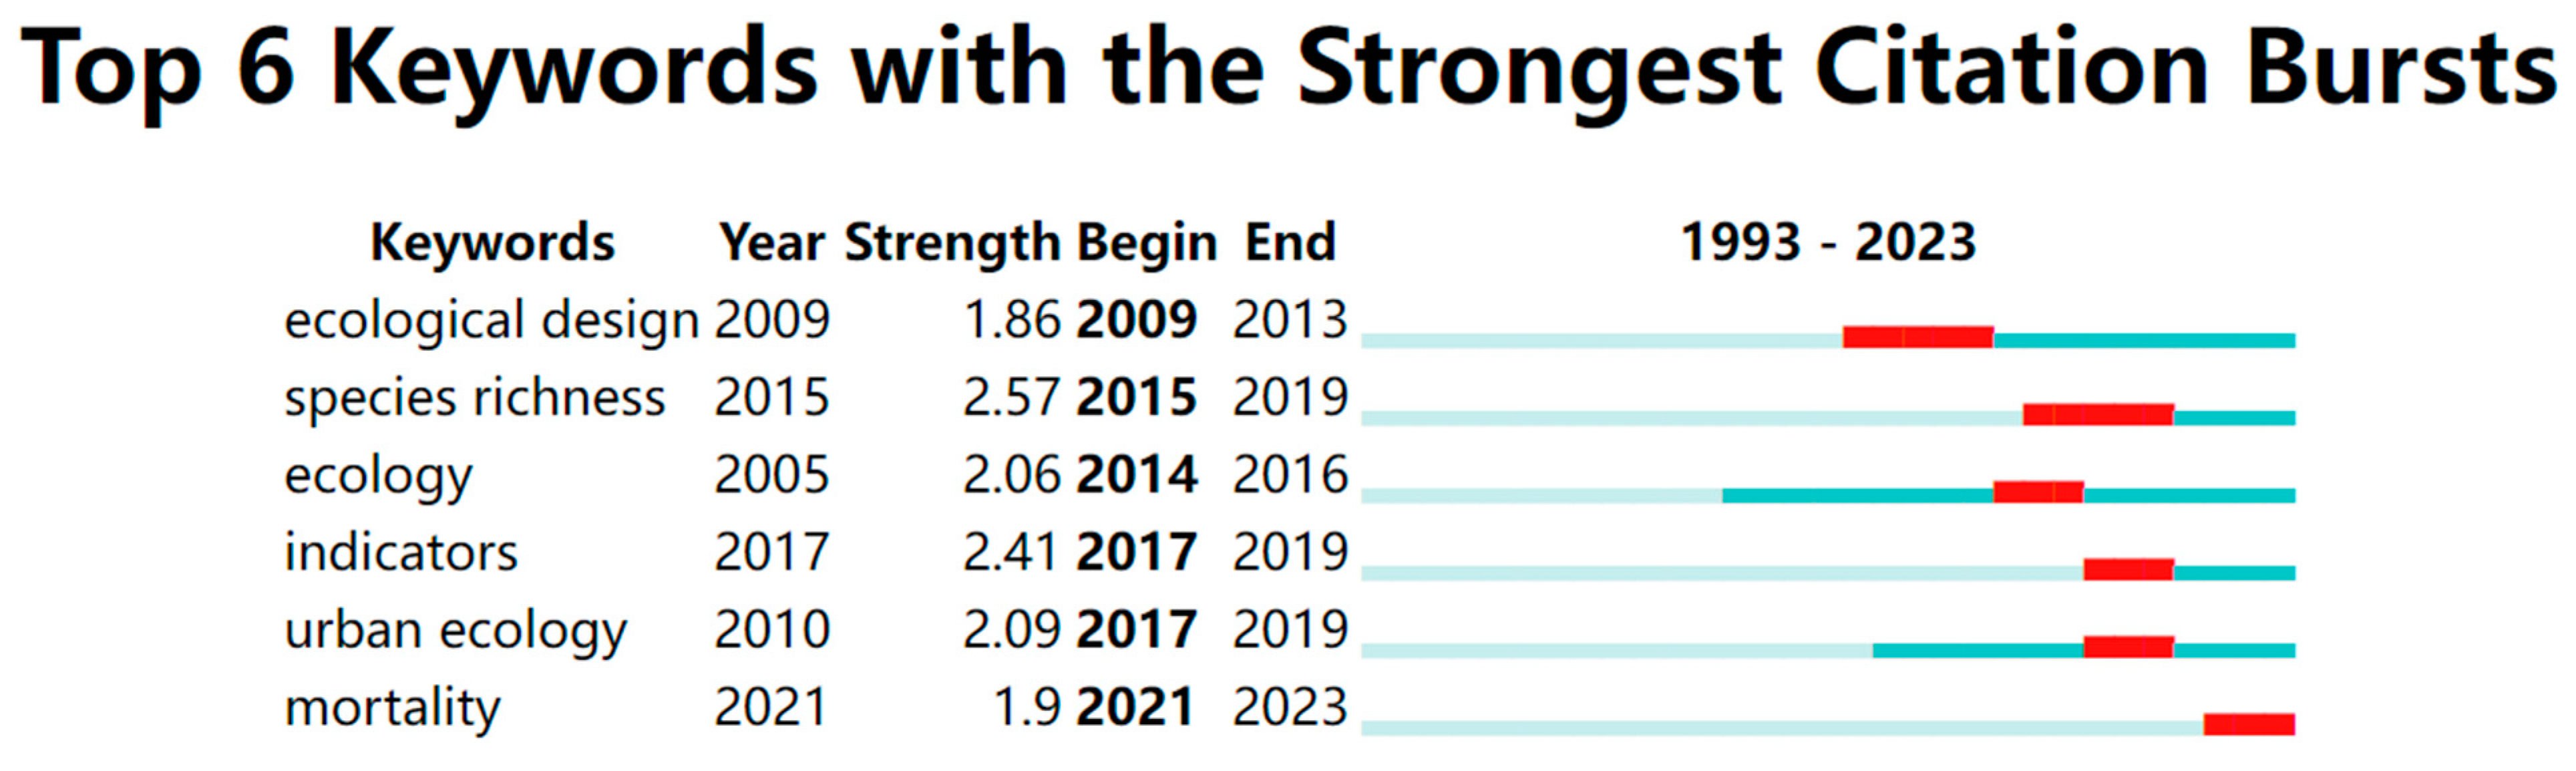
3.3.5. Analysis of Citation Bursts

Citation burst analysis refers to the publication of articles related to specific high-frequency keywords over a certain period. In this study, six keywords were obtained by setting γ = 0.5 , as shown in Figure 13. Specifically, the length of the red bar in the figure represents the duration of the keyword, while the intensity values reflect the frequency of the keyword during this period. These keywords were sorted in chronological order: ecological design (2009~2013), ecology (years 2014~2016), species richness (years 2015~2019), indicator (years 2017~2019), urban ecology (years 2017~2019), and mortality (years 2021~2023). Notably, most of these words appeared after 2010, indicating that research in this field is now being increasingly emphasized by researchers (Figure 13).

4. Conclusions and Future Expectancy

Urban road ecology has received increasing attention from scholars around the world. Since the research of urban road ecology involves multiple disciplines and a wide range of research topics, this article includes the core literature in the WOS database as the data source and analyzes the research field according to the principle of bibliometrics. It can be seen that there was a spurt in research on urban road ecology around 2010. Specifically, the number of relevant keywords and the intellectual foundation involved in the research topic expanded rapidly after 2010. However, most authors have only one or two articles published in core journals. A large proportion of these authors are Chinese researchers and American researchers, while only a few authors in other countries have discussed urban road ecology. Furthermore, Landscape and Urban Planning has a considerable influence in this field, but many journals related to urban ecological environment, urban landscape research, and road transportation have only published a limited amount of relevant literature. Based on these results, it can be concluded that urban road ecology is currently in a stage of rapid development, but there is still a lack of scholars conducting long-term and in-depth research on this subject. Based on the analysis of collaboration, co-citation analysis, and keyword analysis, the overall research centrality is at a relatively low level. Therefore, a well-integrated research framework has yet to be established in this domain, suggesting much room for further exploration in interdisciplinary collaborative research.
Based on the above findings, this article proposes some expectations for future research:
(1)
In terms of research methodology, it is necessary to break down professional barriers between the disciplines of road engineering, transportation, ecology, and urban landscape. For example, in question E of the 2024 American College Student Mathematical Modeling Competition, the stem of problems and context of research indicated an expectation for the development of comprehensive models related to engineering, finance, and ecology. In contrast, most of the literature in this study analyzes road ecosystems by employing an approach from a single subject area. It is also an important reason for the overall low relevance of the retrieved literature. Hence, this article argues that an interdisciplinary approach is significant for research in the field of urban road ecology.
(2)
From the perspective of theoretical concepts, a more targeted conceptual system is needed in the field of urban road ecology. The existing research phase in the field of road ecology has been defined as in a mature phase, in which specialized works have begun to establish a conceptual system for the discipline. However, this article argues that there are significant differences between urban road ecological research and the existing road ecological research, which can be manifested in the following three aspects. Firstly, disciplines such as urban landscape science, which studies urban planning and construction, are more relevant in the field of urban road ecology than the broader concept of road ecology. Secondly, the study of roads includes the study of urban roads and the study of highways, exhibiting significant differences in terms of function and structure, as evidenced by their distinct design specifications. Meanwhile, two different types of roads have different effects on the division of urban areas. Therefore, distinguishing between the concepts of urban road ecology and road ecology is necessary. Third, from an ecological perspective, urban ecosystems are significantly different from other ecosystems. Because urban ecosystems are characterized by a large number of industrial enterprises, higher population density, many sources of pollution, and severe traffic pollution, the analysis of urban ecosystems should be distinguished from the analysis of other ecosystems. Based on the above viewpoint, it is recommended to establish a conceptual system for urban ecosystems that is distinct from built concepts of road ecology.
(3)
In terms of practical applications, an important way to translate research results in urban road ecology is to provide a basis for the sustainable design and construction of urban roads. There are many directions for further research on the correlation between ecological evaluation and engineering practice in bibliometric research. For example, the segmentation effect in cities due to urban expressways may lead to ecological and environmental impacts such as a reduction in species diversity, destruction of biological habitats, and sound and light pollution in the surrounding environment. Moreover, these expressways may also have conflicting impacts on urban green space planning, road red lines, and urban architectural layout. Based on these interactions, this article argues that the research on how to plan urban roads to facilitate the coordinated development of ecological capacity, transportation volume, and urban land use planning can provide insights for optimizing road design specifications.
This study also has certain limitations. Many other databases are not as internationally representative as the WOS database. For example, most of the literature in the CNKI database focuses on roads and ecological sustainability in China, while many institutional databases focus more on the research issues and current research status of their respective regions or countries. Since the purpose of this paper is to analyze the distribution of research and frontier trends in this discipline at the international level, the original data are from the core literature of the WOS database. Consequently, many other journal papers, conference papers, and graduate dissertations on urban road ecology in the CNKI database with significant research value were not included in this paper.

Funding

This research was funded by Guizhou Provincial Science and Technology Projects (ZK[2022] General 079).

Conflicts of Interest

The authors declare no conflict of interest.

References

  1. Leonard, R.J.; Hochuli, D.F. Exhausting all avenues: Why impacts of air pollution should be part of road ecology. Front. Ecol. Environ. 2017, 15, 443–449. [Google Scholar] [CrossRef]
  2. Wang, B.; Yang, X.S.; Li, Z.C.; Geri, L. Discussion on road ecology research progress and development planning in China. In Proceedings of the 1st International Conference on Energy and Environmental Protection (ICEEP 2012), Hohhot, China, 23–24 June 2012; pp. 2770–2776. [Google Scholar]
  3. Chen, C.M. Visualizing and Exploring Scientific Literature with CiteSpace. In Proceedings of the 3rd ACM SIGIR Conference on Human Information Interaction and Retrieval (CHIIR), New Brunswick, NJ, USA, 11–15 March 2018; pp. 369–370. [Google Scholar]
  4. Yin, L.-H.; Wan, M.; Yao, Z.-Y. Research on Road Ecology and Consideration of Road Ecological Landscape Construction in China. Chin. Landsc. Archit. 2011, 27, 56–59. [Google Scholar]
  5. Forman, R.T.T.; Alexander, L.E. Roads and Their Major Ecological Effects. Annu. Rev. Ecol. Syst. 1998, 29, 207–231. [Google Scholar] [CrossRef]
  6. Jaarsma, C.F. Approaches for the planning of rural road networks according to sustainable land use planning. Landsc. Urban Plan. 1997, 39, 47–54. [Google Scholar] [CrossRef]
  7. Forman, R.T.T. Road Ecology: Science and Solutions; Island Press: Washington, DC, USA, 2003. [Google Scholar]
  8. D’Amico, M.; Ascenso, F.; Fabrizio, M.; Barrientos, R.; Gortazar, C. Twenty years of Road Ecology: A Topical Collection looking forward for new perspectives. Eur. J. Wildl. Res. 2018, 64, 2. [Google Scholar] [CrossRef]
  9. Yang, Z.C.; Zhao, W.T.; Liu, Y.; Chen, Y.Y. Using Genetic Optimization Algorithm to Intelligent System for Ecological Road Network Layout in Land Reclamation Area. Sens. Lett. 2013, 11, 1274–1281. [Google Scholar] [CrossRef]
  10. Fu, W.; Liu, S.L.; Dong, S.K. Landscape pattern changes under the disturbance of road networks. In Proceedings of the Biennial International Conference on Ecological Informatics and Ecosystem Conservation (ISEIS), Beijing, China, 27–29 August 2010; pp. 859–867. [Google Scholar]
  11. Yazici, M.A.; Kamga, C.; Ozbay, K. Highway Versus Urban Roads Analysis of Travel Time and Variability Patterns Based on Facility Type. Transp. Res. Rec. 2014, 2442, 53–61. [Google Scholar] [CrossRef]
  12. Zhang, Y.Z.; Hu, Y.F.; Zhuang, D.F. A highly integrated, expansible, and comprehensive analytical framework for urban ecological land: A case study in Guangzhou, China. J. Clean. Prod. 2020, 268, 12. [Google Scholar] [CrossRef]
  13. Zhang, M.; Du, H.Q.; Zhou, G.M.; Mao, F.J.; Li, X.J.; Zhou, L.; Zhu, D.E.; Xu, Y.X.; Huang, Z.H. Spatiotemporal Patterns and Driving Force of Urbanization and Its Impact on Urban Ecology. Remote Sens. 2022, 14, 1160. [Google Scholar] [CrossRef]
  14. Chaomei, C. CiteSpace II: Detecting and visualizing emerging trends and transient patterns in scientific literature. J. Am. Soc. Inf. Sci. Technol. 2006, 57, 359–377. [Google Scholar] [CrossRef]
  15. Xie, J.; Zhang, G.; Li, Y.; Yan, X.; Zang, L.; Liu, Q.; Chen, D.; Sui, M.; He, Y. A Bibliometric Analysis of Forest Gap Research during 1980–2021. Sustainability 2023, 15, 1994. [Google Scholar] [CrossRef]
  16. Estoque, R.C.; Murayama, Y.; Myint, S.W. Effects of landscape composition and pattern on land surface temperature: An urban heat island study in the megacities of Southeast Asia. Sci. Total Environ. 2017, 577, 349–359. [Google Scholar] [CrossRef] [PubMed]
  17. Krausmann, F.; Wiedenhofer, D.; Lauk, C.; Haas, W.; Tanikawa, H.; Fishman, T.; Miatto, A.; Schandl, H.; Haberl, H. Global socioeconomic material stocks rise 23-fold over the 20th century and require half of annual resource use. Proc. Natl. Acad. Sci. USA 2017, 114, 1880–1885. [Google Scholar] [CrossRef] [PubMed]
  18. Bradfer-Lawrence, T.; Gardner, N.; Bunnefeld, L.; Bunnefeld, N.; Willis, S.G.; Dent, D.H. Guidelines for the use of acoustic indices in environmental research. Methods Ecol. Evol. 2019, 10, 1796–1807. [Google Scholar] [CrossRef]
  19. Barber, J.R.; Burdett, C.L.; Reed, S.E.; Warner, K.A.; Formichella, C.; Crooks, K.R.; Theobald, D.M.; Fristrup, K.M. Anthropogenic noise exposure in protected natural areas: Estimating the scale of ecological consequences. Landsc. Ecol. 2011, 26, 1281–1295. [Google Scholar] [CrossRef]
  20. Kleemann, F.; Lederer, J.; Rechberger, H.; Fellner, J. GIS-based Analysis of Vienna’s Material Stock in Buildings. J. Ind. Ecol. 2017, 21, 368–380. [Google Scholar] [CrossRef]
  21. Liu, S.L.; Cui, B.S.; Dong, S.K.; Yang, Z.F.; Yang, M.; Holt, K. Evaluating the influence of road networks on landscape and regional ecological risk—A case study in Lancang River Valley of Southwest China. Ecol. Eng. 2008, 34, 91–99. [Google Scholar] [CrossRef]
  22. Lanau, M.; Liu, G.; Kral, U.; Wiedenhofer, D.; Keijzer, E.; Yu, C.; Ehlert, C. Taking Stock of Built Environment Stock Studies: Progress and Prospects. Environ. Sci. Technol. 2019, 53, 8499–8515. [Google Scholar] [CrossRef] [PubMed]
  23. Laurance, W.F.; Clements, G.R.; Sloan, S.; O’Connell, C.S.; Mueller, N.D.; Goosem, M.; Venter, O.; Edwards, D.P.; Phalan, B.; Balmford, A.; et al. A global strategy for road building. Nature 2014, 513, 229–232. [Google Scholar] [CrossRef]
  24. Chen, C.M.; Song, M. Visualizing a field of research: A methodology of systematic scientometric reviews. PLoS ONE 2019, 14, 25. [Google Scholar] [CrossRef]
  25. Bruce, M.J.; Bryant, D.B.; Kohout, M.; Macak, P.V.; Batpurev, K.; Sinclair, S.J. Southern brown bandicoots, Isoodon obesulus obesulus, occupy the margins of artificial waterways, in preference to bushland remnants or roadside vegetation. Wildl. Res. 2023, 50, 68–75. [Google Scholar] [CrossRef]
  26. Dall’Ara, E.; Maino, E.; Gatta, G.; Torreggiani, D.; Tassinari, P. Green Mobility Infrastructures. A landscape approach for roundabouts’ gardens applied to an Italian case study. Urban For. Urban Green. 2019, 37, 109–125. [Google Scholar] [CrossRef]
  27. Fröhlich, A.; Ciach, M. Noise shapes the distribution pattern of an acoustic predator. Curr. Zool. 2018, 64, 575–583. [Google Scholar] [CrossRef] [PubMed]
  28. Johansson, V.; Koffman, A.; Hedblom, M.; Deboni, G.; Andersson, P. Estimates of accessible food resources for pollinators in urban landscapes should take landscape friction into account. Ecosphere 2018, 9, 11. [Google Scholar] [CrossRef]
  29. Jarasuniene, A.; Bazaras, D. The implementation of green logistics in road transportation. Balt. J. Road Bridge Eng. 2023, 18, 185–207. [Google Scholar] [CrossRef]
  30. Ballantyne, M.; Pickering, C.M. The impacts of trail infrastructure on vegetation and soils: Current literature and future directions. J. Environ. Manag. 2015, 164, 53–64. [Google Scholar] [CrossRef] [PubMed]
  31. Li, Z.Y.; Liang, Y.M.; Zhou, J.H.; Sun, X. Impacts of de-icing salt pollution on urban road greenspace: A case study of Beijing. Front. Environ. Sci. Eng. 2014, 8, 747–756. [Google Scholar] [CrossRef]
  32. Lin, Y.Y.; Hu, X.S.; Zheng, X.X.; Hou, X.Y.; Zhang, Z.X.; Zhou, X.N.; Qiu, R.Z.; Lin, J.G. Spatial variations in the relationships between road network and landscape ecological risks in the highest forest coverage region of China. Ecol. Indic. 2019, 96, 392–403. [Google Scholar] [CrossRef]
  33. Kattel, G.R.; Elkadi, H.; Meikle, H. Developing a complementary framework for urban ecology. Urban For. Urban Green. 2013, 12, 498–508. [Google Scholar] [CrossRef]
  34. He, J.H.; Hao, Z.Z.; Li, L.; Ye, T.Y.; Sun, B.; Wu, R.C.; Pei, N.C. Sniff the urban park: Unveiling odor features and landscape effect on smellscape in Guangzhou, China. Urban For. Urban Green. 2022, 78, 10. [Google Scholar] [CrossRef]
  35. Izuddin, M.; Webb, E.L. The influence of tree architecture, forest remnants, and dispersal syndrome on roadside epiphyte diversity in a highly urbanized tropical environment. Biodivers. Conserv. 2015, 24, 2063–2077. [Google Scholar] [CrossRef]
  36. Wemple, B.C.; Browning, T.; Ziegler, A.D.; Celi, J.; Chun, K.P.; Jaramillo, F.; Leite, N.K.; Ramchunder, S.J.; Negishi, J.N.; Palomeque, X.; et al. Ecohydrological disturbances associated with roads: Current knowledge, research needs, and management concerns with reference to the tropics. Ecohydrology 2018, 11, 23. [Google Scholar] [CrossRef]
  37. Xu, Z.; Zhang, J.J.; Li, C.; Li, Z.Y.; Rao, Y.H.; Lu, T.Y. A Road to Sustainable Development of Chinese Cities: A Perception of Improving Urban Management Efficiency Based on Two-Level Production Factors. Sustainability 2017, 9, 2212. [Google Scholar] [CrossRef]
  38. Cordero, R.L.; Torchelsen, F.P.; Overbeck, G.E.; Anand, M. Analyzing the landscape characteristics promoting the establishment and spread of gorse (Ulex europaeus) along roadsides. Ecosphere 2016, 7, 14. [Google Scholar] [CrossRef]
  39. Freudenberger, L.; Hobson, P.R.; Rupic, S.; Pe’er, G.; Schluck, M.; Sauermann, J.; Kreft, S.; Selva, N.; Ibisch, P.L. Spatial road disturbance index (SPROADI) for conservation planning: A novel landscape index, demonstrated for the State of Brandenburg, Germany. Landsc. Ecol. 2013, 28, 1353–1369. [Google Scholar] [CrossRef]
  40. Brown, C.L.; Reed, S.E.; Dietz, M.S.; Fristrup, K.M. Detection and Classification of Motor Vehicle Noise in a Forested Landscape. Environ. Manag. 2013, 52, 1262–1270. [Google Scholar] [CrossRef] [PubMed]
  41. Quinn, J.E.; Schindler, A.R.; Blake, L.; Schaffer, S.K.; Hyland, E. Loss of winter wonderland: Proximity to different road types has variable effects on winter soundscapes. Landsc. Ecol. 2022, 37, 381–391. [Google Scholar] [CrossRef]
  42. André, M.; Garrot, B.; Roynard, Y.; Vidon, R.; Tassel, P.; Perret, P. Operating conditions of buses in use in the Ile-de-France region of France for the evaluation of pollutant emissions. Atmos. Environ. 2005, 39, 2411–2420. [Google Scholar] [CrossRef]
  43. Cui, J.; Jiang, C.L. Building highway landscapes: Innovative directions for urban wastewater treatment in the face of new challenges in China. In Proceedings of the International Conference on Green Buildings and Sustainable Cities (GBSC), Bologna, Italy, 15–16 September 2011; pp. 617–624. [Google Scholar]
  44. Grossegger, D. Material flow analysis study of asphalt in an Austrian municipality. J. Ind. Ecol. 2022, 26, 996–1009. [Google Scholar] [CrossRef]
  45. Hammer, R.B.; Stewart, S.I.; Winkler, R.L.; Radeloff, V.C.; Voss, P.R. Characterizing dynamic spatial and temporal residential density patterns from 1940-1990 across the North Central United States. Landsc. Urban Plan. 2004, 69, 183–199. [Google Scholar] [CrossRef]
  46. Akmal, F.; Khan, S.U.; Luqman, M.; Ahmad, S.R. Urban Sprawl Susceptibility Analysis of Sialkot City by Using Multicriteria Evaluation and Analytical Hierarchy Process. J. Urban Plan. Dev. 2022, 148, 11. [Google Scholar] [CrossRef]
  47. Wang, P.C.; Tang, Y.; Liao, Z.F.; Yan, Y.; Dai, L.; Liu, S.; Jiang, T.P. Road-Side Individual Tree Segmentation from Urban MLS Point Clouds Using Metric Learning. Remote Sens. 2023, 15, 1992. [Google Scholar] [CrossRef]
  48. Liu, X.L.; Wang, Y.; Li, Y.; Wu, J.S. Quantifying the Spatio-Temporal Process of Township Urbanization: A Large-Scale Data-Driven Approach. ISPRS Int. J. Geo-Inf. 2019, 8, 389. [Google Scholar] [CrossRef]
  49. Du, S.; Murray, R.L. Road salt pollution alters sex ratios in emerging mosquito populations. Environ. Pollut. 2023, 334, 9. [Google Scholar] [CrossRef]
Figure 1. The logical framework diagram of the methodology.
Sustainability 16 05135 g001
Figure 2. Author collaboration analysis map. The size of node circles and font size directly reflect the number of articles published by the author in the core journal, and the sparseness of the connecting lines between the nodes reflects the cooperation between them. The color of the lines corresponds to the time division table in the bottom left corner of the figure to reflect the years of collaboration between authors.
Sustainability 16 05135 g002
Figure 3. Institutional collaboration analysis map. It presents the collaboration between institutions and the timing through connecting lines of different colors and shows the volume of publications through font size. The larger the node size and font size, the greater the number of documents issued by the representative organization, while the connection is the key to cooperation between organizations. It is worth mentioning the meaning of institutional cooperation, which refers to the collaboration of authors from different institutions in completing an article. The color of the connecting line reflects the time period of cooperation.
Sustainability 16 05135 g003
Figure 4. National collaboration analysis map. It presents the cooperation and scheduling between countries through different colored connecting lines and shows the number of publications through font size. A larger radius of the node circle indicates that more authors from this country have published in core journals, and a higher density of the connecting lines between the nodes indicates more collaboration between them. The specific meaning of national cooperation refers to the joint completion of an article by authors from different countries.
Sustainability 16 05135 g004
Figure 5. Centrality bar chart in national cooperation analysis.
Sustainability 16 05135 g005
Figure 6. Count bar chart in national cooperation analysis.
Sustainability 16 05135 g006
Figure 7. Reference co-citation analysis map. It mainly presents the authors and publication years of the cited references, as well as the collaborative relationships between the authors of these references. Some journals emphasize the corresponding author with an “*” in the information data of the article.
Sustainability 16 05135 g007
Figure 8. Citation analysis of journals map. The co-occurrence frequency and correlation of journals are mainly presented through the size of nodes and font sizes. The size of nodes and font size reflect the number of citations in a journal. The color change of each node shows the earliest and most recently cited times of the journal. The line reflects the co-citation relationship, and the line color shows the co-citation time. It is worth mentioning that journal co-citation refers to articles from the same journal that are simultaneously cited by the same article.
Sustainability 16 05135 g008
Figure 9. Keyword co-occurrence analysis map. The co-occurrence frequency and correlation of keywords are mainly presented through the size of nodes and font sizes. Specifically, the size of nodes and font size reflect the number of times keywords appear. The color change of each node displays the earliest and most recent appearance time of the keyword. Lines reflect the co-occurrence relationship between keywords, and line colors display the time of keyword co-occurrence. It is worth mentioning that keyword co-occurrence refers to presenting different keywords in the same article.
Sustainability 16 05135 g009
Figure 10. Keyword clustering analysis map. A total of 13 clusters were obtained, with different colors to distinguish different categories. Each dot represents a common keyword, and the size and number of dots reflect the scale and importance of this category.
Sustainability 16 05135 g010
Figure 11. Keyword timeline analysis map. In Figure 11, the solid line segment indicates the period during which articles with the keyword were retrieved. The specific division is based on the period from 1993 to 2013, when the first retrieval of literature related to the topic was made. The dashed line represents the complementary interval of the solid line. The curve is designed to present the connections between keywords. If the keywords are connected by a curve, it indicates a relationship between them, and the size of the node reflects the frequency of the keywords at that location. The color is the distinguishing factor among the keywords.
Sustainability 16 05135 g011
Figure 12. Time zone map. The solid lines represent the connections between keywords. The pink and white stripes are used to distinguish the timeline position of the earliest appearance of keywords, similar to coordinate axis bands. The size of a node reflects the frequency of keywords at that location. The color can be used to determine the period of keyword association based on the time slice legend in the bottom left corner. The closer it is to red, the more recently the piece of literature related to the keywords has appeared, and vice versa.
Sustainability 16 05135 g012
Figure 13. Timeline map. The map shows the start and end times and intensity of the burst of the keywords.
Sustainability 16 05135 g013
Table 1. Institutional cooperation analysis information. The main presentation is the number of publications, which serves as an indicator of the contribution level of the organization, its centrality in influencing other factors, and the earliest publication period. The count in the table refers to the number of articles published by authors from the organization. The year in the table refers to the year in which the author from the institution successfully published the earliest article.
CountCentralityYearInstitution
150.022009Chinese Academy of Sciences
602017University of Chinese Academy of Sciences
502019Institute of Geographic Sciences and Natural Resources Research
402014Arizona State University-Tempe
402015California State University System
402014Beijing Forestry University
402020University of California System
402014Arizona State University
302016Centre National de la Recherche Scientifique (CNRS)
302021University of Toronto
30.012007China University of Mining and Technology
302021Yale University
302013Colorado State University
Table 2. Citation analysis of references information table. It mainly presents the citation frequency, centrality, and earliest citation age of highly cited articles.
Cited CountCentralityYearTitle
402017Effects of landscape composition and pattern on land surface temperature: An urban heat island study in the megacities of Southeast Asia (DOI: 10.1016/j.scitotenv.2016.10.195 [16])
302017Global socioeconomic material stocks rise 23-fold over the 20th century and require half of annual resource use (DOI: 10.1073/pnas.1613773114 [17])
302019Guidelines for the use of acoustic indices in environmental research (DOI: 10.1111/2041-210X.13254 [18])
30.022011Anthropogenic noise exposure in protected natural areas: estimating the scale of ecological consequences (DOI: 10.1007/s10980-011-9646-7 [19])
302017GIS-based Analysis of Vienna’s Material Stock in Buildings (DOI: 10.1111/jiec.12446 [20])
30.012008Evaluating the influence of road networks on landscape and regional ecological risk—A case study in Lancang River Valley of Southwest China (DOI: 10.1016/j.ecoleng.2008.07.006 [21])
302019Taking Stock of Built Environment Stock Studies: Progress and Prospects (DOI: 10.1021/acs.est.8b06652 [22])
302014A global strategy for road building (DOI: 10.1038/nature13717 [23])
Table 3. Citation analysis of journals information table. Time cited refers to the cumulative number of citations for articles published in this field of the journal. It also presents information on centrality and the year when the earliest piece of literature was cited.
Time CitedCentralityYearJournal Name
940.352006LANDSCAPE AND URBAN PLANNING
860.12010BIOLOGICAL CONSERVATION
740.072005SCIENCE OF TOTAL ENVIRONMENT
720.062010CONSERVATION BIOLOGY
700.252006SCIENCE
630.012013LANDSCAPE ECOLOGY
620.012013PLOS ONE
620.172013JOURNAL of ENVIRONMENTAL MANAGEMENT
590.192006PROCEEDINGS OF THE NATIONAL ACADEMY OF SCIENCES OF THE UNITED STATES OF AMERICA
560.052013JOURNAL OF APPLIED ECOLOGY
4602006NATURE
440.022010BIODIVERS AND CONSERVATION
430.042009ECOLOGICAL APPLICATION
410.012013ANNUAL REVIEW OF ECOLOGY EVOLUTION AND SYSTEMATICS
4102018SUSTAINABILITY-BASEL
4002013TRENDS IN ECOLOGY AND EVOLUTION
390.042013ECOLOGY
390.032014ECOLOGICAL INDICATORS
390.372010BIOSCIENCE
3902017ENVIRONMENTAL POLLUTION
Table 4. Keyword information table. It presents the frequency and the centrality of the keyword.
CountCentralityKeyword
390.24ecology
310.18urban ecology
280.1city
210.14biodiversity
190.13impacts
180.01urbanization
170.19road ecology
160.02land use
150.03model
150ecosystem services
Table 5. Keyword clustering analysis information table. The contour score of the network measures the average homogeneity of derived clusters. A higher average contour score indicates a more meaningful cluster [24]. Silhouette, also known as the s value mentioned in Section 3.3.2, can reflect the credibility of clustering results.
ClusterSizeSilhouetteYearLabel (LLR)
0230.8332018urban landscape; ecosystem service; landscape friction; accessible food resource; reported life satisfaction
1220.9192015complementary framework; street tree; density diversity composition; potential case; urban parrot
2210.8972018landscape characteristics; noise pollution; road density light; squirrel glider; urban encroachment
3190.9822017Austrian municipality; material flow analysis study; transport sector; material stock development; noise footprint
4170.9392009temporal residential density pattern; north central; analytical hierarchy process; urban sprawl susceptibility analysis; Sialkot city
5160.9292018green development; green belt and road; political ecology perspective; extended infrastructure landscape; gateway project
6150.9432017cats car; endangered felid; road network; urban landscape pattern; road centrality
7140.9112015ecological restoration; urban green area; north-western Italy; integrated expansible; comprehensive analytical framework
8140.922014motor vehicle noise; novel landscape index; spatial road disturbance index; Brandenburg, Germany; conservation planning
9130.8082019winter soundscape; different road type; variable effect; study design rationale; acoustic quality
10130.8972016roadside individual tree segmentation; using metric learning; urban MLS point cloud; city-level comparison; global belt
11120.8582014pollutant emission; de-France region; operating condition; use pressure; urban common
1280.9552012urban ecology researcher; design process; urban wastewater treatment; innovative direction; new challenge
Disclaimer/Publisher’s Note: The statements, opinions and data contained in all publications are solely those of the individual author(s) and contributor(s) and not of MDPI and/or the editor(s). MDPI and/or the editor(s) disclaim responsibility for any injury to people or property resulting from any ideas, methods, instructions or products referred to in the content.

