Abstract
Coal gangue, as a subgrade filler, is of great significance for the sustainable development of the economy, society, and environment. Particle crushing tests were conducted on coal gangue coarse-grained subgrade filler (CGSF) under uniaxial compression conditions, and the relationships between load and displacement, crushing strength, failure pattern, and gradation after crushing were analyzed. A new visual analysis method for the crushing patterns of particles was provided through image analysis, and a new gradation equation based on the traditional fractal model was proposed to describe the crushed particles. The results indicate that as the particles are gradually compressed the sharp corners of particles are gradually crushed and fall off, causing the relationship curve between load and displacement to fluctuate and grow, and particle splitting failure leads to the approximately linear growth curve. Moreover, the distribution of particle crushing strength for coal gangue is between 3.02 and 11.11 MPa, and the crushing probability and the applied load well satisfy the Weibull distribution function. Furthermore, as the particle size decreases, the shapes of crushed coal gangue particles are block, flaky, acicular, and powder, and the particles with a size greater than 5 mm are mainly flaky. In addition, comparative analysis shows that the new gradation equation can better describe the gradation of coal gangue fragments after crushing.
1. Introduction
Coal gangue, which is considered as waste, is separated during the mining and washing processes. The discharge of coal gangue accounts for 15–20% of coal output. At present, the coal gangue accumulated on the ground of mining areas in China has exceeded 6 billion tons, becoming the largest industrial solid waste in China [1,2]. Coal gangue associated with coal seams during the coalification process is a hard black or gray rock with low carbon content [3]. Thus, it can be used as aggregate in concrete and subgrade fillers [4]. Coal gangue also has been widely recycled in construction [5,6], power plants [7], agriculture [8,9], and backfills [10]. For backfill application, its optimum gradation can help alleviate compressive deformation and particle breakage in mine goaf backfills [11]. Compared with these utilization methods, the backfill application of coal gangue is being quickly undertaken because it does not require further treatment and does not produce secondary pollution with its unhealthy elements (e.g., Hg or S) [12]. Therefore, using coal gangue as a subgrade filling material can effectively solve the problem of coal gangue accumulation and solve the problem of filling material shortage in engineering construction while also generating significant economic and social benefits. In order to promote sustainability, using other solid waste materials as subgrade filler has also been focused by many researchers; for example, Liu et al. [13] found that some of the miscellaneous fill mixed with broken pavement fragments and brickbats can be reused as subgrade filling in road construction immediately while some should be treated by soil amelioration. Wang et al. [14] studied the prediction of subgrade settlement for construction and demolition waste used as road subgrade filling materials.
Most of the existing coal gangue is suitable as subgrade filler and has been commonly used in recent years as highway and railway subgrade filler. Coal gangue contains a large amount of particles with a large size (usually including crushed rocks of tens of centimeters) and has a low content of fine particles. Therefore, before backfilling, the large particles are usually crushed to ensure that the pores between large particles in subgrade filler can be completely filled by fine particles, thereby ensuring the long-term performance of the subgrade. Some research results have been achieved on the performance of coal gangue as road subgrade filler, for example, Tang et al. [3] studied the residual deformation of coal gangue subgrade filler through large-scale triaxial tests, and established a calculation model. Li et al. [12] measured the basic properties of coal gangue such as particle size distribution, ignition loss, strength change under water softening, and compression performance and put forward the technology to use coal gangue as filler in railway subgrade and demonstrated that a coal gangue roadbed had excellent performance, meeting the requirements for high-speed railway roadbeds. Zhang et al. [15] conducted a series of cyclic triaxial tests using large-scale dynamic triaxial apparatus, designed experimental grading by using the fractal model grading equation, and calculated the well-grading limits, and then, proposed a unified model of permanent deformation for coal gangue subgrade filler under traffic cyclic loading. Jiao et al. [16] analyzed the inorganic salt content and heavy metals of coal gangue used in Xing Fen expressway, evaluated the groundwater, and found that the influence of coal gangue on groundwater meets the requirements and coal gangue as a new filler can be applied to coastal highway roadbeds. Song et al. [17] studied the variation characteristics and correlation between pH and conductivity of coal gangue under different pH conditions, and then, provided certain data and theoretical support for the greening research of coal gangue as subgrade filler.
Coal gangue is widely used as subgrade filler, but theoretical research still lags far behind engineering practice. In terms of lithology, coal gangue belongs to soft coarse aggregate, which is a mixture of various soft rocks. The strength of the coarse particles is low and they are prone to breakage under stress. The crushing of coal gangue particles will have a significant influence on its engineering properties such as compaction, permeability, compression, bearing capacity, deformation, and strength, thereby affecting the overall stability and service life of the subgrade. In recent years, the traffic flow in China has gradually increased, and the phenomenon of vehicle overloading has become increasingly prominent. Therefore, the crushing of coarse particles in coal gangue subgrade filler under high loads is more worthy of special attention.
This paper mainly studies particle crushing tests of CGSF under uniaxial compression conditions and investigates the relationship between load and displacement, crushing strength, failure pattern, and gradation after crushing, and puts forward a new visual analysis method for the crushing patterns of particles through image analysis and proposes a new gradation equation based on the traditional fractal model to describe the crushed particles. The research results can lay a foundation for the evolution process of coal gangue particle crushing, the relationship between particle crushing and subgrade filling compaction parameters, and the relationship between particle crushing and subgrade bearing performance evolution.
2. Particle Crushing Test
2.1. Test Materials and Equipment
The original test materials were crushed coal gangue, which was collected from a coal mine in Xiangtan city. Nearly 15 tons of coal gangue were transported to the laboratory for indoor testing and research. The color of the coal gangue particles was black and black-gray, and the coal gangue has not experienced spontaneous combustion. Coal gangue particles are angular and sharp, have rough surfaces, an irregular shape, and are hard. The CGSF was dried to constant weight in an oven at 105–110 °C (more than 24 h), and then, the standard sieve tests were carried out. This experiment selected 20 particles with a size range of 60–40 mm after standard sieve tests to conduct the particle crushing test on CGSF, and the sample numbers are 1#–20# in sequence. Figure 1 displays the 20 particles used in this experiment, and denotes the maximum size in all directions of a particle (mm); m represents the mass of a particle (g). The values of particle mass and size refer to the study by Koohmishi et al. [18], which selected 20 particles from a particle group to investigate the strength of ballast.
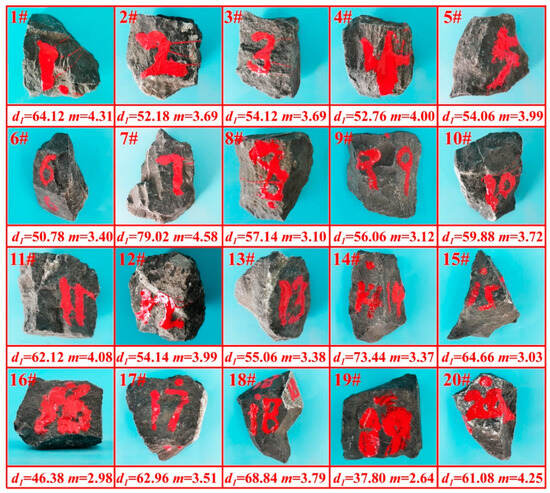
Figure 1.
Test materials of particle crushing (di/mm; m/g).
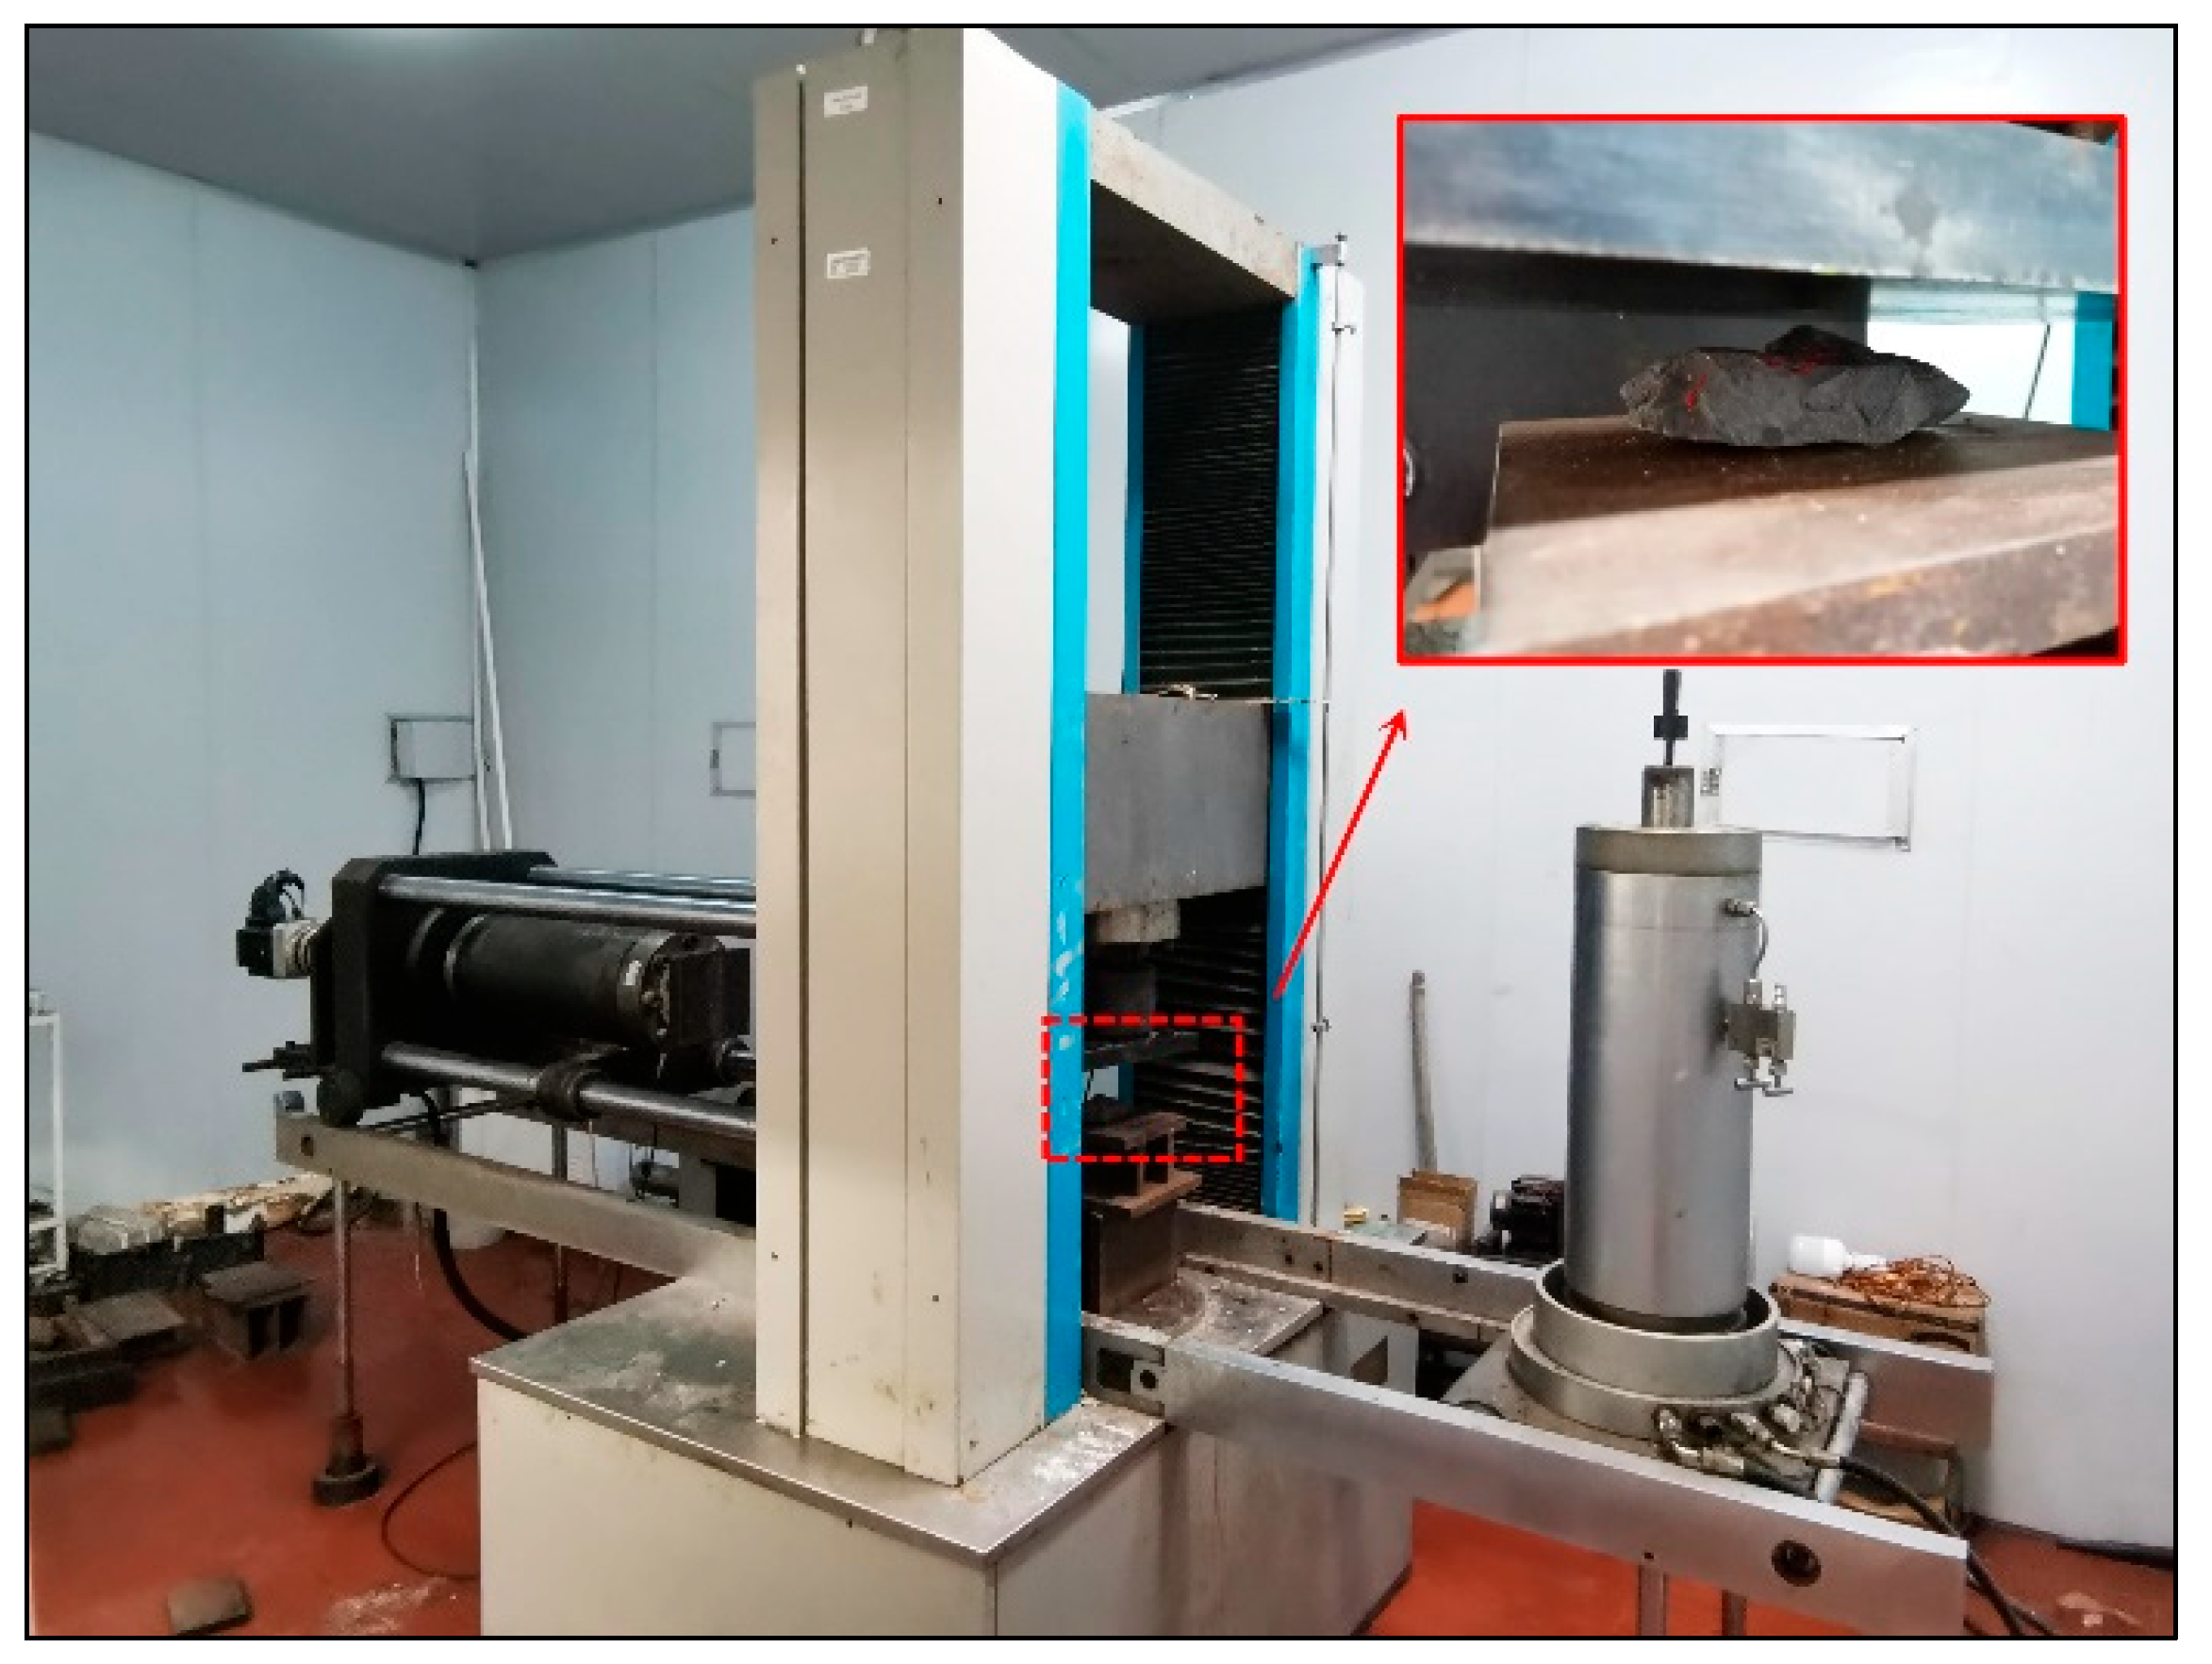
The microcomputer-controlled rock shear rheological instrument (RYL-600) displayed in Figure 2 was used in this test. This instrument, with a data accuracy less than or equal to 0.3%, can provide an axial load of 600 kN and automatically collect and store test data during the test process.

Figure 2.
The microcomputer-controlled rock shear rheological instrument (RYL-600).
2.2. Experimental Programme
Wash each particle with clean water and dry it in an oven at 105–110 °C until it reaches a constant weight. Then, label each particle with a red paint number. Measure and record the mass, the maximum size in all directions , and the maximum size values of and in the other two directions perpendicular to , before testing, which meets . During the experiment, both and are parallel to the two loading surfaces, is perpendicular to the two loading surfaces, and the distance between the center of particle gravity and the bottom loading surface is less than , as shown in the embedded diagram of Figure 2. Load at a rate of 0.5 mm/min and stop loading when the coal gangue particle breaks; the same loading method was also used in Wang et al. [19]. After the experiment, carefully collect the crushed coal gangue particles and pass them through standard sieves with opening sizes of 60 mm, 40 mm, 20 mm, 10 mm, 5 mm, 2 mm, 0.5 mm, and 0.075 mm.
3. Particle Strength
3.1. Relationship between Load and Displacement of Particle Crushing
Through the particle crushing test of the CGSF mentioned above, the relationship curves between load and displacement of the particles under uniaxial compression test conditions were obtained, as displayed in Figure 3, Figure 4, Figure 5 and Figure 6. In order to better identify the variation in each curve, the curves of 20 samples are divided into four figures for display, each subgraph contains the curves of five samples. As shown in Figure 3, Figure 4, Figure 5 and Figure 6, with the increase in displacement, the relationship curve between load and displacement for CGSF particle crushing can be divided into three types.
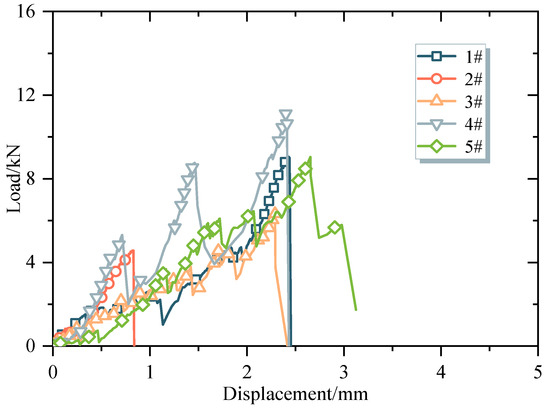
Figure 3.
Load–displacement curves of particle crushing (1#–5#).

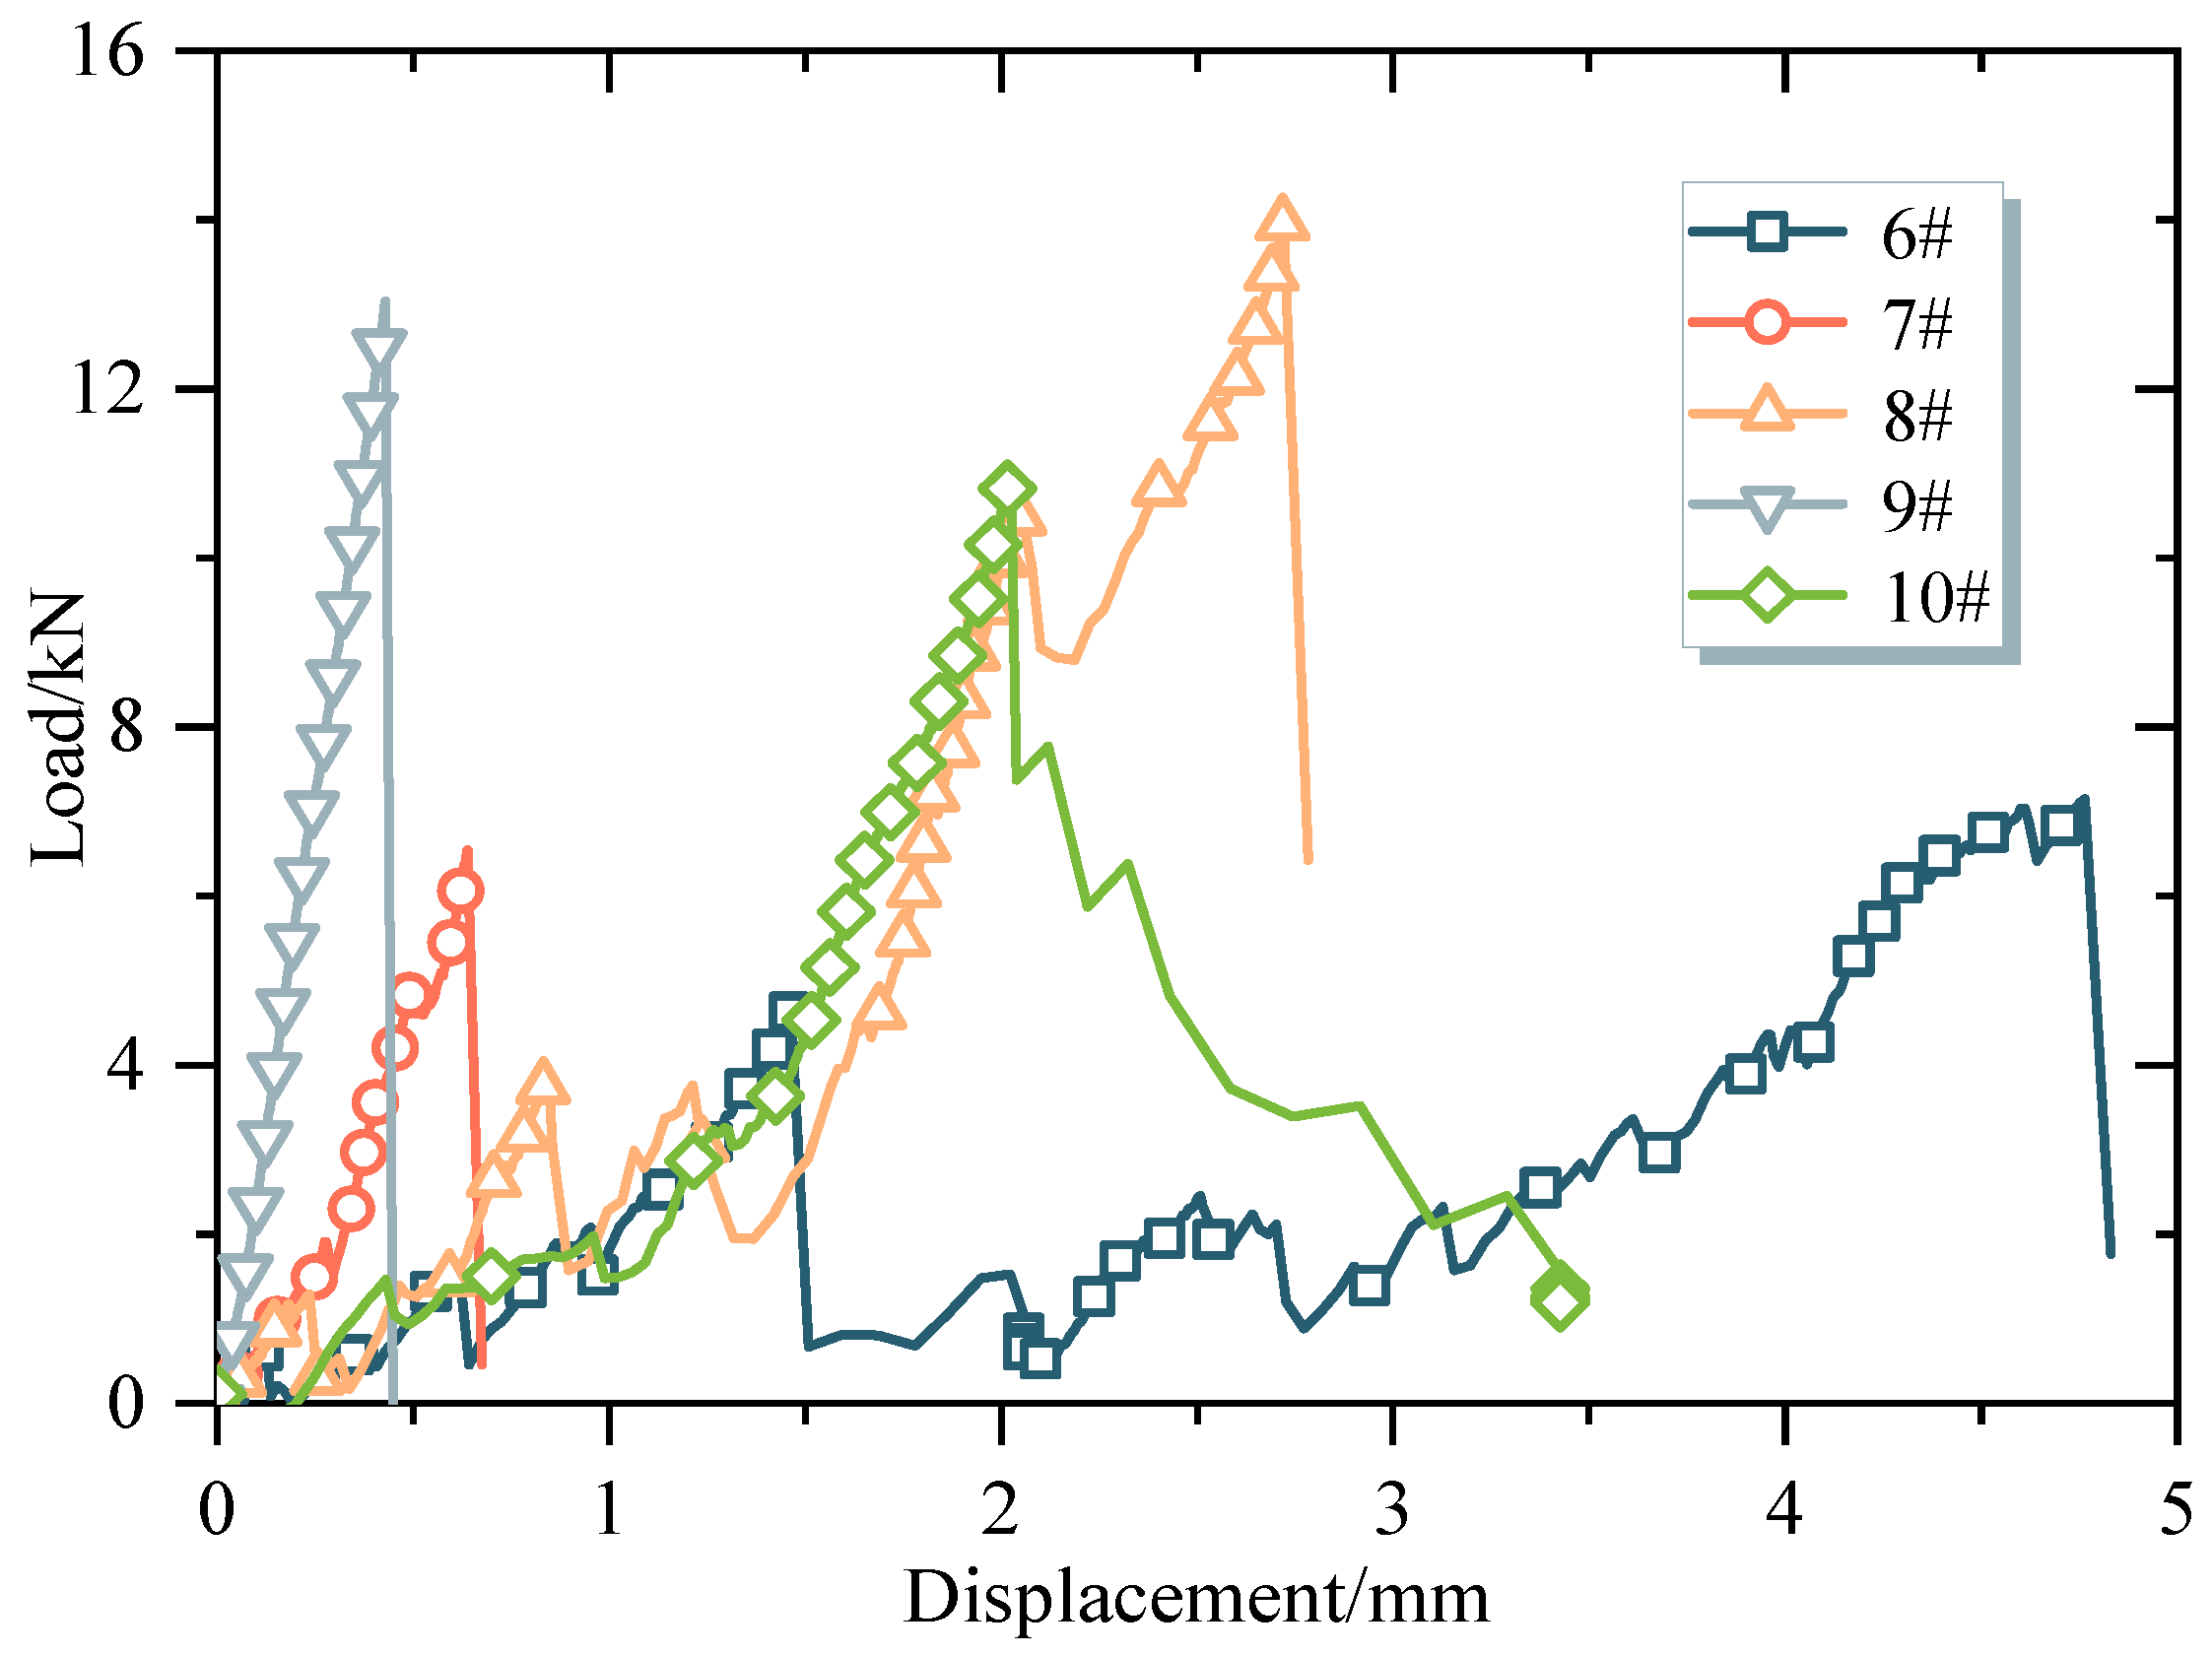
Figure 4.
Load–displacement curves of particle crushing (6#–10#).
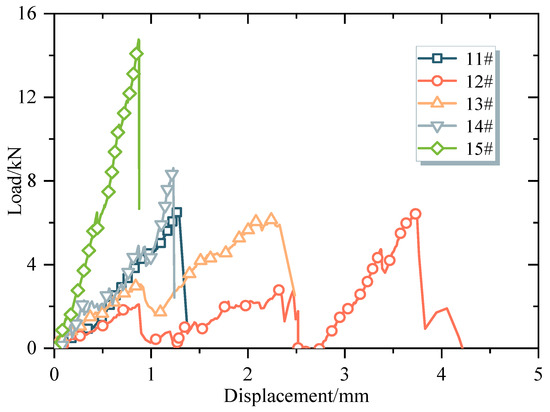
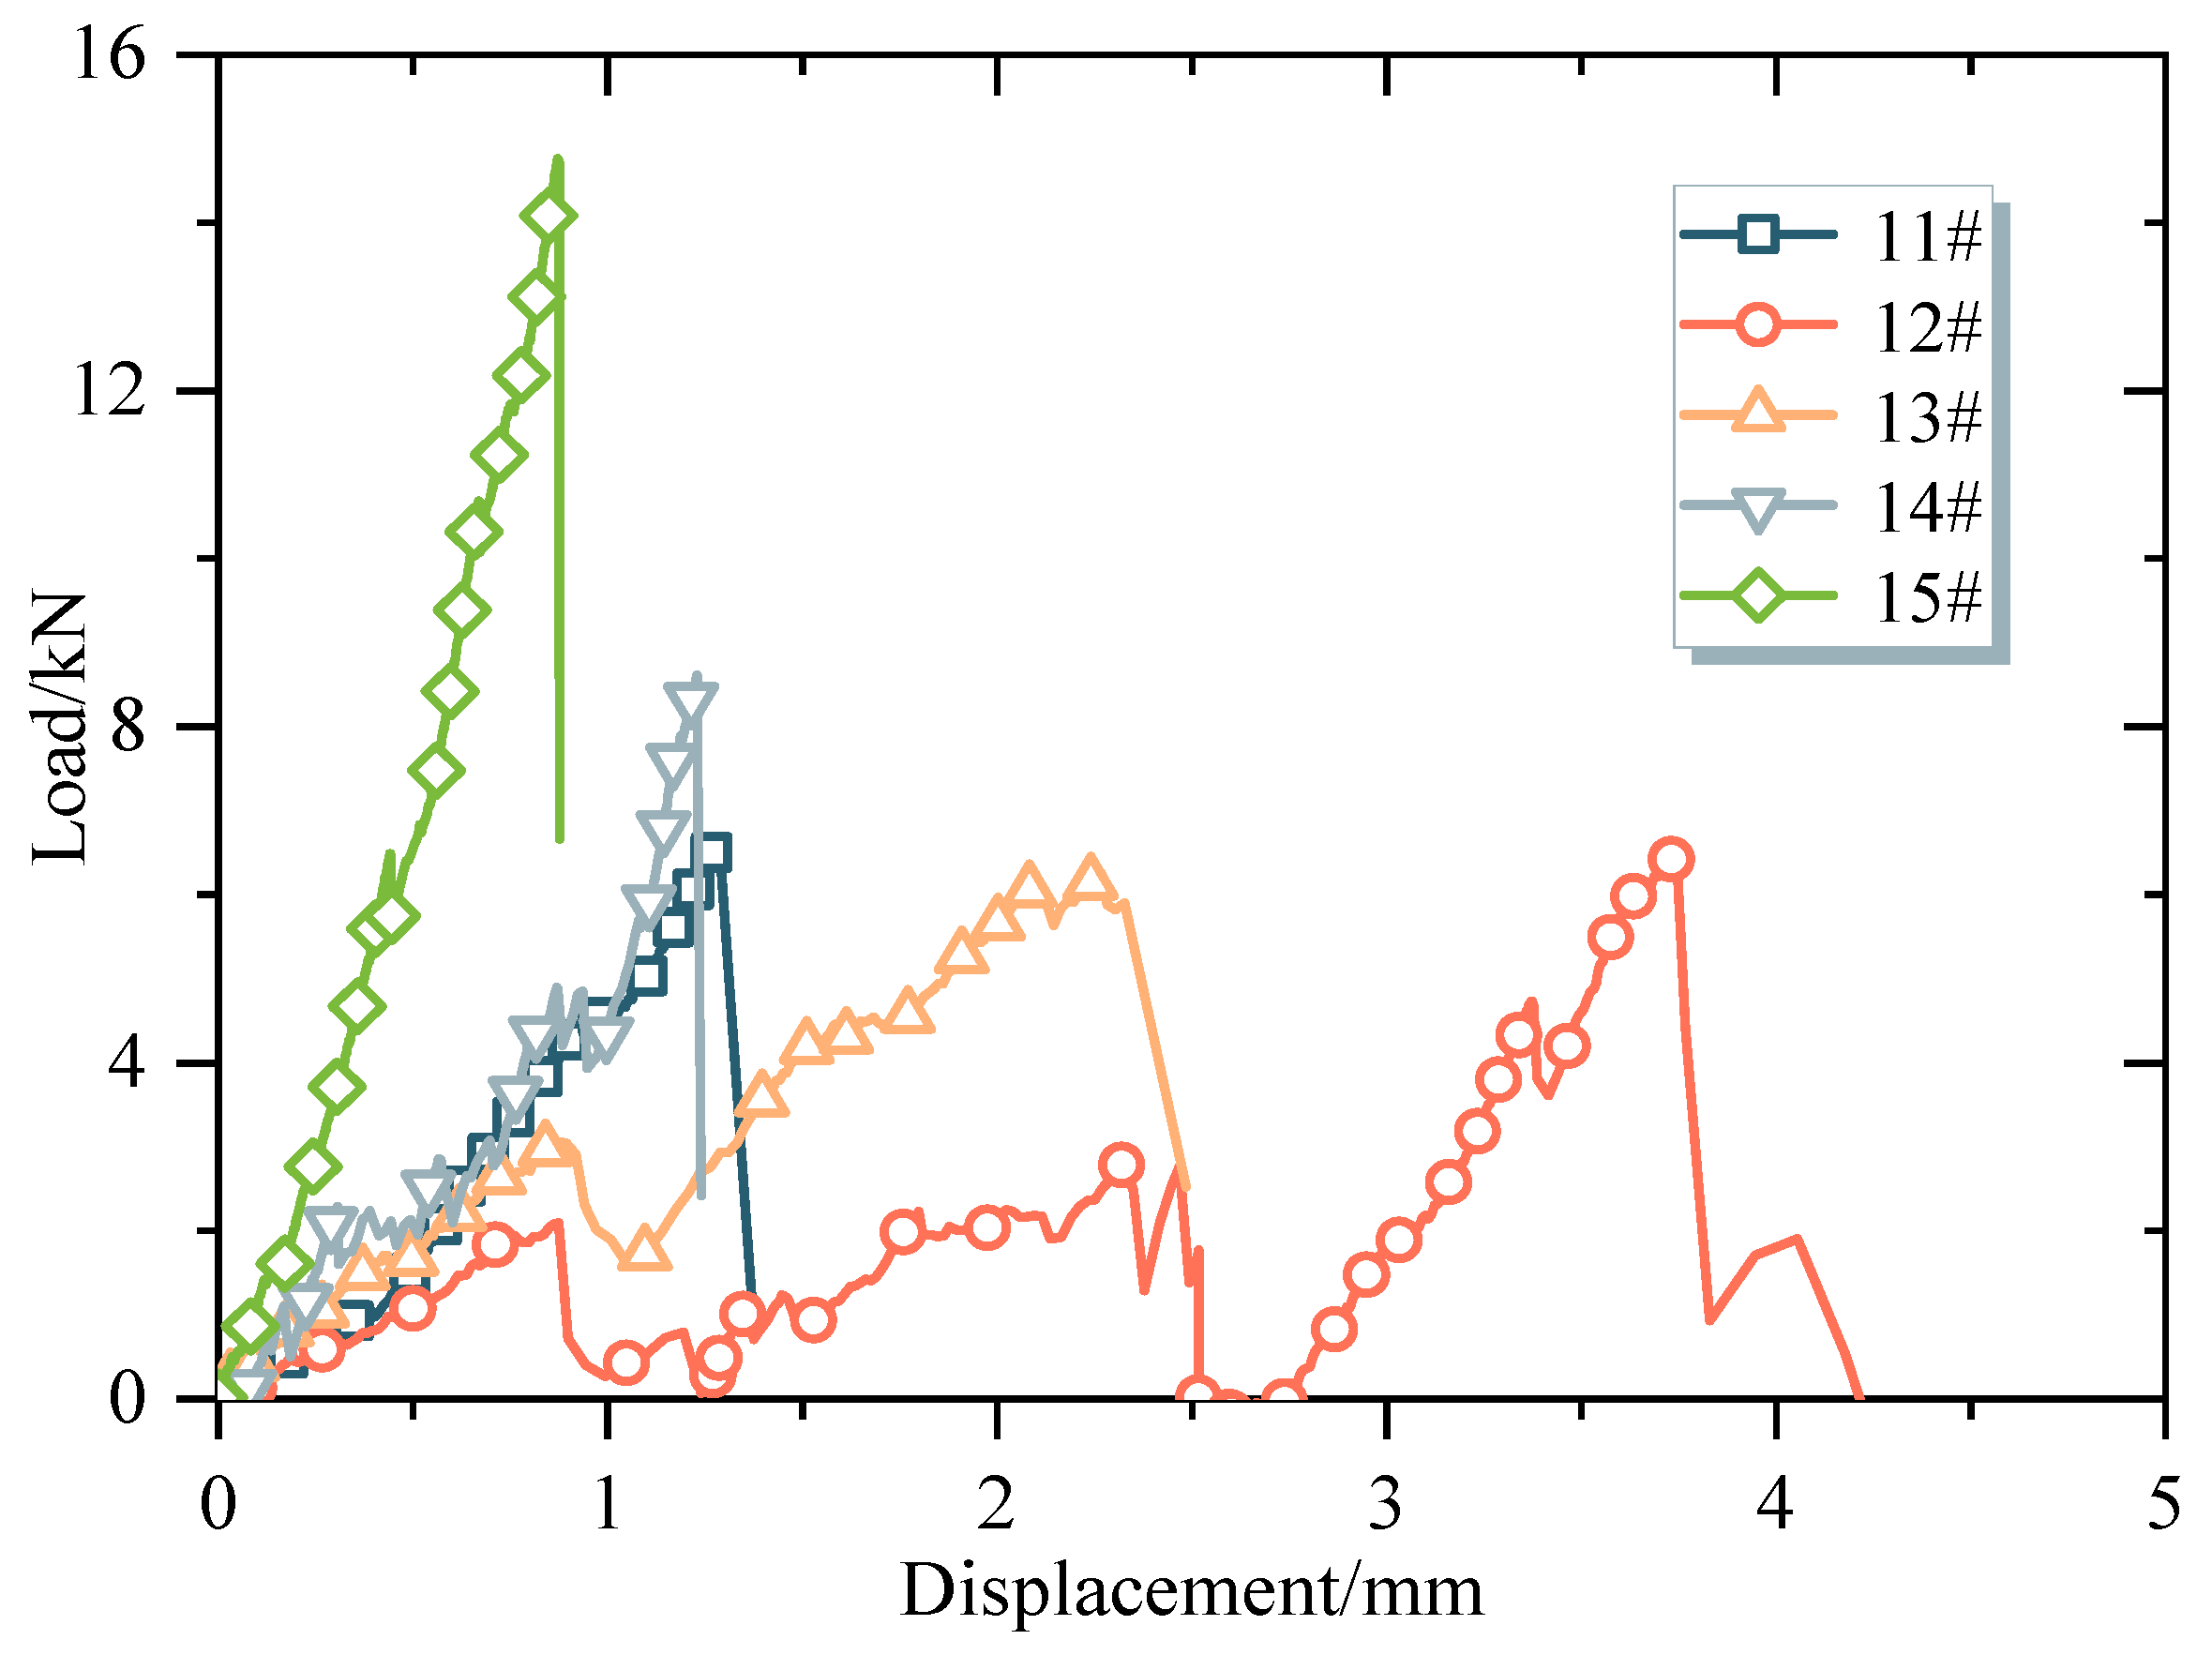
Figure 5.
Load–displacement curves of particle crushing (11#–15#).

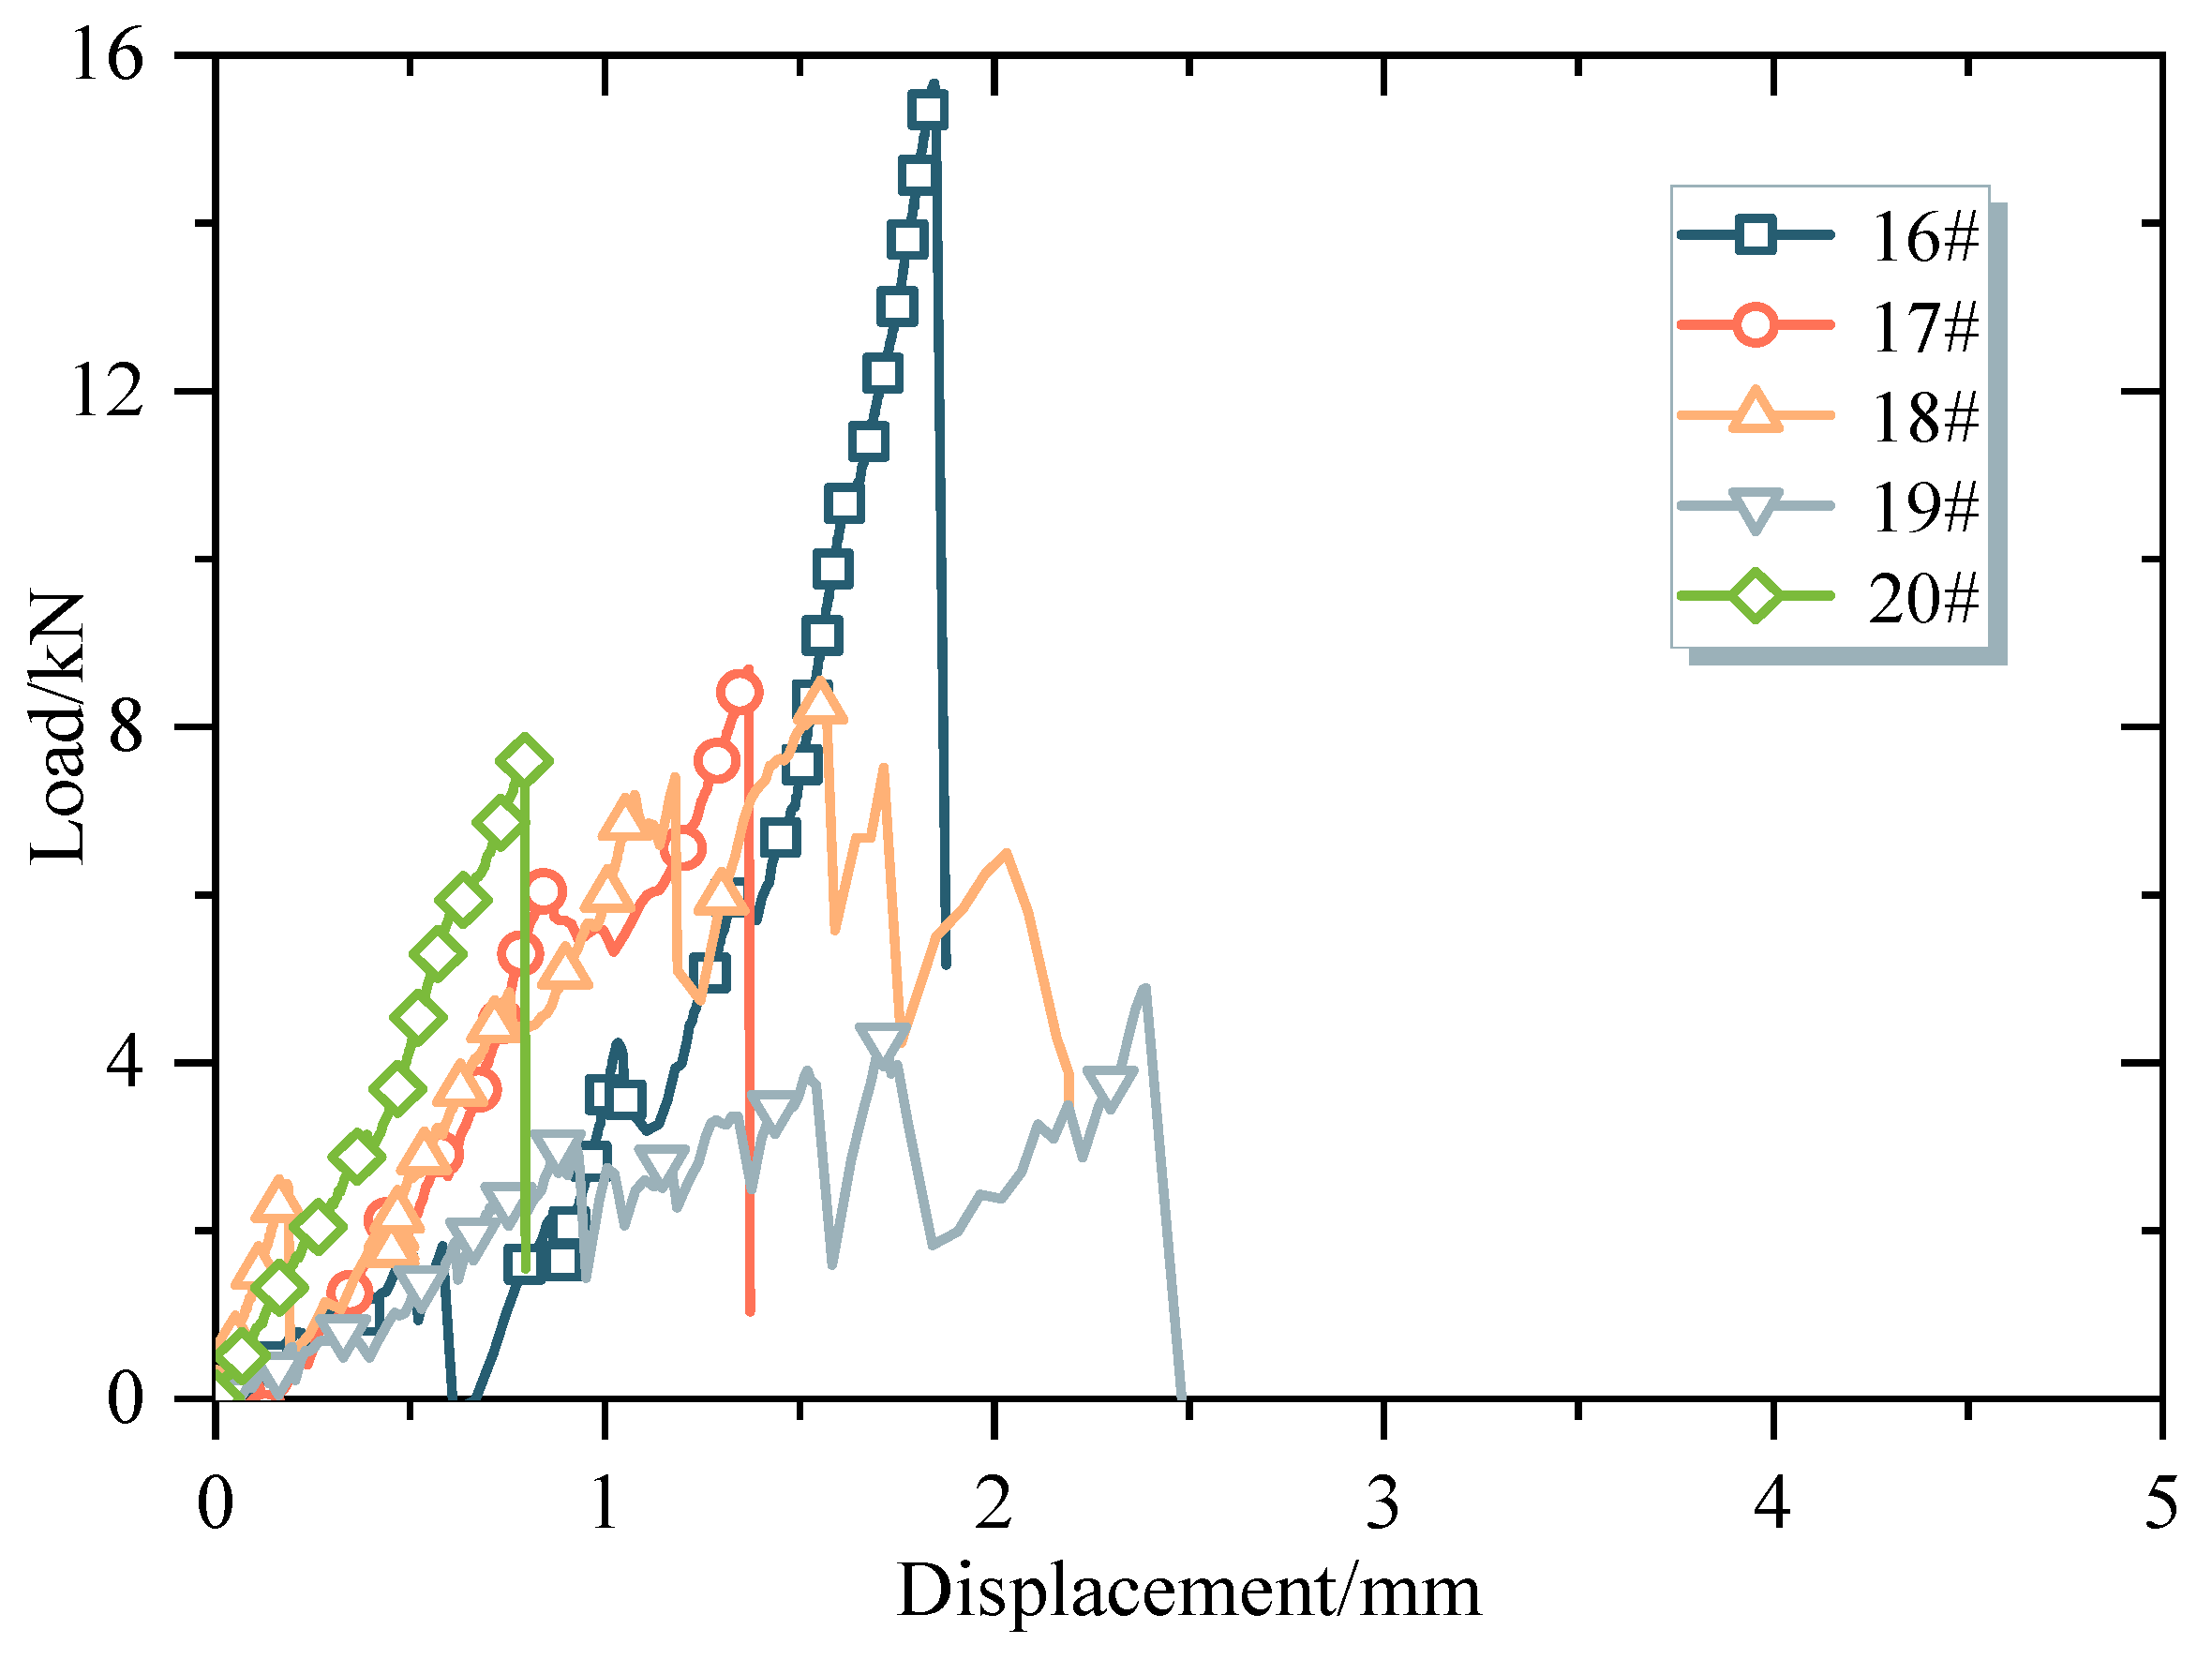
Figure 6.
Load–displacement curves of particle crushing (16#–20#).
The first type is a fluctuation growth curve, the increase in load gradually reaches its peak after experiencing multiple extreme values (such as samples 1#, 3#, 4#, 5#, 8#, 10#, 13#, 14#, 17#, 18#, and 19#). This type of curve is reflected in the experiment as follows. During the uniaxial compression process, the sharp corners of the particles come into contact with the two loading surfaces. As the displacement gradually increases, each sharp corner is gradually crushed, causing the curve to fluctuate and produce extreme values. This phenomenon also reflects that the sharp corners of coal gangue particles will break before the overall particles when subjected to force. The contact mode of particle materials is mainly point to point contact, and the sharp corners of particles are prone to stress concentration after being subjected to force, leading to the crushing of the sharp corners of particles.
The second type, similar to the first type, also shows fluctuating growth in the curve. However, the difference is that the load at the trough of the curve is near zero. The corresponding sample of this curve in the experiment shows that the sharp corners of the particles in contact with the loading surface break and fall, causing the load to suddenly change to zero (for example, samples 6#, 12#, and 16#).
The third type shows approximately linear growth in the curve, and failure occurs under small displacement, exhibiting brittle rock failure characteristics (for instance, samples 2#, 7#, 9#, 11#, 15#, and 20#). The samples are accompanied by a loud sound during failure, and the main characteristic of failure is splitting failure.
3.2. Particle Crushing Strength
Cavarretta et al. [20] proposed the particle crushing strength in uniaxial compression test based on [21,22,23,24], which was defined as [20,25,26]
where indicates the particle crushing strength (kPa); represents the load at particle failure (kN); and and are the intermediate size and minimum size of a single particle (m), and their measurement methods are shown in Section 2.2.
Substitute the load obtained in the above experiment and and measured before testing into Equation (1) to calculate the particle crushing strength ; the results are listed in Table 1. According to Table 1, the distribution of particle crushing strength is between 3.02 MPa and 11.11 MPa, and the dispersion of particle strength is relatively large.

Table 1.
Particle crushing strength .
In order to further analyze the strength characteristics of particle crushing, the Weibull cumulative distribution function is introduced. The Weibull distribution function was proposed by Swedish engineer Weibull in 1939. Due to its ability to accurately and reliably predict from small samples, it is widely used in various fields. Based on the Weibull cumulative distribution function, the crushing probability of coal gangue particles can be expressed as [27]
where represents the cumulative crushing probability of coal gangue particles; represents the applied stress; denotes the scale parameter; and is the shape parameter.
Then, the probability of particle survival can be expressed as
where denotes the survival probability of coal gangue particles.
In order to capture the survival probability of particle specimens under uniaxial compression conditions, is sorted in ascending order. There are many calculation methods for the i-th strength survival probability [28], and the most widely used survival probability calculation formula is [18,29,30]
where represents the survival probability prediction factor, ; is the serial number of the particle strength sorted in ascending order; and n is the total number of particles in the experiment, and n = 20 in this study.
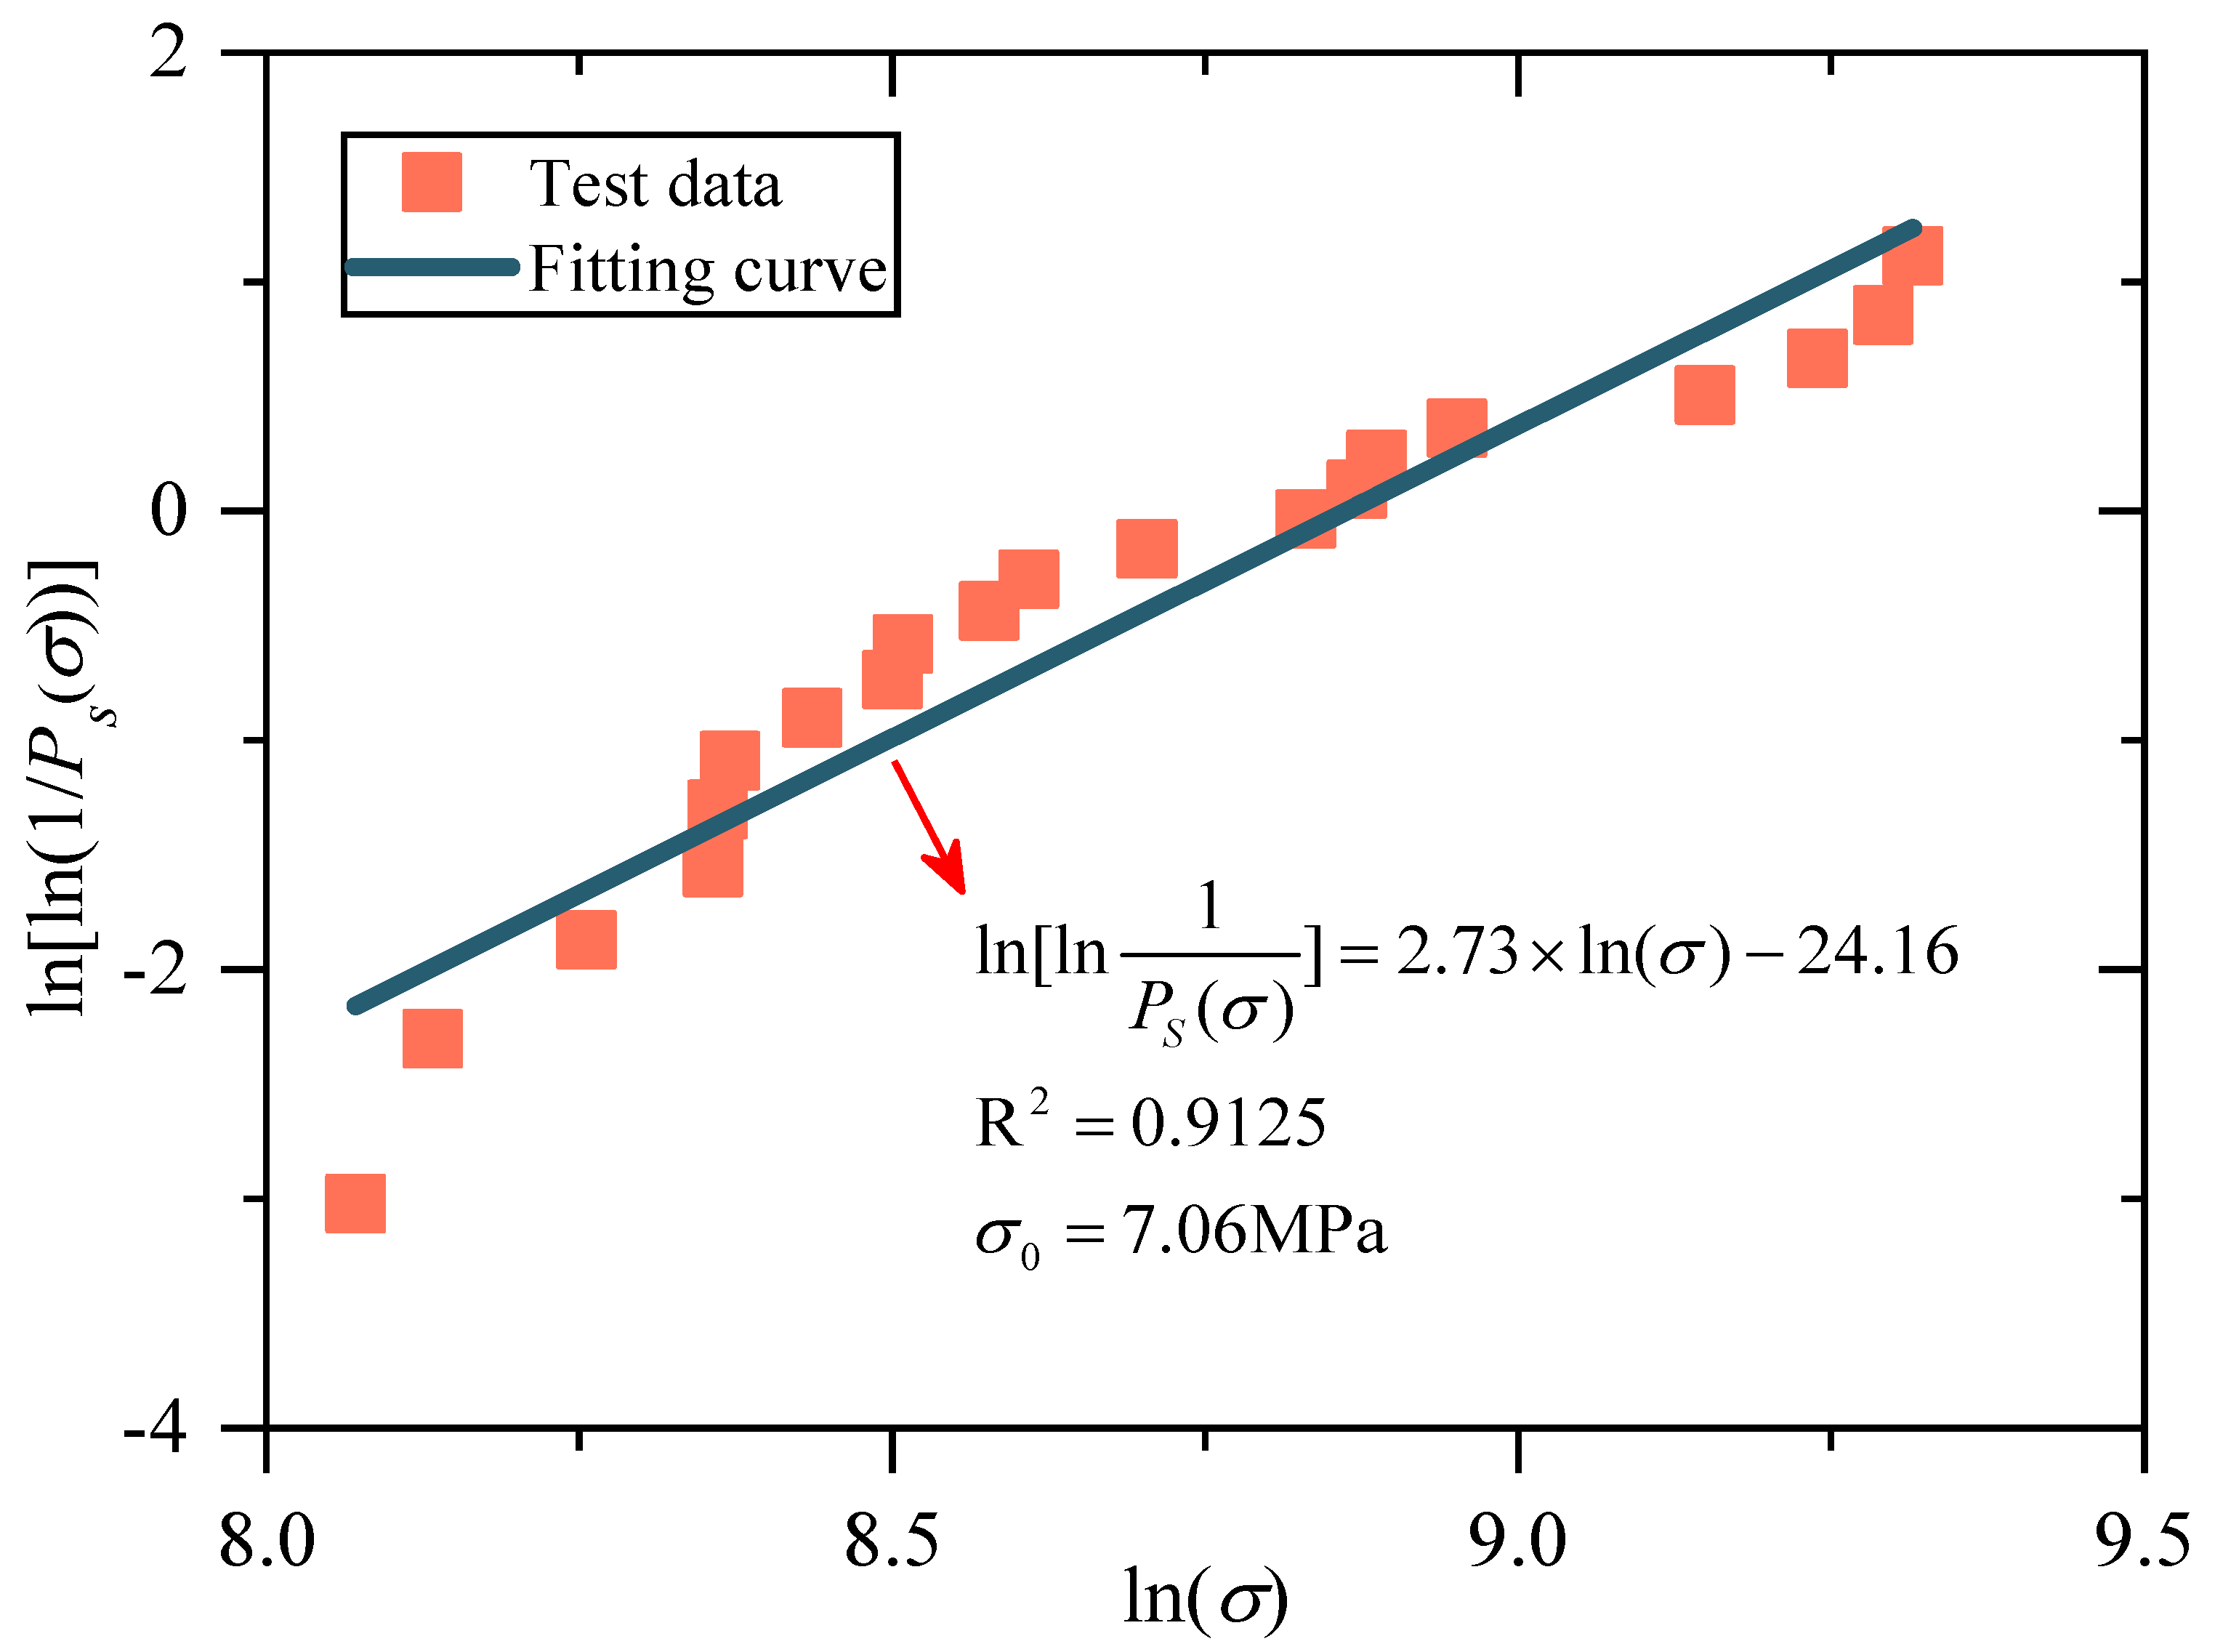
Take two logarithms of Equation (3), then Equation (3) can be written as
where represents the crushing strength corresponding to a survival rate of 37%, when ; m is the slope of the straight line.
According to Equation (5), and satisfies a linear relationship. Then, and are fitted by linear functions, that is
7.06 MPa can be obtained by calculation. The test data and fitting line for and are illustrated in Figure 7. As observed in Figure 7, the crushing probability of coal gangue particles and the applied load well satisfy the Weibull distribution function.

Figure 7.
Weibull survival probability plots for particles.
4. Particle Crushing Properties
4.1. Particle Crushing Patterns
The particle crushing of coal gangue coarse-grained subgrade filler is directly related to its compaction, strength, deformation, and permeability. Therefore, studying the particle crushing patterns and the description method after crushing is of great practical significance for revealing the deformation mechanism of coarse-grained subgrade.
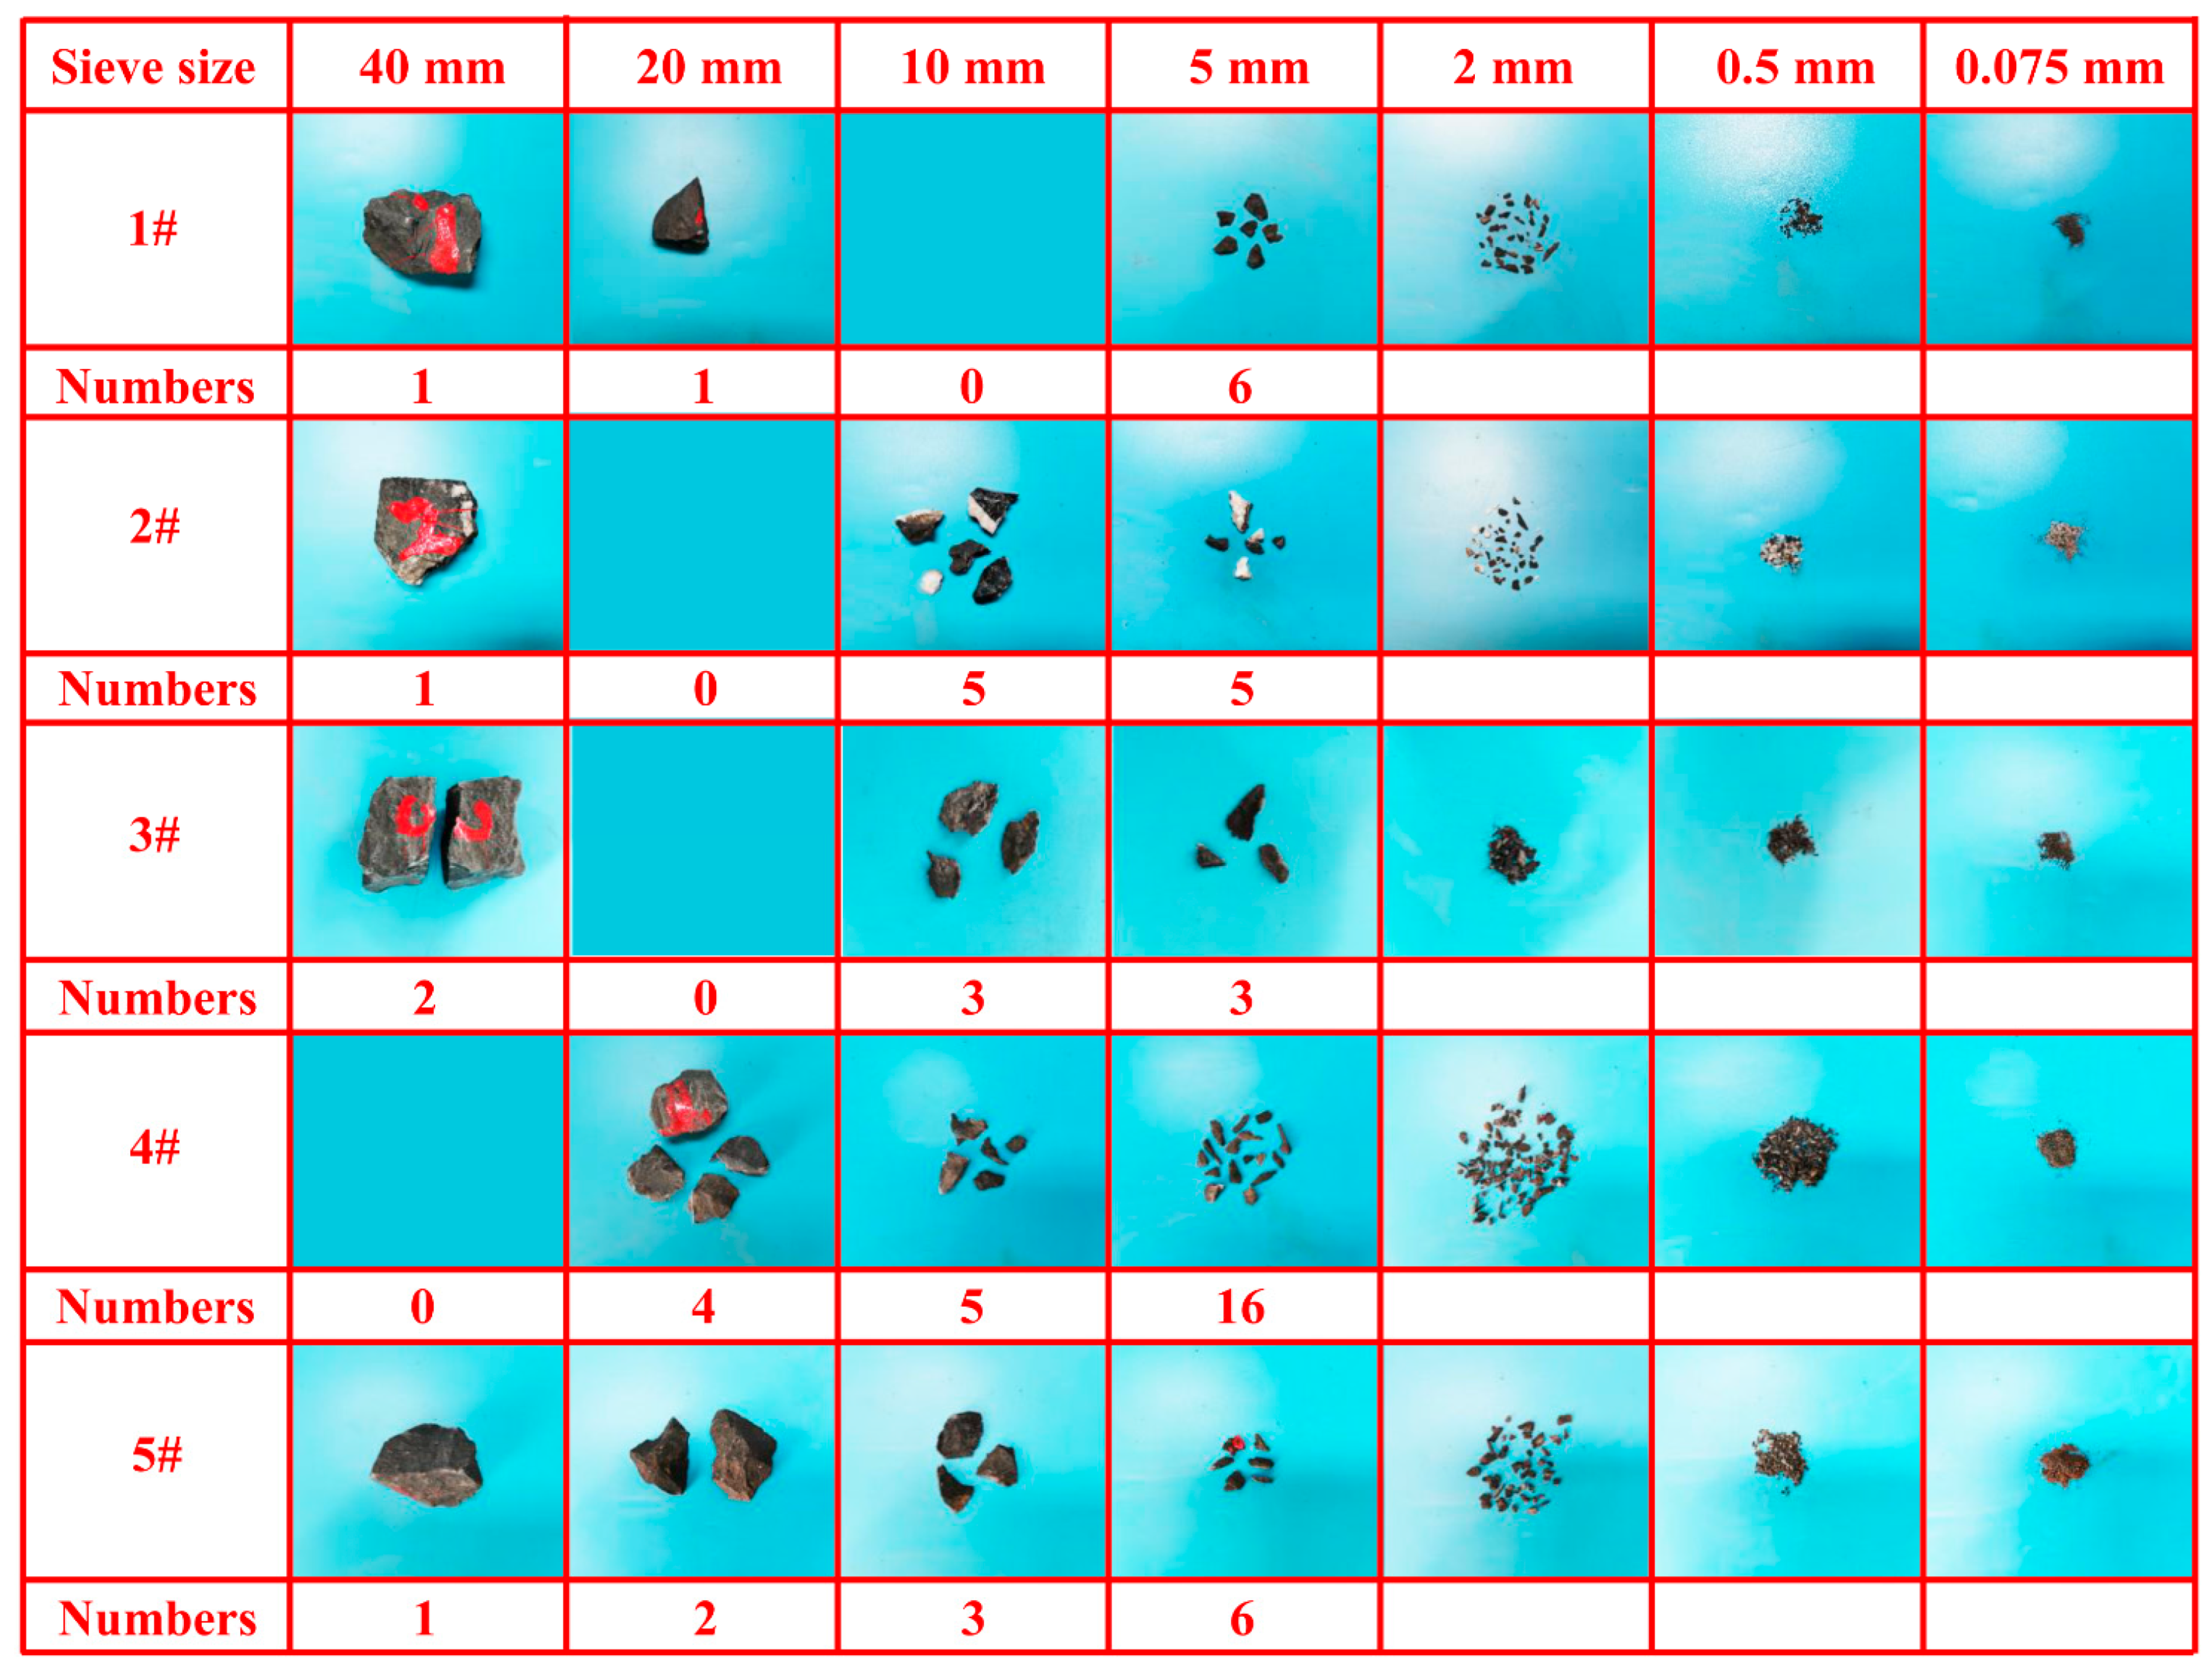
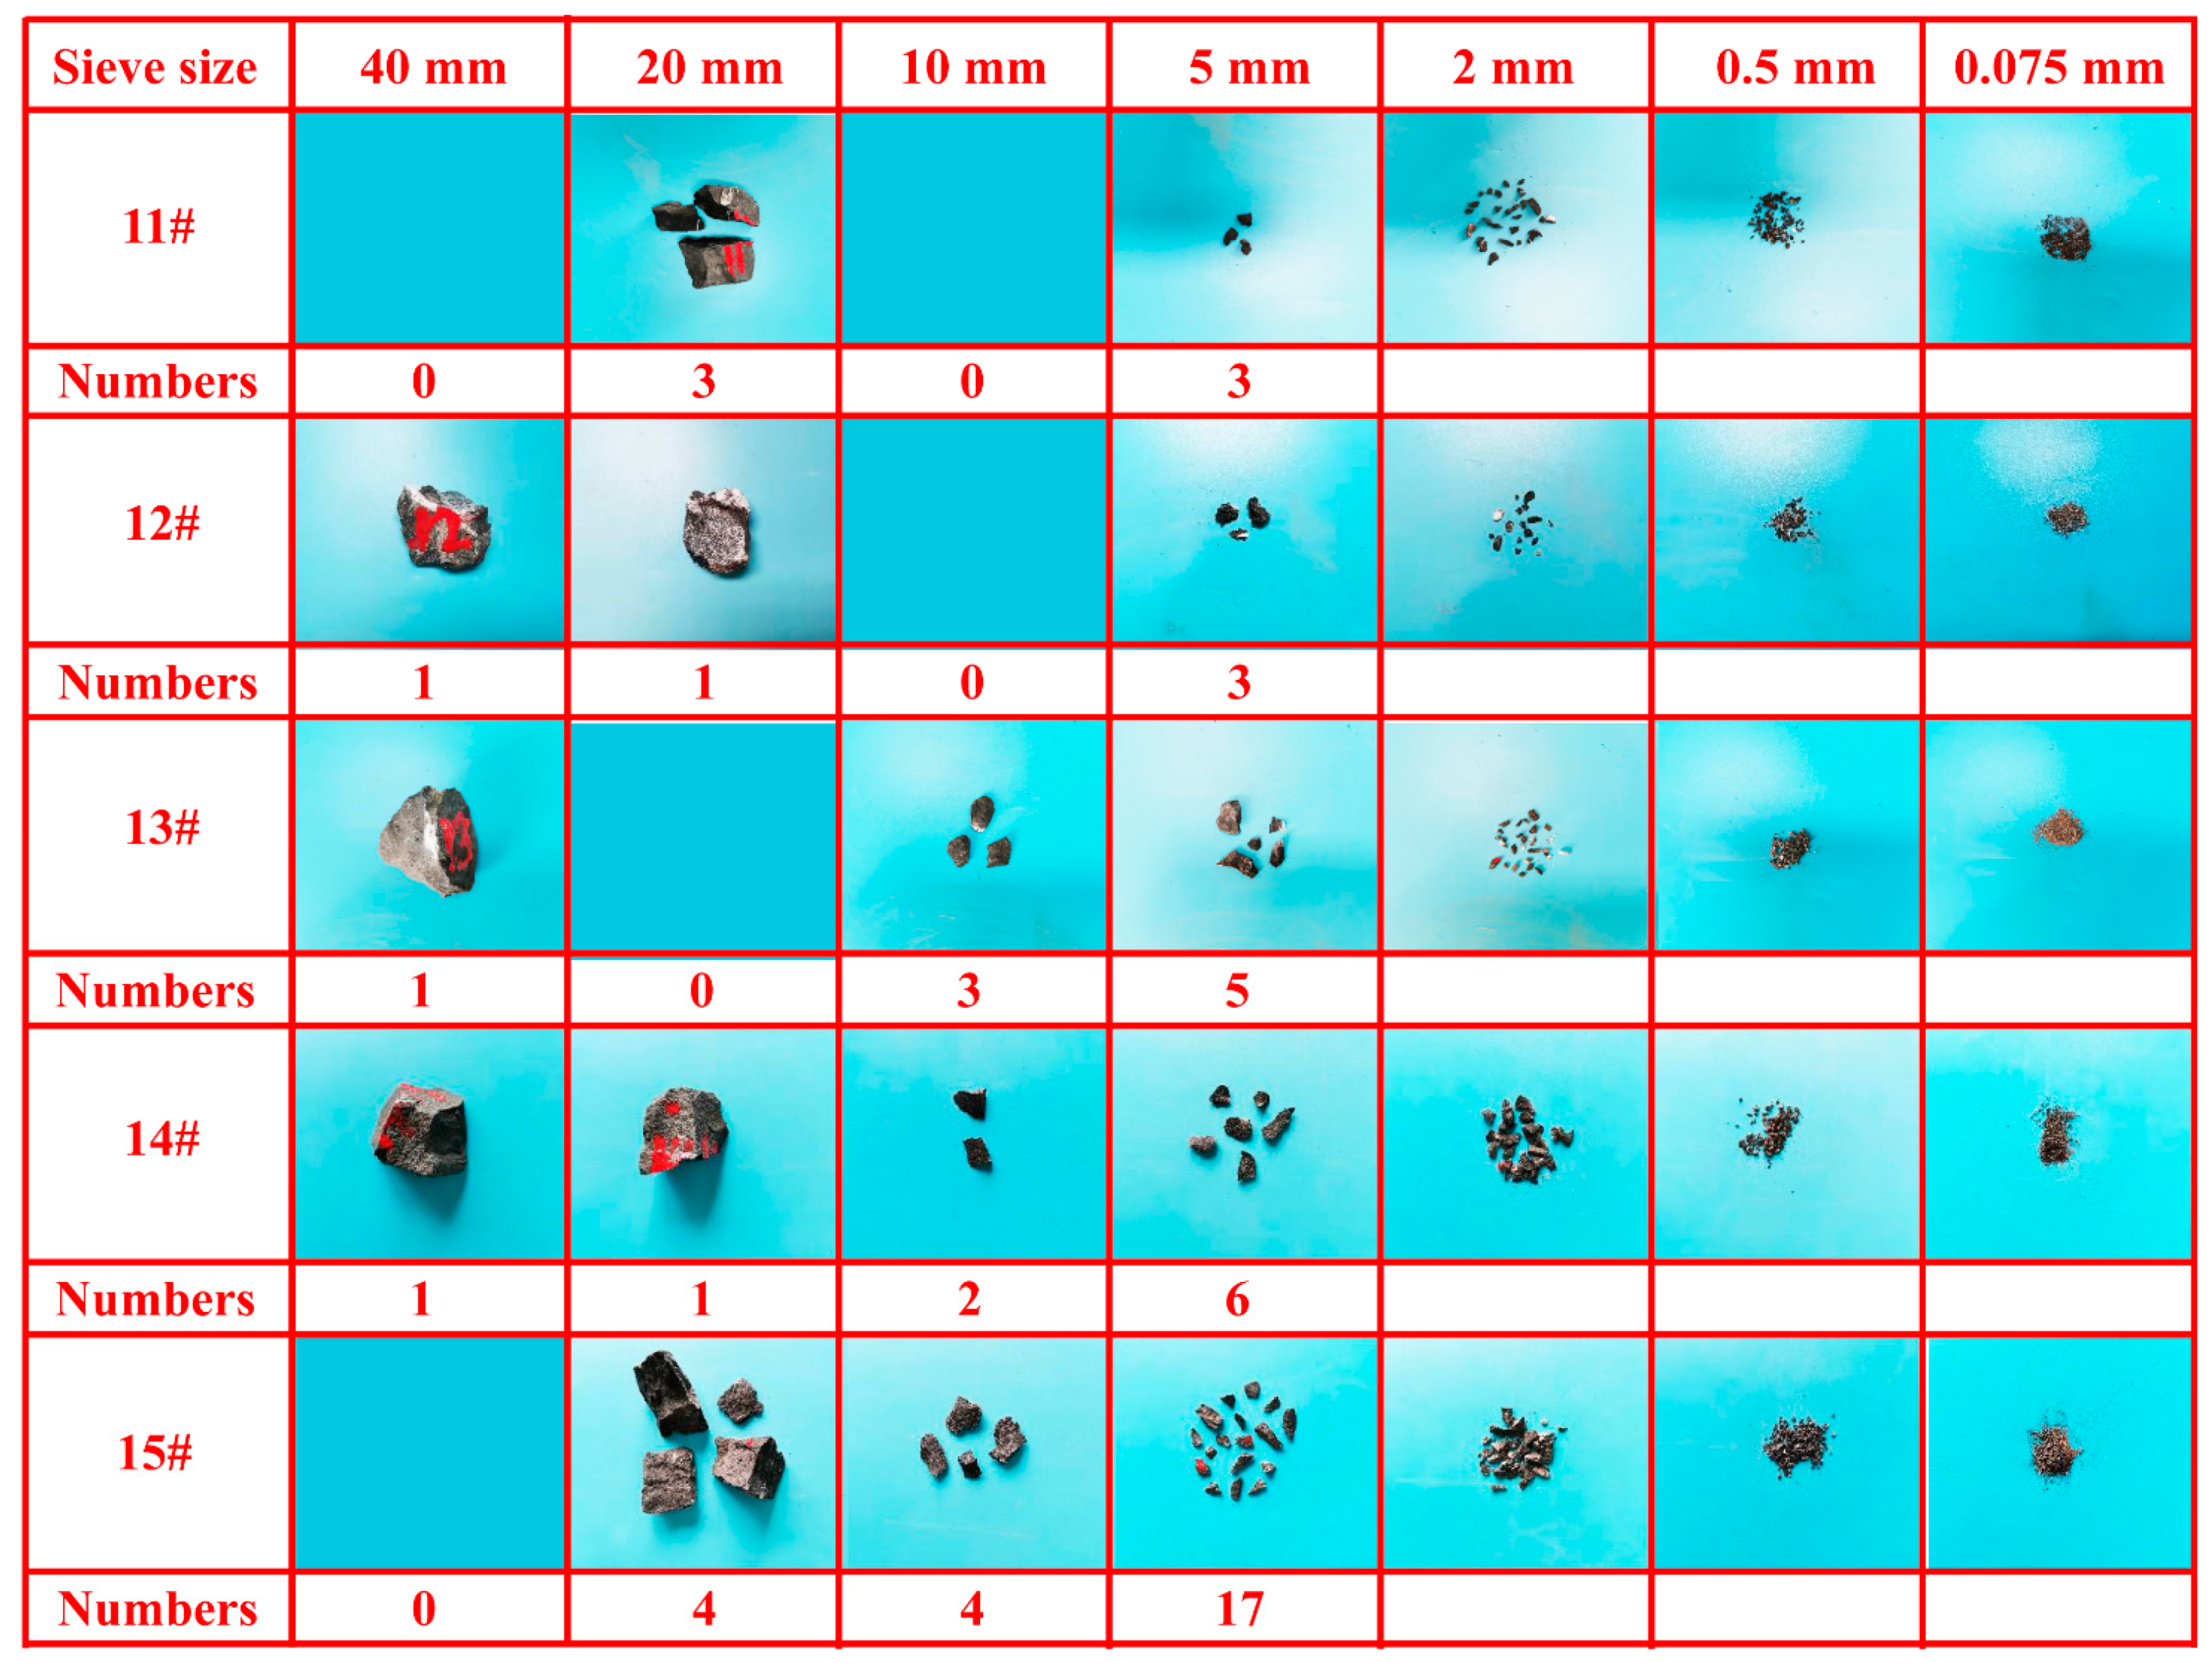
To clearly demonstrate the crushing characteristics of coal gangue particles, a visual analysis method for the crushing patterns of particles is provided through image analysis, as indicated in Figure 8, Figure 9, Figure 10 and Figure 11. The sieve size in Figure 8, Figure 9, Figure 10 and Figure 11 is the diameter of a circular hole in the standard sieve, and the numbers mean the number of particles left on the corresponding standard sieve after the screening test. Due to the large number of particles smaller than 2 mm and the very small particle size, only the particles with a particle size greater than 5 mm were counted.
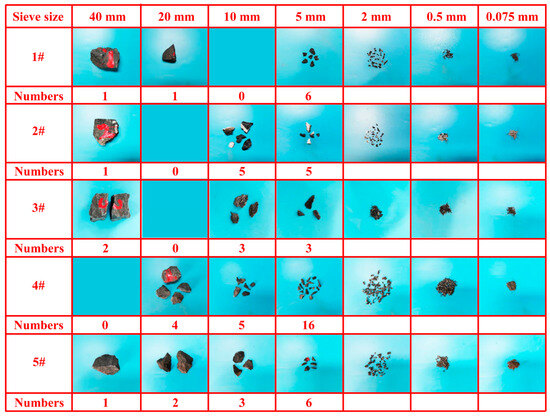
Figure 8.
Distribution of each particle group after particle crushing (1#–5#).
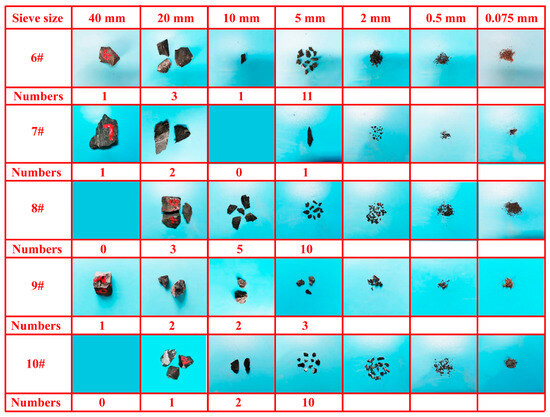
Figure 9.
Distribution of each particle group after particle crushing (6#–10#).
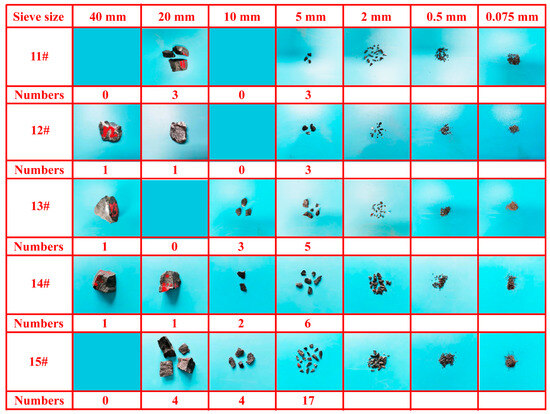
Figure 10.
Distribution of each particle group after particle crushing (11#–15#).
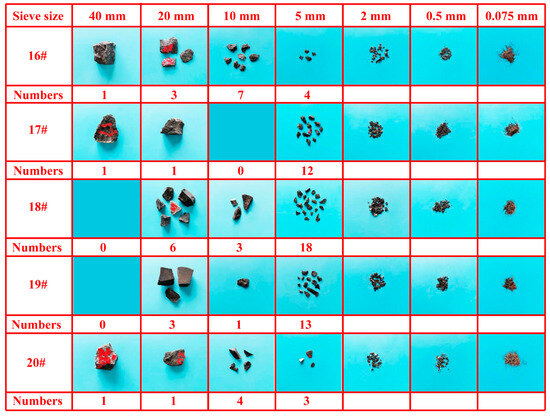
Figure 11.
Distribution of each particle group after particle crushing (16#–20#).
After crushing coal gangue particles, the large particles with a particle size greater than 20 mm mainly present a block shape. The shape of the 10–2 mm particle group is mainly flaky and acicular. The group with a particle size less than 2 mm is mainly in the form of powder. During the loading process of the experiment, the sharp corners of the specimen first come into contact with the loading surface. Due to the irregularity in the loading surface of the specimen, in the early stage of loading, the sharp corners of the specimen are gradually crushed into powder particles. As the axial load increases, the edges and corners of the specimen are broken to produce flaky particles, until the final sample is crushed and simultaneously produces block-shaped, flaky, and powder particles. The statistical analysis of the shape of particles with a size greater than 5 mm shows that the shape of the broken particles is mainly flaky, accounting for 68% of the total number, while the number of acicular particles is the least.
The number of particles after crushing gradually increases with the decrease in sieve size, and the fragments are basically distributed in each particle group, meeting certain statistical distribution rules (detailed analysis is conducted in the following subsection).
4.2. Particle Gradation after Crushing
All the fragments of each coal gangue particle were carefully collected after the uniaxial compression test, and a screening test was used to obtain the particle size distribution (gradation) of the coal gangue fragments for each particle group after crushing.
The crushing of rocks satisfies fractal theory, and there are many methods for calculating the fractal dimension [31,32,33]. The widely used fractal dimension is described based on the principle of self-similarity, which is defined as
where denotes a scale; is the measurement value obtained at scale ; and D represents the fractal dimension.
Equation (7) also provides a calculation method for the fractal dimension, which means that as long as the corresponding scale and at this scale are measured, the line slope of and can be captured in a logarithmic coordinate system. Then, the required fractal dimension can be calculated.
The particle size distribution of coal gangue after crushing was acquired through screening experiments. This method is simple and the data are reliable. Therefore, this paper adopts the fractal dimension based on the correlation between mass and size to investigate the gradation after coal gangue particle crushing.
The fragments after rock crushing follow a size–frequency distribution:
where represents the passing percentage; di means the particle size; M indicates the total mass; is the mass related to the particle size; and β represents the mass–frequency distribution index.
Expanding Equation (8) into a Taylor series and ignoring higher-order terms, then
Taking the derivatives of Equations (7) and (9), respectively, gives
According to the relationship between mass and size, i.e., , it can be concluded that
Therefore,
Then, the fractal gradation equation can be written as
Letting, , , Equation (14) can be rewritten as
According to Equations (13)–(15), can be calculated; it is shown in Table 2. It can be seen from Table 2 that the fractal dimension after particle crushing is between 1.2053 and 2.0620, and the correlation coefficient is between 0.7657 and 0.9791. Hence, fractal theory can describe the particle size distribution after particle crushing. However, there are also some poorly described situations, such as 13#, 3#, 16#, 11#, 7#, 12#, and 6#, the correlation coefficients of which are all less than 0.9.
Table 2.
Fractal dimension after particle crushing.
In order to further improve the descriptive ability of the traditional fractal gradation equation, the logarithms of Equation (15) are taken:
For Equation (16), ln Pi and ln xi form a linear relationship. Consider the following improvement methods, Equation (16) is expressed by a polynomial function following Taylor’s formula:
According to the definition of gradation, Pi = 1 when x = 1, therefore a0 = 0.
To improve the widespread applicability of Equation (17), the model parameters need to be reduced. Firstly, assume that Equation (17) meets the accuracy requirements under the condition of a quadratic polynomial. Therefore, Equation (17) can be written as
where and are the model parameters.
The improved model will be used to describe the gradation of coal gangue fragments for each particle group after crushing as follows. According to Equation (18), and can be calculated, and are shown in Table 3.
Table 3.
The new model parameters.
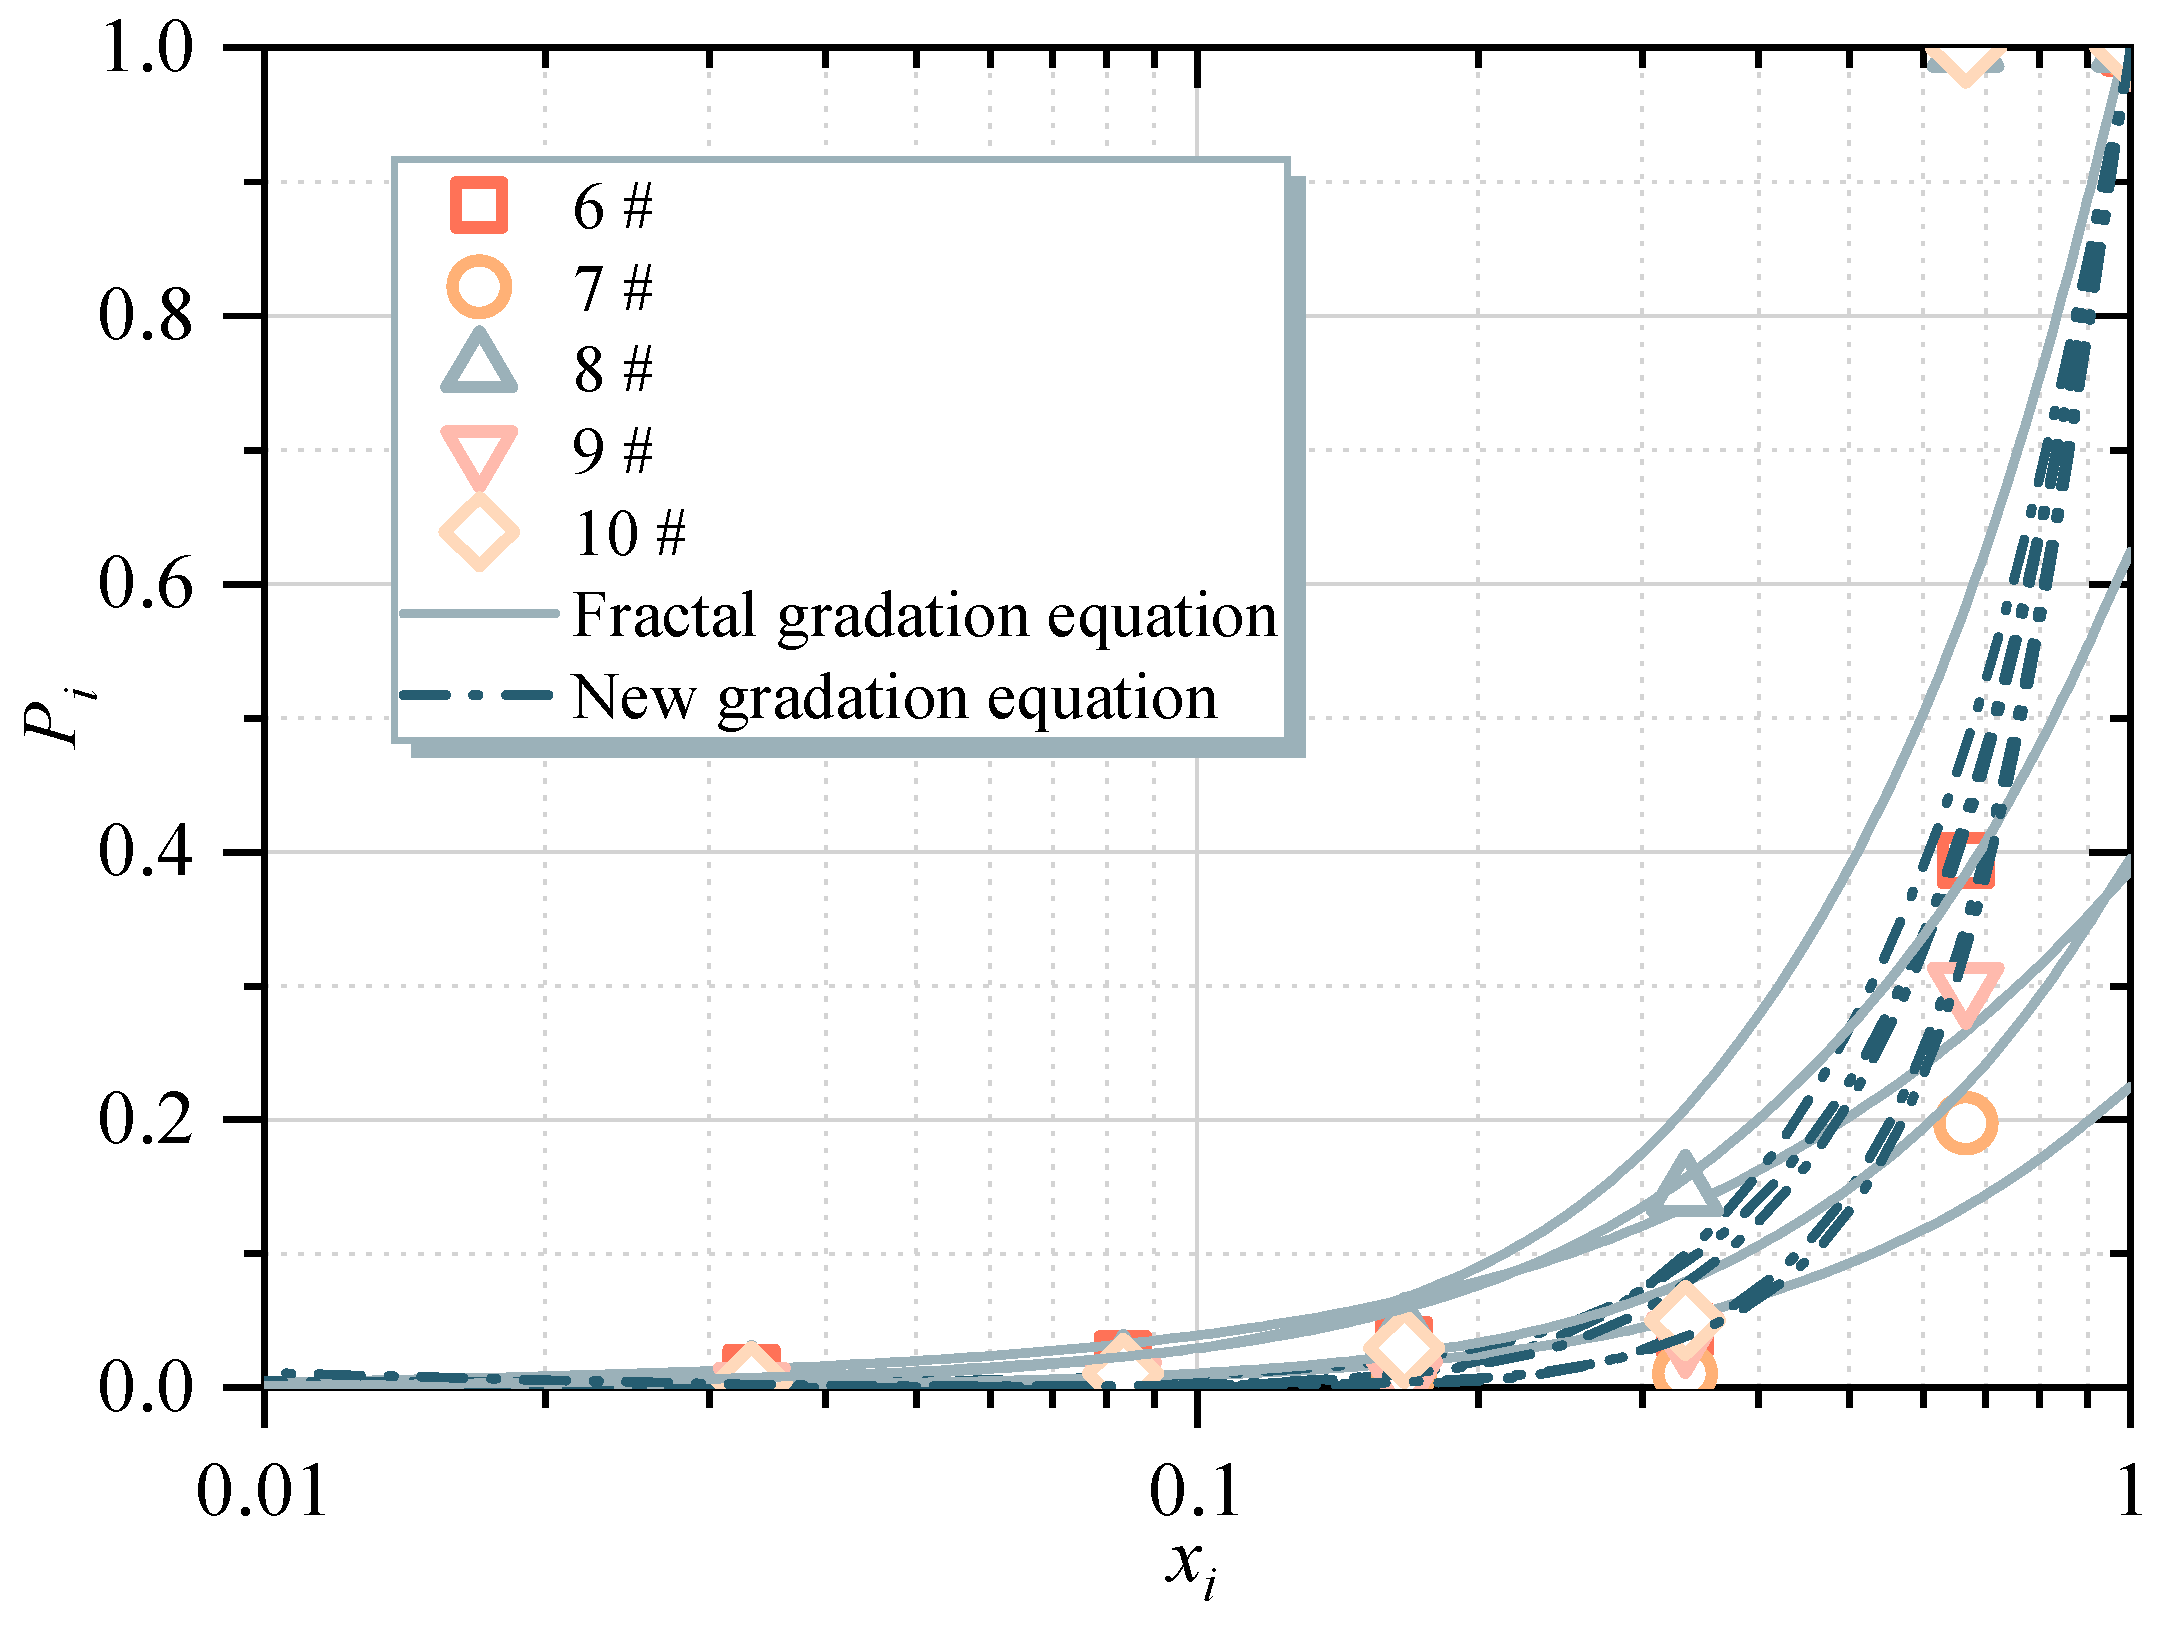
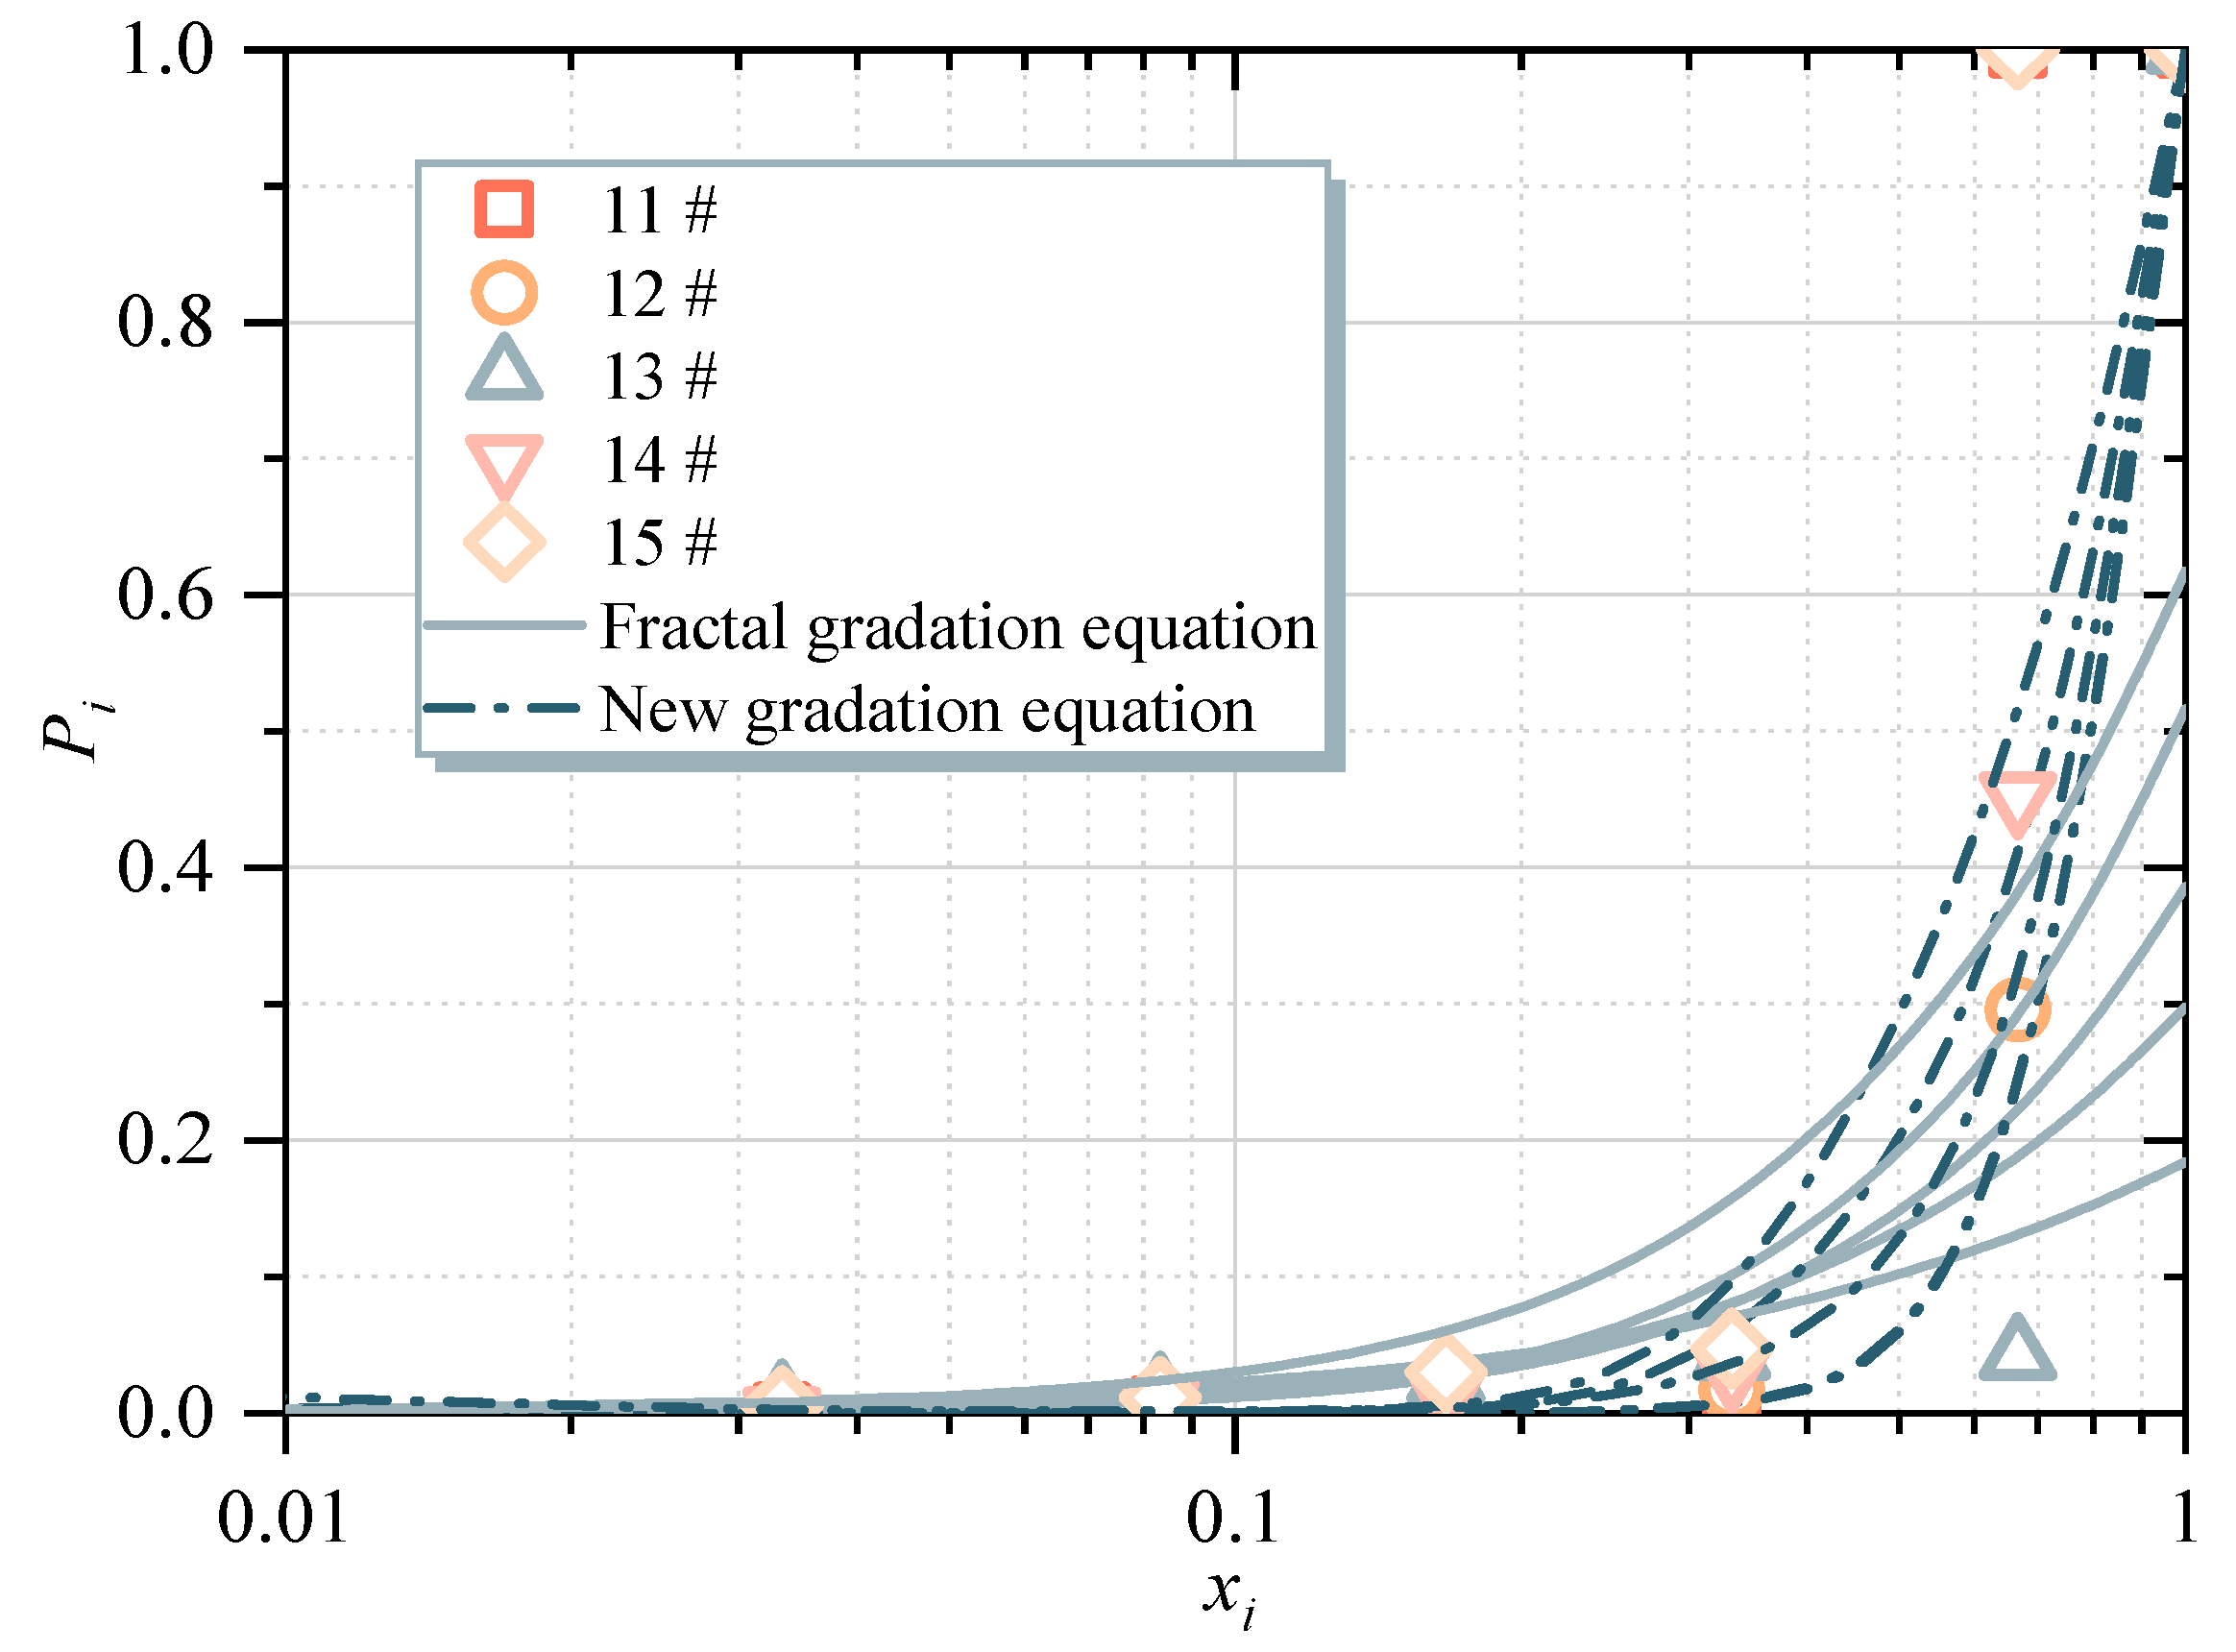
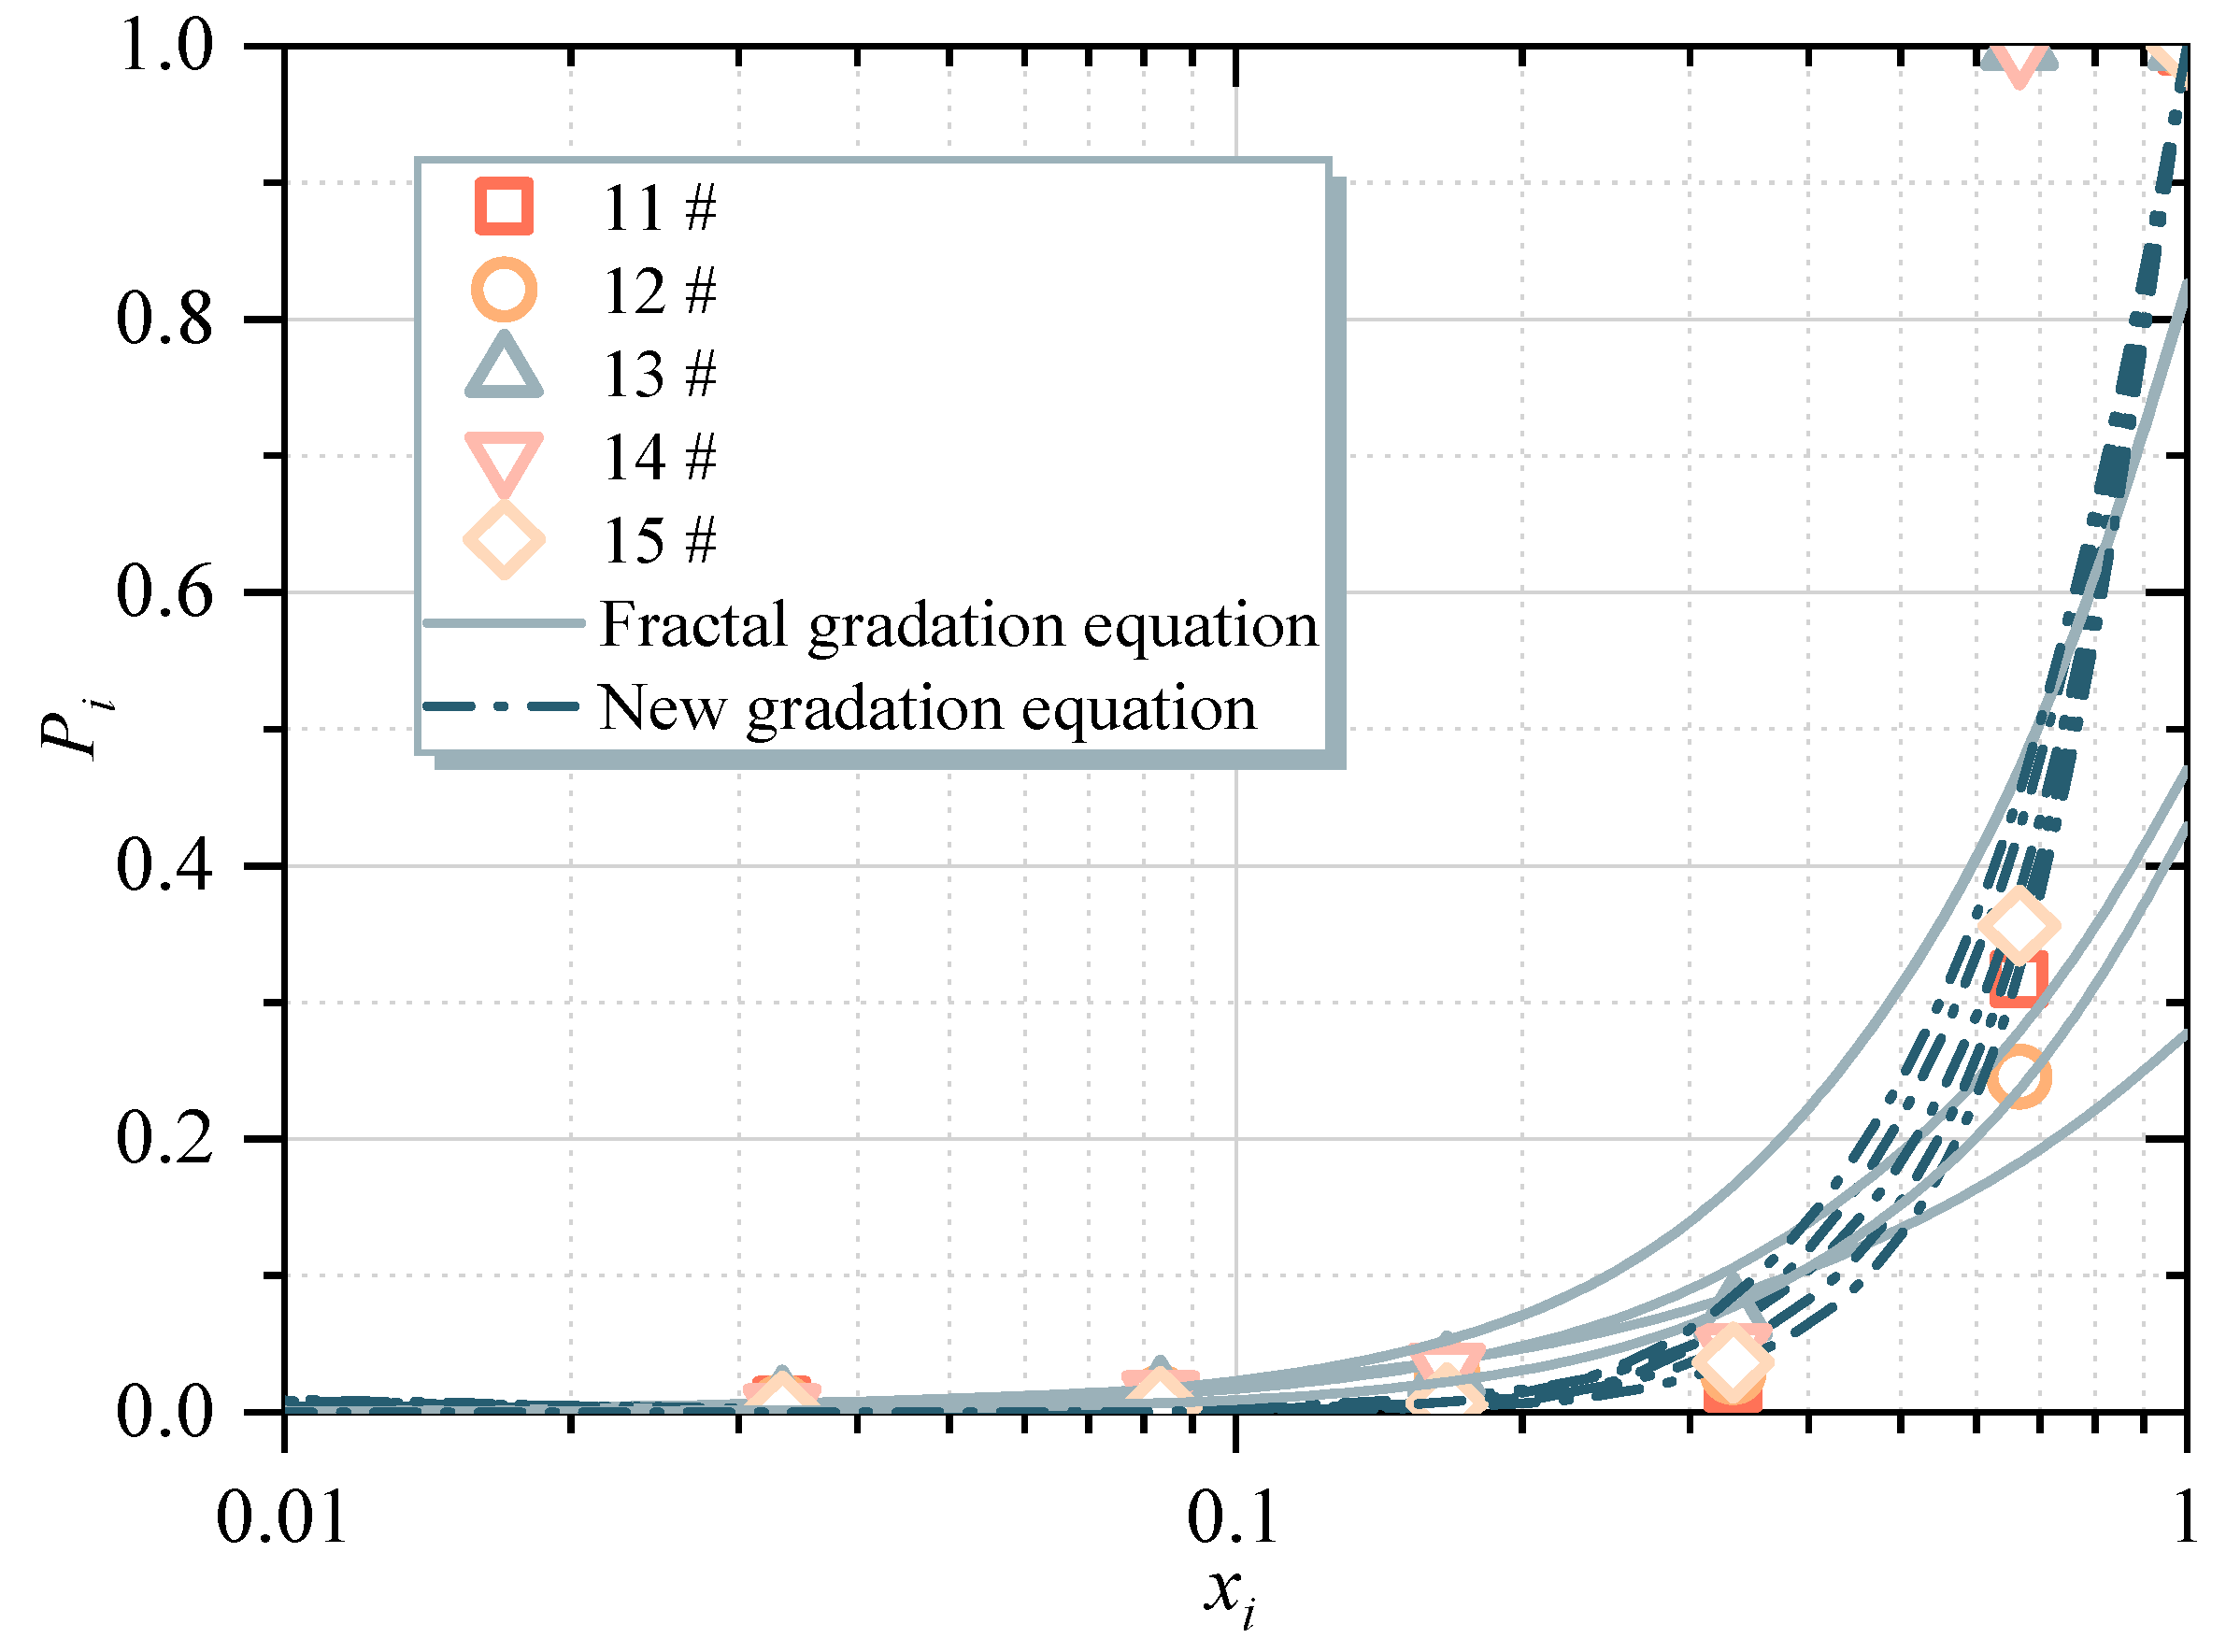
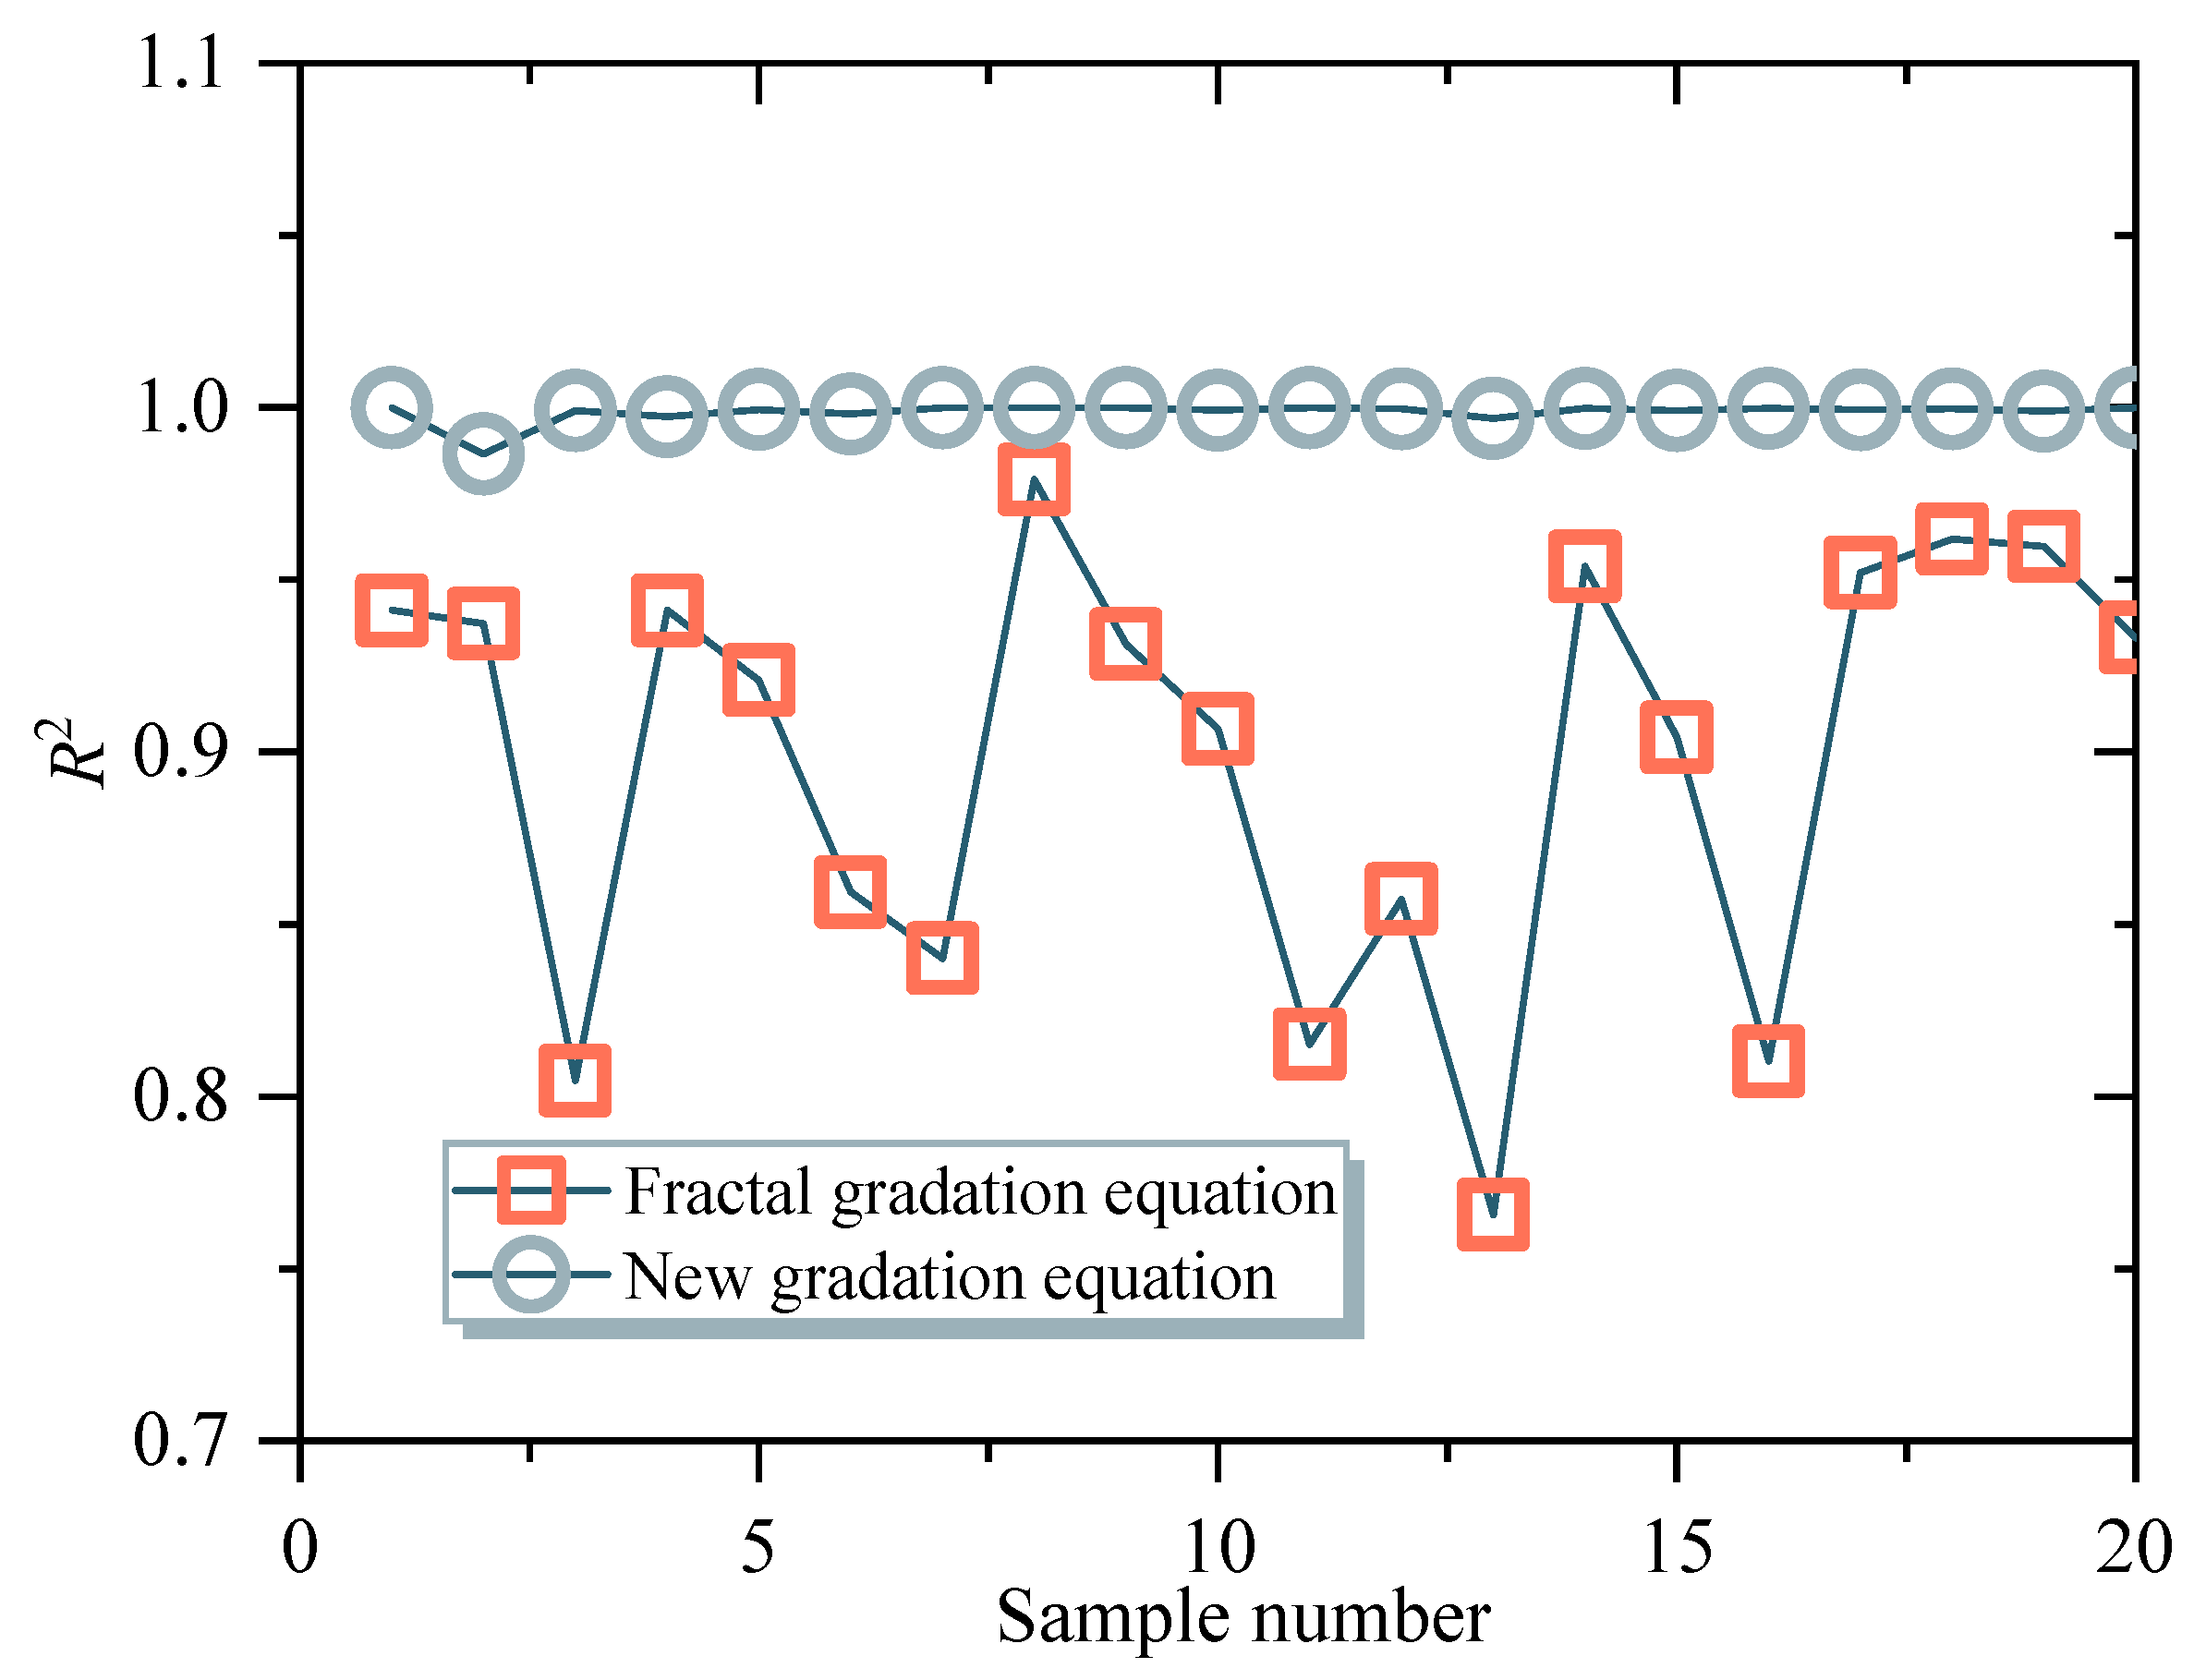
A comparison between the experimental data and the fractal gradation equation and new gradation equation is shown in Figure 12, Figure 13, Figure 14 and Figure 15. A comparison of the R2 value between the two models is displayed in Figure 16. It can be seen from Table 2 and Table 3, and Figure 12, Figure 13, Figure 14, Figure 15 and Figure 16 that the correctness of Equation (18) has been verified, and the improved model can better describe the gradation of coal gangue fragments after crushing. Based on this result, the application and accuracy of the traditional fractal gradation equation can be expanded in future research.
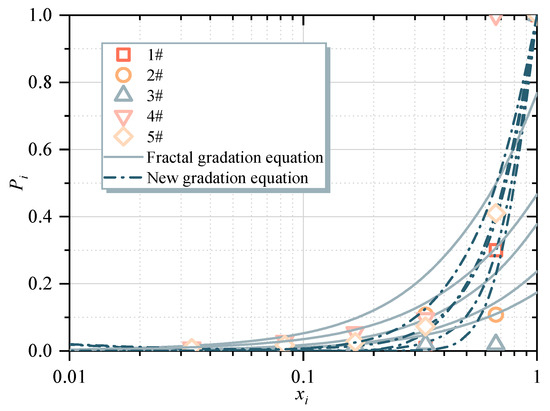
Figure 12.
Comparison between experimental data and models (1#–5#).
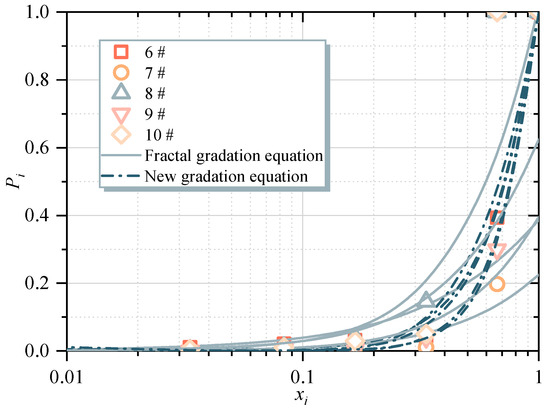
Figure 13.
Comparison between experimental data and models (6#–10#).
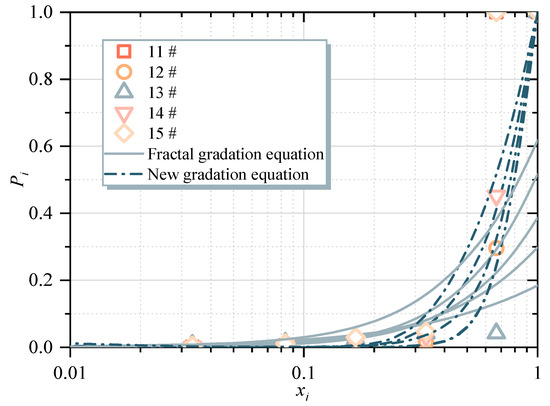
Figure 14.
Comparison between experimental data and models (11#–15#).
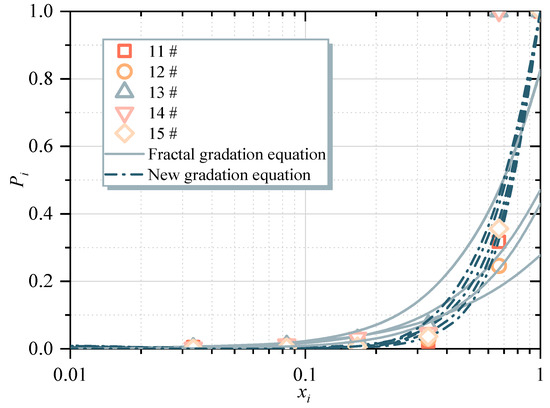
Figure 15.
Comparison between experimental data and models (16#–20#).

Figure 16.
Comparison of R2 between two models.
5. Conclusions
In this paper, for coal gangue coarse-grained subgrade fillers, particle crushing tests were carried out, and the relationships between load and displacement, crushing strength, failure pattern, and gradation after crushing were analyzed. The conclusions are as follows:
- (1)
- With the increase in displacement, the relationship curves between load and displacement for CGSF particle crushing can be divided into three types. ① The sharp corners of the particles come into contact with two loading surfaces. During the compression process, each sharp corner is gradually crushed, causing the curve to fluctuate and grow, and multiple extreme values appear. ② The sharp corners where the particles come into contact with the loading surface break and fall off, causing the load to suddenly change to zero. A curve, similar to the first type, with some troughs reaching zero appears. ③ The curve shows approximately linear growth, and failure occurs at small displacements, exhibiting the characteristics of brittle rock failure.
- (2)
- The distribution of particle crushing strength is between 3.02 and 11.11 MPa, and the dispersion of particle strength is relatively large. However, the crushing probability of coal gangue particles and the applied load well satisfy the Weibull distribution function.
- (3)
- A new visual analysis method for the crushing patterns of particles is provided through image analysis. After crushing coal gangue particles, the larger particles mainly present a block shape, the smaller particles are mainly in the form of powder, and the middle-sized particles are mainly flaky and acicular. Particles with a size greater than 5 mm are mainly flaky; acicular particles are the least common.
- (4)
- The particle size distribution of coal gangue fragments after crushing was analyzed, and a new gradation equation based on the traditional fractal model was proposed to describe the crushed particles. Comparative analysis shows that the new model has better descriptive ability.
Future work: The next work of this study will explore the microscopic fabric of particle crushing for CGSF using the microscopy technique. Then, based on the microscopic fabric characteristics, numerical simulations (finite element method or discrete element method) will be conducted.
Author Contributions
Z.-T.Z., S.-K.L. and W.-H.G. conceived the study. Z.-T.Z., Z.L. and Y.-X.X. prepared and analyzed the data. Z.-T.Z., L.-W.Y. and J.-B.L. prepared the figures. Z.-T.Z., Y.-X.X., L.-W.Y. and S.-K.L. contributed to the discussions. Y.-X.X., S.-K.L., Z.L. and W.-H.G. revised the manuscript. All authors have read and agreed to the published version of the manuscript.
Funding
The work is supported by the National Natural Science Foundation of China (Grant No. 52208341), the Natural Science Foundation of Hunan Province (Grant No. 2023JJ40293, 2022JJ30257), Xiaohe Sci-Tech Talents Special Funding under Hunan Provincial Sci-Tech Talents Sponsorship Program (Grant No. 2023TJ-X74), the Scientific Research Projects of Hunan Provincial Department of Education (Grant No. 23B0492, 23A0368).
Institutional Review Board Statement
Not applicable.
Informed Consent Statement
Not applicable.
Data Availability Statement
The datasets used and analyzed during the current study are available from the corresponding author upon reasonable request.
Conflicts of Interest
Author Li-Wei Yi was employed by the China Construction Fifth Engineering Division Co., Ltd. The remaining authors declare that the research was conducted in the absence of any commercial or financial relationships that could be construed as a potential conflict of interest.
References
- Chen, L.; Li, J.; Zhang, D.; Fan, G.; Zhang, W.; Guo, Y. Microscopic fabric evolution and macroscopic deformation response of gangue solid waste filler considering block shape under different confining pressures. Sci. Rep. 2022, 12, 7388. [Google Scholar] [CrossRef] [PubMed]
- Li, B.; Yan, H.; Zhang, J.; Zhou, N. Compaction property prediction of mixed gangue backfill materials using hybrid intelligence models: A new approach. Constr. Build. Mater. 2020, 247, 118633. [Google Scholar] [CrossRef]
- Tang, X.; Wan, W.; Zhang, Z.; Gao, W.; Wang, Y. Residual deformation of coal gangue subgrade filler under multi-vibration cyclic loading. Sci. Rep. 2023, 13, 8203. [Google Scholar] [CrossRef] [PubMed]
- Zhang, J.; Liu, H.; Wang, J.; Lei, M.; Chen, Z. Stress–strain characteristics of FRP–PVC confined spontaneous combustion gangue concrete columns. Sci. Rep. 2024, 14, 1482. [Google Scholar] [CrossRef] [PubMed]
- Li, L.; Long, G.; Ma, K.; Ma, H.; Wang, W.; Zhang, C.; Xie, Y. Preparation of Green Low Strength Mixture for Foundation Reinforcement Treatment by Using Fly Ash and Waste Coal Gangue. Materials 2020, 13, 664. [Google Scholar] [CrossRef]
- Long, G.; Li, L.; Li, W.; Ma, K.; Dong, W.; Bai, C.; Zhou, J.L. Enhanced mechanical properties and durability of coal gangue reinforced cement-soil mixture for foundation treatments. J. Clean. Prod. 2019, 231, 468–482. [Google Scholar] [CrossRef]
- Li, J.; Wang, J. Comprehensive utilization and environmental risks of coal gangue: A review. J. Clean. Prod. 2019, 239, 117946. [Google Scholar] [CrossRef]
- Wang, J.; Qin, Q.; Hu, S.; Wu, K. A concrete material with waste coal gangue and fly ash used for farmland drainage in high groundwater level areas. J. Clean. Prod. 2016, 112, 631–638. [Google Scholar] [CrossRef]
- Ma, S.; Lu, P.; Li, C.; Guo, Z.; Nie, X. Effect of Soil Amendments on Growth of Soybean in Coal Gangue Contaminated Soil. Ecol. Rural Environ. 2011, 27, 101–103. [Google Scholar]
- Zhang, X.; Lin, J.; Liu, J.; Li, F.; Pang, Z. Investigation of Hydraulic-Mechanical Properties of Paste Backfill Containing Coal Gangue-Fly Ash and Its Application in an Underground Coal Mine. Energies 2017, 10, 1309. [Google Scholar] [CrossRef]
- Li, M.; Li, A.; Zhang, J.; Huang, Y.; Li, J. Effects of particle sizes on compressive deformation and particle breakage of gangue used for coal mine goaf backfill. Powder Technol. 2020, 360, 493–502. [Google Scholar] [CrossRef]
- Li, L.H.; Long, G.C.; Bai, C.N.; Ma, K.L.; Wang, M.; Zhang, S. Utilization of Coal Gangue Aggregate for Railway Roadbed Construction in Practice. Sustainability 2020, 12, 4583. [Google Scholar] [CrossRef]
- Liu, B.K.; Fan, J.S.; Hu, H.M.; Fu, L.H. Recycled Technology of Urban Road Construction Waste and Miscellaneous Fill Used as Subgrade Fillings. In Proceedings of 1st International Conference on Civil Engineering, Architecture and Building Materials (CEABM 2011), Haikou, China, 18–20 June 2011; pp. 3460–3464. [Google Scholar]
- Wang, H.Y.; She, H.; Xu, J.; Liang, L.H. A Three-Point Hyperbolic Combination Model for the Settlement Prediction of Subgrade Filled with Construction and Demolition Waste. Materials 2020, 13, 1959. [Google Scholar] [CrossRef] [PubMed]
- Zhang, Z.T.; Wang, Y.H.; Gao, W.H.; Hu, W.; Liu, S.K. Permanent Deformation and Its Unified Model of Coal Gangue Subgrade Filler under Traffic Cyclic Loading. Appl. Sci. 2023, 13, 4128. [Google Scholar] [CrossRef]
- Jiao, S.J.; Wang, S.; Luo, F.Z. Effects of Coastal Coal Gangue Highway on Groundwater. In Proceedings of 2nd Global Conference on Civil, Structural and Environmental Engineering (GCCSEE 2013), Shenzhen, China, 28–29 September 2013; pp. 2518–2521. [Google Scholar]
- Song, G.Y.; Hui, B.; Cui, Y.J.; Ran, D.Q.; Li, Y.P.; Zhang, W.J.; Song, H.M.; Fan, X.X.; Meng, L.X. Analysis of pH and Conductivity Variation Characteristics of Coal Gangue Used inFreeway Subgrade and Its Correlation. In Proceedings of Asia Conference on Geological Research and Environmental Technology (GRET), Electrical Network, Kamakura City, Japan, 10–11 October 2020. [Google Scholar]
- Koohmishi, M.; Palassi, M. Evaluation of the Strength of Railway Ballast Using Point Load Test for Various Size Fractions and Particle Shapes. Rock Mech. Rock Eng. 2016, 49, 2655–2664. [Google Scholar] [CrossRef]
- Wang, B.; Martin, U.; Rapp, S. Discrete element modeling of the single-particle crushing test for ballast stones. Comput. Geotech. 2017, 88, 61–73. [Google Scholar] [CrossRef]
- Cavarretta, I.; O’Sullivan, C. The mechanics of rigid irregular particles subject to uniaxial compression. Géotechnique 2012, 62, 681–692. [Google Scholar] [CrossRef]
- Hiramatsu, Y.; Oka, Y. Determination of the tensile strength of rock by a compression test of an irregular test piece. Int. J. Rock Mech. Min. Sci. Geomech. Abstr. 1966, 3, 89–90. [Google Scholar] [CrossRef]
- Jaeger, J.C. Failure of rocks under tensile conditions. Int. J. Rock Mech. Min. Sci. Geomech. Abstr. 1967, 4, 219–227. [Google Scholar] [CrossRef]
- Nakata, Y.; Hyodo, M.; Hyde, A.F.L.; Kato, Y.; Murata, H. Microscopic particle crushing of sand subjected to high pressure one-dimensional compression. Soils Found 2001, 41, 69–82. [Google Scholar] [CrossRef]
- Nakata, Y.; Kato, Y.; Hyodo, M.; Hyde, A.F.L.; Murata, H. One-dimensional compression behaviour of uniformly graded sand related to single particle crushing strength. Soils Found 2001, 41, 39–51. [Google Scholar] [CrossRef] [PubMed]
- Wang, W.; Coop, M.R. An investigation of breakage behaviour of single sand particles using a high-speed microscope camera. Géotechnique 2016, 66, 984–998. [Google Scholar] [CrossRef]
- Zhou, B.; Wei, D.; Ku, Q.; Wang, J.; Zhang, A. Study on the effect of particle morphology on single particle breakage using a combined finite-discrete element method. Comput. Geotech. 2020, 122, 103532. [Google Scholar] [CrossRef]
- Weibull, W. A statistical distribution function of wide applicability. J. Appl. Mech. 1951, 18, 293–297. [Google Scholar] [CrossRef]
- Sullivan, J.D.; Lauzon, P.H. Experimental probability estimators for Weibull plots. J. Mater. Sci. Lett. 1986, 5, 1245–1247. [Google Scholar] [CrossRef]
- Davidge, R.W. Mechanical Behavior of Ceramics; Cambridge University Press: Cambridge, UK, 1979. [Google Scholar]
- Al-Saoudi, N.K.S.; Hassan, K.H. Evaluation of Indirect Tensile Strength of Track Ballast Using Weibull Statistics. Geotech. Geol. Eng. 2012, 30, 1097–1102. [Google Scholar] [CrossRef]
- Zhao, J.; Lu, C.; Deng, L.; Liu, G. Impacts of simulated acid solution on the disintegration and cation release of purple rock (mudstone) in Southwest China. Geomorphology 2018, 316, 35–43. [Google Scholar] [CrossRef]
- Zhang, Z.T.; Gao, W.H.; Zeng, C.F.; Tang, X.Y.; Wu, J. Evolution of the disintegration breakage of red-bed soft rock using a logistic regression model. Transp. Geotech. 2020, 24, 100382. [Google Scholar] [CrossRef]
- Zhang, Z.T.; Gao, W.H. Effect of different test methods on the disintegration behaviour of soft rock and the evolution model of disintegration breakage under cyclic wetting and drying. Eng. Geol. 2020, 279, 105888. [Google Scholar] [CrossRef]


Disclaimer/Publisher’s Note: The statements, opinions and data contained in all publications are solely those of the individual author(s) and contributor(s) and not of MDPI and/or the editor(s). MDPI and/or the editor(s) disclaim responsibility for any injury to people or property resulting from any ideas, methods, instructions or products referred to in the content. |
© 2024 by the authors. Licensee MDPI, Basel, Switzerland. This article is an open access article distributed under the terms and conditions of the Creative Commons Attribution (CC BY) license (https://creativecommons.org/licenses/by/4.0/).