Abstract
This article outlines the design and performance of a flue gas condensation system integrated with a biomass combustion plant. The system comprises a biomass plant fuelled by wood chips, generating flue gases. These gases are condensed via a double heat exchanger set-up, extracting water and heat to reduce concentrations of CO, CO2, and NOx while releasing gases at a temperature close to ambient temperature. The 100 kW biomass plant operates steadily, consuming 50 kg of wood chips per hour with fuel energy of 18.98 MJ/kg. Post combustion, the gases exit at 430 °C and undergo two-stage cooling. In the first stage, gases are cooled in a high-temperature tube heat exchanger, transferring heat to air. They then enter the second stage, a flue gas/water heat exchanger, recovering sensible and latent thermal energy, which leads to water condensation. Flue gas is discharged at approximately 33 °C. Throughout, parameters like the flue gas temperatures, mass flow, fuel consumption, heat carrier temperatures, and water condensation rates were monitored. The test results show that the system can condense water from flue gas at 75 g/min at 22 °C while reducing pollutant emissions by approximately 20% for CO2, 19% for CO, 30% for NO, and 26% for NOx.
1. Introduction
Implementing alternative energy sources with a high level of sustainability has been adopted as a path for the energy transition in the EU [1,2]. In this circumstance, the energy obtained through biomass gained prominence, with its great potential as a programmable and sustainable resource for energy production. Furthermore, biomass is referred to as a carbon-neutral fuel since there is no net input of carbon dioxide to the environment. Biomasses are divided into two main categories or fractions: the lignocellulosic fraction and seeds fraction [1]. Lignocellulosic material can be used directly or indirectly to produce different energy sources, such as chemicals, biofuels, biomaterials, heating, cooling, and electricity [3,4].
Combustion is the most used technology due to its simple implementation. Solid biomass can be burned in ovens or boilers. This process produces heat, which can be used directly in thermal systems [3,4].
However, the combustion of lignocellulosic biomass fuel as chips or pellets produces a variety of chemical species, including CO2, CO, NOx, volatile organic compounds, polycyclic aromatic hydrocarbons, and particulates which, in high concentrations, may cause problems for human health [5,6]. Strategies for biomass combustion have been investigated to address the problem of pollutant emissions. These strategies are oriented towards the primary measures, such as optimising the combustion process or fuel improvement (air supply design, pre-heating primary combustion air, household behaviour, and the use of alkali compounds).
The secondary measures are focused on flue gas cleaning technologies (electrostatic precipitators, condensing scrubbers, catalytic converters, bag filters, and cyclone separators) [7,8]. To address the problem of the high PM emissions linked to biomass-based energy plants, a prototype of an innovative system was proposed to reduce the pollutant emissions and temperature of flue gases.
To address the problem of the high PM emissions linked to biomass-based energy plants, a prototype of an innovative system was proposed to reduce the pollutant emissions and temperature of flue gases.
Emission limits for particulate matter (PM) from biomass thermal power plants can vary depending on factors such as local regulations, the size of the facility, and the type of biomass being used. However, here are some general examples of emission limits for PM in various regions.
In the European Union, emission limits for particulate matter from biomass combustion are regulated under the Industrial Emissions Directive (IED) and the Medium Combustion Plant Directive (MCPD). The emission limit values for PM for medium combustion plants (e.g., biomass boilers) vary depending on the rated thermal input and the type of combustion technology used but typically range from 5 to 30 milligrams per normal cubic meter (mg/Nm3) of flue gas.
In Italy, emission limits for particulate matter (PM) from biomass thermal power plants are regulated by the national environmental agency (the Ministry for Ecological Transition) and are in accordance with European Union directives. Italy’s emission limits for PM from biomass combustion are typically specified in milligrams per normal cubic meter (mg/Nm3) of flue gas. These limits can vary depending on the size and type of biomass boiler or combustion plant. As an example, the emission limit values for PM10 from medium combustion plants (such as biomass boilers) in Italy may be set from roughly 20 to 50 milligrams per normal cubic meter (mg/Nm3) of flue gas, in line with European Union standards and directives.
The proposed system is a prototype plant for condensing flue gases, which operates based on two heat exchangers. The first one (HE1) is for flue gases and air absorbing the sensible heat of the gases, and a second heat exchanger (HE2) absorbs the latent heat, condensing the water present in the flue gas and removing a certain amount of polluting substances, particularly PM, SOx, and NOx. Therefore, the objective of this research is to present the design and implementation of a retrofitting for lignocellulosic biomass-based combustion plants to control pollutant emissions through condensation of the flue gases.
2. Materials and Methods
2.1. Woodchips
The fuel material used in this study was woodchips produced from chestnut, oak, alder, pine, and acacia, as can be seen in Figure 1.
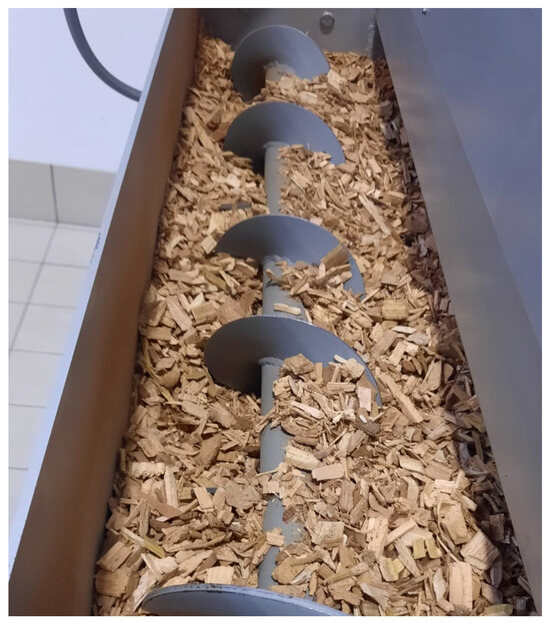
Figure 1.
Fuel material: woodchips.
The raw material was characterised in terms of humidity through a calorimeter (mod. LECO AC-350, Bomb calorimeter, Leco Corporation, St. Joseph, MI, USA) [9]; the ash content, fixed residue, and volatile solids were measured with a thermogravimetric analyser (LECO, mod. TGA 701, Leco Corporation, St. Joseph, MI, USA) [10]; the low heat value was examined with a calorimeter (LECO, mod. AC-350 Bomb calorimeter, Leco Corporation, St. Joseph, MI, USA) [9]; and carbon, hydrogen, and nitrogen were analysed with a CHN analyser (LECO, mod. TruSpec CHN Analyser, Leco Corporation, St. Joseph, MI, USA) [11].
2.2. Combustion System
The studied system consists of two separate plants: a biomass combustion plant and a flue gas condensation plant. The first plant, the combustion plant, comprises the stages of biomass storage, transport between machinery, combustion, heat exchange with the working fluid, expansion, and production of electrical energy in the turbine. The combustion plant is structured as seen in Figure 2.
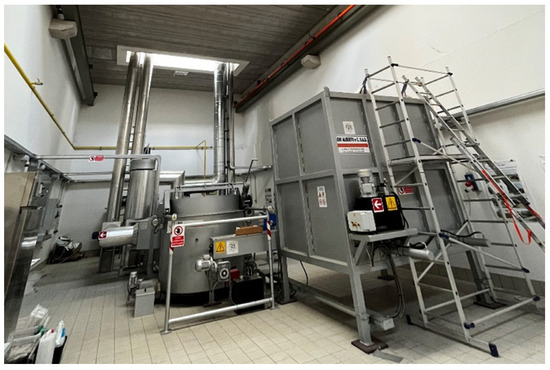
Figure 2.
Combustion plant.
The raw material arrives and is unloaded from the truck to the hopper (8 m3) by employing an overhead crane. The hopper is connected to the combustion chamber through a set of rakes and screw conveyors. At the bottom of the hopper, rakes move the chips by pushing them towards a feed chute, where the material is removed by employing a set of screw conveyors and moved towards the combustion chamber. The combustion chamber comprises a circular steel body filled with refractory cement, a diesel burner used in the start-up phase to set up the regime phase, and a set of fans that sustain the oxygen supply to maintain combustion under ideal conditions. At the bottom of the chamber, a set of rakes remove the ashes so they can be stored in a container and further used for fertilising agricultural fields. The flue gases from combustion leave the chamber and pass through the primary heat exchanger. This heat exchanger is made of INOX 430 and a highly efficient AISI 310 tubular beam with an efficiency of 90%. In this phase, the heat produced from biomass combustion is transferred to the heat transfer fluid (air), which is sent to the expansion in the turbine. Once the appropriate thermodynamic conditions are reached, the air is deflected to the turbine to be expanded. A high-speed, single-shaft Turbec T100 turbine (Turbec, Ansaldo Energia, Genova, Italy) is used. The turbine can produce 100 kW of electric power.
The high-frequency alternating current produced by the generator (500 VAC at 2333 Hz, corresponding to the motor shaft) is initially rectified into direct current and converted into a three-phase alternating current (400 VAC at 50 Hz) via a static converter. The exhaust gases produced by combustion, after passing through the heat exchanger, go through a cyclone that removes PM10 and the fly-ash particulate content, having an efficiency of 90–98% for particles above 10 μm.
2.3. Condensing System
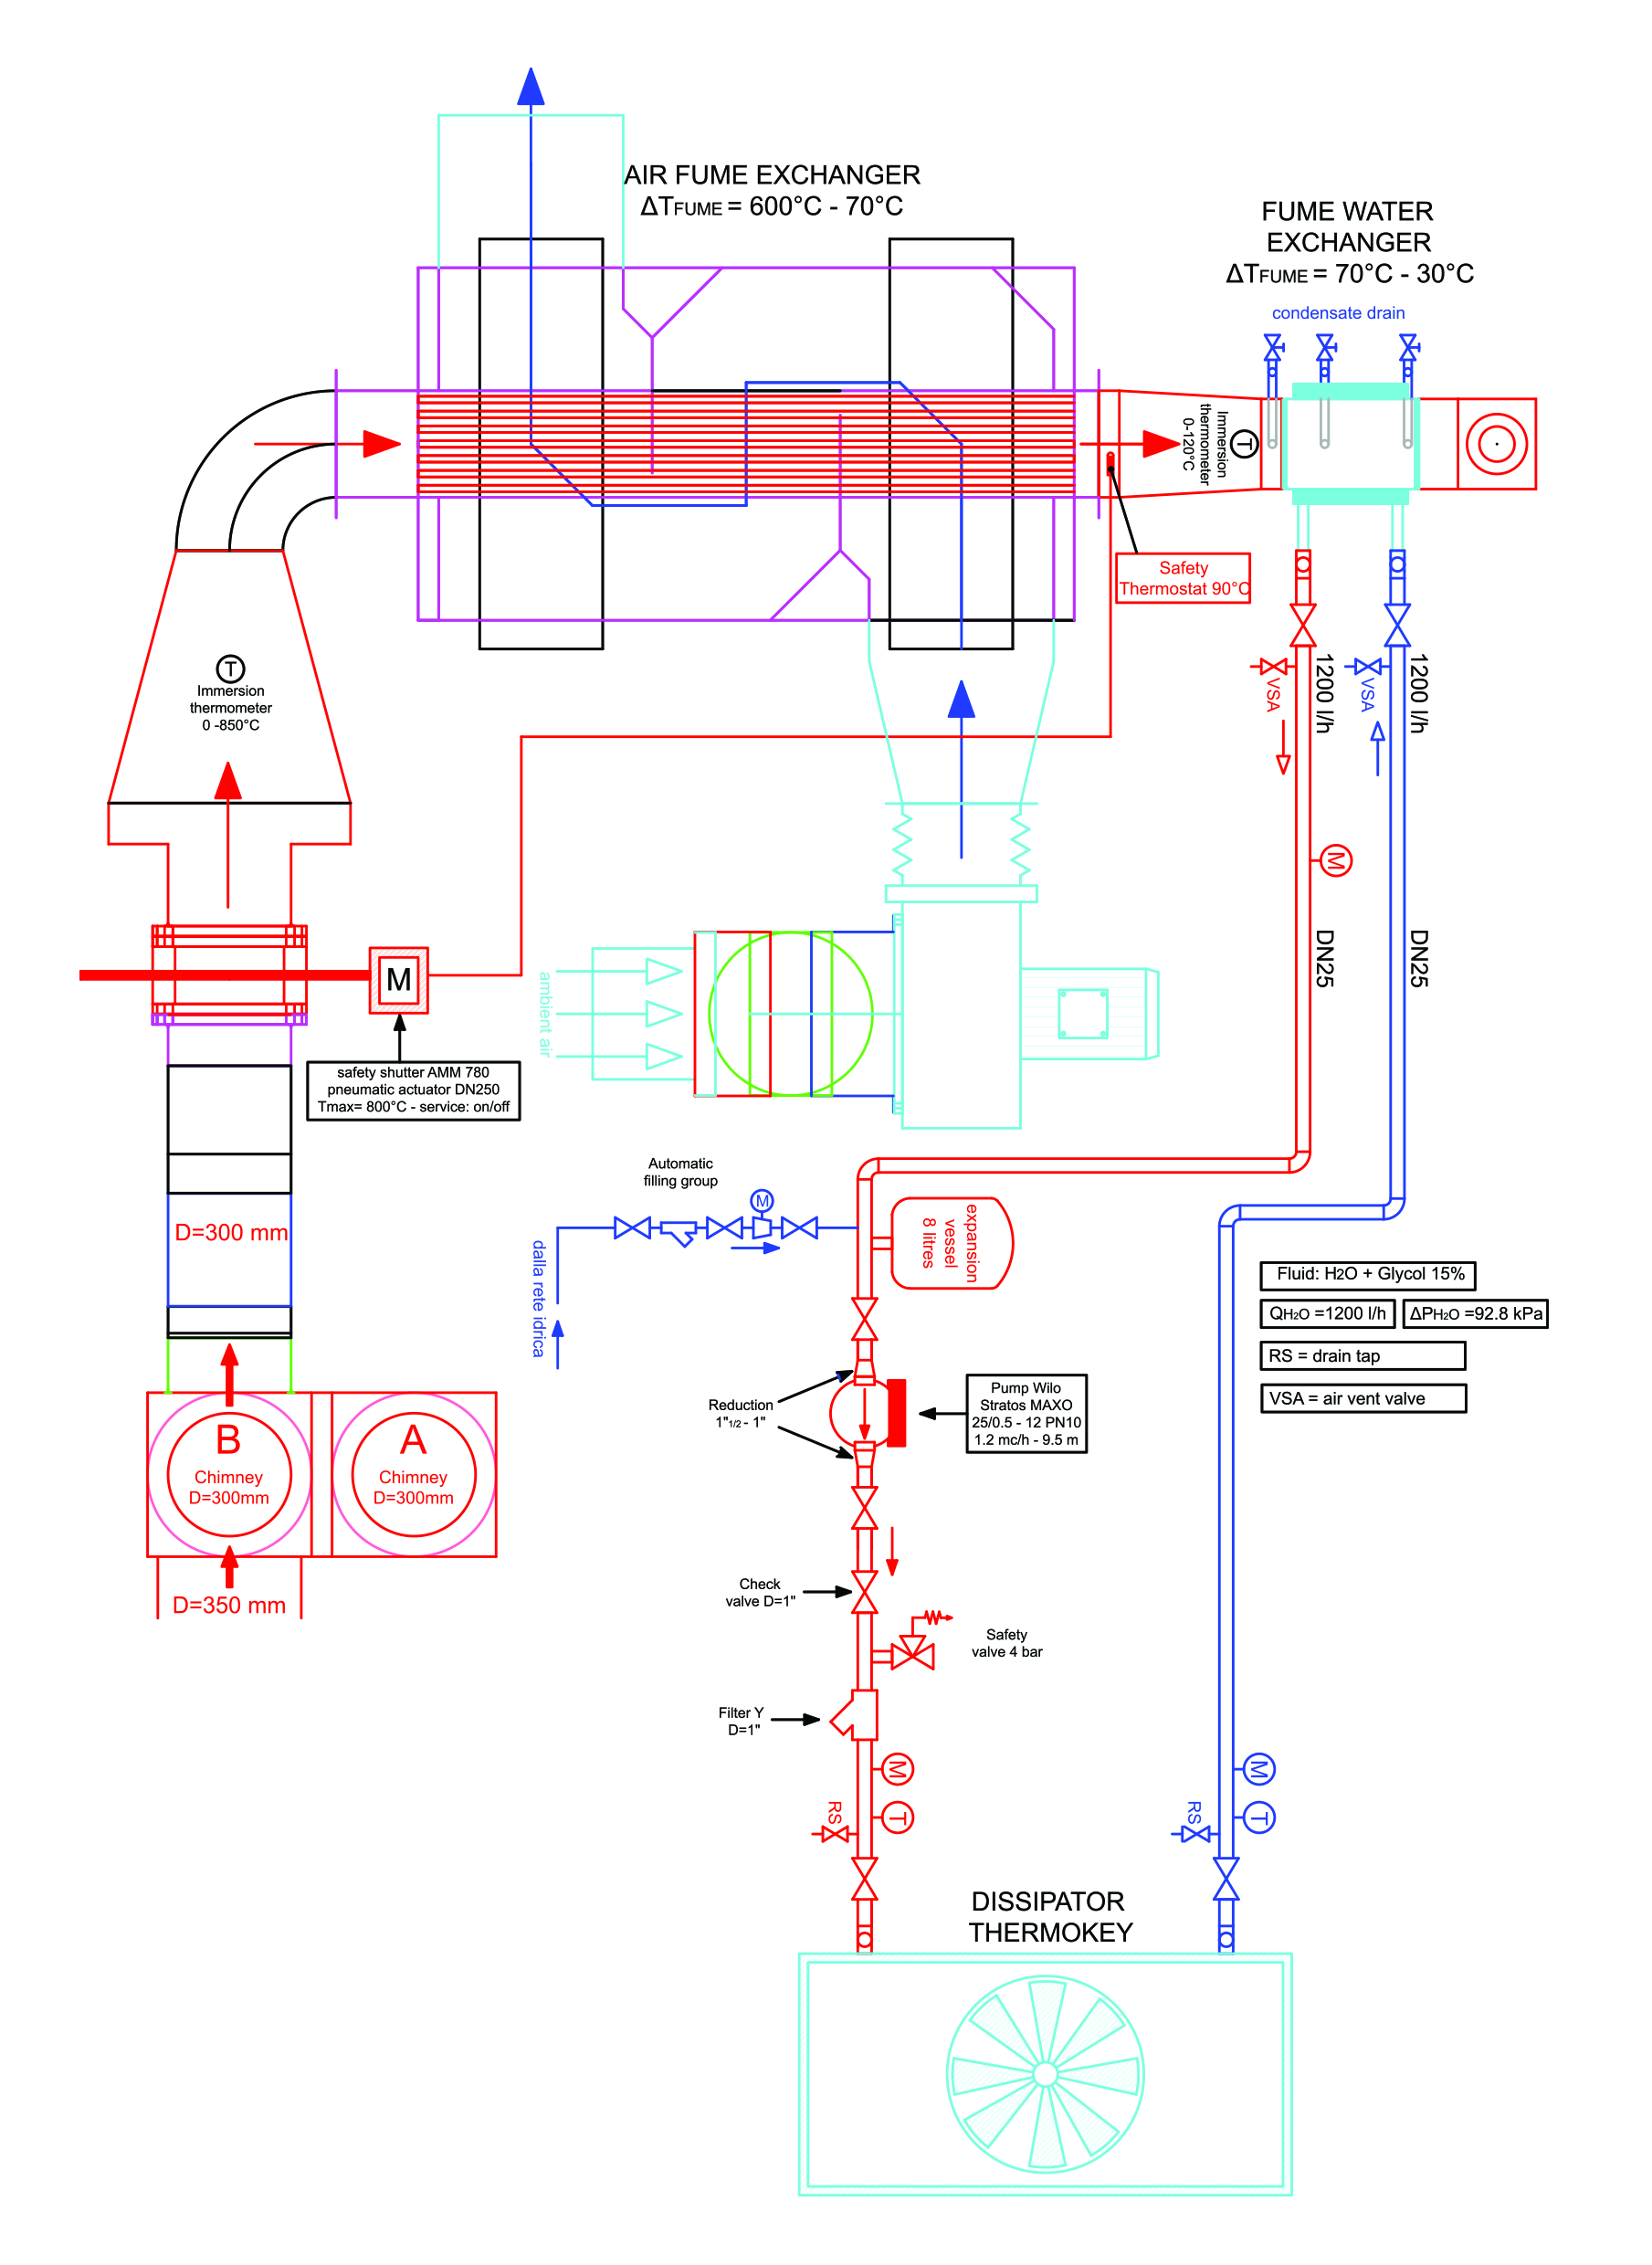
The condensing plant is a system for extracting water and heat from a biomass combustion plant’s flue gases. In practice, based on the operating data of the aforementioned heat generator (combustion plant), a bypass system has been designed which allows the withdrawal of a certain mass flow rate of flue gases. The combustion products, passing through two heat exchangers, cool down to a temperature close to that of the external environment. The design of the condensing plant is presented in Figure 3.
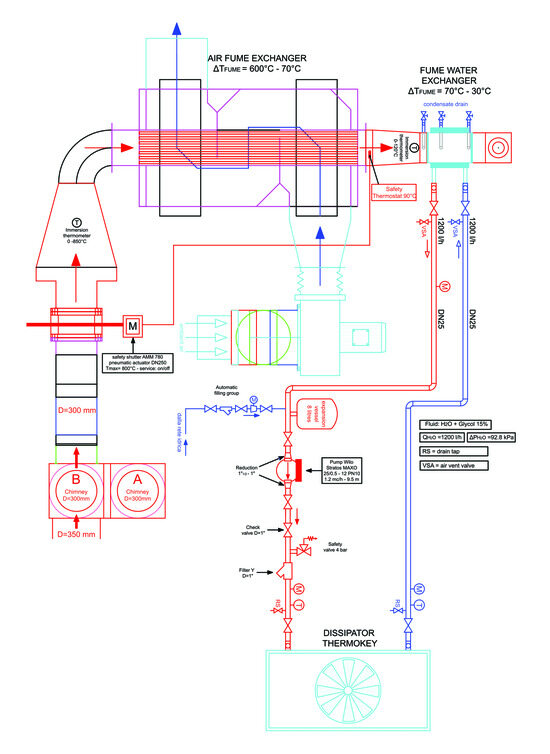
Figure 3.
Design of the condensing plant.
The condensing plant allows, on one hand, the recovery of thermal energy and, on the other, collection of the condensation water which is produced thanks to the achievement of final temperatures significantly lower than the dew point of the flue gases. Due to the high temperature of the combustion products leaving the combustion plant, the cooling process takes place in two successive steps. In the first stage, thanks to a tube heat exchanger (high temperature flue gas/air heat exchanger), the sensible heat is recovered, while in the next stage, in the second heat exchanger (low-temperature flue gas/water heat exchanger), sensible and latent thermal energy are recovered, producing condensing water.
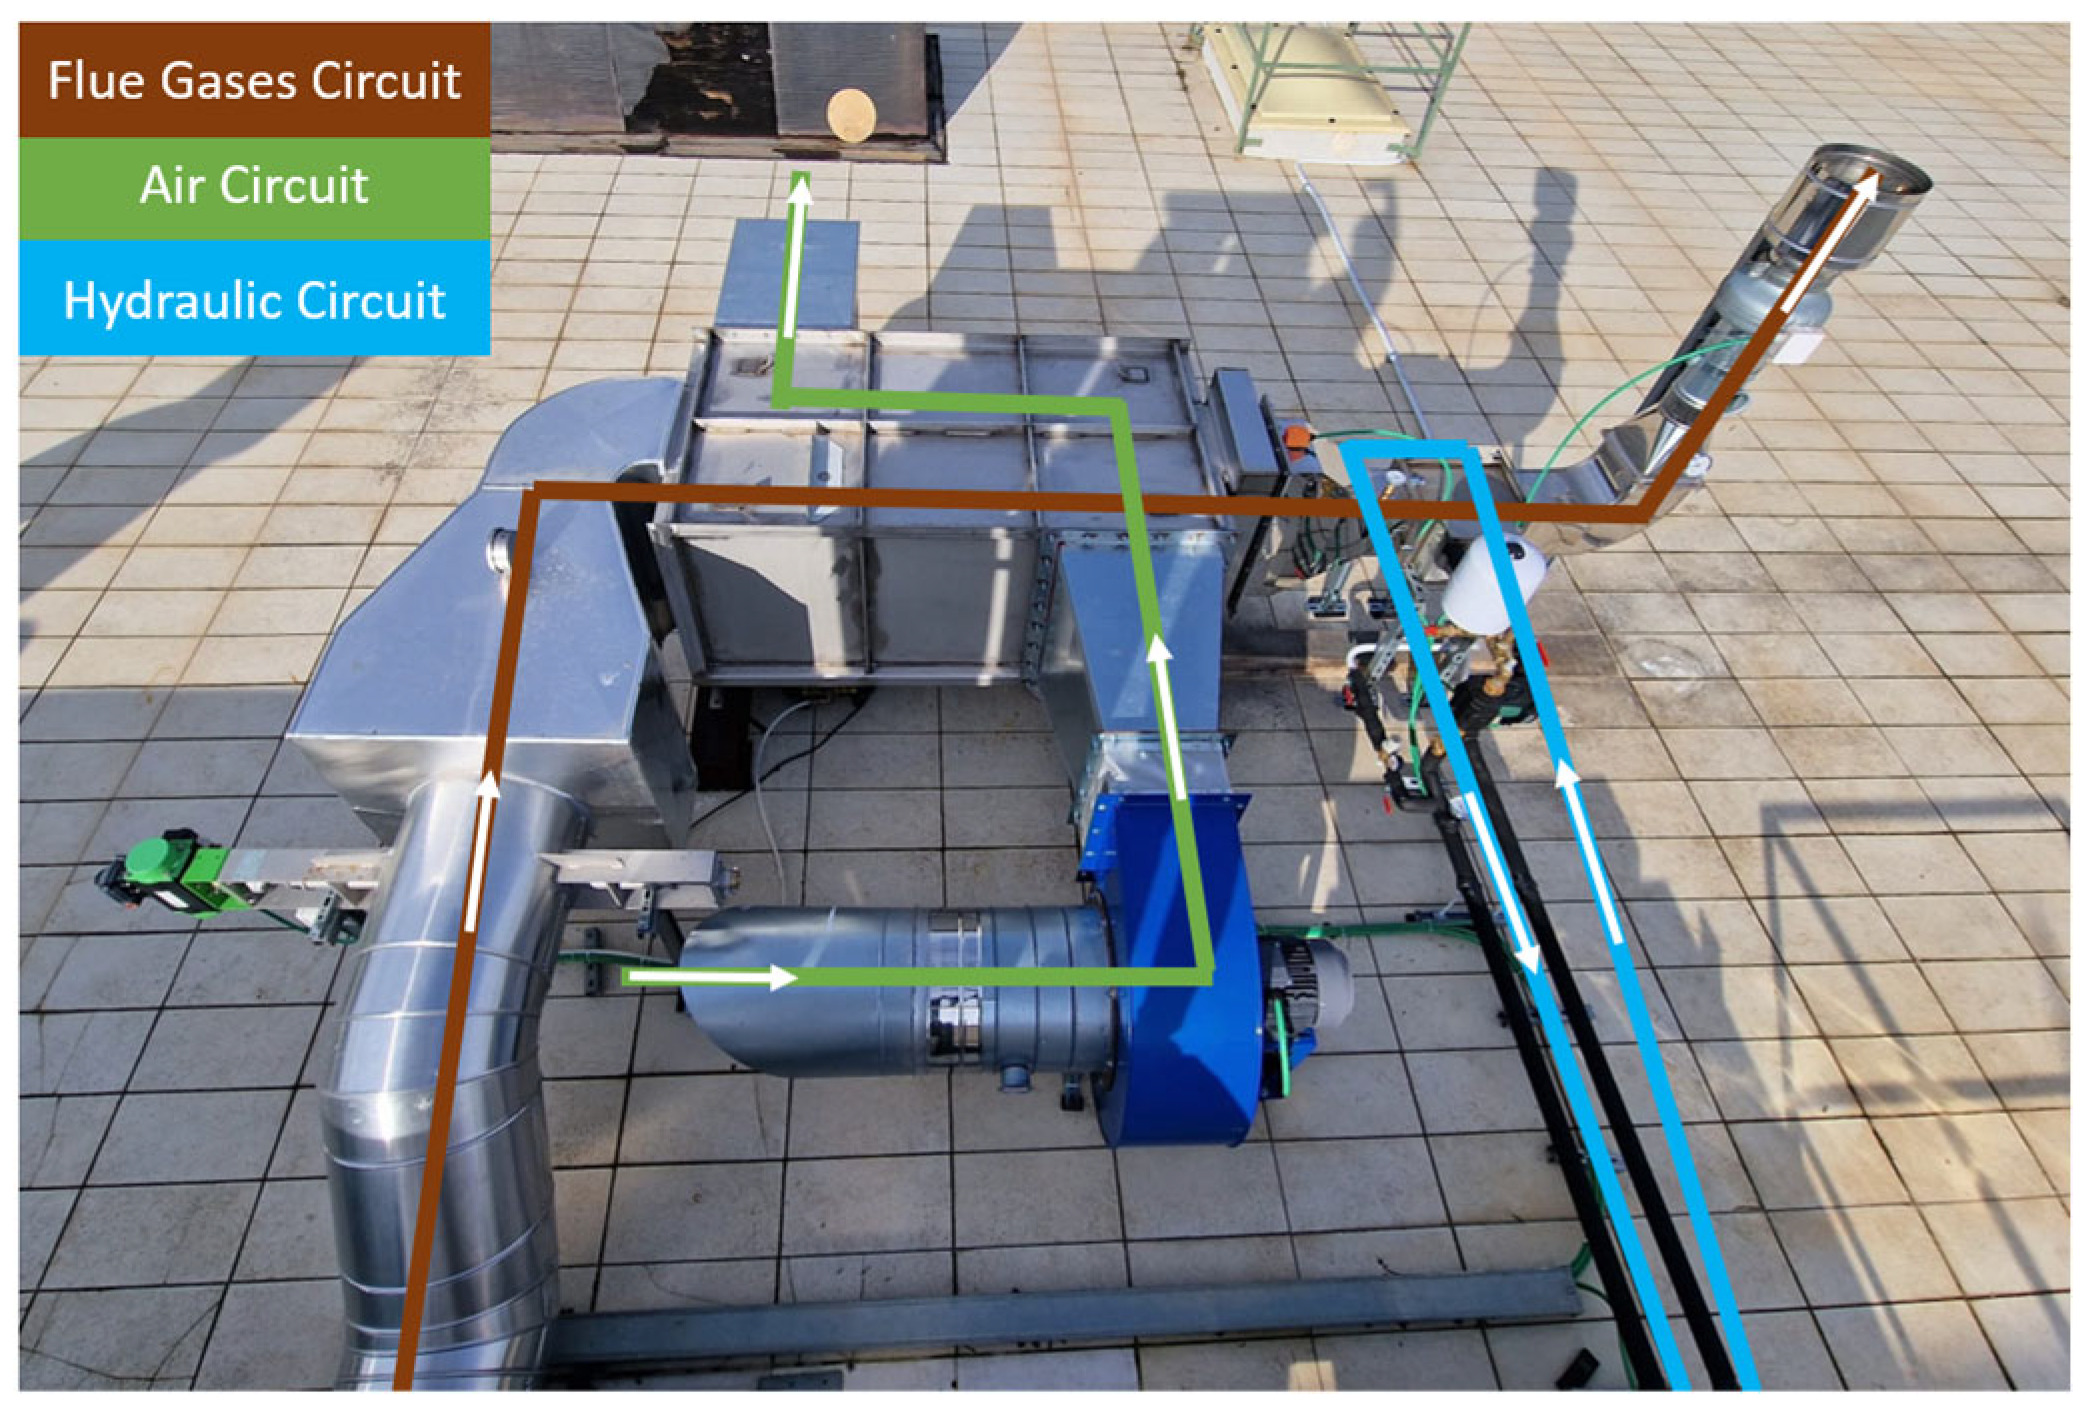
The plant is composed of three different circuits, which can be seen in Figure 4.
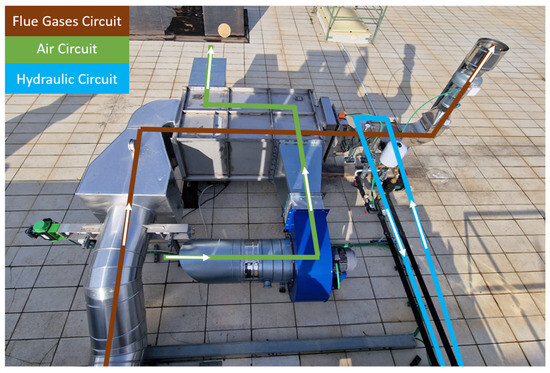
Figure 4.
Condensing plant circuits.
The flue gas circuit includes the ducts necessary to bypass flue gas to the heat exchangers.
The air circuit will include the fan and the ducts necessary to convey the fluid in the shell-side high-temperature flue/air exchanger.
The heat exchanger is a tube type in the countercurrent direction. The flow rate necessary to guarantee the first cooling step would be identified by acting on a manual adjustment damper and on the basis of the external climatic conditions. Since the circuit is open, the resulting hot air will be expelled into the atmosphere. For the project, it was foreseen that the flue gas entering the flue gas and air exchanger would enter the system at an average temperature of 600 °C with a flow rate of 500 m3/h, and the temperature at the outlet would be 70 °C.
As for the hydraulic circuit, the condenser’s inlet section coincides with the high-temperature exchanger’s outlet section. It will include the hydraulic components necessary to convey the cooling (water) in the low-temperature fume/water exchanger (condenser).
The hydraulic circuit is of a closed type and equipped with a circulation pump (Wilo, mod. Stratos MAXO 25/0.5-12, Umbra Control, Perugia, Italy), expansion tank, safety valve, Y-filter, check valve, shut-off valves, air vent devices, and taps of discharge. The heat removed from the fluid from the flue gases is dissipated into the environment via a single-fan dry-cooler unit (ThermoKey, mod. WH1163.B D/22 QRS, Umbra Control, Perugia, Italy) [12]. The water flow necessary to ensure the second cooling step would be managed automatically by an electronic circulator. The temperature of the flue gas entering the flue gas/water exchanger would be approximately 70 °C, leaving at a temperature of 30 °C.
2.4. Regime Operations
The system was tested in a steady state regime from 12 to 15 December 2022. Initially, the whole system was verified and cleaned up on the first day. Initially, all the electronic panels and engines were tested to verify the correct operation of the machinery. Following this, the combustion chamber and conveyors were cleaned. The combustion chamber (burner) was cleaned, removing any trace ashes from previous tests, eliminating the possible interference from these residues in the correct combustion of the fuel material, and avoiding emissions associated with the accumulation of ashes in the burner bed.
Then, the system was configured to operate at the optimal conditions. In this phase, the parameters necessary for steady state operation were configured.
The parameters for achieving the conditions were set and depended on the physio-chemical characteristics of the fuel material (calorific value, size, humidity, and hardness), on the temperature of the refractory cement, and on the temperature, speed, and humidity of the comburent.
Finally, the shutdown phase took place when it was believed that the work phase was finished. Its objective was to bring the temperature of the flue gas up to a temperature of 100 °C, after which the system would be left to cool by natural convection, leaving only the cyclone on so that the flue gases were permanently expelled.
2.5. Monitoring and Sampling
The sampling was carried out over three consecutive days to encompass a wider range of environmental climatic conditions. Parameter measurements were taken in triplicate for all runs, and the averages of these measurements for each analysed parameter were subsequently reported. The measurements were taken in the following steps. All temperatures of the combustion plant and the condensing system were monitored continuously in a loop. The measurements of the external temperature and humidity were conducted continuously using sensors placed around the plants. The flue gas analysis was performed concurrently with the other measurements.
2.5.1. Combustion Plant
The monitoring and sampling process was performed by conducting three valid runs with a duration of 30 min while operating in a steady state regime. All of the parameters were measured in triplicate. In each run, the conditions of the operation of the combustion and condensing plants were measured.
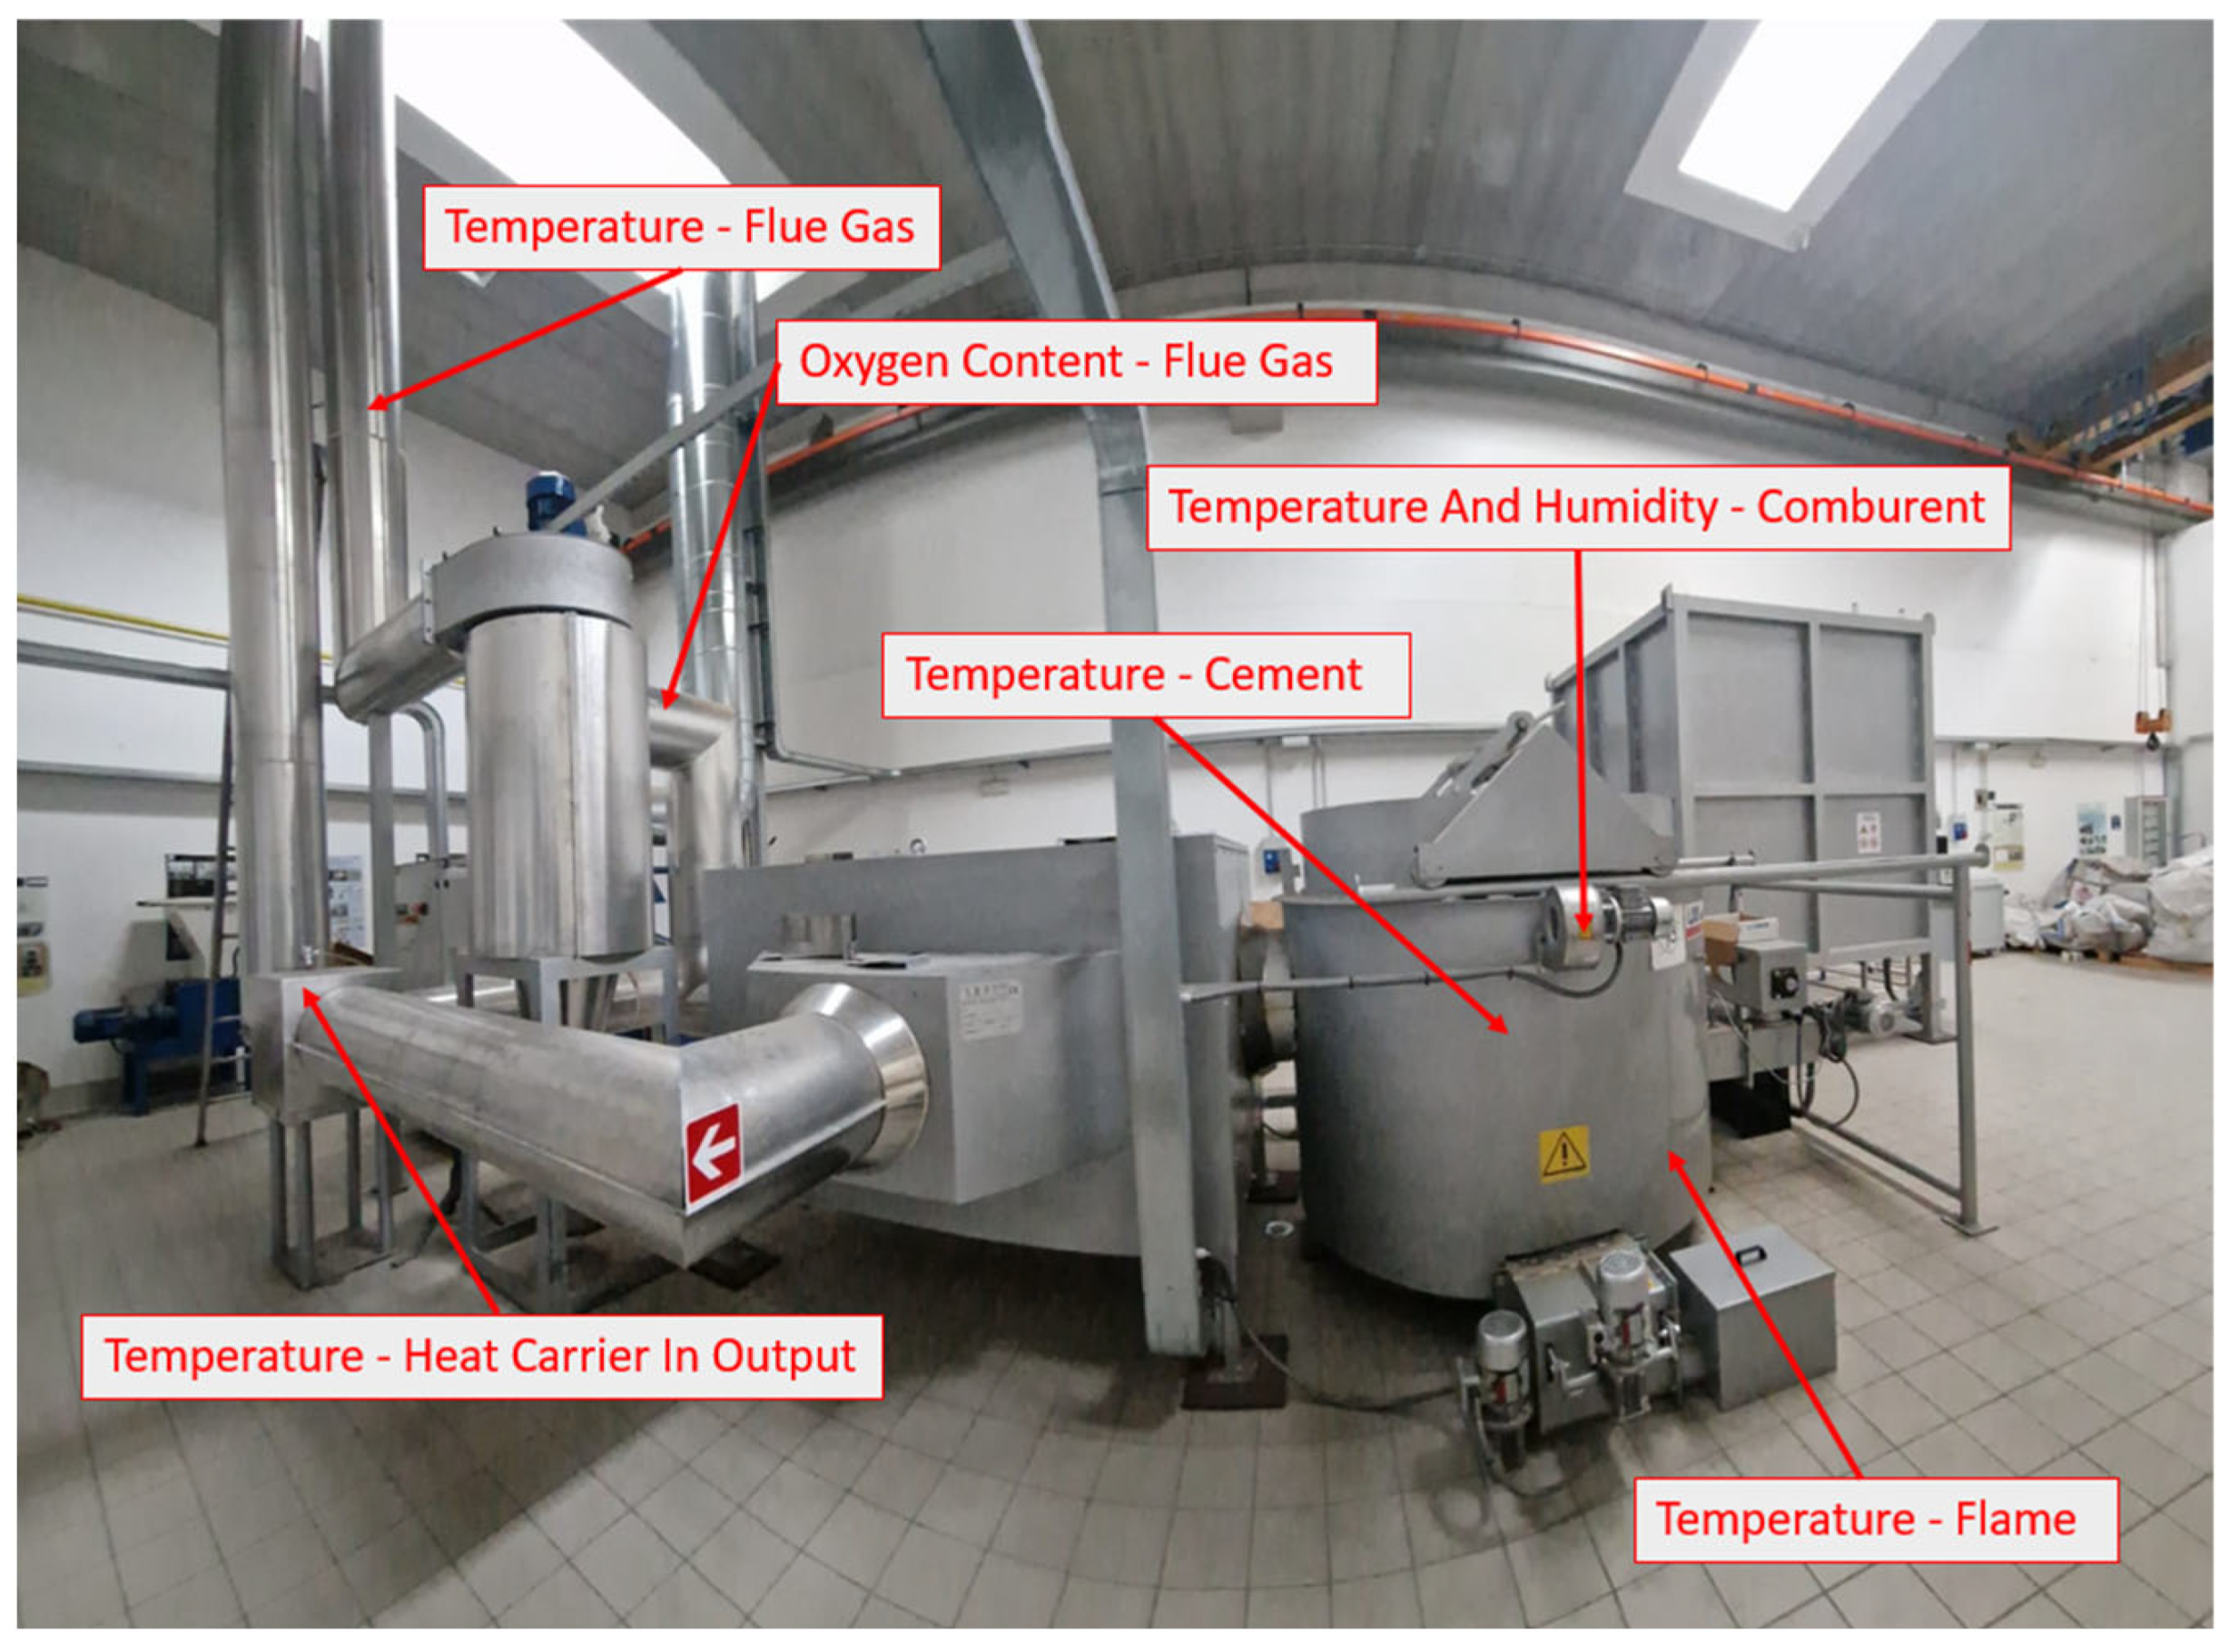
During operation of the combustion plant, the temperature of the combustion chamber (temperature of the flame, cement, and comburent and humidity of the comburent), a heat exchanger (temperature and humidity of the heat carrier for the input and output), and the exhausted flue gas of the cyclone system (temperature of flue gas and oxygen content) were measured. The points of measurement can be seen in Figure 5.
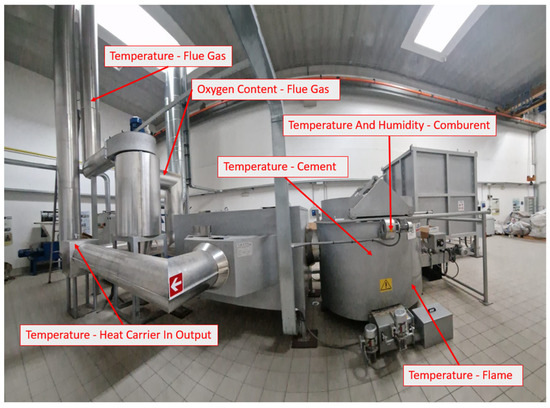
Figure 5.
Combustion plant’s measuring points.
The temperatures in the combustion chamber, heat exchanger, and cyclone were measured using K-type thermocouples. The temperature and humidity of the comburent air were measured through a temperature/relative humidity logger (Gemini, mod. Tinytag TGU 4500, Gemini data loggers Ltd, Chichester, West Sussex, UK) [13] placed close to the three combustor oxygenators.
The values from the built-in thermocouples and oxygen sensor were acquired from the command panel of the combustion plant.
2.5.2. Condensing Plant
The flue gas circuit was monitored in terms of temperature at three different points: in the input of the condensing system (before the flue gas/air heat exchanger), in the intermediate phase of the circuit (after the flue gas/air heat exchanger and before the flue gas/water heat exchanger), and at the end of the system before being released into the atmosphere (after the flue gas/water heat exchanger). For the temperature measurements, inert gas-filled anti-vibration thermometers (Nuova Fima, TA8, Invorio, Novara, Italy) with a range of up to 650 °C were employed in the three different points of the plant. In addition, the temperatures at the input and output points of the systems were measured with the thermocouple of the gas analyser used to examine the chemical composition of the flue gases.
Still, for the flue gas circuit, the composition and mass flow of the flue gas were measured in the input and output of the condensing system. The mass flow was measured with a digital stack gas velocity and flow meter (TCR Tecora, Flowtest ST, Tecora, Cogliate (MB), Italy). The flue gas velocity and temperature were measured with an S-type pitot tube and a thermocouple.
As well as the measurement of the velocity of the gas flow, the measurements for the analysis of the flue gases’ chemical composition were performed at the same points (input and output of the system). A gas analyser (SEITRON, CHEMIST 600, Seitron S. p. a., Mussolente, VI, Italy) equipped with electrochemical gas cells was used for the analysis of O2, CO/H2, NO, NO2, CO2, and H2. Flue gas sampling was performed with a 1000 mm sampling probe equipped with a thermocouple for gas measurements up to 1200 °C.
The input and output air in the flue gas/air heat exchanger were monitored in terms of temperature and humidity using a temperature and relative humidity logger (Tinytag Plus 2, Gemini Gemini data loggers Ltd., Chichester, West Sussex, UK).
The input and output water in the flue gas/water heat exchanger were monitored in terms of temperature with a thermometer. The points of measurement are shown in Figure 6.
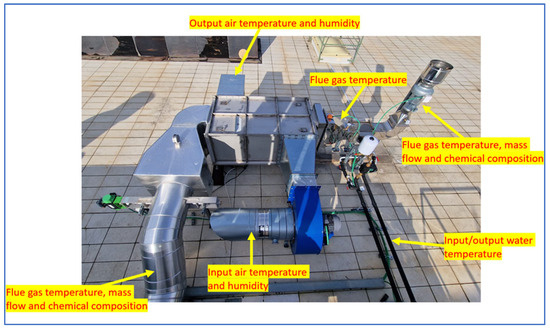
Figure 6.
Condensing plant measuring points.
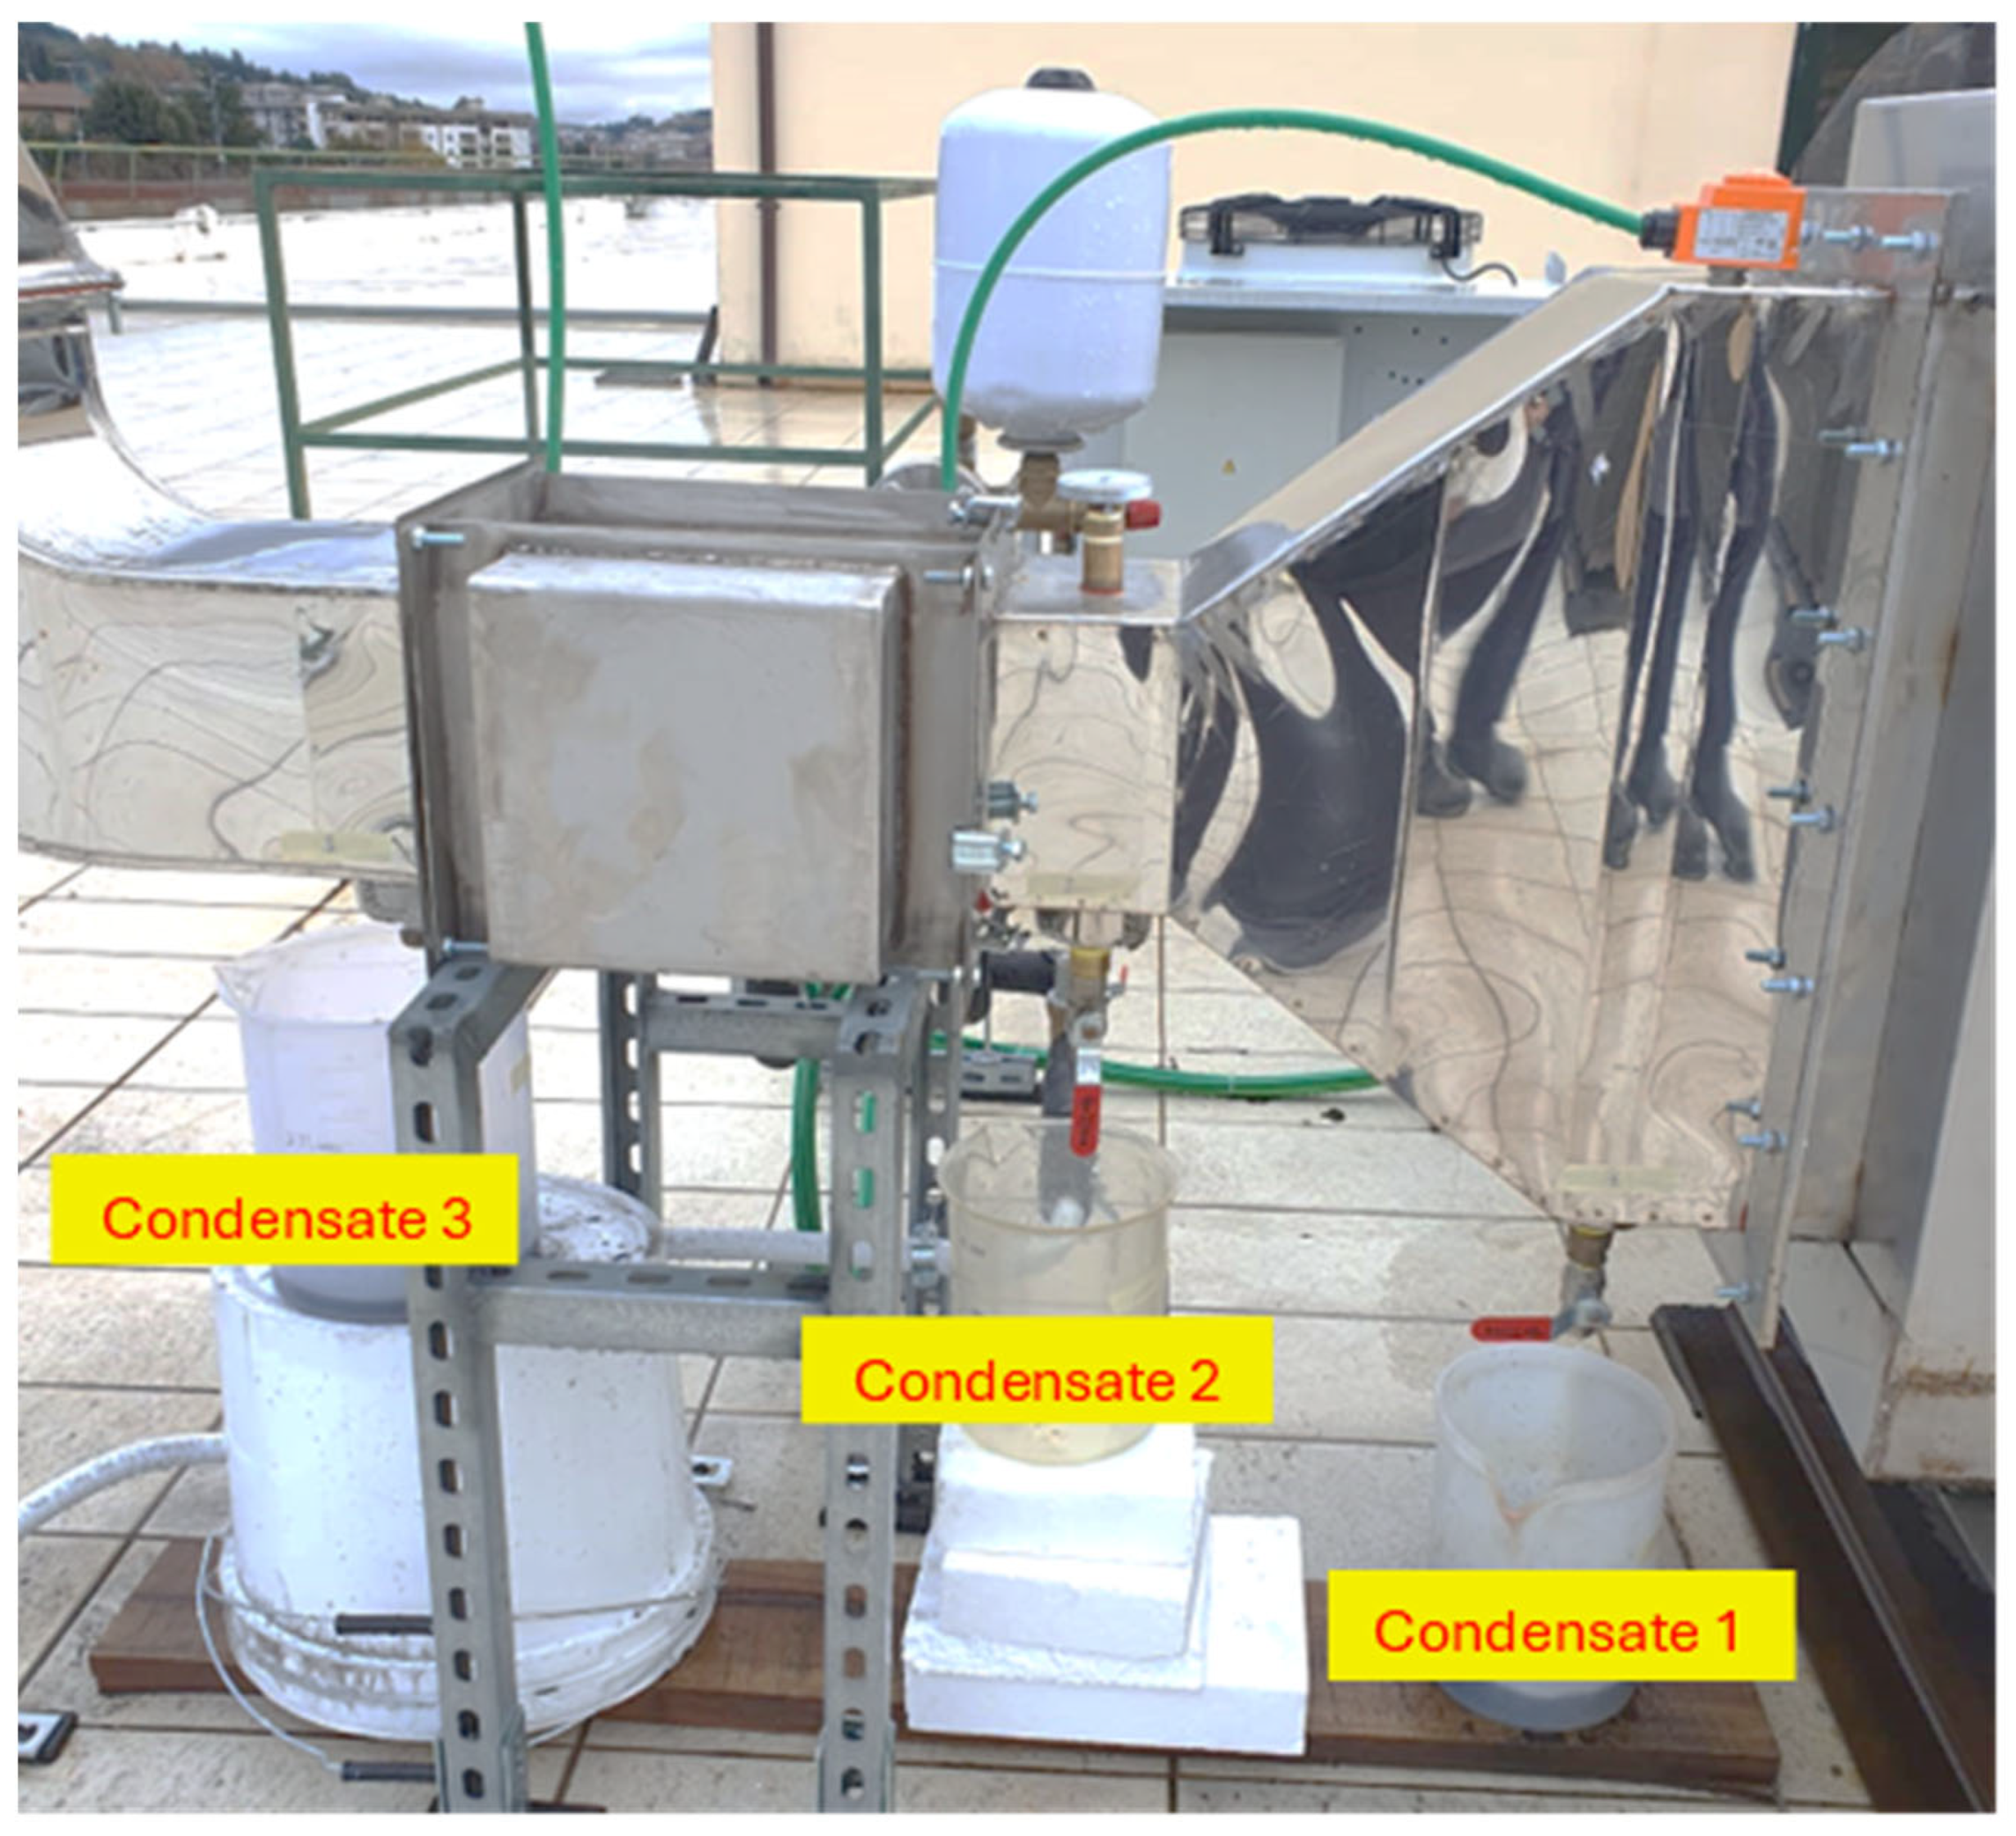
The collection and sampling of the condensed material were realised in the section that comprised the flue gas passage before and after the flue gas/water heat exchanger. The condensate collectors were positioned at three points: two drain points between the flue gas/air and flue gas/water heat exchangers and another one between the flue gas/water heat exchanger and the chimney. During the condensate material collection, the condensate temperature was measured. The points of extraction can be seen in Figure 7.
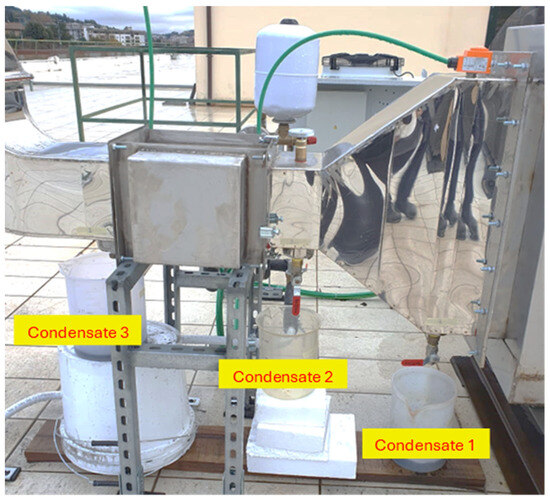
Figure 7.
Condensate draining points.
3. Results and Discussion
3.1. Woodchip and Ash Characterisation
The fuel material (woodchips) was characterised in terms of humidity, energy content, ash content, fixed residue, solid volatiles, carbon, hydrogen, nitrogen, and heavy metals, consisting of arsenic, cadmium, chromium, copper, lead, mercury, nickel, and zinc. The results can be seen in Table 1.

Table 1.
Woodchip characterisation.
The ashes from the combustion process were characterised in terms of humidity, fixed residue, solid volatiles, cadmium, chromium, copper, lead, mercury, nickel, and zinc. The results can be seen in Table 2.
Table 2.
Ash characterisation.
3.2. Operational Monitoring Results
The results obtained during the operational campaign are shown below. The results displayed are the averages of the measurements performed in triplicate. The measured parameters are shown for each plant (combustion and condensation). The measured parameters include the monitoring time, temperatures at various points in the process chain, fuel consumption, mass flows, humidity, condensation rate, and analysis of the flue gases before and after the condensation process. The results for each sampling run are shown in Table 3.
Table 3.
Condensation plant monitoring: runs 1, 2, and 3.
Under the temperature and mass flow conditions described above, a reduction in the pollutants emitted into the atmosphere was verified, namely CO, CO2, NO, and NOx. The emission factors which obtained the highest reduction rates were NO and NOx, reduced on average by 30% and 26% in the condensation process, respectively. Next, the process was responsible for a reduction of approximately 20% in CO2 emissions and 19% in CO.
The proposed system, under the conditions described, was able to capture water and pollutants a rate of about 75 g/min and at a temperature of 22 °C.
4. Discussion
In the preliminary phase of the research, to find a correlation between experimental data and predictive calculations using a theorethical model already described by some of the authors in [14], major efforts were devoted to representing the chemical combustion reaction of the biomass used in the experimental tests. The input parameters considered were the data relating to the operating conditions of the system and those obtained from the chemical analyses of the biomass and exhaust flue gases.
The formulations normally used to represent cellulose (C6H12O5) and lignin (C9H10O2, C10H12O3, and C11H14O4), both in single and coupled form, with the possibility of varying their mass fraction did not yield satisfactory results with respect to the percentages of oxygen and carbon dioxide detected in the flue gases.
Furthermore, the phenomenon of condensation, due to the high amount of excess air, would occur at dew temperatures which were too low. For the reasons outlined above, the study was aimed at identifying a representative molecule of the biomass used in the experiments that approximated the results obtained from CHN analysis.
The amount of water collected during the experimental tests did not seem to be easily calculable due to the complexity of the phenomena that occurred, especially at the first heat exchanger (high temperature), with condensation formation (due to contact with cold surfaces) even though the temperature of the flue gases was higher than the dew temperature. A preliminary analysis, conducted by assimilating the flue gases to humid air, led to some results only in reference to the total amount of condensate collected during the tests and considering the arithmetic mean temperature between the fluids exiting the second heat exchanger (low temperature).
Table 4 reports some of the experimental parameters that were compared with the results of the calculations.
Table 4.
Comparison of the experimental parameters that were compared with the results of the calculations.
Based on the observation of the data in Table 4, the following observations can be made:
- (1)
- The stoichiometric air flows were slightly different from one test to another because the air density varied from test to test. They were calculated using the temperatures measured during the tests with reference to the oxygenator at 650 m3/h.
- (2)
- The calculated excess air took into account the percentages of O2 and CO2, which were experimentally measured and varied from test to test.
- (3)
- The specific humidity was calculated by substituting the numerical coefficient (18/29) with the ratio between the molecular masses of water vapour and flue gas (18/29.7).
- (4)
- Referring to tests 2 and 3, near the calculation temperatures, for variations of a few tenths of a degree, significant variations in the quantity of condensate were recorded. For example, by reducing the calculation temperatures by 0.3 °C, the errors decreased in different ways:
- Test 1: from 12.1% to 11.1%;
- Test 2: from 22.7% to 16.5%;
- Test 3: from 11.3% to 5.8%.
Where the saturation curve was steeper, small variations (or errors) in temperature resulted in large variations in the amount of condensed water.
- (5)
- The theoretical and experimental analysis lended itself to interesting developments regarding both the characterisation of biomass and the recovery of thermal energy and water. Furthermore, a greater reduction in pollutants is expected as the flow of condensed water (flue gas washing) increases.
5. Conclusions
The proposed article focused on the study of a system for reducing emissions of atmospheric pollutants through the condensation of flue gases. The main objective was to drive and evaluate the operating performance of a set of two plants, namely one for biomass combustion coupled with a combustion gas condensation plant. For this purpose, the condensation rates of the gases were measured, in addition to several emission factors, such as CO, CO2, and NOx. As a result, it was observed that the implementation of the condensation system was able to collect 75 g of condensate per min and reduce CO, CO2, NO, and NOx emissions by 30%, 26%, 20%, and 19%, respectively.
6. Future Perspectives
In the future perspectives of this study, the aim is to expand the spectrum of emission analysis by incorporating assessments of SOx emissions. Furthermore, there are plans to analyse the particulate matter captured through the water collected during the condensation process, as well as the total composition of the liquid, understanding its potential for abating other substances emitted during the condensation process. These additional analyses will provide further insights into the environmental impact of the combustion plant used and the effectiveness of the condensation system.
Author Contributions
Conceptualisation and funding acquisition, F.C.; supervision, A.N., L.L., A.M., and D.D.; methodology and writing—original draft preparation, R.B.L.T., O.T., V.C., D.V., and M.C. All authors have read and agreed to the published version of the manuscript.
Funding
This research was funded by the Italian Ministry of Research under PRIN 2017 MUR BIOCHEAPER Research Grant n° 20175TXJER.
Institutional Review Board Statement
Not applicable.
Informed Consent Statement
Not applicable.
Data Availability Statement
Data is contained within the article.
Conflicts of Interest
The authors declare no conflicts of interest.
Nomenclature
| PM | Particulate matter |
| SOx | Sulphur oxides |
| Nox | Nitrogen oxides |
| HE1 | Heat exchanger 1 |
| HE2 | Heat exchanger 2 |
| TGA | thermogravimetric analyser |
| CHN | elementary analyser |
| HHV | Higher heating value |
References
- Mehmood, M.A.; Ibrahim, M.; Rashid, U.; Nawaz, M.; Ali, S.; Hussain, A.; Gull, M. Biomass Production for Bioenergy Using Marginal Lands. Sustain. Prod. Consum. 2017, 9, 3–21. [Google Scholar] [CrossRef]
- Osman, A.I.; Mehta, N.; Elgarahy, A.M.; Al-Hinai, A.; Al-Muhtaseb, A.H.; Rooney, D.W. Conversion of Biomass to Biofuels and Life Cycle Assessment: A Review. Environ. Chem. Lett. 2021, 19, 4075–4118. [Google Scholar] [CrossRef]
- Haq, I.U.; Qaisar, K.; Nawaz, A.; Akram, F.; Mukhtar, H.; Zohu, X.; Xu, Y.; Mumtaz, M.W.; Rashid, U.; Ghani, W.A.W.A.K.; et al. Advances in Valorization of Lignocellulosic Biomass towards Energy Generation. Catalysts 2021, 11, 309. [Google Scholar] [CrossRef]
- Paraschiv, L.S.; Serban, A.; Paraschiv, S. Calculation of Combustion Air Required for Burning Solid Fuels (Coal/Biomass/Solid Waste) and Analysis of Flue Gas Composition. Energy Rep. 2020, 6, 36–45. [Google Scholar] [CrossRef]
- Aste, N.; Adhikari, R.S.; Compostella, J.; Del Pero, C. Energy and Environmental Impact of Domestic Heating in Italy: Evaluation of National NOx Emissions. Energy Policy 2013, 53, 353–360. [Google Scholar] [CrossRef]
- EMEP/EEA Air Pollutant Emission Inventory Guidebook 2013. 2013. Available online: https://www.eea.europa.eu/publications/emep-eea-guidebook-2013 (accessed on 20 January 2023).
- Lim, M.T.; Phan, A.; Roddy, D.; Harvey, A. Technologies for Measurement and Mitigation of Particulate Emissions from Domestic Combustion of Biomass: A Review. Renew. Sustain. Energy Rev. 2015, 49, 574–584. [Google Scholar] [CrossRef]
- Vicente, E.D.; Alves, C.A. An Overview of Particulate Emissions from Residential Biomass Combustion. Atmos. Res. 2018, 199, 159–185. [Google Scholar] [CrossRef]
- LECO Instruments Calorimeter AC-350. Available online: http://www.zycon.com/literature/128173/62890/ac-350%20flyer%20203-968.pdf (accessed on 20 January 2023).
- LECO Instruments Thermogravimetric Analyzer TGA701. Available online: https://eu.leco.com/ (accessed on 20 January 2023).
- LECO Instruments LECO Instruments Calorimeter TruSpec CHN. Available online: https://it.leco.com/product/truspec-micro (accessed on 20 January 2023).
- ThermoKey WH1163.B D/22 QRS. Available online: https://thermokey.com/en (accessed on 28 March 2023).
- Gemini Tinytag TGU 4500. Available online: https://www.geminidataloggers.com/data-loggers/tinytag-ultra-2/tgu-4500#:~:text=product%20description,protection%20such%20a%20stevenson%20screen (accessed on 28 March 2023).
- Dondi, D.; López Robles, C.D.; Magrini, A.; Cartesegna, M. Potential Water Recovery from Biomass Boilers: Parametric Analysis. Computation 2021, 9, 53. [Google Scholar] [CrossRef]


Disclaimer/Publisher’s Note: The statements, opinions and data contained in all publications are solely those of the individual author(s) and contributor(s) and not of MDPI and/or the editor(s). MDPI and/or the editor(s) disclaim responsibility for any injury to people or property resulting from any ideas, methods, instructions or products referred to in the content. |
© 2024 by the authors. Licensee MDPI, Basel, Switzerland. This article is an open access article distributed under the terms and conditions of the Creative Commons Attribution (CC BY) license (https://creativecommons.org/licenses/by/4.0/).