Abstract
Organizations increasingly recognize the need to act in accordance with the idea of sustainable development. In the context of a production system, this is based not only on minimizing material losses but also on human support in the work process. The activities described in this article verify the operation of the system by collecting data on problems occurring during the production process, and the presented case study shows not only that companies do not always have to base their analyses on expensive solutions constructed on big data but they also misinterpret the causes of disruptions, which leads to further losses. This study presents an innovative system supporting the identification of downtime, and the results obtained allowed the examined organization to introduce changes based on specific premises, which led to reducing the waste of resources. The research carried out showed that it is not the excessive load on machines that is the problem but unnecessary downtime resulting from, for example, poor-quality materials for packaging goods.
1. Introduction
The current world is changing at a pace previously unattainable. Artificial intelligence, wars, pandemic, climate change—all of this causes the need for faster reactions. At the same time, people are increasingly aware that their everyday decisions matter for the fate of the world. Also, at the state level, already by 1987, a decision was made as part of the UN World Commission report (the so-called Brundtland Report) on the need for global actions to protect the planet, as a result of which assumptions were adopted, aimed at so-called sustainable development. It is based on three main trends: environment, people and economy [1]. This topic is still very important; hence, in 2015, 193 countries associated with the United Nations adopted the resolution “Transforming our world: 2030 Agenda for Sustainable Development”, briefly referred to as the 2030 Agenda [2,3,4]. This introduced 17 main goals, regarding the so-called 5xP: people, planet, prosperity, peace and partnership. These were indicated (231 indicators) to measure their implementation [5,6]. These goals have been divided into 169 specific tasks, and their fulfillment depends not only on governments and national decision makers but also on enterprises and generally accepted economic activities. Hence, the 17 goals also translate into business issues, based not only on improving competitiveness and internationalization but also on R&D activities and improving innovation. Therefore, this study presents the activities of a selected company, aimed not only at improving competitiveness but also at reducing the consumption of material resources and time by using innovative data processing and searching for the influence between work environment factors, machines and production materials, as well as human functioning in this production system. This is related to the issue of risk management in production, which, according to the authors, may have a positive impact on conscious decision making in manufacturing enterprises, as well as on adapting to the changing reality and reducing costs and operational losses. More on this topic was described by Stasiuk-Piekarska, Wyrwicka and Hadaś [7]. Lee et al., in turn, emphasized the existence of two risk areas in production: visible (decrease in OEE, cycle delays, machine failures, etc.) and invisible (lack of lubrication, machine degradation or component wear). These authors noticed that in both systems, spaces can be considered at the deterministic and uncertain levels [8].
When analyzing sustainable development from the employee perspective, it can be observed that employees often look for better working conditions and the fulfillment of individual goals by changing employers. According to sociological research, the current generation will change their occupation (employment, type of work and even profession) up to 26 times during their lives [9]. This means a drastic reduction in the available time needed to gain experience (which is a necessary complement to education). When managing production, it should be borne in mind that excessive staff turnover generates costs related to employee recruitment but may also have a negative impact on the productivity, sustainable development, competitiveness and profitability of the organization [10,11,12,13]. Hence, there are more and more frequent signals from production plants about disruptions in production and, sometimes, even reduced efficiency, which they cannot cope with well enough. It appears that the systems that have been used for years not only do not protect production to the expected extent but also do not provide answers as to the sources of disruptions. Therefore, it is not possible to take appropriate corrective actions, and what’s worse, the decisions made on their basis (whether ad hoc, service or investment) may be subject to significant errors. In order to properly manage production, companies decide to collect production data. It is important that they reflect the actual situation, so that decision makers can analyze and understand what is happening in the production plant, process or even production results. Various IT systems, collections based on big data and also using manual records and documentation can be used to collect data from the production process. One of them may be value stream mapping or other—often simple—methods [13]. This depends on the size and complexity of the enterprise, the process being analyzed, etc. Please note that the purchase and implementation of certain software packages are usually a financial problem due to the requirements for various sensors, controllers, relays, computers and control loop systems [14,15]. It is assumed that sustainable development is driven by innovation [16].
Cochan et al. noted that in the traditional approach, continuous improvements in production are difficult due to the small amount of data and the associated uncertainty in decision making [17]. Therefore, in order to properly manage production, companies decide to collect production data. It is important that they reflect the actual situation, so that decision makers can analyze and understand what is happening in the production plant, process or even production results. At the same time, Cui, Kara and Chan mention that big datasets drive the development of production and enterprises, and they consider the following to be key: systems integration, data, prediction, sustainability, resource sharing and hardware [18].
It is worth emphasizing that the literature contains many different descriptions of production management, both in the context of sustainable development and supporting decision making in situations of disruption [19,20,21], especially when it comes to big datasets [17,22]. In practice, however, enterprises—especially small- and medium-sized ones—do not consider themselves the target group of these studies, especially due to implementation costs, scope of data management and competences.
The analysis of large datasets can be very useful, but as Azeem and others mentioned, it is necessary to take into account the enterprise’s resource intensity, the need to collect, store and properly use data, as well as ensure cybersecurity [23]. Not every company has the appropriate preparation and resources to be able to implement activities based on large datasets. Therefore, the authors, looking for other solutions, decided to ask research questions:
How can we identify the causes of disruptions in the production system while assuming a lack of funds for big data-based systems?
What data collection mechanism can be used to automate data collection in the manufacturing process?
This study presents a system, the origins of which come from reports (inquiries) from production plants of various industries regarding better management of the production process. Already, the preliminary analysis of these signals indicates that, despite the diversity of industries and the management and production safety systems used, the information has many similarities. Namely, it is indicated that production efficiency fluctuates significantly, and the nature of these disruptions is ambiguous. On the other hand, the activities carried out do not bring the desired results, and analyses of large datasets based on complex systems collecting data in real time are often unattainable for smaller organizations due to costs. The functioning of existing systems and the problems encountered were analyzed. Two new areas are specified that are not covered by existing systems:
- -
- Collecting direct data from the production area where disruptions occur;
- -
- Linking data that are not directly correlated with a given type of production and have an impact on given disruptions (parallel dependencies and the environment).
This means that the overall quality of data collection is decisive, understood as the proper definition of its scope, form, method and recording frequencies, and creating appropriate conditions for their collection so that their analysis is free from interference.
The aim of this article is to analyze a new solution, the use of which can also support smaller production companies in supporting activities that take into account sustainable development and its goals. At the beginning, the theoretical part is presented, aimed at introducing the importance of the discussed topic, and the research part presents the results of a case study in one of the enterprises in which the analyzed system was implemented as a pilot.
2. Materials and Methods
The source of the approach to the topic was inquiries delivered directly from the industry and concerned mainly threats related to unstable work performance with sources that cannot be clearly identified. In order to select a company to verify the described system, it was decided to choose a company producing a small range of its own solid products, with staff with at least several years of experience, and the nature of its business concerns the bottling and packaging of liquid products, so should, therefore, relatively easily identify the sources of problems. On the other hand, when comparing these reports with similar problems from other companies from business practice, often with much more complicated or more advanced technology, relatively similar problem descriptions were noticed. The authors believe that, in the context of increasing emphasis on the individualization of products, more problems are encountered when streamlining the operations of a highly customized organization than in mass production. This means that a system that will work well in such activities will also be able to be used in a more repeatable reality.
The adopted methodology resulted from the analysis of reported problems. It is revealed that large companies with resources in the form of qualified staff in the field of management, production, safety, improving service qualifications, etc., despite continuous improvement and implementation of the quality management system, observe an increase in threats in the area of production continuity security. When looking for the sources of these problems, one can highlight, on the one hand, the requirement for greater and greater production flexibility, including the need for operators to adapt to it, and, on the other hand, the need to reduce costs. As a result, companies are looking for solutions that allow them to find and eliminate even small threats. Consequently, it is noticed that the methods used so far do not allow for defining, finding and eliminating this type of newly emerging threat. Therefore, it should be assumed that the sources of these problems lie in areas that existing systems either do not cover or cover too generally, e.g., quality management assumes responsibility within a given department (the structure is vertical—people in another department are not directly related in the assessment process quality with another department); however, such an influence may exist.
In this study, in addition to presenting research on the efforts of enterprises to meet the assumptions of sustainable development, we intended to answer questions about the sources of new problems in ensuring the safety of production processes and methods of their identification. By presenting the results of empirical measurement activities in the tested production system, connections were identified that influence the occurrence of disturbances and, as a result, the efficiency of the production process.
When planning the production process, not only the time related to the actual work is taken into account (the so-called main time Tg) but also other times, such as Tpz (preparation and completion time), Tj (unit time), Tw (production time), Tu (supplementary time), Tp (auxiliary time), To (service time), Tot (technical service time), Too (organizational service time), Tf (time of physiological needs), Tfo (time for rest), Tfn (time of natural needs).
The time needed to produce the entire batch (n) of products is marked with the letter N.
Analyzing the above diagram in Figure 1, it can be observed that determining the time standard for producing the number of n pieces of products is calculated as follows:
Tf = Tfo + Tfn
To = Tot + Too
Tu = To + Tf
Tw = Tg + Tp
Tj = Tw + Tu
N = Tpz + n × Tj
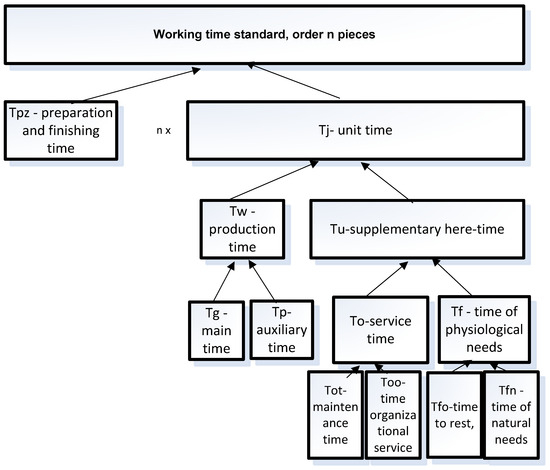
Figure 1.
Structure of the time norm. Source: [24].
These are guidelines established in the last century, but they can still be considered valid. At the same time, when comparing the established standard of working time for the production of batches of products, organizations begin to reflect on why previously unidentified daily performance spikes appear or Tpz times increase despite the absence of failures or other factors that could be directly related to them. Therefore, during the considerations, it was assumed that this is a clear premise for seeking production management for other unidentified or incorrectly presented data.
In the area of data, the authors distinguished two groups of problems related to them:
- Detail and precision of entered data.
- -
- Registration of events as they occur, which precisely determines the number of events, the time of their occurrence, the duration of their occurrence and the order of their occurrence. From the employee’s point of view, the operator cannot provide such information because he would have to remember all events of which he may not even be aware, and, additionally, it would take up most of his production time.
- -
- Scope of data entered. The amount of data, places of data collection, form of data collection (binary, continuous), which is specified in detail for a given position, would require a lot of knowledge from the operator to determine them. The amount and method of storing data enable their effective and quick analysis. The analysis of the causes of events includes, among others, when searching for changes, it is necessary to record, e.g., every minute or to record several events at the same time, and what is more, it is necessary to record such events throughout the cycle. Such activities cannot be performed manually.
- Correlation of indirect data.
The production process is influenced not only by directly related events with a machine, assembly line, device or service station but may also be workstation-related data (e.g., temperature, humidity). This may be information related to transport, packaging, quality of products and details delivered to the workplace or with the organization of production flow between departments.
In this area, it is also impossible for the operator to record times at one station, e.g., delivering pallets from the warehouse.
Changing economic conditions resulted in increased requirements, an increase in the number of changes in production in relation to the production time itself, which meant that the time buffer was practically zero, and, at the same time, the employee experience decreased (continuous staff changes). In such conditions, a quality system operating on the basis of bad, incomplete or imprecise data may even increase operating costs and cause further disruptions in the area of the possible supply chain.
With reference to the issues described in the literature, it was decided to present, in this work, a system that was created as a result of the analysis of manufacturers’ reports regarding a decrease in the stability and, consequently, the safety of production processes. All reported problems, despite very diverse production environments, had a common denominator, i.e., reducing production safety for reasons not clearly identified but occurring in places and technologies that have been used for years and despite the use and implementation of quality systems. An in-depth analysis based on experience and knowledge of security systems made it possible to draw important conclusions. As mentioned earlier, the realities regarding the human factor in the production system have changed, and, on the other hand, quality systems must take into account more specific data not directly related to production in a given place.
It should be added, however, that companies not only use quality systems but also collect increasing amounts of direct data in an escalating manner; however, at the same time, they report that it does not bring the expected results, i.e., it does not enable locating the sources of problems and does not provide an answer to how effective the implemented solutions are. Hence, it was concluded that not only is there a lack of data but, above all, there is no definition of which information is important and which data have no influence on it at all. That is why a system was created, the implementation of which is conducted in two stages.
The first stage is to designate areas, data and ranges, and the second stage is to collect these data. Only this approach to finding the sources of problems is effective.
Its main features are as follows:
- -
- Minimization of data areas and amounts;
- -
- Associated rejection of ineffective data;
- -
- Very short turnaround time for both registration and processing of applications;
- -
- Quick and easy possibility of assessing and implementing simple actions to increase process safety.
This study shows how well an automated data collection system can indicate real sources of threats and their scopes in the production process and, therefore, can be an invaluable source of properly identified and monitored threats. Complementing the input data of various quality systems allows them to be more effective in the face of ever-increasing challenges in production processes.
The innovative two-stage system solution allows you to combine the extremely important experience and knowledge of processes in the production plant and the intellectual background of the system creators for the needs of improving the production process and, in a broad context, to reduce ineffective times, material and financial losses.
As a result, a completely autonomous physical system was created, based on a computer and controlled independently of the facility in which it is located. A set of external devices (transducers), e.g., a barcode scanner, hall temperature or humidity sensor, was connected to collect data that could then be analyzed.
The described data collection system is presented in Figure 2.
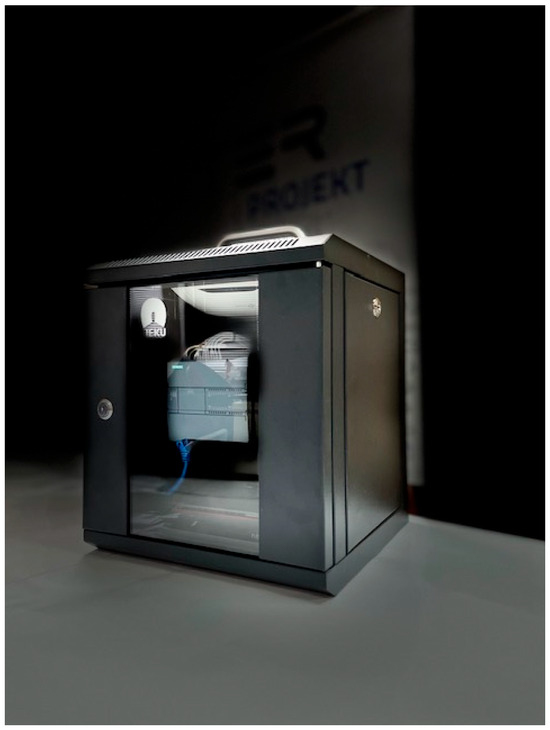
Figure 2.
Innovative data collection system. Source: own study.
The figure above shows a prototype solution for a system for collecting data directly from machines and production lines for safety analyses. The photo shows a cabinet with a system of digital inputs and outputs and a mini-PC with a local database.
In order to implement the topic in a systematic way, i.e., assuming that the developed system would be useful and effective for a wide range of users (technologies used, methods of work, materials, logistics), it was necessary to initially develop a method of selecting places, data and variable ranges for registration. It was assumed that it should be based on user experience.
Therefore, a survey was developed about the full range of areas that may be subject to such monitoring. Its aim is to exclude those areas, data or monitoring methods that either do not apply in a given place or are well known to the user who excluded them, or vice versa, precisely those areas the user indicated because his own experience says that it is this place that may be the source of the problem (as can be seen in File S1 in Supplementary Materials). In this way, the survey is used as a tool to systematize the knowledge available about disruptions in the process. Often, this knowledge is not collected in one place, and various parts of it are known to individual departments, i.e., technologists, maintenance, so it does not constitute common knowledge. This allows us to determine, at the very beginning, areas that are particularly difficult to analyze because they are at the interface between the competences of various departments in the company. The construction of the survey assumes its use in all departments of the organization: production, technology, maintenance, warehouse area. The assumption of the survey is that it should be completed by all people from various departments whose work is related to the monitored area. It was assumed that the questionnaire completed in this way is initially verified by the person conducting the research and then, in a closed form, as a description of the planned activities, it is returned to the organization for approval. The procedure is presented in Figure 3.
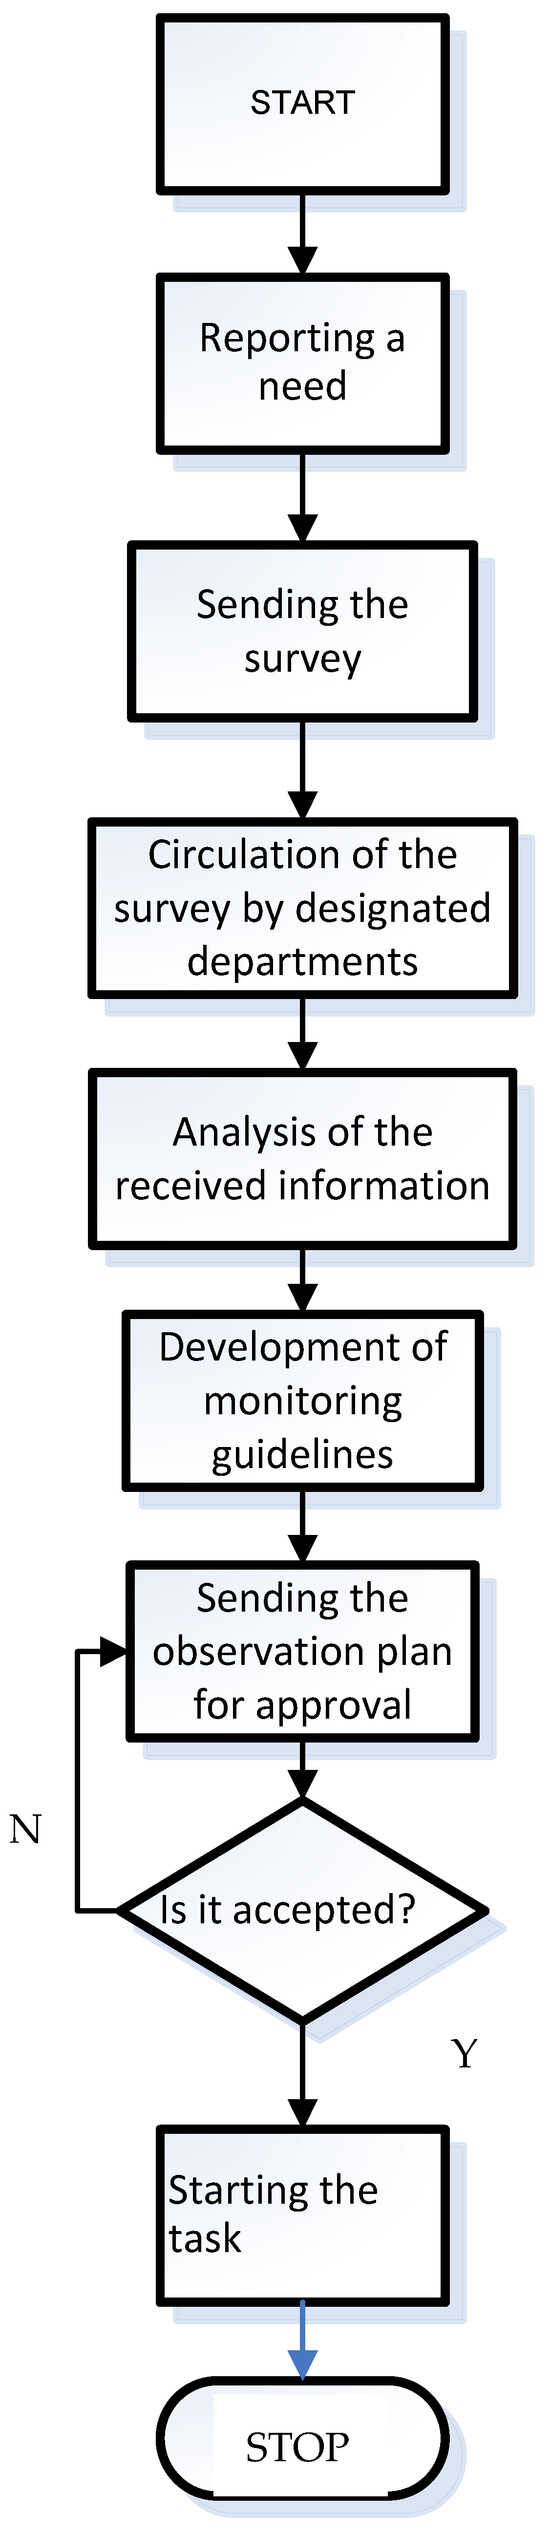
Figure 3.
Flowchart for collecting data for performance analyses. Source: own study.
The above example was used to determine the course and scope of monitoring described as a case study in this article.
All events affecting the stopping of the line, including micro-stops, were observed. The observation was carried out using cameras and manually. Monitoring was continued for 5 working days (8 working hours each). The same study was repeated after a break of several weeks for the second work shift.
During research, effort was exerted to precisely mark constant and variable areas with a direct impact on the usefulness of the collected data. Just as determining the appropriate time range of observations has a significant impact on determining average values, it is necessary to eliminate situations/disturbances that cause the data to be unreliable. However, it should not be forgotten that, despite their elimination in the calculations, they are taken into account when developing the conclusions of this study. For example, shortening the monitoring time to one shift could lead to completely wrong conclusions in the presented case, because there was a day when one of the line devices generated approximately 50% of the downtime. On the other hand, an observation longer than a week in the case of this organization would also introduce some errors and distortions to the collected data because, in fact, on this line, the production of one type of product never takes longer than 4–5 days.
Observation of two different operators’ personnel gave a more complete picture of which of the recorded downtimes should be considered constant and which may result from differences in the training and experience of the staff.
In the described system, it is possible to present the results in a table and, additionally, graphically on a time axis.
Depending on the scope and method of monitoring determined by the organization and the assumptions adopted, various aspects of the collected information are marked after the summary. In the presented case, the examined organization wanted to find out what the distribution of work breaks is and how the line operation sequences in relation to downtime are arranged during one shift. Therefore, the summary provides the number of stops, stop times and reasons for stops for each device in the line separately and for the loading and preparation activities of the line.
It is very important that the marked downtimes are described precisely. Foremost, downtime times, in which there is de facto no production (due to lack of raw materials, lack of orders or breakfast breaks), were excluded from these areas, because it happened that the lack of an order caused the line to stop for approximately 20% of the available time. Another important factor is determining the preparation times in which operators perform activities directly related to the operation of the line, the execution of orders they need to complete and in which the machine is not working. Both of the above-mentioned times must be clearly defined because the first one does not concern the operation of the line at all and would introduce errors in the analysis. However, the second of these times is necessary for the operation of the line but directly limits its availability and, most importantly, cannot be eliminated. It is even more important to know the actual preparation time, because not including it in production plans from the very beginning generates errors and alleged losses for the company. In this way, the actual, real and highly analyzable time of line availability is obtained. By conducting the analysis in this way, we can determine in great detail which aspects of production, i.e., method of operation, method of loading, operation of device structure, have an impact on micro-downtime and, as a result, cause the greatest threats to the stability and safety of production, which is not possible without the above studies, records and analyses to be carried out.
3. Results
The aim of this study was to identify the possibilities of supporting manufacturing enterprises in reducing resource waste by using activities supporting safety analyses using a system for collecting data directly from production sites. A number of issues and options for approaching production sites were presented, the aim of which was to determine the location and sources of threats. Further analysis was carried out on the measures used, i.e., the scope of data collection, the method of data collection, the method of data recording, the analytical tools used and the correlation of data, thanks to which conclusions can be drawn regarding the actually occurring threats. The work was based on the experience of two weeks of monitoring the operation of the solvent pouring and packaging line in company X.
The data obtained allowed us to formulate many conclusions regarding production hazards. The summary of these analyses was finally verified by the line user and showed that, despite the user’s many years of experience, the applied analysis measures and methods allowed for the identification of several new, previously unrecognized, threat-generating events.
In the examined case, the production line is composed of the operator’s workstation (operating devices) and four devices:
- Depalletizer—the only manual device in the line;
- Can gluer—operating in automatic mode but requiring systematic stopping when replacing the roll with labels approximately every 1 h;
- Carton sealer—it requires stopping to replace the adhesive tape (an activity performed rarely, which means that the time of stopping the line is practically negligible);
- Carton labeling machine—it requires stopping to replace the roll with labels (due to the carton buffer and the possibility of manually applying the label, this activity practically does not affect the line’s stopping time);
- Manual palletizing station for cartons or cans.
At the same time, when striving to fully identify the situation being examined, the quality of the materials used in production should not be ignored. The product had six components necessary to pack:
- -
- Can
- -
- Cork
- -
- Can label (optional)
- -
- Cardboard
- -
- Tape for sealing the cardboard
- -
- Carton label.
Figure 4, Figure 5 and Figure 6 show exemplary diagrams for stopping the analyzed production line during several sample days of observation.

Figure 4.
Production line stop chart on 14 February 2022.

Figure 5.
Production line stop chart on 15 February 2022 (colors analogous to the Figure 4).

Figure 6.
Production line stop chart on 16 February 2022 (colors analogous to the Figure 4).
The normal workflow is presented in black, and disruptions caused by the assigned machines are presented in other colors (according to the map legend).
As can be seen, during the above-mentioned studies, downtime was caused by problems with various equipment—from label pasters to cartoners and closing machines. All this could be identified with the assigned time of a given event, which allows conclusions to be drawn about the cause of the disruption. In addition, the system enables productivity analysis compared to line stoppages. This is shown in Figure 7 and Figure 8.
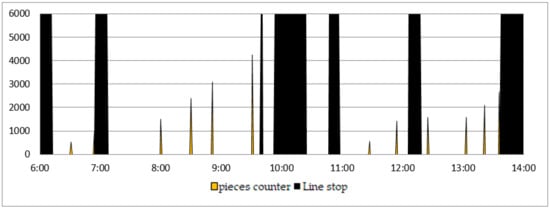
Figure 7.
Productivity chart by scale counter.
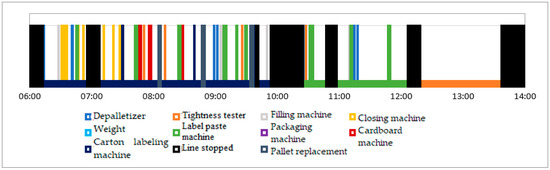
Figure 8.
Chart of detentions by cause on 16 February 2022.
At the same time, the presented system allows for the quick presentation of data in tabular form, which allows management to observe the causes of any disruptions. This is presented in Table 1 and Table 2.

Table 1.
Line stop time 14 February 2022.
Table 2.
Date working time 14 February 2022.
The above results allowed conclusions to be drawn from the report on monitoring the operation of line No. 1. Monitoring real operating times and downtime allowed for a faster response to occurring disruptions, which resulted in savings in time and material losses. During the 2 weeks of recording, only two events requiring service intervention occurred:
- -
- Cork falling out of the capper of the closing machine;
- -
- Changing the carton presence sensor in the packing machine (the service also intervened in adjusting the brake of the can gluer’s unwinder, but these are periodic activities resulting from the operation of the device, and not emergency situations).
In connection with the above, it is important to note that the causes of the stops were almost exclusively events related to the nature of operation of the devices/stands, the quality of materials (e.g., packaging) and service conditions.
In the case of operating devices, reducing downtime involves modernizing or changing the device:
- Depalletizer—to reduce downtime, you can:
- (a)
- Extend the time between necessary operator actions (pushing cans) by enlarging the table onto which the cans are pushed;
- (b)
- Use a longitudinal can transporter, which will eliminate the need to additionally push the cans after they are pushed onto the table;
- (c)
- Use a fully automatic depalletizer.
- Can sealer
- (a)
- Replacing the gluer with a device for continuous operation.
- Palletizing cartons or cans
- (a)
- Use of a cardboard palletizer with an additional can gripper.
In terms of the quality of components used in production, it was noticed that it directly affects the line stopping times. The stoppages were caused by component defects:
- -
- Cans—holes, dents, incorrect shape of the neck of the cork opening, stiffness of the upper bottom that is too low;
- -
- Plugs—sprues after injection, protruding end of the pin;
- -
- Can label gluer—tape breaking (variations in tape thickness in relation to the device settings);
- -
- Cartoning machine—cartons sealed inside (no automatic opening possible);
- -
- Carton sealer—tearing off adhesive tape;
- -
- Carton labeling machine—tape tearing, labels falling off during application.
It is worth noting that some component defects occur in the supply chain, before their delivery to the analyzed enterprise (manufacturer’s defects), and some may occur during the production process from unloading, through storage and delivery to the line and loading onto the line. However, this aspect was not monitored, so we cannot provide data on this subject here. However, after analyzing the number of downtimes caused by the quality of components, this aspect of the sources of downtime can also be monitored.
Due to the nature of the service, stops are caused by events that require the operator’s response. The following types of such activities are distinguished:
- -
- Handling the beginning and end of the line, i.e., feeding cans and palletizing cartons/cans;
- -
- Quality service—control and regulation of devices, product quality checks;
- -
- Production support, i.e., selection and recording of the order in the IT system, connection of the raw material container, delivery of components, loading of components (feeding cans, refilling the cork container, replacing rolls with can labels, refilling the carton container, replacing the sealer tape roll, replacing carton label tapes), line cleaning.
These activities are necessary for production, but their number and distribution in time and along the assembly line length lead to additional (beyond necessary) downtime. Most downtime is caused by the accumulation of several activities at once:
- -
- The need to feed another batch of cans, replace the can label roll and load cartons into the hopper;
- -
- Removing the can from the leak detector, collecting the carton for palletizing;
- -
- These downtime times are also longer because of the lack of a quick response, which, as a result, sometimes leads to further maintenance activities;
- -
- Failure to collect the cartons to be placed on the pallet blocks the carton gluer and requires manual application of labels.
These situations also occur because the operator does not have any signal informing him about the lack of cans, the end of the goods in the connected container or the filling of the buffer of cans for palletizing. He must constantly observe and listen to whether all line elements (significantly separated from each other) are working properly. This fact alone leads to additional downtime.
Analyzing the above data, you can certainly identify several solutions that will reduce some downtime:
- -
- Introducing a sensor to control the filling of the cans’ exit buffer, which will stop the departure of subsequent cartons and notify the operator;
- -
- Introduction of signaling of lack of boxes at the line input;
- -
- Introducing signaling of the end (approaching end) of raw material in the hopper.
In addition to the activities indicated above, there is also the aspect of ergonomics of the activities themselves, which extends service times, i.e., the need to bend down to pick up cartons for palletizing, palletizing cartons and cans at too high a height (for one operator, from one place). Bending down to pick up each box for palletizing causes additional fatigue and the need to rest (change operators) during work. However, too high palletization requires two-person work, which takes up the second operator’s time for other service activities (e.g., feeding cans at the line entrance). In this respect, you should consider introducing, for example:
- -
- Lowering of cartons or cans on pallets;
- -
- Lifting the exit conveyor—equipping it with powered rollers
Before introducing changes in the operation of the line, line equipment or work organization, analyses of the line’s operation should be supplemented with economic indicators of downtime costs and the costs of introducing possible changes.
The presented results indicate how important it is to select variables for monitoring; thus, they show how the two-stage structure of implementing the monitoring system becomes an effective, fast, cheap and, therefore, very valuable tool for supplementing safety systems used in workplaces. In the discussed case, only 10 variables were recorded (START–STOP analysis of each device in line + possible reasons for detentions), and their presentation and analysis from 10 days of work on one shift only requires spending at least several days. It includes, for example, reading the material covering over 100 pages. As can be seen in the example above, a properly prepared course and the scope of monitoring provide enormous analytical possibilities. It is worth adding that after presenting the conclusions in the surveyed organization where monitoring was carried out, in less than a week, precise, effective, quickly implemented and low-cost solutions were created that not only increase production safety but also allow for better resource management and resulting savings.
You can imagine that if all available data were recorded without the first stage of implementing such a system, the results would take up thousands of pages and their analysis would take many weeks, generate extensive cost and the expected results would most likely not be significant due to, on the one hand, the inability to reject incorrect conclusions after time and, on the other hand, the very passage of time between the study, and so the conclusions could be out of date.
4. Discussion
There is a growing amount of new information in the literature and in practice about the influence of additional factors on the processes, safety and profitability of production, which is confirmed by more and more frequent inquiries from the industrial market. Companies are looking for causes and ways of solving new problems in the area of safety of production processes, leading not only to minimizing financial and material losses but also supporting pro-environmental activities.
The questions stated in the introduction are as follows:
How can we identify the causes of disruptions in the production system while assuming a lack of funds for big data-based systems?
What data collection mechanism can be used to automate data collection in the manufacturing process?
The above work presents a method for identifying these threats, easily identifying sources and assessments that allow for the simple elimination of sources of process security disturbances.
The method was developed on the basis of many years of experience and cooperation with many companies from various industries.
Its main feature is its two-stage nature, and the theoretical assumption is that the quality of the collected data directly affects the quality and effectiveness of the implemented activities in the field of production safety.
The most important feature of the system is that to ensure proper quality, i.e., usefulness, these data must not only be collected automatically but, most importantly, the data collection itself must be thoroughly prepared in advance. It can be observed that the number of collected variables not only does not improve the quality of the conclusions obtained but may even lead to completely erroneous conclusions and results of the activities carried out, and vice versa, even a minimal number of precisely developed, properly collected and analyzed variables can be achieved in a very short time, very precisely determining or eliminating the alleged sources of problems.
The above work presents a system in which only 10 variables were collected over 10 business days, where the management staff could receive a report with conclusions 3 business weeks after starting monitoring. The assessment of such a system prepared and implemented in this way was evident—the system disclosed, in a practical manner, departments, dependencies and functions that the responsible persons did not expect because they had not obtained such information with any of the previously used system measurement methods, and these persons estimated the usefulness of the information obtained as very high. The user clearly assessed the usefulness as well as the profitability of such a system very positively. The profitability of such a system is particularly visible when compared to existing large databases that collect all available information a priori and generate conclusions based on comparative analysis. Without certainty as to the quality of the data, conclusions drawn even on the basis of complex comparison algorithms often lead not only to the lack of effect in the form of removing the source of the problem but also often generate additional costs.
For the example mentioned in this article, previous analyses showed that the source of the problem was technical failures, and, therefore, constant work was carried out to change sensors, cabling and modernize mechanical elements. The analysis using the described system showed that in the area of interest to the organization, technical failures do not play a role at all. Therefore, before using the system, the nature of production problems had not been identified, which resulted in not only financial losses but also material ones.
The system developed and presented in this work is not a closed system but is being prepared for development. The survey, which is the first stage of monitoring, contains space for comments from decision makers at each of its points. This is the most important source for obtaining information, also regarding the direction in which the survey should be developed. The structure of the survey itself does not limit the inclusion of further areas to be described by the interested company. There are no restrictions if the user would like to monitor the supply or consumption of energy, waste management or, for example, environmental protection. Moreover, because the second stage is created on the basis of the first stage, the development of the areas and structure of the survey directly affects the development of the data acquisition, collection and analysis system itself. The equipment used in the second stage, i.e., in the data acquisition process itself, has basically no structural limitations because infinite numbers of variables are not collected, so you can easily prepare special transducer modules, which, in addition to binary variables, can record continuous variables in virtually the full range of available transducers of physical quantities. In this way, one can, for example, link production safety with the hall temperature, air humidity, sunlight or, for example, the mass of the input material. As may be observed, such physical quantities are never directly related to the production lines or devices used, and, often, their impact is, on the one hand, significant, and on the other hand, the change in these parameters is often not related to the production technology.
This system has another feature that was not taken into account when it was created. Namely, the data determined and collected in this way, which strongly influence the production process, are an invaluable source not only for current production safety but also for the development of the company. Determining the factors influencing production allows you to:
- -
- Check whether these parameters do not change over time after months or years or what their impact on change is;
- -
- Determine actual production possibilities, which, in turn, translates into better investment planning and profitability estimation.
To sum up, the system has proven its usefulness, and its functioning may be subject to further development and improvements.
Treating safety as a state without threats, we can never talk about complete production safety. However, the proposed system is an alternative to systems based on big data analyses. Ultimately, it is intended to enable analysis of the connections between the state of the work environment and production efficiency. However, due to lower costs and ease of implementation, it can already support small- and medium-sized enterprises. This is also an important improvement for eliminating disruptions and, subsequently, for implementing sustainable production management in SMEs.
At the same time, the authors are aware that results based on one example have their limitations. These include a lack of representativeness of the wider business population. Moreover, subjectivity may be a major limitation of the conducted research [25,26]. However, based on examples of specific enterprises, it is possible to take a closer look at their functioning than in the case of statistical research. This approach also allows for building researchers’ involvement in the problem, and by looking at the problem existing in the real world, it provides practical insights that allow for building a bridge between practice and management theory [27,28].
5. Conclusions
In the era of rapidly changing conditions at both the strategic and operational levels, addressing the issue of production disruptions allowed us to present a new system for collecting and analyzing production downtime. The data presented as part of the case study confirmed that enterprises lack knowledge about the causes of disruptions, and management’s assumptions are not always correct. The presented system (machine plus survey as an element of the procedure for identifying the existing condition) is not only a competitive proposition for complex big data analyses but also allows for limiting unsuccessful investments and eliminating material and financial losses.
The research conducted based on the case study method is characterized by typical limitations for this research method. As a result, further research using the described system and its improvements is planned. It was also shown that the analysis of disruptions in production systems does not always have to be related to big data analysis, because for many enterprises this will not be possible, for example, due to the costs incurred. As a result, without thorough analyses, they may draw incorrect conclusions about production inefficiencies, which will ultimately make it impossible to move towards sustainable development.
Supplementary Materials
The following supporting information can be downloaded at: https://www.mdpi.com/article/10.3390/su16125189/s1, File S1: Company X’s research survey—Card for analyzing the scope of monitoring line parameters, for assessing the impact on productivity.
Author Contributions
Conceptualization, A.S.-P. and P.K.; methodology, P.K. and A.S.-P.; software, P.K.; validation, A.S.-P., P.K. and K.L.; formal analysis, A.S.-P. and P.K.; investigation, P.K.; resources, A.S.-P., P.K. and K.L.; data curation, P.K. and A.S.-P.; writing—original draft preparation, P.K., K.L. and A.S.-P.; writing—review and editing, A.S.-P. and P.K.; visualization, P.K. and A.S.-P.; supervision, A.S.-P.; project administration, A.S.-P. All authors have read and agreed to the published version of the manuscript.
Funding
This research was co-financed by the Faculty of Engineering Management of the Poznań University of Technology (0811/SBAD/1056).
Institutional Review Board Statement
Not applicable.
Informed Consent Statement
Not applicable.
Data Availability Statement
The data presented in this study are available on request from the corresponding author.
Conflicts of Interest
The authors declare no conflicts of interest.
References
- Fechete, F.; Nedelcu, A. Performance Management Assessment Model for Sustainable Development. Sustainability 2019, 11, 2779. [Google Scholar] [CrossRef]
- United Nations. Resolution Adopted by the General Assembly on 25 September 2015. Available online: https://www.un.org/en/development/desa/population/migration/generalassembly/docs/globalcompact/A_RES_70_1_E.pdf (accessed on 1 March 2024).
- United Nations. Transforming Our World: The Agenda 2030 for Sustainable Development. Available online: https://sdgs.un.org/2030agenda (accessed on 1 February 2024).
- Skiter, N.N.; Rogachev, A.F.; Ketko, N.V.; Simonov, A.B.; Tarasova, I.A. Sustainable Development of Enterprises in Conditions of Smart Ecology: Analysis of The Main Problems and Development of Ways to Solve Them, Based on Artificial Intelligence Methods and Innovative Technologies. Front. Environ. Sci. 2022, 10, 892222. [Google Scholar] [CrossRef]
- Kampania 17 Celów, Agenda 2030. Available online: https://kampania17celow.pl/agenda-2030 (accessed on 1 March 2024).
- Trane, M.; Marelli, L.; Siragusa, A.; Pollo, R.; Lombardi, P. Progress by Research to Achieve the Sustainable Development Goals in the EU: A Systematic Literature Review. Sustainability 2023, 15, 7055. [Google Scholar] [CrossRef]
- Stasiuk-Piekarska, A.K.; Wyrwicka, M.K.; Hadaś, Ł. Ryzyko Organizacyjne w Produkcji; Publisher Poznan University of Technology: Poznań, Poland, 2020; Available online: http://wydawnictwo.put.poznan.pl/books/isbn_978-83-7775-613-3 (accessed on 8 March 2024).
- Lee, J.; Lapira, E.; Bagheri, B.; Kao, H. Recent advances and trends in predictive manufacturing systems in big data environment. Manuf. Lett. 2013, 1, 38–41. [Google Scholar] [CrossRef]
- Polska, H.R. Będziemy Zmieniać Pracę Nawet co Rok. Available online: https://hrpolska.pl/rynek-pracy/trendy/bedziemy-zmieniac-prace-nawet-co-rok (accessed on 1 March 2024).
- Al-suraihi, W.; Siti, A.; Al-Suraihi, A.; Samikon, S.A. Employee Turnover: Causes, Importance and Retention Strategies. Eur. J. Bus. Manag. Res. 2021, 6, 10. [Google Scholar] [CrossRef]
- Moon, K. Exit Line. The Effects of Employee Turnover on Manufacturing. 2018. Available online: https://knowledge.wharton.upenn.edu/podcast/knowledge-at-wharton-podcast/effects-of-employee-turnover-on-manufacturing/ (accessed on 17 May 2024).
- Lancaster, L.; Status, H.R. Effects of High Employee Turnover. 2023. Available online: https://stratus.hr/resources/effects-of-high-employee-turnover (accessed on 18 May 2024).
- Wyczewska, E.; Stadnicka, D. Value Stream Mapping and Process Indicators Supporting Sustainable Development in Organizations—A Systematic Literature Review. In Intelligent Systems in Production Engineering and Maintenance III. ISPEM 2023. Lecture Notes in Mechanical Engineering; Burduk, A., Batako, A.D.L., Machado, J., Wyczółkowski, R., Dostatni, E., Rojek, I., Eds.; Springer: Cham, Switzerland, 2024. [Google Scholar] [CrossRef]
- Available online: https://www.leanmanufacture.net/operations/productiondata/ (accessed on 11 April 2024).
- Available online: https://www.marposs.com/ita/data-collection-manufacturing-process (accessed on 11 April 2024).
- Bruno, S. Silvestre, Diana Mihaela Ţîrcă, Innovations for sustainable development: Moving toward a sustainable future. J. Clean. Prod. 2019, 208, 325–332. [Google Scholar]
- Cochan, D.S.; Kinard, D.; Bi, Z. Manufacturing System Design Meets Big Data Analytics for Continuous Improvement. Procedia CIRP 2016, 50, 647–652. [Google Scholar] [CrossRef][Green Version]
- Cui, Y.; Kara, S.; Chan, K.C. Manufacturing big data ecosystem: A systematic literature review. Robot. Comput.-Integr. Manuf. 2020, 62, 101861. [Google Scholar] [CrossRef]
- Jabbarzadeh, A.; Fahimnia, B.; Sabouhi, F. Resilient and sustainable supply chain design: Sustainability analysis under disruption risks. Int. J. Prod. Res. 2018, 56, 5945–5968. [Google Scholar] [CrossRef]
- Zavala-Alcívar, A.; Verdecho, M.-J.; Alfaro-Saiz, J.-J. A Conceptual Framework to Manage Resilience and Increase Sustainability in the Supply Chain. Sustainability 2020, 12, 6300. [Google Scholar] [CrossRef]
- Luangkesorn, K.L.; Klein, G.; Bidanda, B. Analysis of production systems with potential for severe disruptions. Int. J. Prod. Econ. 2016, 171, 478–486. [Google Scholar] [CrossRef]
- Wang, J.; Xu, C.; Zhang, J.; Zhong, R. Big data analytics for intelligent manufacturing systems: A review. J. Manuf. Syst. 2022, 62, 738–752. [Google Scholar] [CrossRef]
- Azeem, M.; Haleem, A.; Bahl, S.; Javaid, M.; Suman, R.; Nandan, D. Big data applications to take up major challenges across manufacturing industries: A brief review. Mater. Today Proc. 2022, 49, 339–348. [Google Scholar] [CrossRef]
- Rzeszotarska-Wyrwicka, M. Organizowanie Systemów Pracy. Materiały Pomocnicze; Publisher Poznan University of Technology: Poznań, Poland, 1998. [Google Scholar]
- Hecker, J.; Kalpokas, N. The Ultimate Guide to Qualitative Research—Part 1: The Basics. Available online: https://atlasti.com/guides/qualitative-research-guide-part-1/case-studies (accessed on 11 April 2024).
- Wünsch Takahashi, A.R.; Araujo, L. Case study research: Opening up research opportunities. RAUSP Manag. J. 2020, 55, 100–111. Available online: https://www.emerald.com/insight/content/doi/10.1108/RAUSP-05-2019-0109/full/html (accessed on 11 April 2024). [CrossRef]
- Cote, C. 5 Benefits of Learning through the Case Study Method. Available online: https://online.hbs.edu/blog/post/case-study-method (accessed on 11 April 2024).
- Yin, R.K. Case Study Research and Application. Design and Methods, 6th ed.; COSMOS Corporation: St Peters, MO, USA, 2017. [Google Scholar]


Disclaimer/Publisher’s Note: The statements, opinions and data contained in all publications are solely those of the individual author(s) and contributor(s) and not of MDPI and/or the editor(s). MDPI and/or the editor(s) disclaim responsibility for any injury to people or property resulting from any ideas, methods, instructions or products referred to in the content. |
© 2024 by the authors. Licensee MDPI, Basel, Switzerland. This article is an open access article distributed under the terms and conditions of the Creative Commons Attribution (CC BY) license (https://creativecommons.org/licenses/by/4.0/).