
The Impact of New-Type Urbanization Policy on Urban Green Total Factor Productivity: New Evidence from China


Abstract
:1. Introduction
2. Literature Review
3. Hypotheses Development
4. Research Design
4.1. Model Design
4.2. Variables
4.2.1. Explanatory Variable
4.2.2. Core Explanatory Variables
4.2.3. Influencing Mechanism Variables
4.2.4. Control Variables
5. Results and Discussion
5.1. Benchmark Regression
5.2. Parallel Trend Test
5.3. Robustness Test
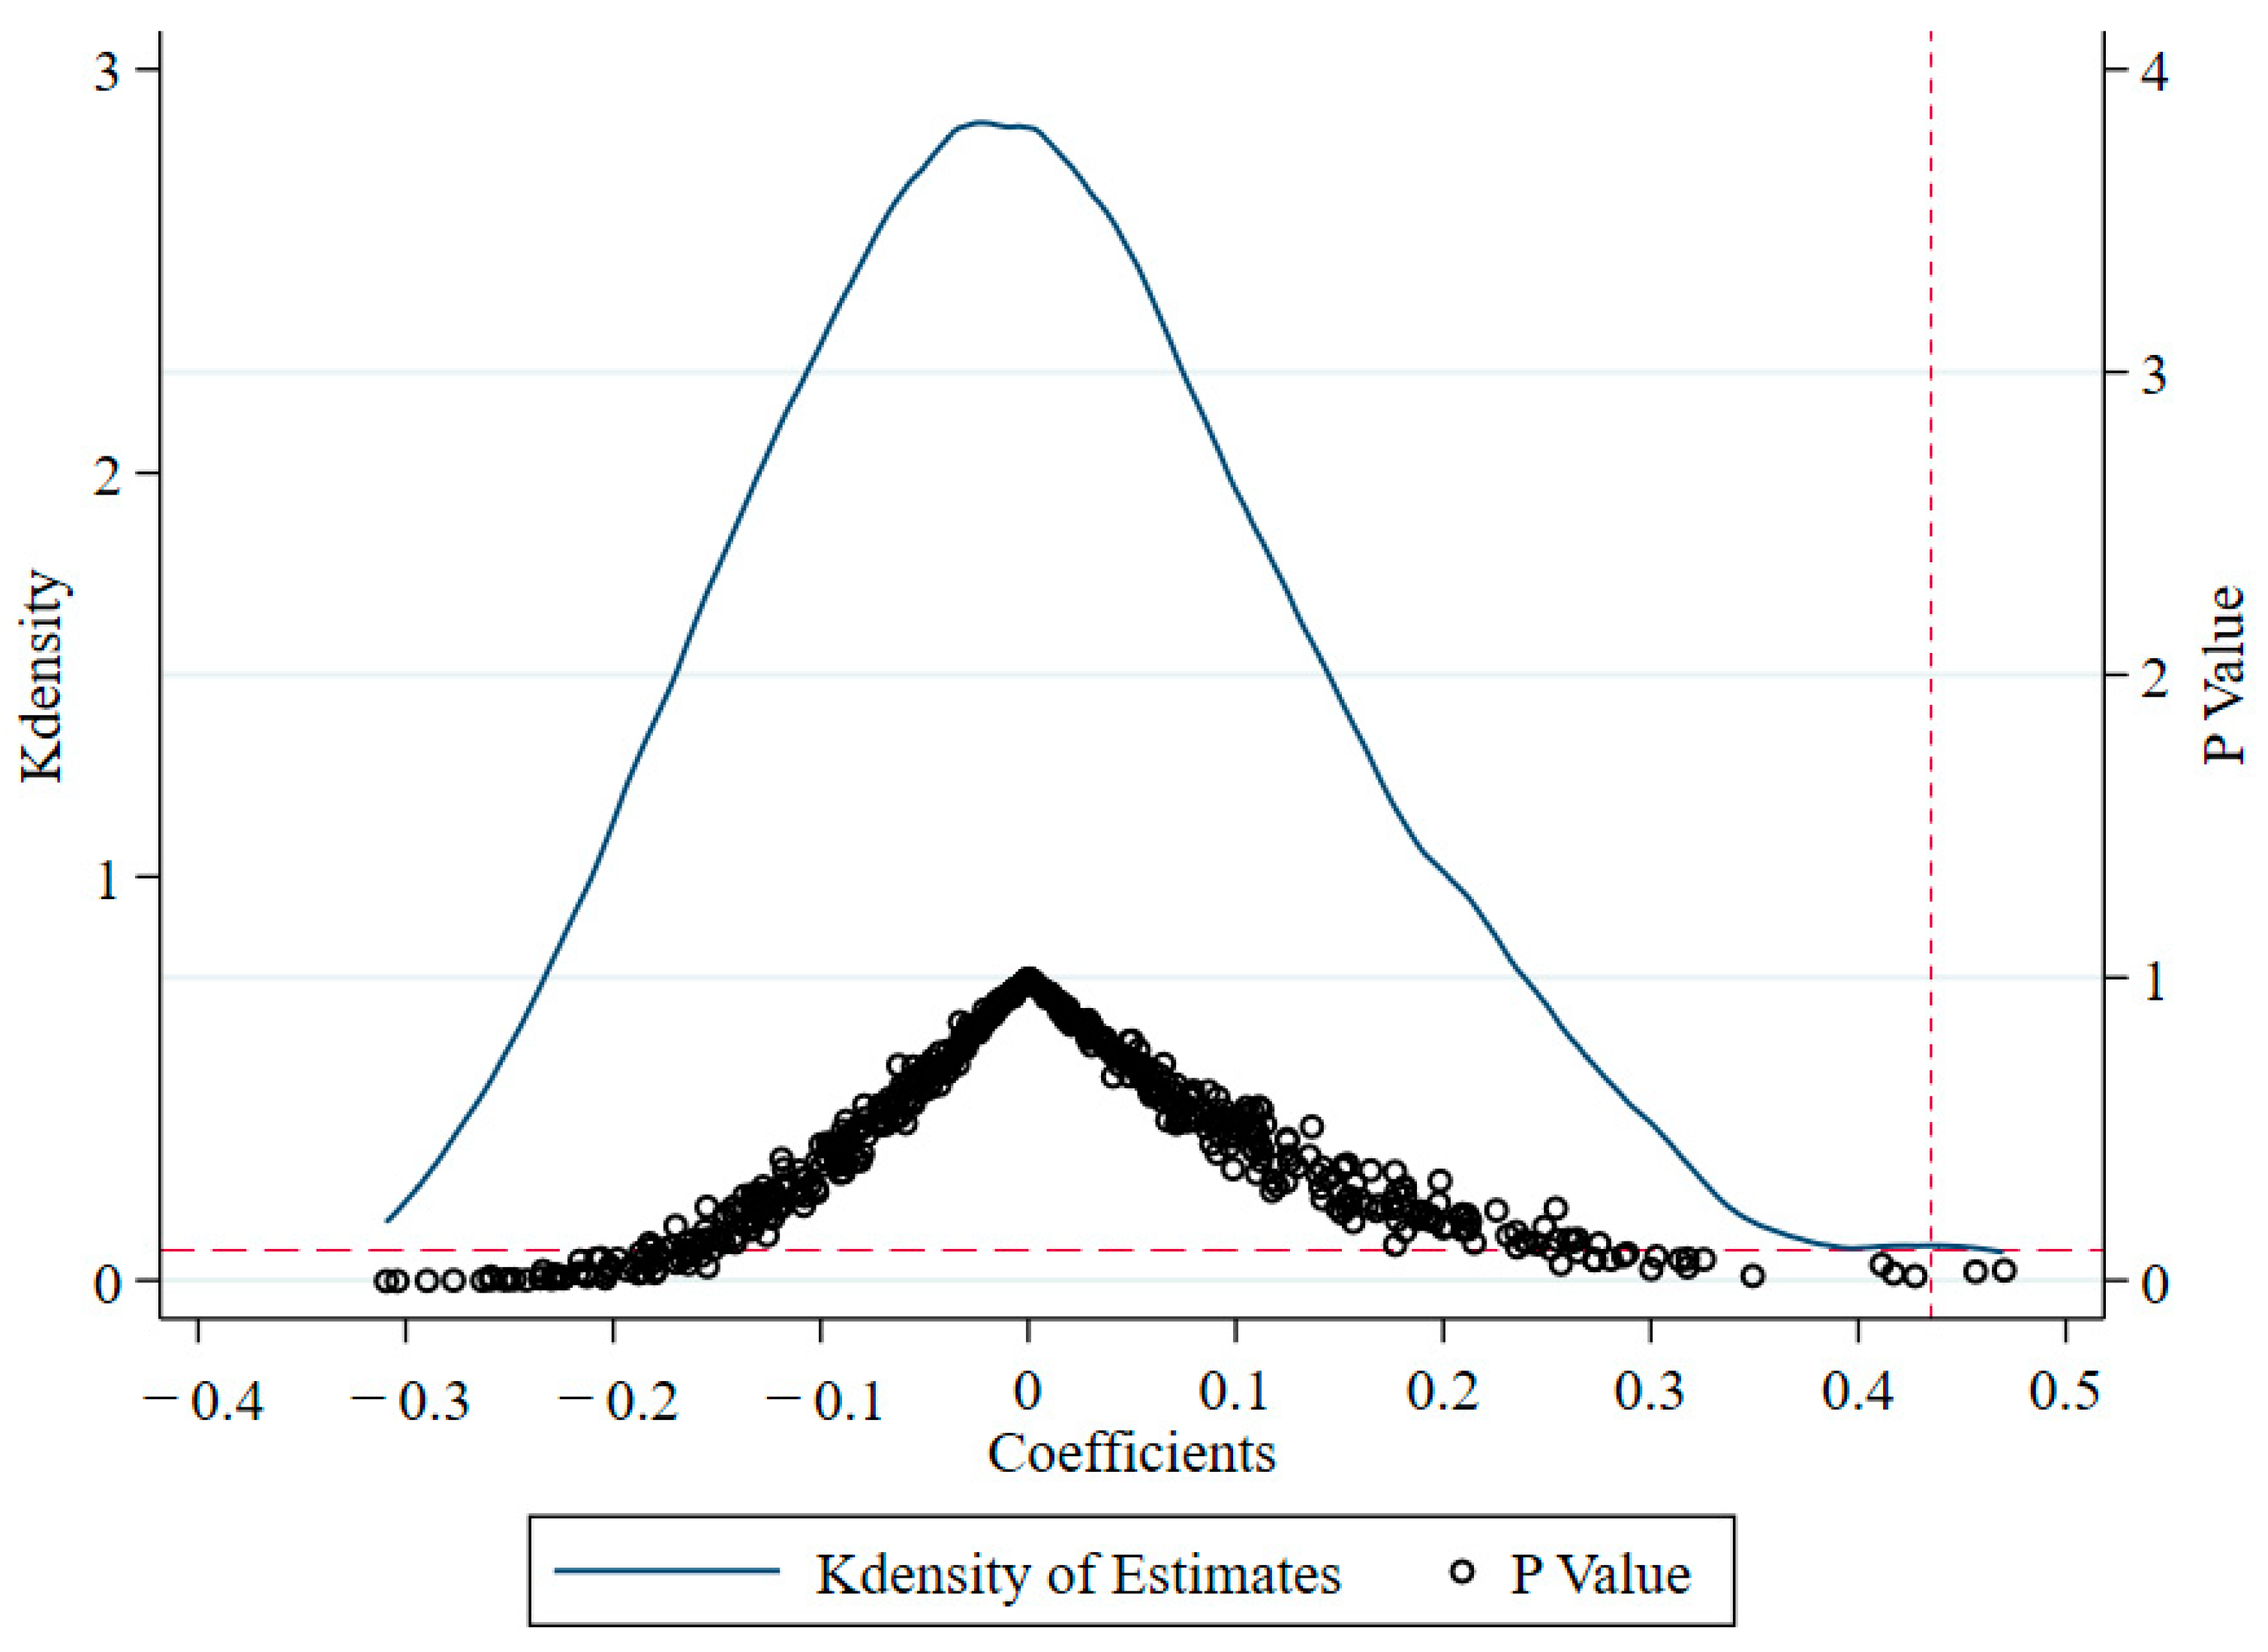
5.3.1. Placebo Test
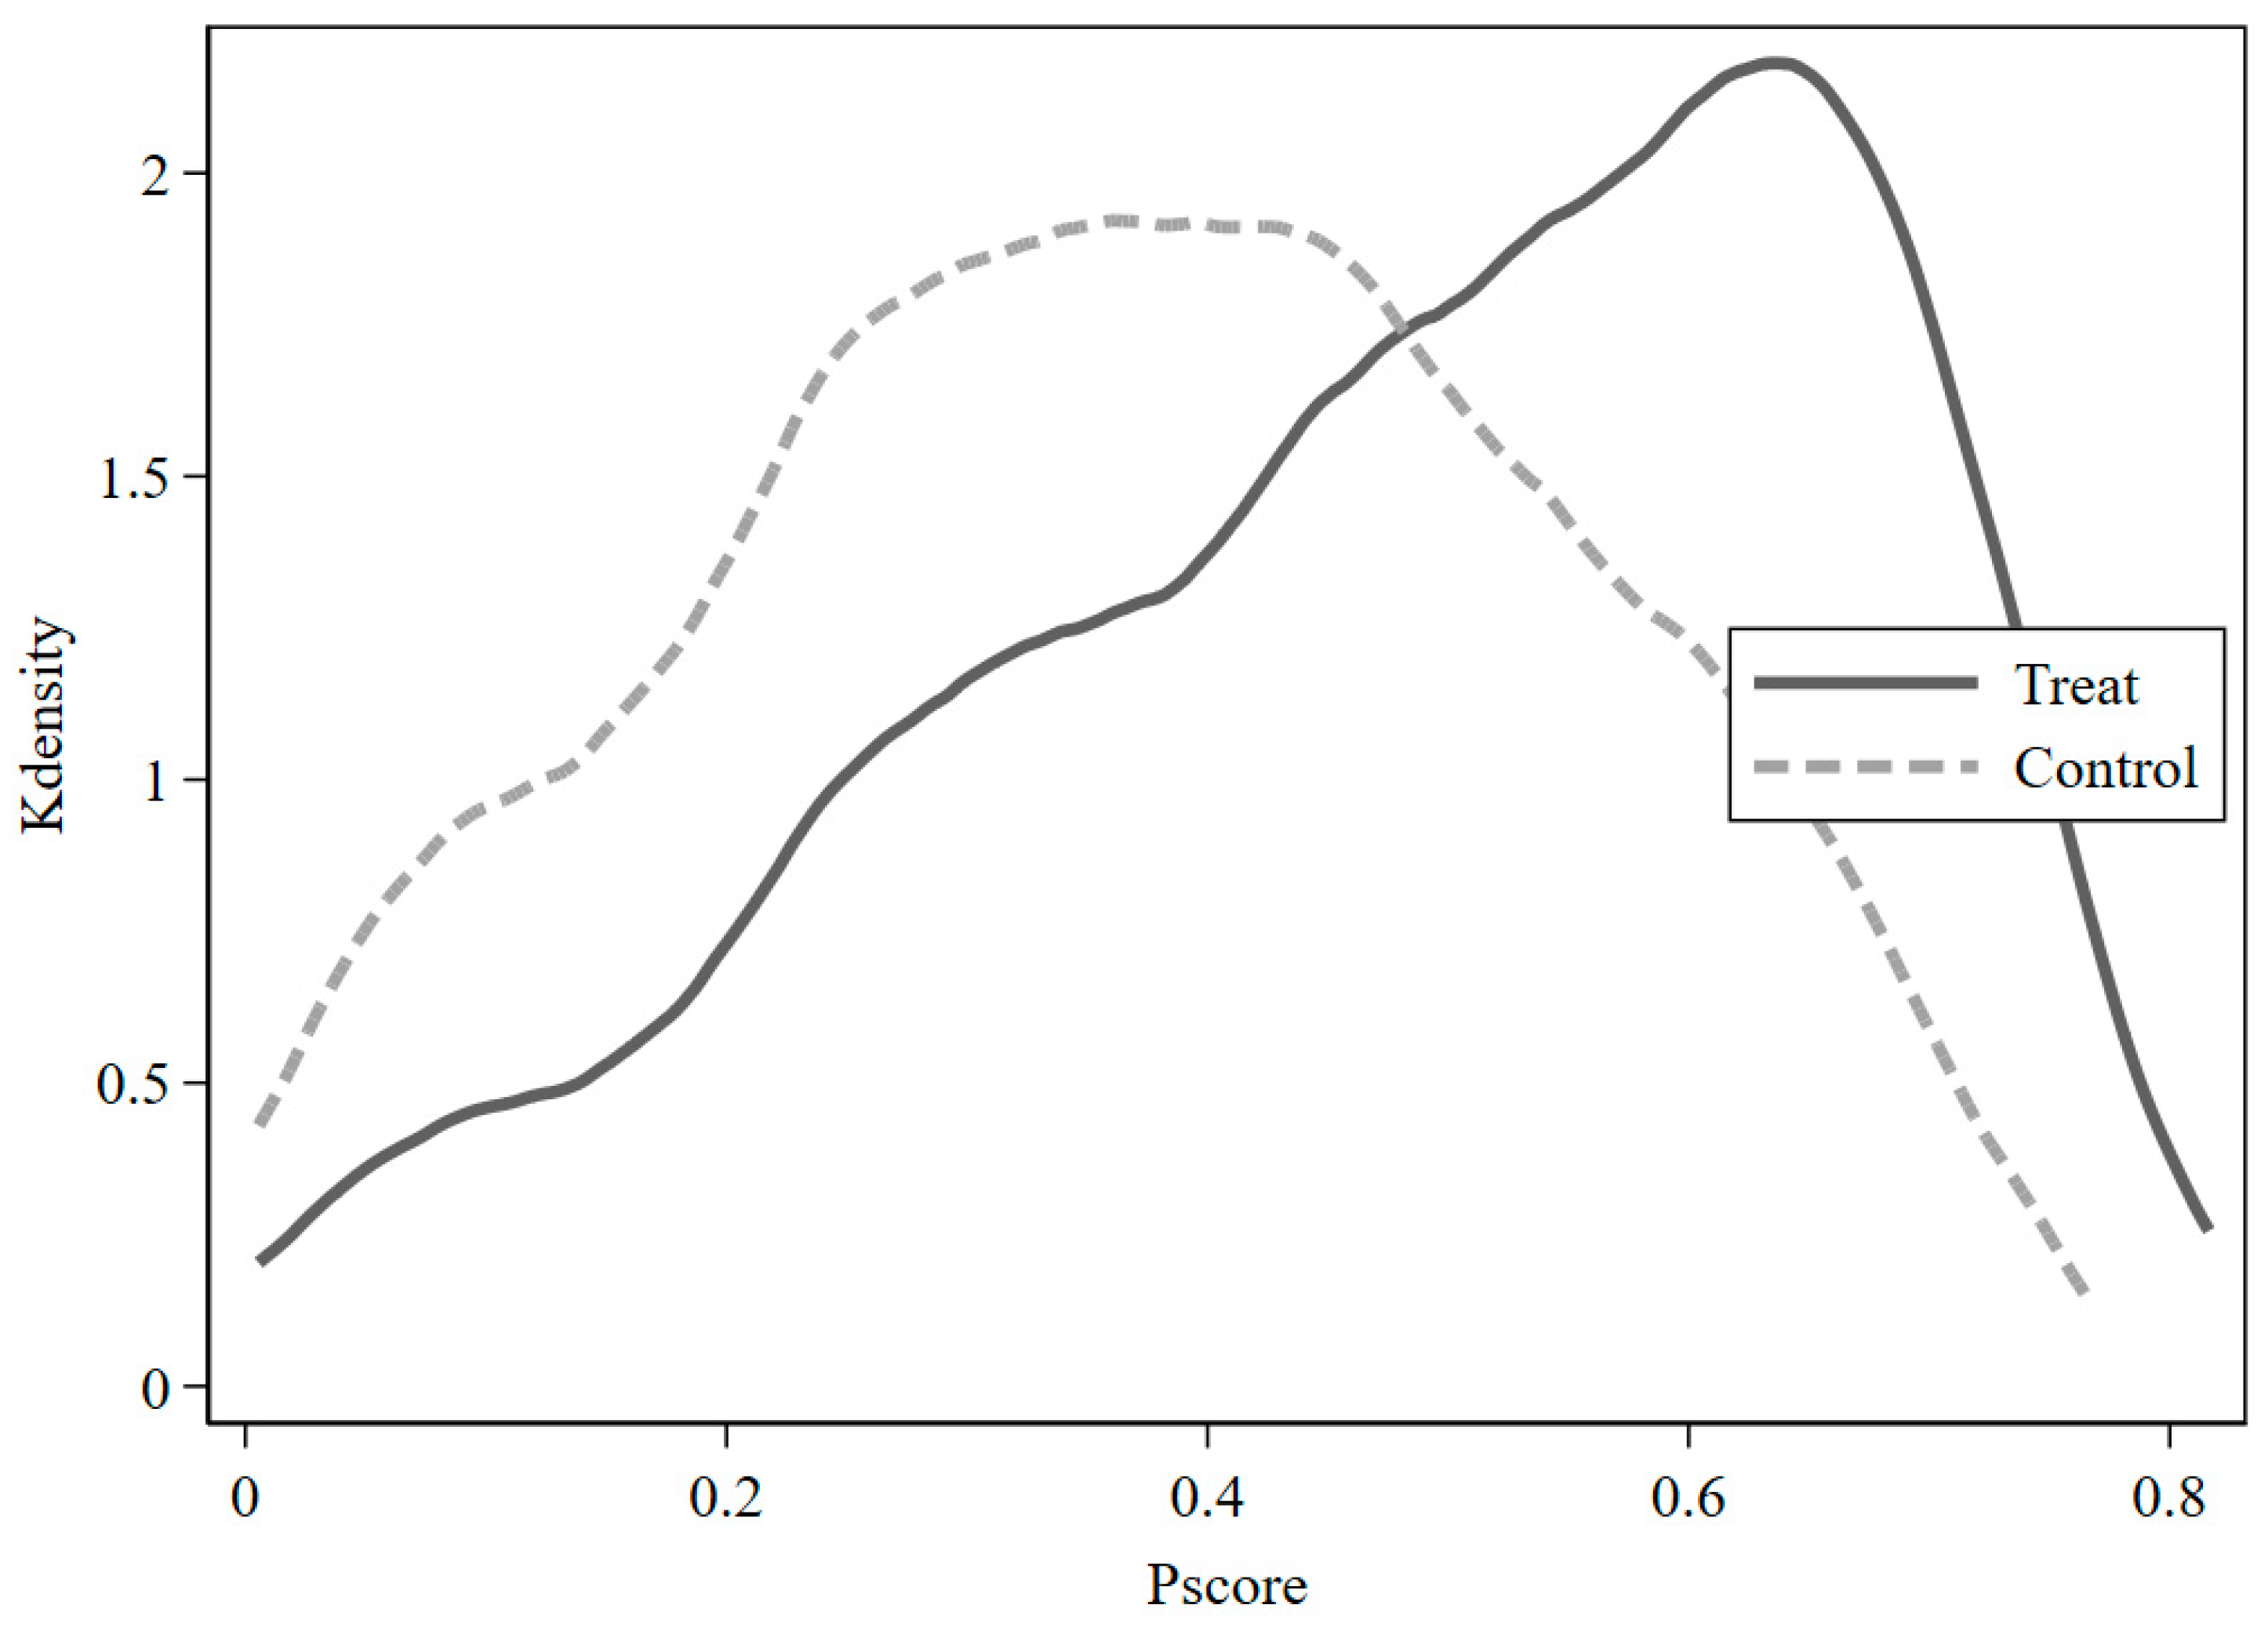
5.3.2. PSM-DID Test
5.3.3. Change in the Sample Interval
5.3.4. Adjustment of Time Window Width
5.4. Influence Path Test
5.5. Heterogeneity Tests
5.5.1. Heterogeneity Test of Urban Agglomerations
5.5.2. Testing the Heterogeneity of Urban Characteristics
5.6. International Comparison
6. Conclusions and Policy Implications
Author Contributions
Funding
Institutional Review Board Statement
Informed Consent Statement
Data Availability Statement
Conflicts of Interest
Appendix A

| Pilot Cities | Non-Pilot Cities |
|---|---|
| Shijiazhuang, Dalian, Changchun, Jilin, Harbin, Qiqihar, Mudanjiang, Nanjing, Wuxi, Xuzhou, Changzhou, Suzhou, Nantong, Lianyungang, Huai’an, Yancheng, Yangzhou, Zhenjiang, Taizhou, Suqian, Ningbo, Jiaxing, Hefei, Wuhu, Bengbu, Huainan, Ma’anshan, Huaibei, Anqing, Huangshan, Chuzhou, Suzhou, Lu’an, Chizhou, Putian, Ying-tan, Tongling, Qingdao, Weihai, Dezhou, Luoyang, Wuhan, Xiaogan, Changsha, Zhu-zhou, Guangzhou, Huizhou, Dongguan, Liuzhou, Bozhou, Fuyang, Laibin, Luzhou, Anshun, Qujing, Jinchang, Guyuan, Xuancheng | Chengde, Cangzhou, Langfang, Hengshui, Taiyuan, Yangquan, Changzhi, Shuozhou, Yuncheng, Xinzhou, Wuhai, Ulanqab, Fugu, Dandong, Jinzhou, Ying-kou, Fuxin, Liaoyang, Panjin, Tieling, Chaoyang, Huludao, Liaoyuan, Songyuan, Baicheng, Jixi, He-gang, Shuangyashan, Daqing, Qitaihe, Hangzhou, Wenzhou, Zhoushan, Lishui, Xiamen, Jingdezhen, Jiujiang, Xinyu, Shangrao, Zaozhuang, Dongying, Tai’an, Rizhao, Liaocheng, Binzhou, Pingdingshan, Jiaozuo, Sanmenxia, Nanyang, Shangqiu, Zhumadian, Shiyan, Ezhou, Huanggang, Zhoukou, Luohe, Xianning, Hengyang, Xinyang, Shaoyang, Yueyang, Zhangjiajie, Yiyang, Loudi, Zhuhai, Shan-tou, Anyang, Jiangmen, Zhanjiang, Meizhou, Shanwei, Heyuan, Guigang, Qingyuan, Zhongshan, Jieyang, Nanning, Wuzhou, Beihai, Fangchenggang, Hezhou, Hechi, Panzhihua, Guangyuan, Chongzuo, Neijiang, Leshan, Yibin, Guang’an, Ya’an, Ziyang, Kunming, Yuxi, Zhaotong, Pu’er, Lincang, Tongchuan, Baoji, Deyang, Xianyang, Hanzhong, Ankang, Lanzhou, Jiayuguan, Wuwei, Pingliang, Urumqi |
References
- National Bureau of Statistics. Available online: https://www.gov.cn/guoqing/2021-05/13/content_5606149.htm (accessed on 9 December 2021).
- Li, Q.; Chen, Y.L.; Liu, J.M. On the “development mode” of Chinese urbanization. Soc. Sci. China 2012, 7, 82–100. [Google Scholar]
- Yao, S.M.; Zhang, P.Y.; Yu, C.; Li, G.Y.; Wang, C.X. The theory and practice of new urbanization in China. Sci. Geogr. Sin. 2014, 34, 641–647. [Google Scholar] [CrossRef]
- Zhu, X.H.; Zhang, P.F.; Wei, Y.G.; Li, Y.; Zhao, H.R. Measuring the efficiency and driving factors of urban land use based on the DEA method and the PLS-SEM model—A case study of 35 large and medium-sized cities in China. Sustain. Cities Soc. 2019, 50, 101646. [Google Scholar] [CrossRef]
- Cai, N.; Cong, Y.J.; Wu, J.W. Green development and new urbanization of China: A dual-dimensional analysis based on SBM-DDF model. J. Beijing Norm. Univ. (Soc. Sci.) 2014, 5, 130–139. [Google Scholar]
- Wei, Y.G.; Huang, C.; Lam, P.T.; Yuan, Z.Y. Sustainable urban development: A review on urban carrying capacity assessment. Habitat Int. 2015, 46, 64–71. [Google Scholar] [CrossRef]
- Liu, X.Q.; Wojewodzki, M.; Cai, Y.F.; Sharma, S. The dynamic relationships between carbon prices and policy uncertainties. Technol. Forecast. Soc. Chang. 2023, 188, 122325. [Google Scholar] [CrossRef]
- National New-Type Urbanization Plan (2014–2020). Available online: https://www.gov.cn/gongbao/content/2014/content_2644805.htm (accessed on 16 March 2022).
- Ren, N.; Zhao, R. Analysis on the Connotation Evolution, Constraints and Policy Recommendations of China’s New-Type Urbanization. Reg. Econ. Rev. 2022, 57–65. [Google Scholar] [CrossRef]
- Outline of the 14th Five Year Plan for National Economic and Social Development of the People’s Republic of China and the Long Range Objectives for 2035. Available online: https://www.gov.cn/xinwen/2021-03/13/content_5592681.htm (accessed on 13 March 2021).
- Solow, R.M. Technical change and the aggregate production function. Rev. Econ. Stat. 1957, 39, 312–320. [Google Scholar] [CrossRef]
- Wei, Y.G.; Li, Y.; Wu, M.Y.; Li, Y.B. Progressing sustainable development of “the Belt and Road countries”: Estimating environmental efficiency based on the Super-slack-based measure model. Sustain. Dev. 2020, 28, 521–539. [Google Scholar] [CrossRef]
- Zhan, Y.; Li, S. Smart city construction, entrepreneurial vitality and high-quality economic development: Analysis based on the GTFP perspective. J. Financ. Econ. 2022, 48, 4–18. [Google Scholar] [CrossRef]
- Wei, Y.G.; Li, Y.; Liu, X.J.; Wu, M. Sustainable development and green GDP assessments in mega-cities based on the energy analysis method—A case study of Wuhan. Sustain. Dev. 2019, 28, 294–307. [Google Scholar] [CrossRef]
- Wang, Y.F.; Tao, W.Q. Influence and effect of China’s pilot low-carbon city initiative on urban green total factor productivity growth. China Popul. Resour. Environ. 2021, 31, 78–89. [Google Scholar] [CrossRef]
- Li, S.S.; Wang, Y.Y.; Dincer, H.; Yuksel, S.; Yu, D.Y. The Effects of New Urbanization Pilot City Policies on Urban Innovation: Evidence from China. Sustainability 2023, 15, 11352. [Google Scholar] [CrossRef]
- Shang, J.; Liao, Z.Z. The impact of new urbanization on green total factor productivity. Stat. Decis. 2021, 37, 116–119. [Google Scholar] [CrossRef]
- Jiang, A.Y.; Yang, Z.L. New urbanization construction and high-quality urban economic growth: An empirical analysis based on the double difference method. Inq. Into Econ. Issues 2020, 3, 84–99. [Google Scholar]
- Cheng, K.M.; Wang, G.M. Urbanization, industrial structure upgrading and high-quality economic development—Test of mediation effect based on spatial Durbin model. Syst. Eng.-Theory Pract. 2023, 43, 648–666. [Google Scholar] [CrossRef]
- Gao, Z.G.; Ren, Y.Y.; Han, Y.L. Theoretical interpretation and empirical test of new urbanization promoting economic high-quality development. Reg. Econ. Rev. 2022, 5, 58–69. [Google Scholar] [CrossRef]
- Chen, H.B.; Jiang, N.N.; Liu, J. The impact of pilot policies for new urbanization on regional ecological environment—Empirical testing based on PSM-DID. Urban Probl. 2020, 6, 33–41. [Google Scholar]
- Fan, X.R.; Zhang, K.H.; Zhao, X.L. Research on the impact of new urbanization on urban energy efficiency. J. Ind. Technol. Econ. 2022, 41, 130–136. [Google Scholar]
- Feng, Y.D.; Yuan, H.X.; Liu, Y.B. Mechanisms for improving urban energy use efficiency in China’s new-type urbanization construction. China Popul. Resour. Environ. 2023, 33, 138–148. [Google Scholar] [CrossRef]
- Zhang, D.L.; Wang, Y.X.; Liu, M. The policy driving effect of new urbanization on the efficiency of green land use in cities—Empirical testing based on 280 prefecture level cities. Urban Probl. 2022, 4, 45–54. [Google Scholar] [CrossRef]
- Chen, M.X.; Ye, C.; Lu, D.D.; Sui, Y.W.; Guo, S.S. Cognition and construction of the theoretical connotations of new urbanization with Chinese characteristics. J. Geogr. Sci. 2019, 29, 1681–1698. [Google Scholar] [CrossRef]
- Liu, J.; Zhang, X.L.; Chen, H.B. The impact of urban population agglomeration on the high-quality economic development in the Yangtze River Delta. East China Econ. Manag. 2022, 36, 12–20. [Google Scholar] [CrossRef]
- Zhang, Y.Y.; Wei, Y.G.; Zhang, J. Overpopulation and urban sustainable development—Population carrying capacity in Shanghai based on probability-satisfaction evaluation method. Environ. Dev. Sustain. 2021, 23, 3318–3337. [Google Scholar] [CrossRef]
- Sun, H.; Zhu, Q.Q. The research on the effection of Chinese resources industry agglomeration on total factor productivity growth. China Popul. Resour. Environ. 2016, 26, 121–130. [Google Scholar] [CrossRef]
- Tian, X.; Li, R. Digital technology empowers the transformation and development of real economy: An analysis framework based on Schumpeter’s endogenous growth theory. Manag. World 2022, 5, 56–74. [Google Scholar] [CrossRef]
- He, X.L.; Zhang, Z.Y. Exploration on the distribution of economic activity: Technology spillover, environmental pollution and trade liberalization. Sci. Geogr. Sin. 2015, 35, 161–167. [Google Scholar] [CrossRef]
- Cheng, K.M. Urbanization, technology innovation and economic growth. Stat. Res. 2009, 26, 40–46. [Google Scholar]
- Lu, J.; Li, T.T. Industrial structure, technological innovation and green total factor productivity: Research in the perspective of heterogeneity. Chin. J. Popul. Sci. 2021, 1, 86–97+128. [Google Scholar]
- Liu, F.H.; Liang, M. New Urbanization, Human Capital and Industrial Structure Upgrading: Based on the Moderating Effect of Population Aging. J. Soc. Sci. Hunan Norm. 2021, 50, 46–55. [Google Scholar] [CrossRef]
- Nie, C.F.; Lu, J.X.; Feng, Y.; Hu, Z.L. Impact of innovative city construction on green total factor productivity. China Popul. Resour. Environ. 2021, 31, 117–127. [Google Scholar]
- Sun, Y.F.; Xia, Q.; Zhou, M. The economic growth effects of new urbanization development and industrial structure change. J. Quant. Technol. Econ. 2016, 33, 23–40. [Google Scholar] [CrossRef]
- Wojewodzki, M.; Wei, Y.; Cheong, T.S.; Shi, X. Urbanisation, agriculture and convergence of carbon emissions nexus: Global distribution dynamics analysis. J. Clean. Prod. 2023, 385, 135697. [Google Scholar] [CrossRef]
- Liu, Y.S.; Tian, Y.H.; Luo, Y. Upgrading of industrial structure, energy efficiency, green total factor productivity. Theory Pract. Financ. Econ. 2018, 39, 118–126. [Google Scholar] [CrossRef]
- Li, S. Study on the impact of industrial structure Adjustment on green total factor Productivity. Price Theory Pract. 2021, 4, 67–70+170. [Google Scholar] [CrossRef]
- Zhang, F.; Shi, Z.K.; Wu, G. The impact of digital economy and environmental regulation on green total factor productivity. Nanjing J. Soc. Sci. 2022, 6, 12–20. [Google Scholar] [CrossRef]
- Wen, H.W.; Zhou, F.X. Environmental regulation and the green total factor productivity in China’s provinces: Evidence from the adjustment of pollution charges standard. J. Arid Land Resour. Environ. 2019, 33, 9–15. [Google Scholar] [CrossRef]
- National Comprehensive Pilot Plan. Available online: https://www.gov.cn/xinwen/2015-02/04/content_2814341.htm (accessed on 29 December 2021).
- Chen, L. Natural Monopoly and Mixed Ownership Reform—Based on Natural Experiment and Cost Function Analysis Method. Econ. Res. J. 2018, 13, 60–83. [Google Scholar]
- Chen, C.F. China’s industrial green total factor productivity and its determinants—An empirical study based on ml index and dynamic panel data model. Stat. Res. 2018, 33, 53–62. [Google Scholar] [CrossRef]
- Zhang, J.; Wu, G.Y.; Zhang, J.P. The estimation of China’s provincial capital stock: 1952–2000. Econ. Res. J. 2004, 10, 35–44. [Google Scholar]
- Gan, C.H.; Zheng, R.G.; Yu, D.F. An empirical study on the effects of industrial structure on economic growth and fluctuations in China. Econ. Res. J. 2011, 46, 4–16. [Google Scholar]
- Liu, W.; Zhang, H.; Huang, Z.H. An investigation into the height of China’s industrial structure, industrialization process, and regional differences. Econ. Perspect. 2008, 11, 4–8. [Google Scholar]
- Li, G.Z.; Li, X.Z. Environmental regulation, industrial structure upgrading and high-quality economic development: A case study of the Beijing Tianjin Hebei region. Stat. Decis. 2022, 38, 26–31. [Google Scholar] [CrossRef]
- Beck, T.; Levine, R.; Levkov, A. Big bad banks? The winners and losers from bank deregulation in the United States. J. Financ. 2010, 65, 1637–1667. [Google Scholar] [CrossRef]
- Zhou, Y.H.; Yang, Z.Z. Does internet use promote rural residents’ consumption: Based on the survey of 739 farmers in Jiangxi Province. Econ. Geogr. 2021, 41, 224–232. [Google Scholar] [CrossRef]
- Xie, S.X.; Fan, P.F.; Wan, Y.Y. Improvement and application of classical PSM-DID model. Stat. Res. 2021, 38, 146–160. [Google Scholar] [CrossRef]
- Cheong, T.S.; Wu, Y.; Wojewodzki, M.; Ma, N. The impacts of globalization on inequality in the post-covid-19 world: Evidence from China. Front. Public Health 2021, 9, 790312. [Google Scholar] [CrossRef]
- Jiang, T. Mediating effects and moderating effects in causal inference. China Ind. Econ. 2022, 5, 100–120. [Google Scholar] [CrossRef]
- Wen, Z.L.; Ye, B.J. Analyses of mediating effects: The development of methods and models. Adv. Psychol. Sci. 2014, 22, 731. [Google Scholar] [CrossRef]
- Secure a Decisive Victory in Building a Moderately Prosperous Society in All Respects and Strive for the Great Success of Socialism with Chinese Characteristics for a New Era-Delivered at the 19th National Congress of the Communist Party of China. Available online: https://www.gov.cn/zhuanti/2017-10/27/content_5234876.htm (accessed on 18 October 2022).
- Ouyang, X.; Zhu, X. Spatio-temporal characteristics of urban land expansion in Chinese urban agglomerations. Acta Geogr. Sin. 2020, 75, 571–588. [Google Scholar] [CrossRef]
- Lenssen, G.G.; Smith, N.C. Ibm and sustainability: Creating a smarter planet. In Managing Sustainable Business: An Executive Education Case and Textbook; Springer: Berlin/Heidelberg, Germany, 2018; pp. 549–556. [Google Scholar]
- Digital Transformation in Singapore: A Smart Nation in 2025. Available online: https://www.tigernix.com/blog/digital-transformation-singapore-smart-nation-2025#:~:text=Singapore’s%20smart%20nation%20plan%20also,AI%2C%20data%20analytics%2C%20etc (accessed on 24 May 2024).
- Japan Pushing Ahead with Society 5.0 to Overcome Chronic Social Challenges. Available online: https://www.unesco.org/en/articles/japan-pushing-ahead-society-50-overcome-chronic-social-challenges?hub=701 (accessed on 24 May 2023).
- Yadav, G.; Mangla, S.K.; Luthra, S.; Rai, D. Developing a sustainable smart city framework for developing economies: An Indian context. Sustain. Cities Soc. 2019, 47, 101462. [Google Scholar] [CrossRef]
- Lazaroiu, G.C.; Roscia, M. Definition methodology for the smart cities model. Energy 2012, 47, 326–332. [Google Scholar] [CrossRef]
- Shen, L.Y.; Huang, Z.H.; Wong, S.W.; Liao, S.J.; Lou, Y.L. A holistic evaluation of smart city performance in the context of China. J. Clean. Prod. 2018, 200, 667–679. [Google Scholar] [CrossRef]
- Yigitcanlar, T.; Kamruzzaman, M. Smart cities and mobility: Does the smartness of Australian cities lead to sustainable commuting patterns? In Smart Cities and Innovative Urban Technologies; Routledge: London, UK, 2020; pp. 21–46. [Google Scholar]
- Kitchin, R.; Coletta, C.; Evans, L.; Heaphy, L. Creating smart cities. In Creating Smart Cities; Routledge: London, UK, 2018; pp. 1–18. [Google Scholar]
- Sourbati, M.; Behrendt, F. Smart mobility, age and data justice. New Media Soc. 2021, 23, 1398–1414. [Google Scholar] [CrossRef]
- Caragliu, A.; Del Bo, C.F. Smart innovative cities: The impact of Smart City policies on urban innovation. Technol. Forecast. Soc. Change 2019, 142, 373–383. [Google Scholar] [CrossRef]


| Factor Categories | Indicators | Indicator Description |
|---|---|---|
| Input | Capital | The urban fixed capital stock is calculated using the perpetual inventory method [44], with 2003 as the base period. |
| Labor | Utilize the year-end urban employment figures, encompassing the number of individuals employed by various units and those engaged in private and individual employment within cities. | |
| Energy | Energy data on coal, oil, and gas at the city level. We use the electricity consumption of the whole society as a proxy variable. | |
| Expected output | Real GDP | The GDP index is converted to obtain gross domestic product (GDP) at constant prices, with 2003 as the base period. |
| Undesirable outputs | Pollutant discharge | Including urban industrial wastewater discharge, industrial sulfur dioxide discharge, and industrial dust discharge. |
| (1) | (2) | (3) | |
|---|---|---|---|
| GTFP | GTFP | GTFP | |
| DID | 0.594 *** | 0.435 *** | 0.435 *** |
| (0.048) | (0.056) | (0.155) | |
| Constant | 2.253 *** | 0.349 | 0.349 |
| (0.438) | (0.649) | (0.762) | |
| Control variables | Yes | Yes | Yes |
| Urban FEs | No | Yes | Yes |
| Year FEs | No | Yes | Yes |
| Cluster to city | No | No | Yes |
| Obs. | 1980 | 1980 | 1980 |
| R2 | 0.161 | 0.556 | 0.556 |
| Variables | Matches | Experimental Group Mean | Control Group Mean | Bias | t-Value | p-Value |
|---|---|---|---|---|---|---|
| Gov | Pre-match | 0.504 | 0.788 | 58.100 | 12.220 | 0.000 *** |
| Post-match | 0.504 | 0.480 | 5.000 | 0.850 | 0.395 | |
| Pgdp | Pre-match | 11.061 | 10.802 | 43.100 | 9.340 | 0.000 *** |
| Post-match | 11.061 | 11.000 | 10.200 | 1.900 | 0.057 * | |
| Fdi | Pre-match | 3.162 | 4.343 | 81.800 | 16.740 | 0.000 *** |
| Post-match | 3.162 | 3.222 | 4.200 | 0.860 | 0.388 | |
| Hc | Pre-match | 6.011 | 5.646 | 38.200 | 7.820 | 0.000 *** |
| Post-match | 10.949 | 10.852 | 2.000 | 0.410 | 0.679 | |
| Fin | Pre-match | 1.488 | 1.396 | 19.200 | 3.980 | 0.000 *** |
| Post-match | 1.488 | 1.505 | 3.700 | 0.690 | 0.493 | |
| Infra | Pre-match | 2.587 | 2.312 | 51.000 | 10.760 | 0.000 *** |
| Post-match | 2.587 | 2.570 | 3.300 | 0.600 | 0.547 |
| (1) | (2) | |
|---|---|---|
| PSM Results | Change Sample Interval | |
| DID | 0.432 *** | 0.390 *** |
| (0.155) | (0.146) | |
| Constant | 4.677 | 0.998 |
| (5.157) | (0.701) | |
| Control variable | Yes | Yes |
| Urban FEs | Yes | Yes |
| Year FEs | Yes | Yes |
| Cluster to city | Yes | Yes |
| Obs. | 1966 | 1815 |
| R2 | 0.557 | 0.541 |
| (1) | (2) | (3) | (4) | (5) | |
|---|---|---|---|---|---|
| One Year | Two Years | Three Years | Four Years | Five Years | |
| DID | 0.140 *** | 0.239 *** | 0.309 *** | 0.393 *** | 0.431 *** |
| (0.051) | (0.090) | (0.114) | (0.143) | (0.154) | |
| Constant | 3.162 | 3.949 | 2.146 | 7.653 | 1.276 |
| (5.902) | (7.177) | (3.622) | (5.512) | (5.096) | |
| Control variables | Yes | Yes | Yes | Yes | Yes |
| Urban FEs | Yes | Yes | Yes | Yes | Yes |
| Year FEs | Yes | Yes | Yes | Yes | Yes |
| Cluster to city | Yes | Yes | Yes | Yes | Yes |
| Obs. | 495 | 825 | 1155 | 1485 | 1815 |
| R2 | 0.848 | 0.704 | 0.652 | 0.612 | 0.588 |
| (1) | (2) | (3) | (4) | |
|---|---|---|---|---|
| Innov | Es | Tl | Er | |
| DID | 0.354 *** | 0.034 | 0.039 | 0.015 ** |
| (0.067) | (0.030) | (0.114) | (0.007) | |
| Constant | 1.039 *** | 0.526 *** | 2.250 *** | 0.103 *** |
| (0.367) | (0.191) | (0.667) | (0.028) | |
| Control variables | Yes | Yes | Yes | Yes |
| Urban FEs | Yes | Yes | Yes | Yes |
| Year FEs | Yes | Yes | Yes | Yes |
| Cluster to city | Yes | Yes | Yes | Yes |
| Obs. | 1320 | 1980 | 1980 | 1980 |
| R2 | 0.978 | 0.718 | 0.761 | 0.762 |
| (1) | (2) | |
|---|---|---|
| Within Agglomerations | Outside Agglomerations | |
| DID | 0.788 ** | 0.133 |
| (0.296) | (0.145) | |
| Constant | 1.923 | 0.196 |
| (1.934) | (0.775) | |
| Control variables | Yes | Yes |
| Urban FEs | Yes | Yes |
| Year FEs | Yes | Yes |
| Cluster to city | Yes | Yes |
| Obs. | 648 | 1332 |
| R2 | 0.574 | 0.564 |
| (1) | (2) | (3) | (4) | (5) | (6) | |
|---|---|---|---|---|---|---|
| Low Hc | High Hc | Low Fin | High Fin | Low Infra | High Infra | |
| DID | 0.102 | 0.768 *** | 0.084 | 0.728 *** | 0.143 | 0.546 ** |
| (0.094) | (0.232) | (0.129) | (0.251) | (0.157) | (0.235) | |
| Constant | 0.418 | 1.118 | 0.235 | 0.884 | 0.378 | 0.474 |
| (0.914) | (1.401) | (1.004) | (1.074) | (0.821) | (1.533) | |
| Control variables | Yes | Yes | Yes | Yes | Yes | Yes |
| Urban FEs | Yes | Yes | Yes | Yes | Yes | Yes |
| Year FEs | Yes | Yes | Yes | Yes | Yes | Yes |
| Cluster to city | Yes | Yes | Yes | Yes | Yes | Yes |
| Obs. | 996 | 984 | 996 | 984 | 996 | 984 |
| R2 | 0.560 | 0.582 | 0.598 | 0.558 | 0.525 | 0.574 |
Disclaimer/Publisher’s Note: The statements, opinions and data contained in all publications are solely those of the individual author(s) and contributor(s) and not of MDPI and/or the editor(s). MDPI and/or the editor(s) disclaim responsibility for any injury to people or property resulting from any ideas, methods, instructions or products referred to in the content. |
© 2024 by the authors. Licensee MDPI, Basel, Switzerland. This article is an open access article distributed under the terms and conditions of the Creative Commons Attribution (CC BY) license (https://creativecommons.org/licenses/by/4.0/).
Share and Cite
Li, Z.; Shi, Y.; Wojewodzki, M.; Wei, Y.; Guo, M. The Impact of New-Type Urbanization Policy on Urban Green Total Factor Productivity: New Evidence from China. Sustainability 2024, 16, 5220. https://doi.org/10.3390/su16125220
Li Z, Shi Y, Wojewodzki M, Wei Y, Guo M. The Impact of New-Type Urbanization Policy on Urban Green Total Factor Productivity: New Evidence from China. Sustainability. 2024; 16(12):5220. https://doi.org/10.3390/su16125220
Chicago/Turabian StyleLi, Zhijun, Yuanyuan Shi, Michal Wojewodzki, Yigang Wei, and Meiyu Guo. 2024. "The Impact of New-Type Urbanization Policy on Urban Green Total Factor Productivity: New Evidence from China" Sustainability 16, no. 12: 5220. https://doi.org/10.3390/su16125220