
Design Enhancement of Grid-Connected Residential PV Systems to Meet the Saudi Electricity Regulations


Abstract
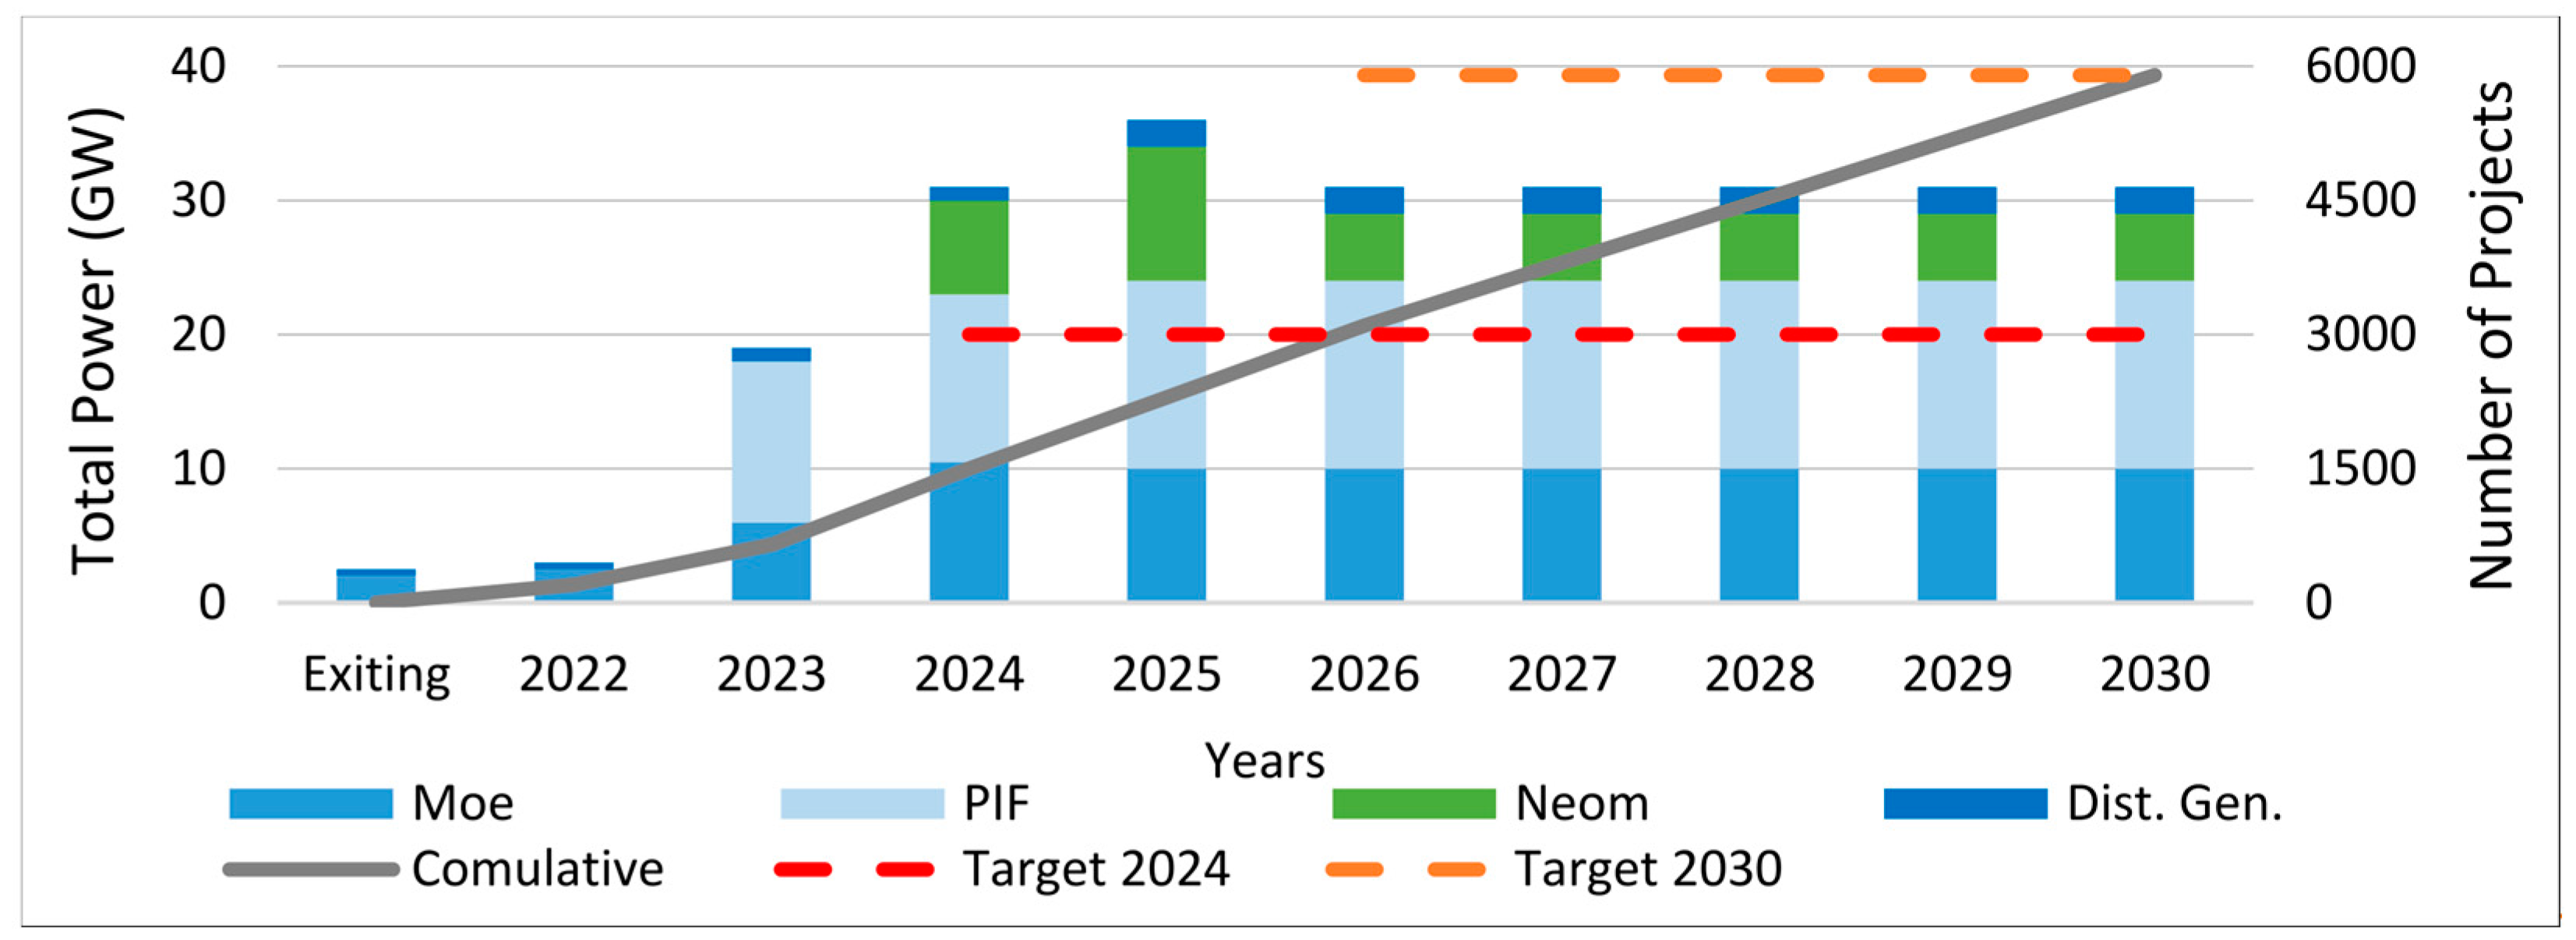
:1. Introduction
2. The Recent SEC Requirements for Residential PV Integration
2.1. Voltage Stability Requirements
2.2. Voltage Flicker and Fluctuation Requirements
2.3. Harmonics Distortion Requirements
2.4. Frequency Deviation Requirements
2.5. Power Factor Requirements
2.6. Electrical Isolation and Galvanic Isolation
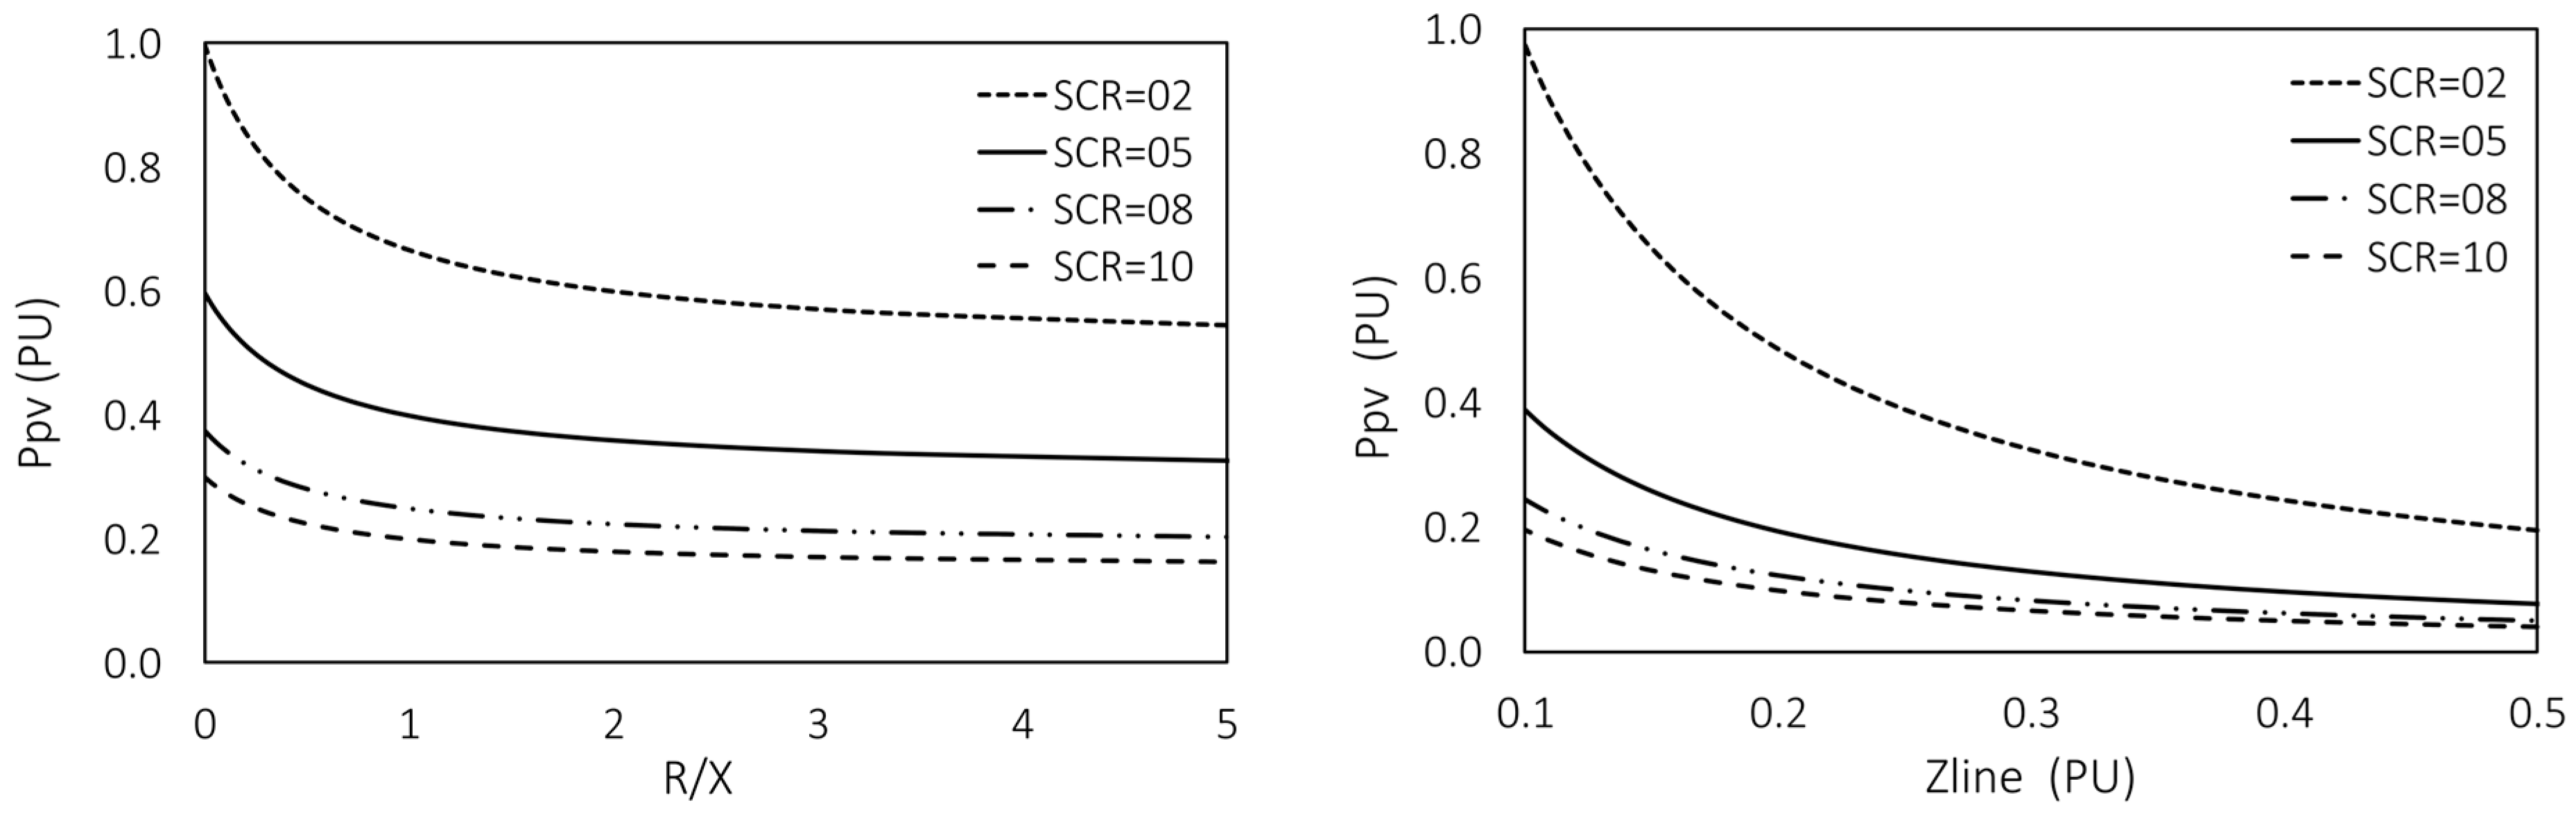
3. PV Power to Grid Strength Criteria
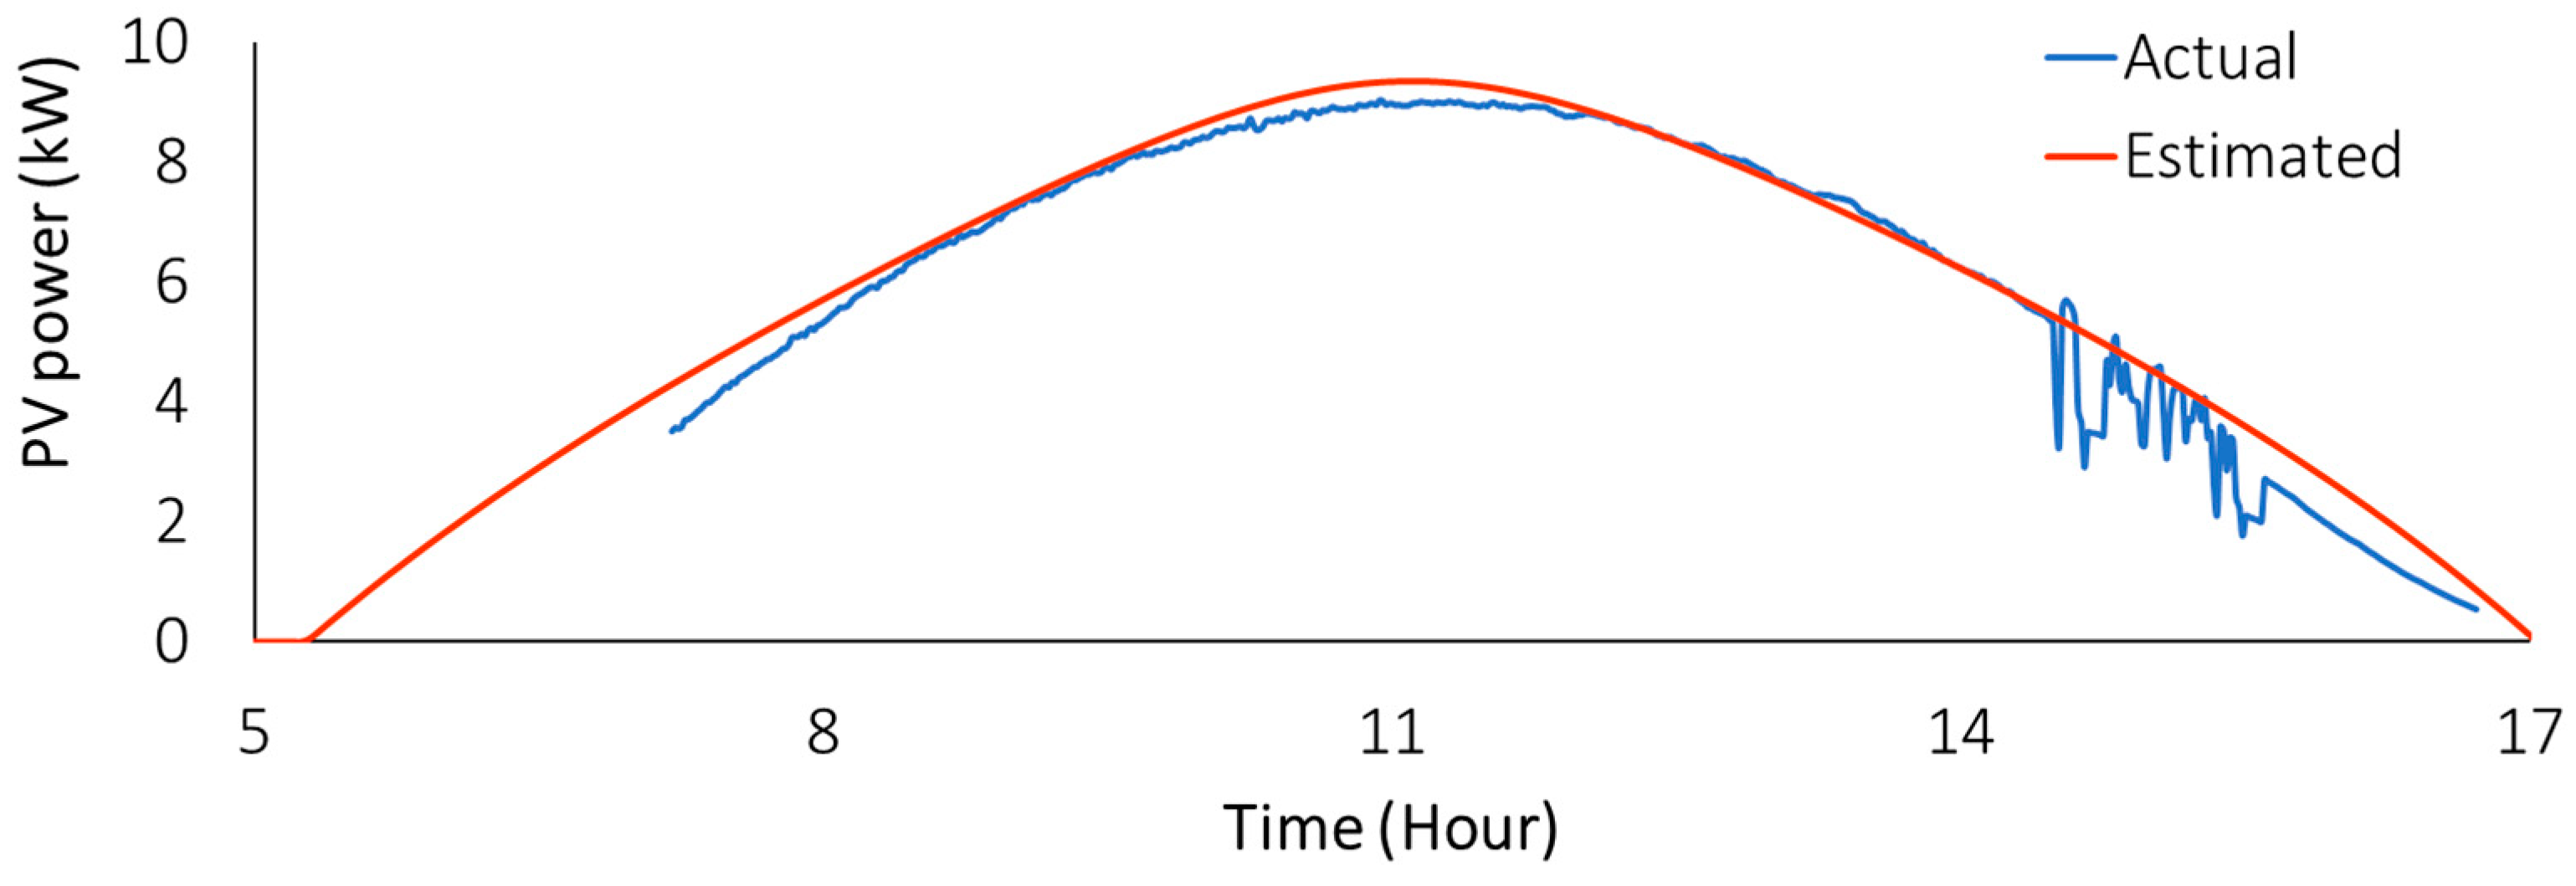
4. Estimation of PV Power Based on Power Quality Consideration
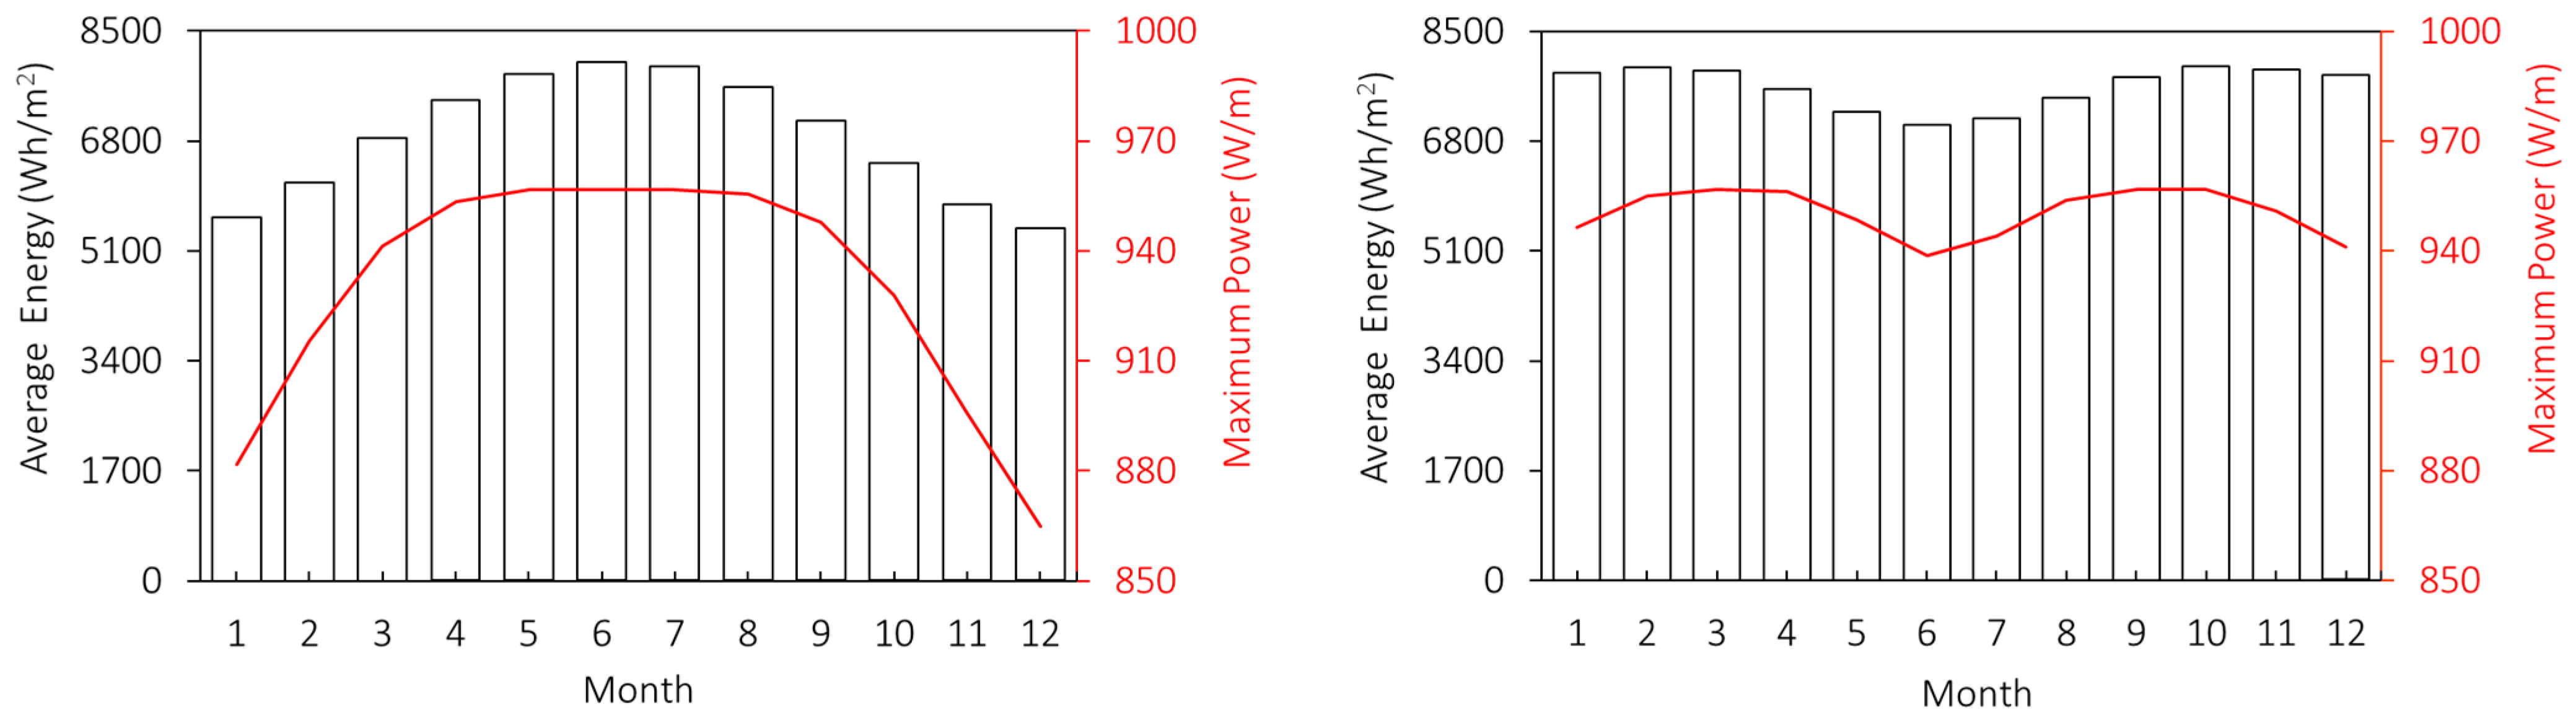
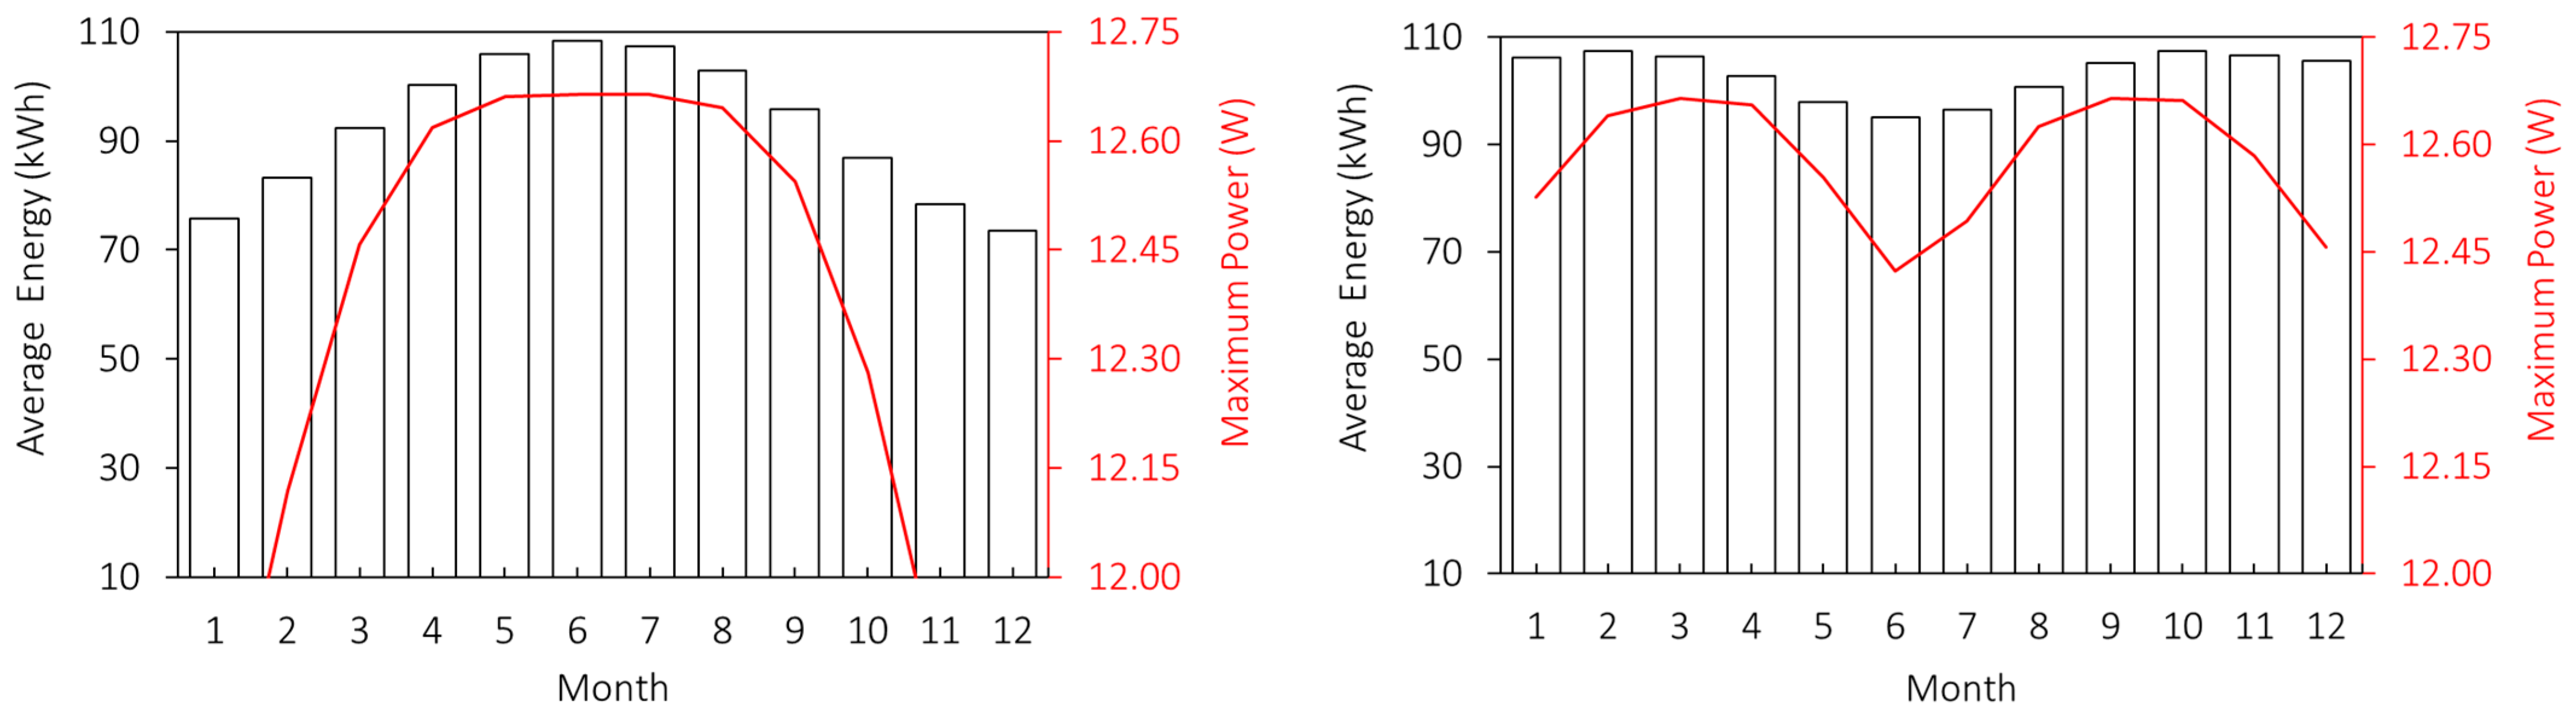
Estimation of the Solar Radiation Energy
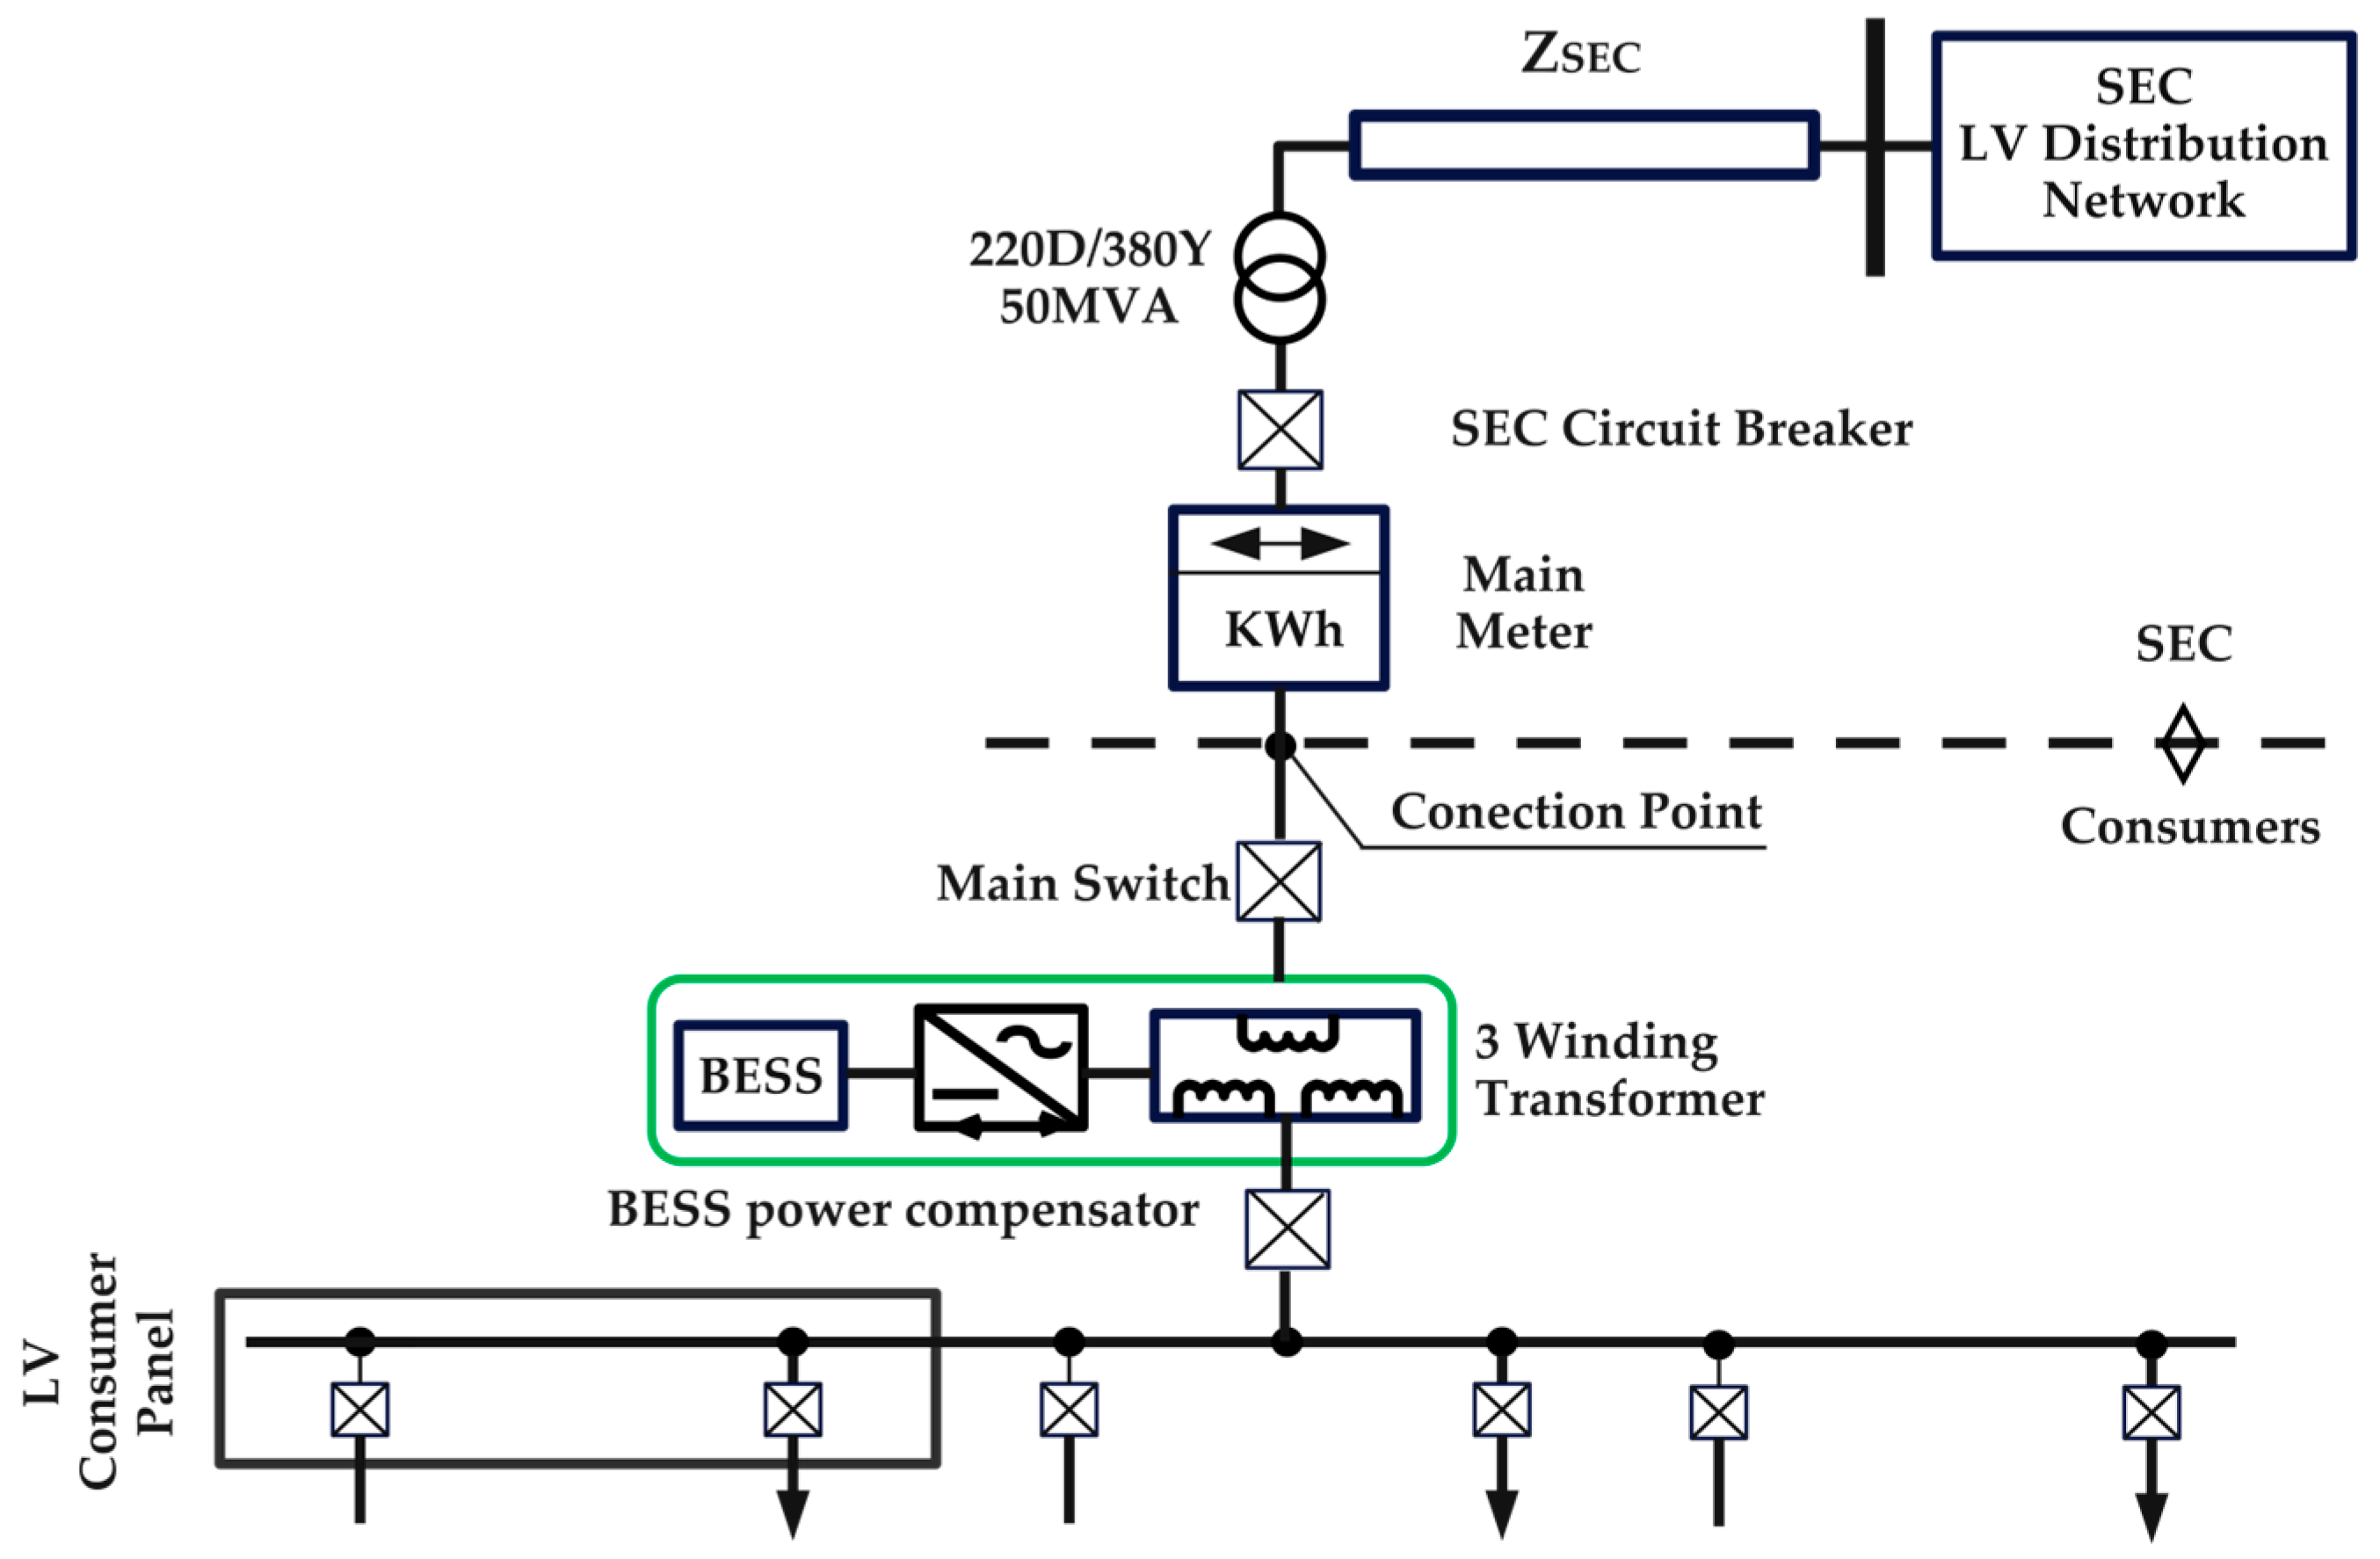
5. Structure of the Grid-Connected PV System
6. Control Mechanism of the PV and BESS Apparent Power
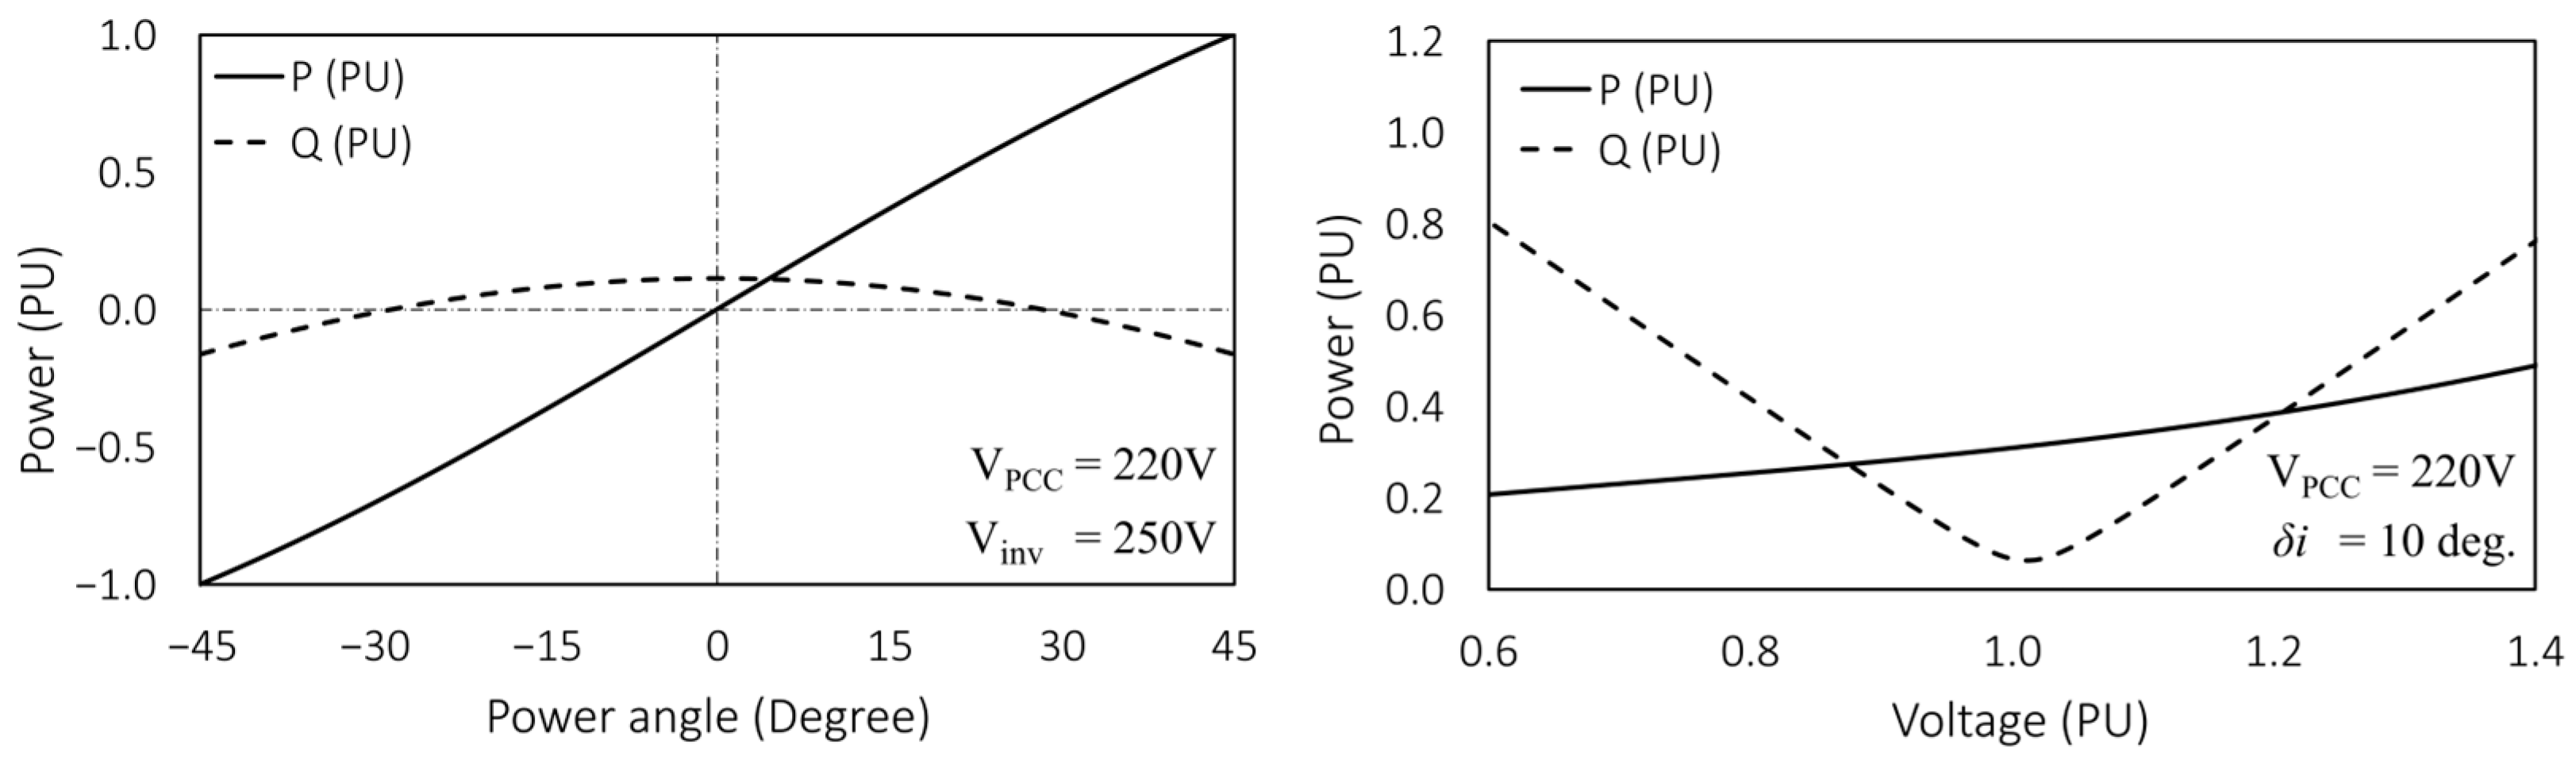
6.1. Control Methodology for the R-PV Inverter
6.2. Control Methodology for the BESS Inverter
6.2.1. BESS Reactive Power Control for Voltage and Power Factor Regulation
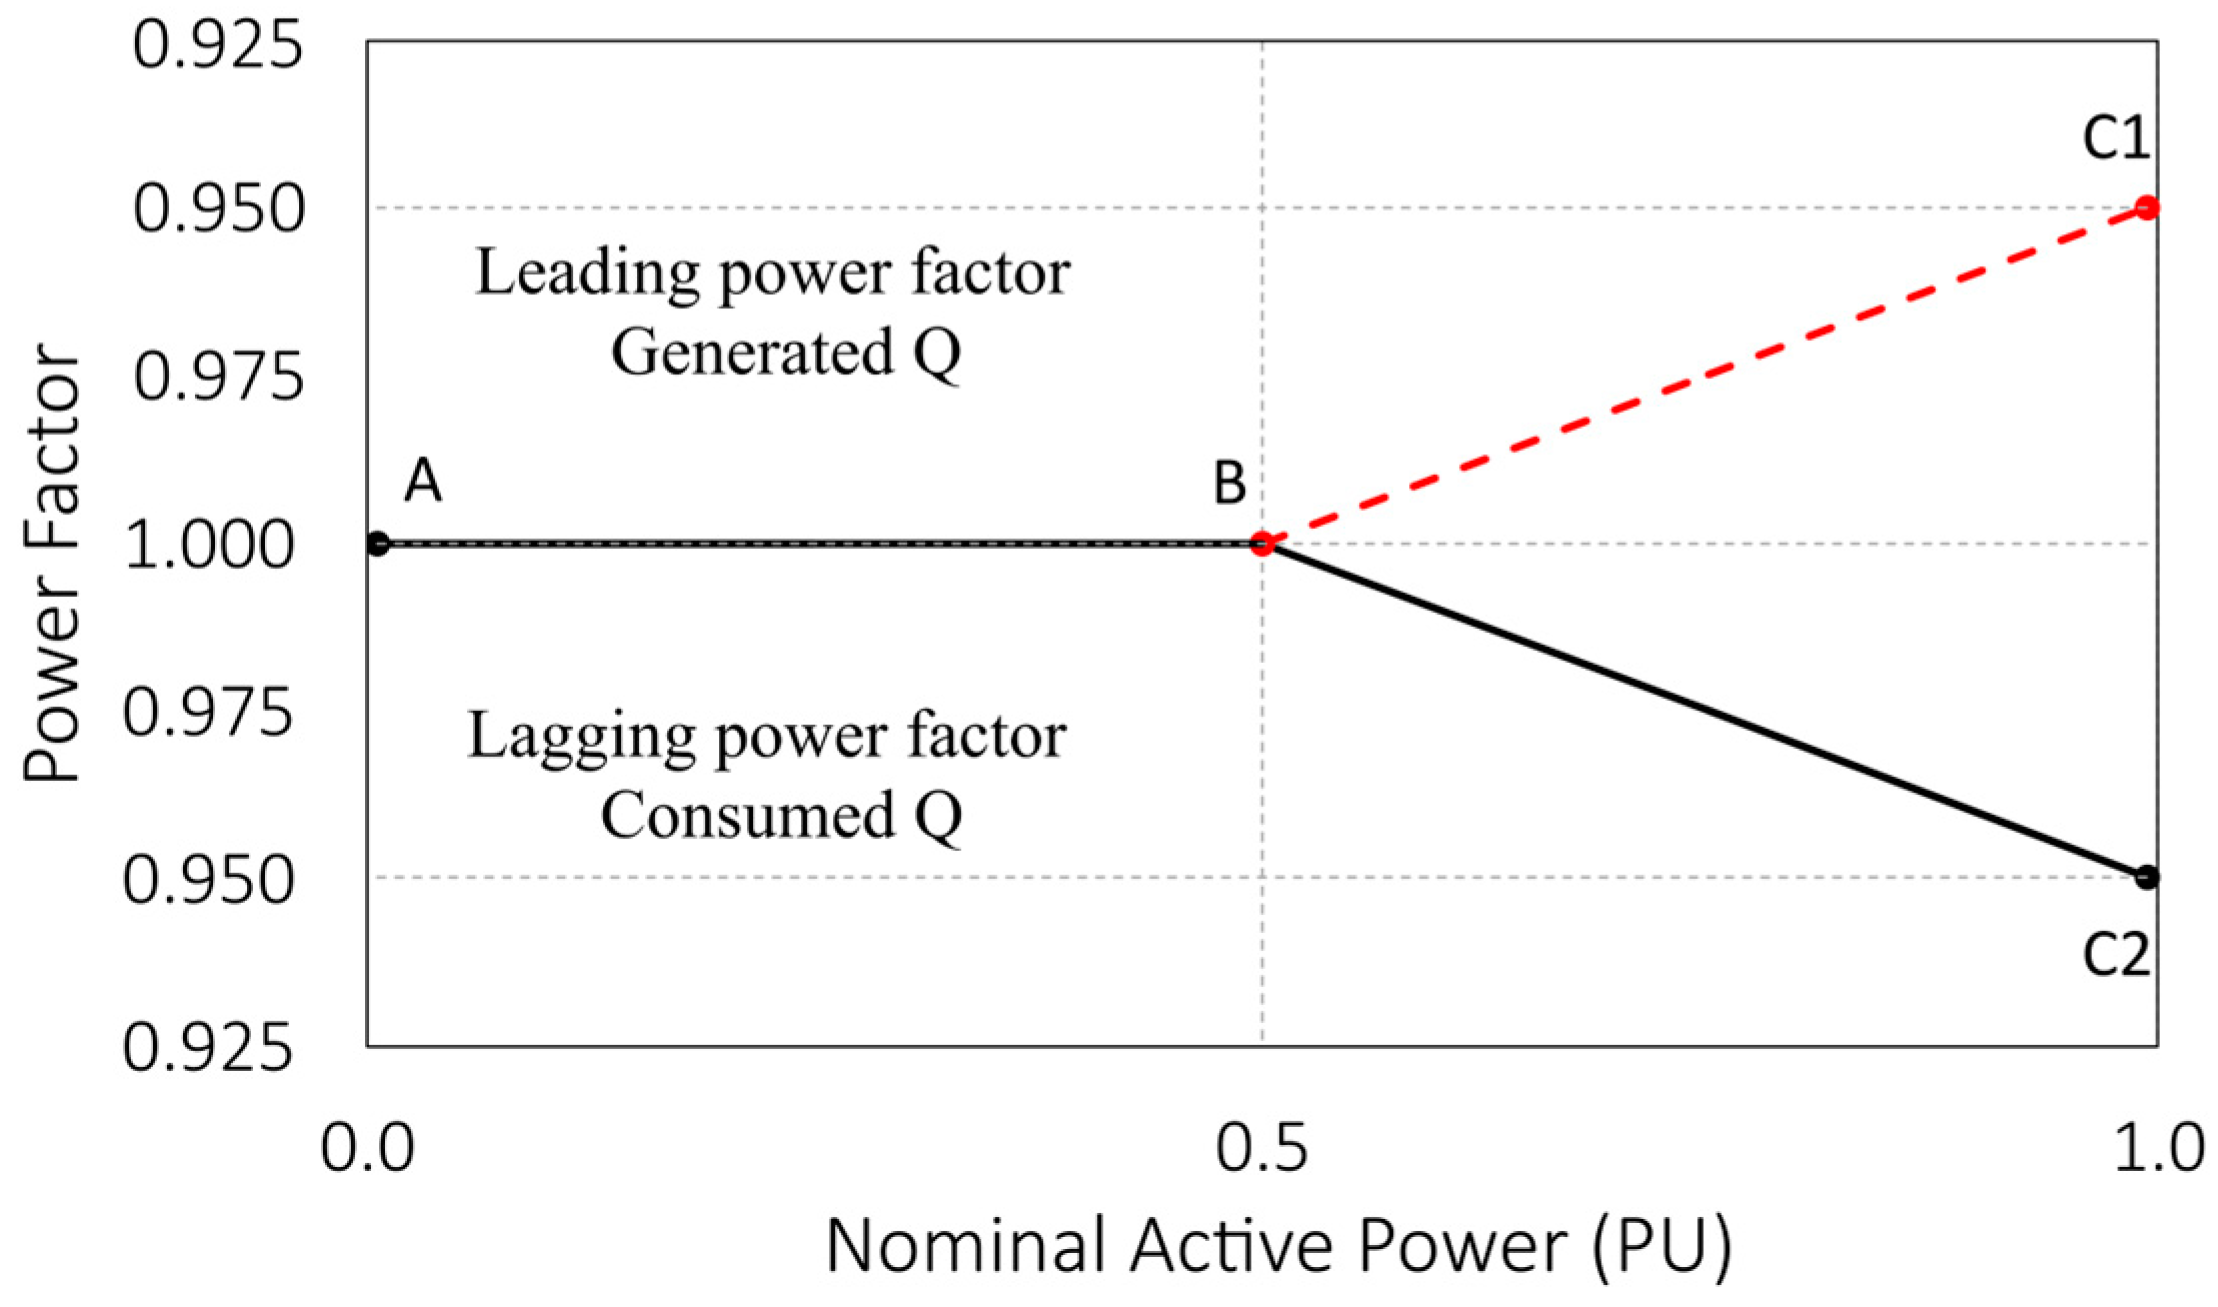
- Zero reactive power. This mode is mandatory when the generated power is less than 0.5 PU. This operation mode is considered to conduct unity power factor during this condition of the reactive power.
- Fixed reactive power, considering the constraints of PF in Figure 4. Hence, for this case, the reference of the reactive power reactive power shall be specified accordingly.
- Fixed power factor, and this can be achieved by monitoring the PCC power factor and regulating the reactive power accordingly.
- Controlling the reactive power based on the PCC active power, in order to maintain the PFpcc within the stated boundaries. Hence, the reactive power here can be expressed in a function of only the active power.
6.2.2. BESS Active Power Control for Frequency Regulations
6.2.3. Power Isolation and Harmonics Mitigation
7. Validation and Case Study
7.1. Configuration of the PV System and the Connected Power Network
7.2. Solar Energy Estimation and PV System Capacity
7.3. Capacity and Dynamic Impact Evaluation of the BESS
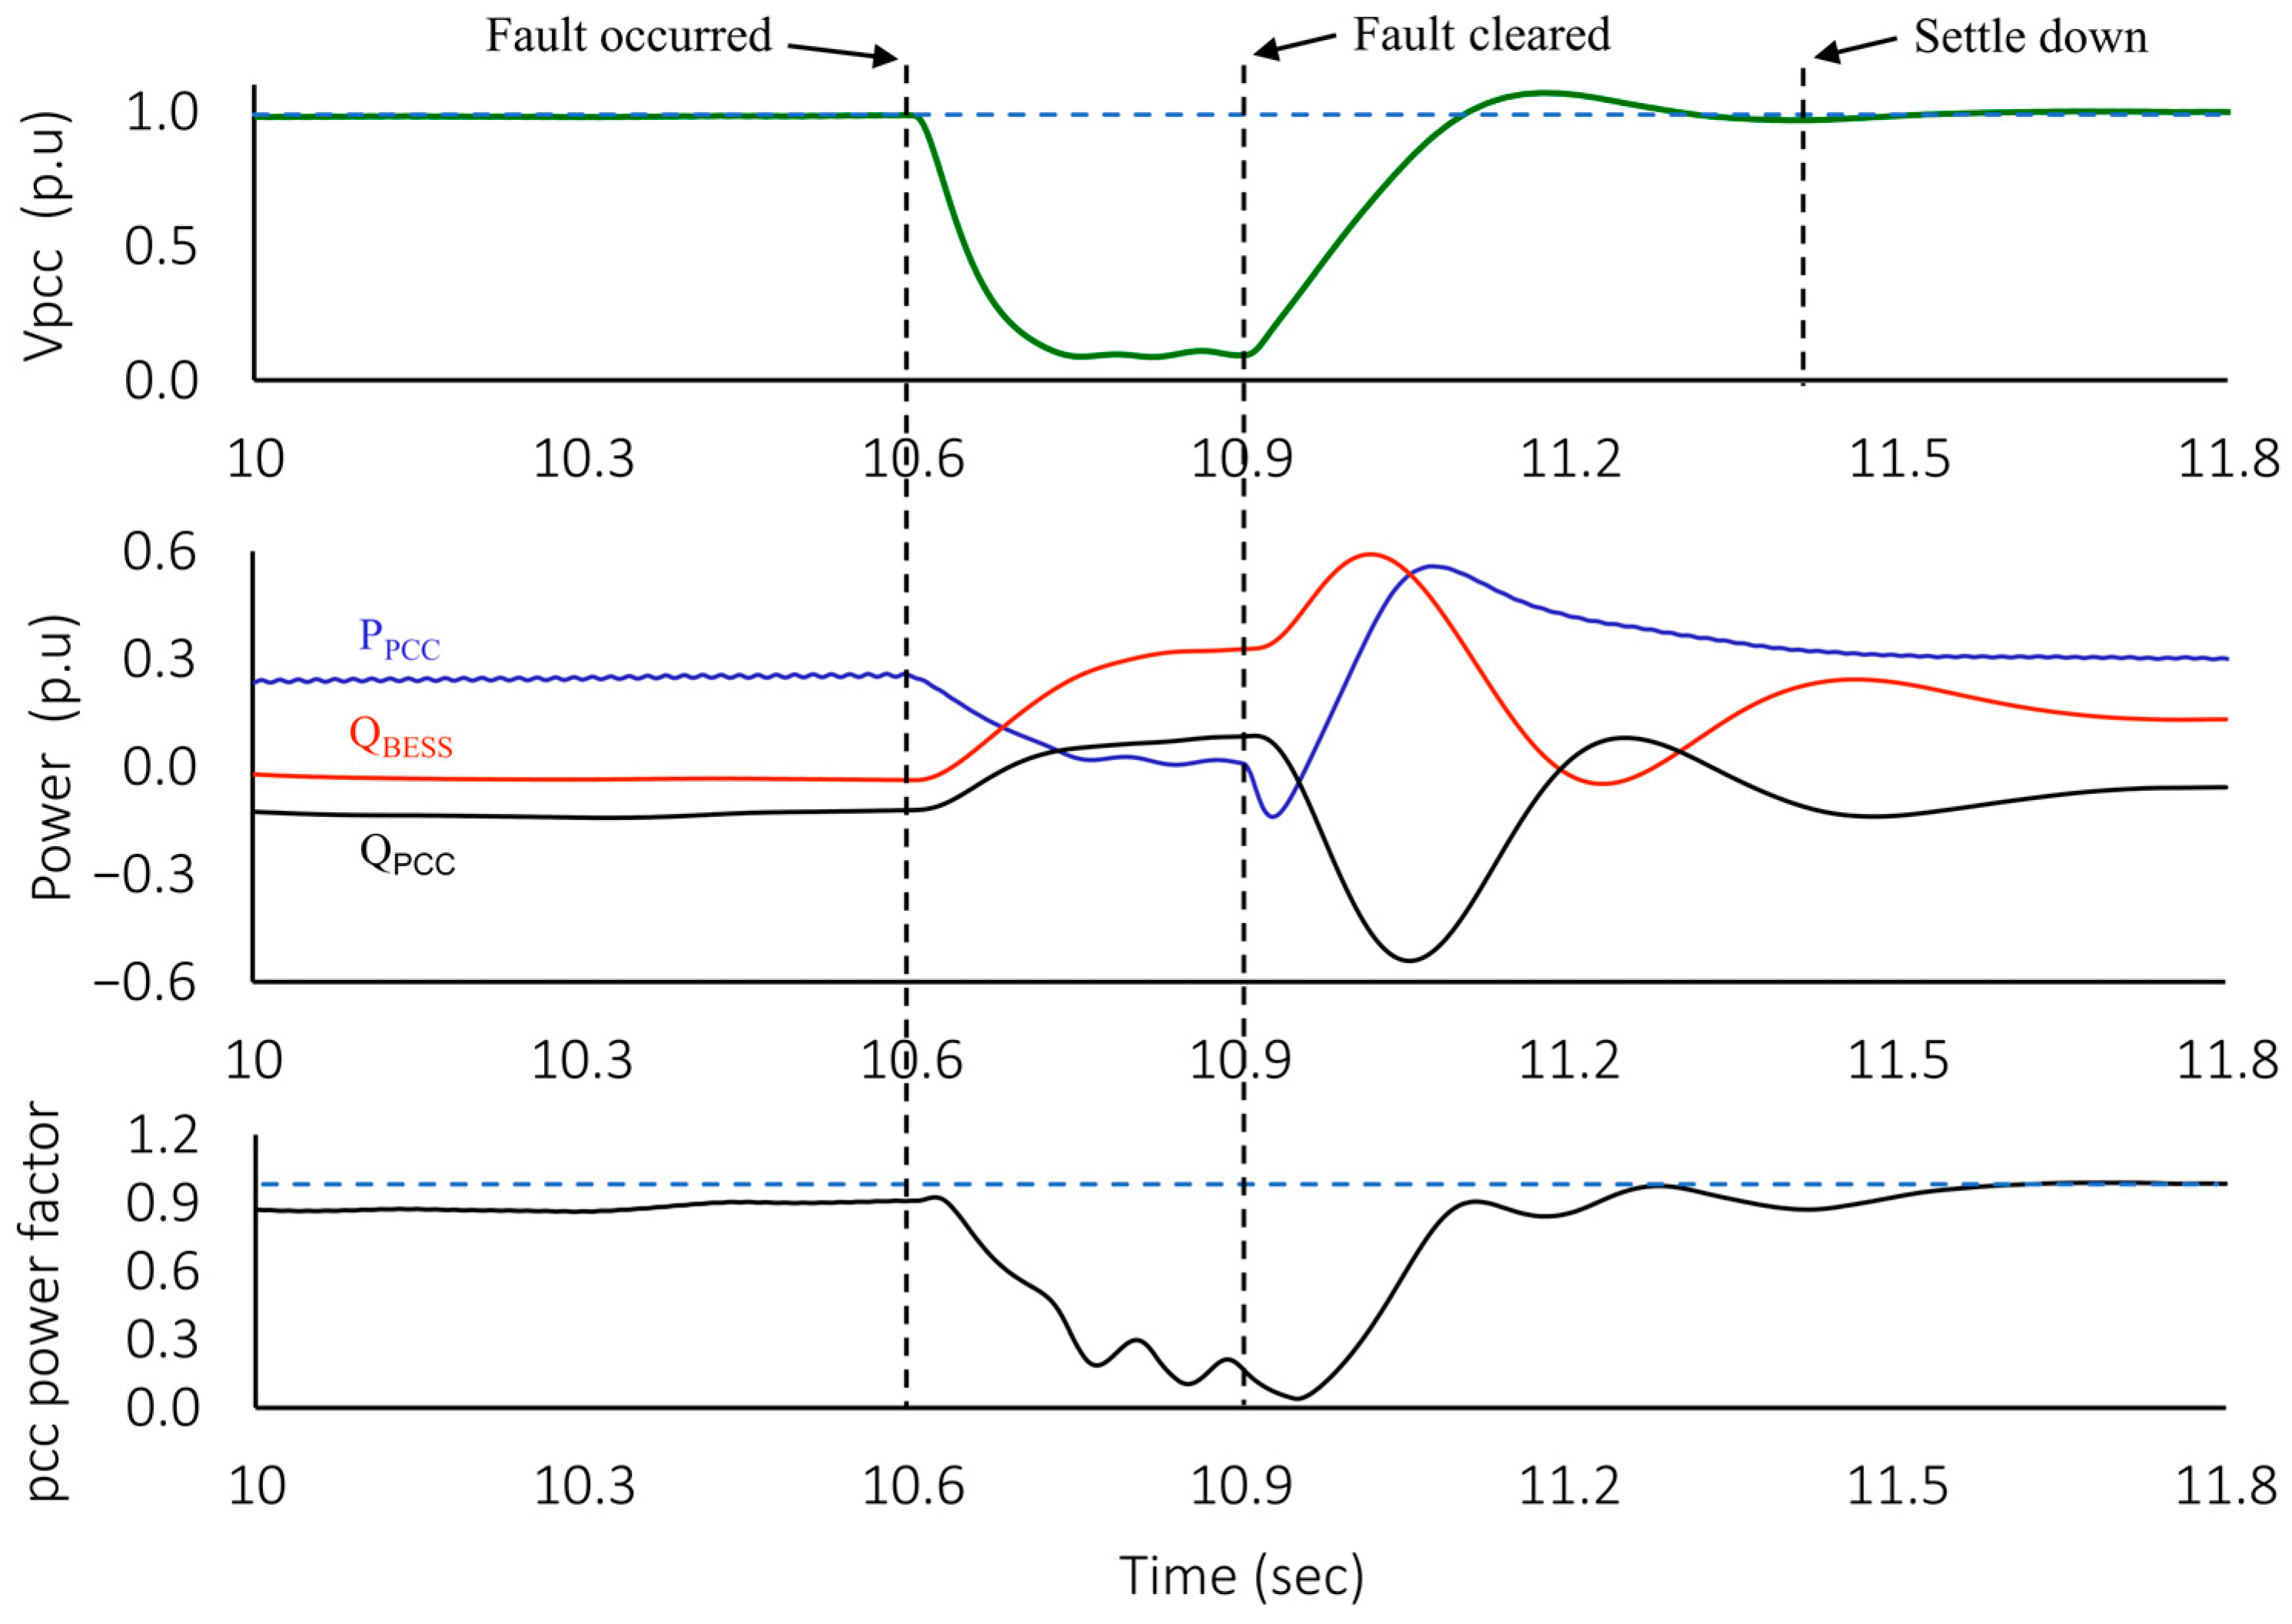
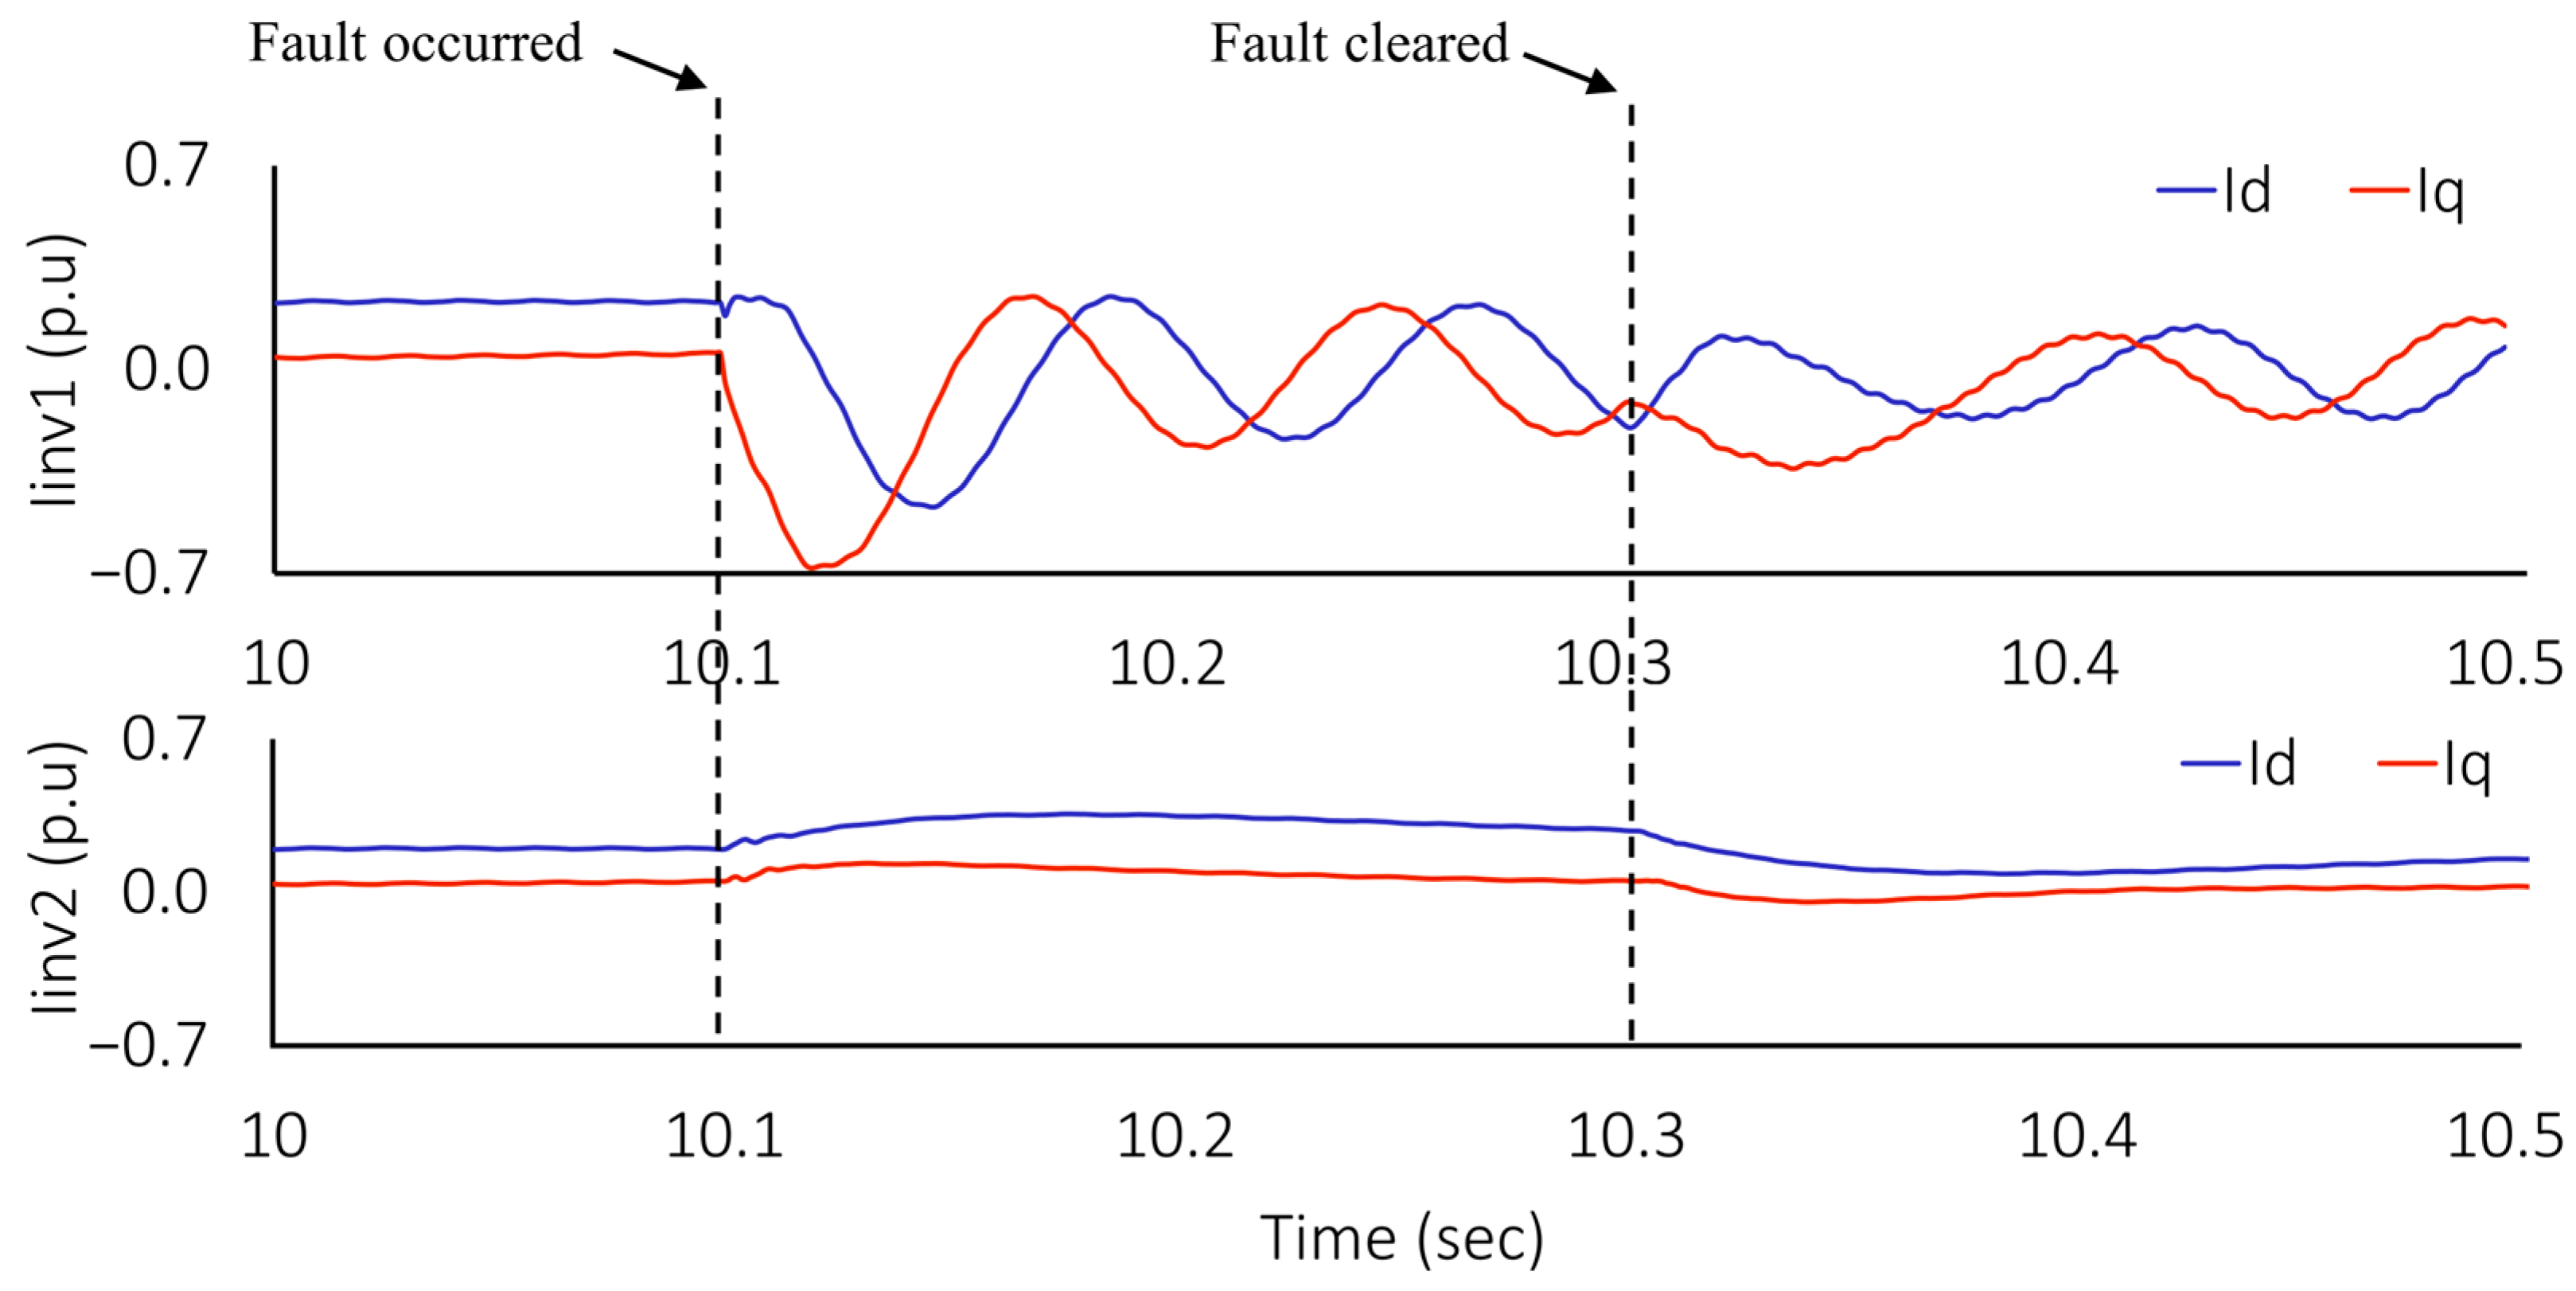
7.3.1. PCC Bus Voltage and Power Factor during Fault Conditions and No Control
7.3.2. Regulation of PCC Voltage during Normal and Abnormal Conditions
7.3.3. Regulation the PCC Power Factor Utilizing the Four Control Modes
7.3.4. Evaluating the Frequency Response without Active Power Regulation
7.3.5. Evaluation the Frequency Response with Active Power Regulation
7.3.6. Injected Current Harmonics and Fault Current
8. Economic Feasibility of the Proposed Solution
9. Conclusions
Author Contributions
Funding
Institutional Review Board Statement
Informed Consent Statement
Data Availability Statement
Conflicts of Interest
References
- Khan, K.A.; Quamar, M.M.; Al-Qahtani, F.H.; Asif, M.; Alqahtani, M.; Khalid, M. Smart grid infrastructure and renewable energy deployment: A conceptual review of Saudi Arabia. Energy Strategy Rev. 2023, 50, 101247. [Google Scholar] [CrossRef]
- Saudi Industrial Development Fund. Available online: https://www.sidf.gov.sa/en/Pages/Home.aspx (accessed on 11 April 2024).
- Short, T.A. Distribution Reliability and Power Quality, 1st ed.; Taylor & Francis, LLC: Abingdon, UK, 2005; pp. 122–264. [Google Scholar]
- Khetarpal, P.; Tripathi, M.M. A critical and comprehensive review on power quality disturbance detection and classification. Sustain. Comput. Inform. Syst. 2020, 28, 100417. [Google Scholar] [CrossRef]
- Beleiu, H.G.; Beleiu, I.N.; Pavel, S.G.; Darab, C.P. Management of Power Quality Issues from an Economic Point of View. Sustainability 2018, 10, 2326. [Google Scholar] [CrossRef]
- Das, S.; Singh, B. Mitigating Impact of High Power Ramp Rates in Utility Grid Integrated Wind–Solar System Using an RLMAT Adaptive Control Strategy. IEEE Trans. Energy Convers. 2023, 38, 343–354. [Google Scholar] [CrossRef]
- Mohamed, E.A.; Zhengming, Z. Grid-connected photovoltaic power systems: Technical and potential problems—A review. Renew. Sustain. Energy Rev. 2010, 14, 112–129. [Google Scholar]
- Chiang, G.T.; Tanemura, K.; Tomura, S. Proposal of a High-frequency Integrated Power Converter for Renewable Energy Grid-BES Interactive Applications. IEEE J. Ind. Appl. 2023, 12, 624–634. [Google Scholar] [CrossRef]
- Masuta, T.; Fonseca, J.; Ootake, H.; Murata, H. Study on demand and supply operation using forecasting in power systems with extremely large integrations of photovoltaic generation. In Proceedings of the 2016 IEEE International Conference on Sustainable Energy Technologies (ICSET), Hanoi, Vietnam, 14–16 November 2016; pp. 66–71. [Google Scholar]
- Liang, W.; Ge, B.; Liu, Y.; Abu-Rub, H.; Balog, R.S.; Xue, Y. Modeling, Analysis, and Impedance Design of Battery Energy Stored Single-Phase Quasi-Z Source Photovoltaic Inverter System. In Proceedings of the 2016 IEEE Energy Conversion Congress and Exposition (ECCE), Milwaukee, WI, USA, 8–22 September 2016. [Google Scholar]
- Lamsal, D.; Sreeram, V.; Mishra, Y.; Kumar, D. A Kalman Filter Approach for Dispatching and Attenuating the Power Fluctuation of Wind and Photovoltaic Power Generating Systems. IET Gener. Transm. Distrib. 2018, 12, 1501–1508. [Google Scholar] [CrossRef]
- Unigwe, O.; Okekunle, D.; Kiprakis, A. Economical distributed voltage control in low-voltage grids with high penetration of photovoltaic. CIRED Open Access Proc. J. 2017, 2017, 1722–1725. [Google Scholar] [CrossRef]
- Regulatory Framework for Small-Scale Solar PV Systems, Saudi Electricity Regulatory Authority. Available online: https://sura.com.sa/dashboard/public/uploads/attachments/Regulatory-framework-for-Small-Scale-Solar-PV-Systems.pdf (accessed on 19 December 2023).
- Sustainable Integration of Renewable Energy Sources (solar PV) with SEC Distribution Network Low Voltage and Medium Voltage, Saudi Electricity Company. Available online: https://www.se.com.sa/-/media/sec/Sustainability/Solar-PV/ProceduresandGuides/3-SEC--Connection-Guidelinesv3Clean.ashx (accessed on 4 February 2024).
- Saudi Arabian Power Distribution Code. 2020. Available online: https://www.slideshare.net/PowerSystemOperation/saudi-arabian-power-distribution-code-2020 (accessed on 4 February 2024).
- Kordkandi, R.D.; Hagh, M.T.; Roozbehani, S. Real-time Low/High-voltage Ride-through Capability Improvement of Micro-grid Based on Coordinated Robust Grid-following Control. IET Gener. Transm. Distrib. 2022, 16, 3318–3332. [Google Scholar] [CrossRef]
- Geng, Y.; Yang, K.; Lai, Z.; Zheng, P.; Liu, H.; Deng, R. A Novel Low Voltage Ride through Control Method for Current Source Grid-Connected Photovoltaic Inverters. IEEE Access 2019, 7, 51735–51748. [Google Scholar] [CrossRef]
- Joshi, J.; Swami, A.K.; Jately, V.; Azzopardi, B. A Comprehensive Review of Control Strategies to Overcome Challenges during LVRT in PV Systems. IEEE Access 2021, 9, 121804–121834. [Google Scholar] [CrossRef]
- Landera, Y.G.; Zevallos, O.C.; Neto, R.C.; Castro, D.C.; Neves, F.A. A Review of Grid Connection Requirements for Photovoltaic Power Plants. Energies 2023, 16, 2093. [Google Scholar] [CrossRef]
- Al-Shetwi, A.Q.; Hannan, M.A.; Jern, K.P.; Alkahtani, A.A.; Pg Abas, A.E. Power Quality Assessment of Grid-Connected PV System in Compliance with the Recent Integration Requirements. Electronics 2020, 9, 366. [Google Scholar] [CrossRef]
- Elshahed, M. Assessment of Sudden Voltage Changes and Flickering for a Grid-Connected Photovoltaic Plant. Int. J. Renew. Energy Res. 2016, 6, 1328–1335. [Google Scholar]
- Silsüpür, M.; Türkay, B.E. Flicker Source Detection Methods Based on IEC 61000-4-15 and Signal Processing Techniques–a Review. Balk. J. Electr. Comput. Eng. 2015, 3. [Google Scholar] [CrossRef]
- IEEE Std 1547a-2014; IEEE Standard for Interconnecting Distributed Resources with Electric Power Systems—Amendment 1. IEEE: Piscataway, NJ, USA, 2014; pp. 1–16. Available online: https://ieeexplore.ieee.org/document/6818982 (accessed on 14 January 2024).
- The Saudi Arabian Grid Code 2022, Saudi Electricity Company. Available online: https://www.se.com.sa/en/Whoweare/National-Grid-SA/Saudi-Arabian-Grid-Code/Saudi-Arabian-Grid-Code-Guide (accessed on 11 March 2024).
- Al-Shetwi, A.Q.; Sujod, M.Z. Harmonic Distortion and Voltage Imbalance Study of Photovoltaic Power Plant Connected to the Malaysian Grid. J. Telecommun. Electron. Comput. Eng. (JTEC) 2018, 10, 1–6. [Google Scholar]
- Colque, J.C.; Azcue, J.L.; Ruppert, E. Photovoltaic System Grid-Connected with Active Power Filter Functions for Mitigate Current Harmonics Feeding Nonlinear Loads. In Proceedings of the 2018 13th IEEE International Conference on Industry Applications (INDUSCON), Sao Paulo, Brazil, 12–14 November 2018. [Google Scholar]
- Memon, M.A.; Mekhilef, S.; Mubin, M.; Aamir, M. Selective. Harmonic Elimination in Inverters Using Bio-Inspired Intelligent Algorithms for Renewable Energy Conversion Applications: A Review. Renew. Sustain. Energy Rev. 2018, 82, 2235–2253. [Google Scholar] [CrossRef]
- Shrestha, A.; Gonzalez-Longatt, F. Frequency Stability Issues and Research Opportunities in Converter Dominated Power System. Energies 2021, 14, 4184. [Google Scholar] [CrossRef]
- Roy, R.B.; Rokonuzzaman, M.; Hossam-E-Haider, M. Design and Analysis of the Power Electronic Transformer for Power Quality Improvement. In Proceedings of the 2015 International Conference on Electrical Engineering and Information Communication Technology (ICEEICT), Savar, Bangladesh, 21–23 May 2015. [Google Scholar]
- Alfaris, F.E. System Strength Evaluation of a Multi-terminal Power Grid Integrated a Distributed PV Generation. In Proceeding of the 2023 6th International Conference on Electrical Engineering and Green Energy (CEEGE), Grimstad, Norway, 6–9 June 2023. [Google Scholar]
- Huang, L.; Wu, C.; Zhou, D.; Blaabjerg, F. Impact of Grid Strength and Impedance Characteristics on the Maximum Power Transfer Capability of Grid-Connected Inverters. Appl. Sci. 2021, 11, 4288. [Google Scholar] [CrossRef]
- He, G.; Yan, C.; Zhou, Z.; Lin, J.; Li, G. Robust Suppression Strategy for Photovoltaic Grid-Connected Inverter Cluster Resonance Based on Kalman Filter Improved Disturbance Observer. Energies 2022, 15, 7942. [Google Scholar] [CrossRef]
- Guo, H.; Zheng, S.; Zhang, D.; Gao, P.; Miao, W.; Zuo, Z. Effects on Frequency Stability of Power System for Photovoltaic High-Penetration Ratio Grid-Connected Power Generation. Energies 2023, 16, 1308. [Google Scholar] [CrossRef]
- Lin, Y.; Huadong, S.; Shiyun, X.; Bing, Z.; Jian, Z. A Critical System Strength Evaluation of a Power System with High Penetration of Renewable Energy Generations. CSEE J. Power Energy Syst. 2022, 8, 710–720. [Google Scholar]
- Vladimir, S.S.; Pavel, B.; Stefan, V.O.; Semen, V.T. Review of Models for Estimating and Predicting the Amount of Energy Produced by Solar Energy Systems. Russ. J. Earth Sci. 2023, 23, ES0201. [Google Scholar]
- Barrera, J.M.; Reina, A.; Maté, A.; Trujillo, J.C. Solar Energy Prediction Model Based on Artificial Neural Networks and Open Data. Sustainability 2020, 12, 6915. [Google Scholar] [CrossRef]
- Roger, A.; Amir, A. Photovoltaic Systems Engineering, 4th ed.; CRC Press: New York, NY, USA, 2020; pp. 133–356. [Google Scholar]
- Westman, J.; Hadidi, R. Investigation on Tuning Power–Frequency Droop for Improved Grid–Forming Inverter and Synchronous Generator Transient Load Sharing. Energies 2023, 16, 6758. [Google Scholar] [CrossRef]
- Al-Shetwi, A.Q.; Issa, W.K.; Aqeil, R.F.; Ustun, T.S.; Al-Masri, H.M.K.; Alzaareer, K.; Abdolrasol, M.G.M.; Abdullah, M.A. Active Power Control to Mitigate Frequency Deviations in Large-Scale Grid-Connected PV System Using Grid-Forming Single-Stage Inverters. Energies 2022, 15, 2035. [Google Scholar] [CrossRef]
- Garozzo, D.; Tina, G.M. Evaluation of the Effective Active Power Reserve for Fast Frequency Response of PV with BESS Inverters Considering Reactive Power Control. Energies 2020, 13, 3437. [Google Scholar] [CrossRef]
- Distribution Planning Standards, Saudi Electricity Company. Available online: https://mm4design.wordpress.com/wp-content/uploads/2014/09/dps-sec.pdf (accessed on 23 March 2024).


| Operating Voltage | Nominal Voltage (V) | Lowest (V) | Highest (V) |
|---|---|---|---|
| Low Voltage | 220/127 | 209/120 | 231/134 |
| 380/220 | 360/209 | 400/231 | |
| 400/230 | 380/218.5 | 420/241.5 | |
| Medium Voltage | 13,800 | 13,100 | 14,500 |
| 33,000 | 31,400 | 34,700 |
| Odd Harmonics 1 | Odd Harmonics 2 | Even Harmonics | |||
|---|---|---|---|---|---|
| Order (h) | Harmonic Voltage (%) | Order (h) | Harmonic Voltage (%) | Order (h) | Harmonic Voltage (%) |
| 3 | 4.0 | 5 | 5.0 | 2 | 1.8 |
| 9 | 1.2 | 7 | 4.0 | 4 | 1.0 |
| 15 | 0.3 | 11 | 3.0 | 6 | 0.5 |
| 21 | 0.2 | 13 | 2.5 | 8 | 0.5 |
| 21 ≤ h ≤ 45 | 0.2 | 17 ≤ h ≤ 49 | 1.9 × 17/h − 0.2 | 10 ≤ h ≤ 50 | 2.5/h + 0.22 |
| Below FN 1 (Hz) | Above FN 1 (Hz) | Operation Requirement |
|---|---|---|
| 58.8–60.0 | 60.0–60.5 | Continuous |
| 57.5–58.7 | 60.6–61.5 | for a period of 30 min |
| 57.0–57.4 | 61.6–62.5 | for a period of 30 s |
| PV System Parameters | |||
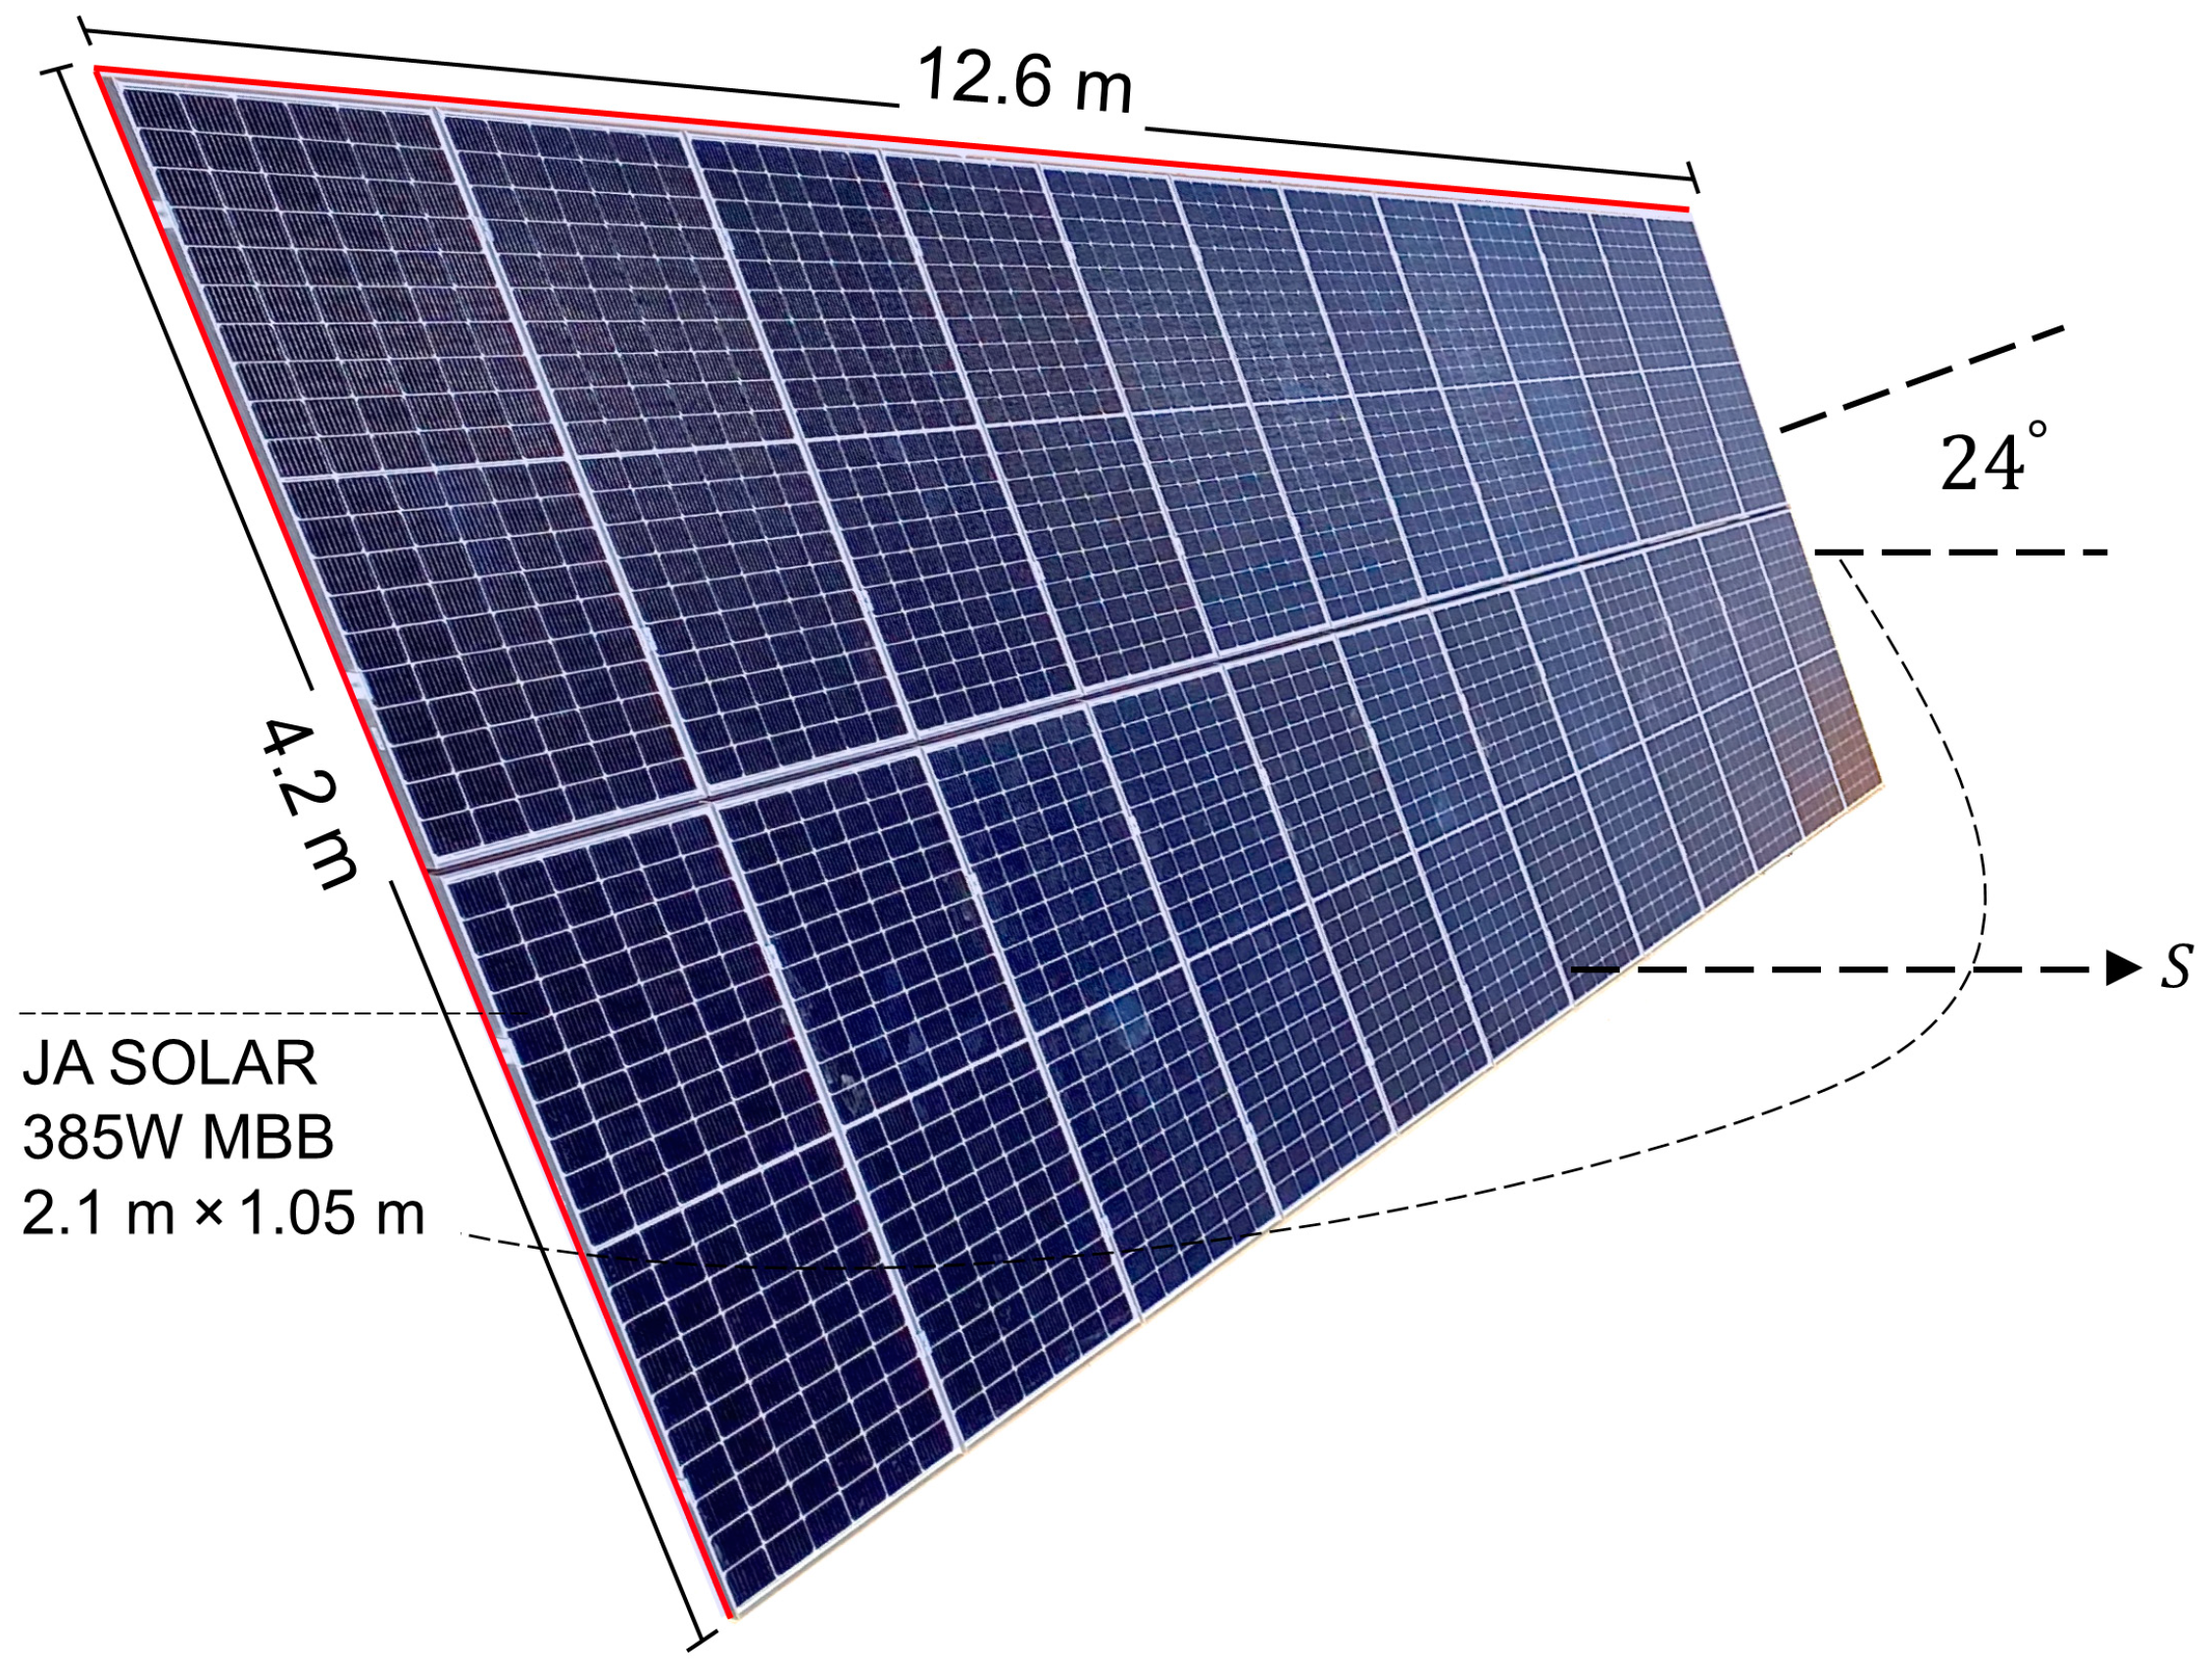
| System capacity | ~10 kW | Covered area | 4.2 m × 12.6 m |
| PV panel type | Monocrystalline 385 W | Panels efficiency | 19% |
| Location | Riyadh, Saudi Arabia | Location coordinators | (24.7136° N, 46.6753° E) |
| Tilt angle | 24 degree | Azimuth angle | 0 degree (south) |
| Number of panels | 24 | DC cable length | 16 m |
| Inverter type | GROWATT On-grid 4.5 kW MPPT | Inverter DC output voltage | 48 VDC |
| Inverter DC nominal voltage | 150 VDC | Inverter AC output voltage | 220 VAC (1-ph) |
| PV panel dimension | 2.1 m × 1.05 m | Inverter efficiency | 98.4% |
| SEC Distribution System Parameters | |||
| Estimated line resistance | 0.306 Ω/km [41] | Estimated line inductance | 0.9444 mH/km [41] |
| Grid nominal AC voltage | 380 VAC (3-ph, 60 Hz) | PCC nominal AC voltage | 220 VAC (3-ph, 60 Hz) |
| Estimated line length | 1.24 km | Desired SCR | 5 |
| Rating of grid to PCC transformer | 50 kVA (380Y/220D) | Impedance of grid transformer | 6% |
| Parameter | Value |
|---|---|
| PPV,max | 12.68 kW 1 |
| Required area (for 18% system efficiency 5) | ~74 m2 |
| Number of PV panels (with 2.2 m2 each) | 34 panel |
| Recommended on-grid inverter capacity | 4 kW ≤ Pinv ≤ 12.5 kW |
| Recommended BESS inverter capacity | 0.5 kW ≤ Pinv ≤ 1.5 kW |
| Estimated BESS size (10% of PPV,max daytime operation) and 48 Vdc | ~80 Ah ≤ BESS ≤ ~300 Ah |
| Equipment | Count | Total Cost (USD) | |
|---|---|---|---|
| PV system | 385 W PV panel | 26 | 3900 |
| On-grid hybrid inverter (12 kW-1 ph-220 VAC) | 1 | 2560 | |
| Mounting structure | 2 | 1400 | |
| DC cable roll | 4 | 640 | |
| PV MC4 connectors | 28 | 87 | |
| DC circuit breakers | 2 | 60 | |
| DC and AC circuit breakers | 2 | 46 | |
| Installation fees | 1 | 3210 | |
| Total | 11,903 | ||
| BESS system | 48 V battery (100 Ah) | 2 | 240 |
| Battery rack | 2 | 60 | |
| On-grid hybrid inverter (1.5 kW-1 ph-220 VAC) | 1 | 310 | |
| Installation fees | 1 | 200 | |
| 3-winding power transformer (10 kVA) | 1 | 450 | |
| Total | 1260 | ||
Disclaimer/Publisher’s Note: The statements, opinions and data contained in all publications are solely those of the individual author(s) and contributor(s) and not of MDPI and/or the editor(s). MDPI and/or the editor(s) disclaim responsibility for any injury to people or property resulting from any ideas, methods, instructions or products referred to in the content. |
© 2024 by the authors. Licensee MDPI, Basel, Switzerland. This article is an open access article distributed under the terms and conditions of the Creative Commons Attribution (CC BY) license (https://creativecommons.org/licenses/by/4.0/).
Share and Cite
Alfaris, F.E.; Al-Ammar, E.A.; Ghazi, G.A.; Al-Katheri, A.A. Design Enhancement of Grid-Connected Residential PV Systems to Meet the Saudi Electricity Regulations. Sustainability 2024, 16, 5235. https://doi.org/10.3390/su16125235
Alfaris FE, Al-Ammar EA, Ghazi GA, Al-Katheri AA. Design Enhancement of Grid-Connected Residential PV Systems to Meet the Saudi Electricity Regulations. Sustainability. 2024; 16(12):5235. https://doi.org/10.3390/su16125235
Chicago/Turabian StyleAlfaris, Faris E., Essam A. Al-Ammar, Ghazi A. Ghazi, and Ahmed A. Al-Katheri. 2024. "Design Enhancement of Grid-Connected Residential PV Systems to Meet the Saudi Electricity Regulations" Sustainability 16, no. 12: 5235. https://doi.org/10.3390/su16125235