
Examining How Urban Public Spaces and Virtual Spaces Affect Public Opinion in Beijing, China


Abstract
1. Introduction
2. Methodology
2.1. Case Study
2.2. Data and Sampling
2.2.1. Sampling Procedure
Participant Selection
Data Collection Techniques
Exclusion Criteria
2.2.2. Research Hypotheses
Data Analysis
Questionnaire Questions (Indicators)
2.3. Methods
3. Results
4. Discussion
4.1. Attractiveness
4.2. Facilities
4.3. Activities
4.4. Social Environment
4.5. Safety
4.6. Implications for Urban Planning
4.7. Limitations and Future Research
5. Conclusions
Author Contributions
Funding
Data Availability Statement
Conflicts of Interest
References
- Wojciuk, N.; Milwicz, R.; Nowotarski, P. Analysis of The Urban Space Perception, Transformed Under the Influence of Complementary Architecture. Procedia Eng. 2016, 161, 1338–1342. [Google Scholar] [CrossRef]
- Seresinhe, C.I.; Preis, T.; Mackerron, G.; Moat, H.S. Happiness is Greater in More Scenic Locations. Sci. Rep. 2019, 9, 4498. [Google Scholar] [CrossRef]
- Negami, H.R.; Mazumder, R.; Reardon, M.; Ellard, C.G. Field analysis of psychological effects of urban design: A case study in Vancouver. Cities Health 2018, 2, 106–115. [Google Scholar] [CrossRef]
- Field, A. Integrating Health Impact Assessment in Urban Design and Planning: The Manukau Experience; Ministry of Health: Wellington, New Zealand, 2010.
- Hematian, H.; Ranjbar, E. Evaluating urban public spaces from mental health point of view: Comparing pedestrian and car-dominated streets. J. Transp. Health 2022, 27, 101532. [Google Scholar] [CrossRef]
- Lu, X.; Tomkins, A.; Hehl-lange, S.; Lange, E. Computers, Environment and Urban Systems Finding the difference: Measuring spatial perception of planning phases of high-rise urban developments in Virtual Reality. Comput. Environ. Urban Syst. 2021, 90, 101685. [Google Scholar] [CrossRef]
- Amado, M.P.; Santos, C.V.; Moura, E.B.; Silva, V.G. Public Participation in Sustainable Urban Planning. Int. J. Hum. Soc. Sci. 2010, 5, 102–108. [Google Scholar]
- Forester, J. The Deliberative Practitioner: Encouraging Participatory Planning Processes; MIT Press: Cambridge, MA, USA, 1999; pp. 90–92. [Google Scholar]
- Foroughi, M.; de Andrade, B.; Roders, A.P.; Wang, T. Public participation and consensus-building in urban planning from the lens of heritage planning: A systematic literature review. Cities 2023, 135, 104235. [Google Scholar] [CrossRef]
- Su, Y.; Li, Y.; Xuan, S. Prediction of complex public opinion evolution based on improved multi-objective grey wolf optimizer. Egypt. Inform. J. 2023, 24, 149–160. [Google Scholar] [CrossRef]
- Mouratidis, K.; Hassan, R. Contemporary versus traditional styles in architecture and public space: A virtual reality study with 360-degree videos. Cities 2020, 97, 102499. [Google Scholar] [CrossRef]
- Schindler, I.; Hosoya, G.; Menninghaus, W.; Beermann, U.; Wagner, V.; Eid, M.; Scherer, K.R. Measuring Aesthetic Emotions: A Review of the Literature and a New Assessment Tool. PLoS ONE 2017, 12, e0178899. [Google Scholar] [CrossRef]
- Najafi, P.; Mohammadi, M.; van Wesemael, P.; Le Blanc, P.M. A user-centred virtual city information model for inclusive community design: State-of-art. Cities 2023, 134, 104203. [Google Scholar] [CrossRef]
- Tao, W. Interdisciplinary urban GIS for smart cities: Advancements and opportunities. Geo-Spatial Inf. Sci. 2013, 16, 25–34. [Google Scholar] [CrossRef]
- Bishop, I.D. Location based information to support understanding of landscape futures. Landsc. Urban Plan. 2015, 42, 120–131. [Google Scholar] [CrossRef]
- Han, Y.; Peng, Z.R. The integration of local government, residents, and insurance in coastal adaptation: An agent-based modeling approach. Comput. Environ. Urban Syst. 2019, 76, 69–79. [Google Scholar] [CrossRef]
- Kim, Y.; Newman, G. Advancing scenario planning through integrating urban growth prediction with future flood risk models. Comput. Environ. Urban Syst. 2020, 82, 101498. [Google Scholar] [CrossRef]
- Ma, Y.; Wright, J.; Gopal, S.; Phillips, N. Seeing the invisible: From imagined to virtual urban landscapes. Cities 2020, 98, 102559. [Google Scholar] [CrossRef]
- El Sayad, Z.T.; Ayad, H.M. VRGIS as assistance tool for urban decision making Rafah—Gaza—Palestine. Alex. Eng. J. 2019, 58, 367–375. [Google Scholar] [CrossRef]
- Nelson, P.P. A framework for the future of urban underground engineering. Tunn. Undergr. Sp. Technol. 2016, 55, 32–39. [Google Scholar] [CrossRef]
- Fairbairn, D.; Parsley, S. The use of VRML for cartographic presentation. Comput. Geosci. 1997, 23, 475–481. [Google Scholar] [CrossRef]
- Anastasiou, E.; Manika, S. Perceptions, Determinants and Residential Satisfaction from Urban Open Spaces. Open J. Soc. Sci. 2020, 8, 1. [Google Scholar] [CrossRef]
- Reyes-Riveros, R.; Altamirano, A.; De La Barrera, F.; Rozas-Vásquez, D.; Vieli, L.; Meli, P. Linking public urban green spaces and human well-being: A systematic review. Urban For. Urban Green. 2021, 61, 127105. [Google Scholar] [CrossRef]
- Ziya, M.; Cansu, P.; Ayşen, S. Changing perceptions and usage of public and pseudo–public spaces in the post–pandemic city: The case of Istanbul. URBAN Des. Int. 2022, 27, 64–79. [Google Scholar] [CrossRef]
- Zheng, Y.; Cheng, L.; Wang, Y.; Wang, J. Exploring the impact of explicit and implicit urban form on carbon emissions: Evidence from Beijing, China. Ecol. Indic. 2023, 154, 110558. [Google Scholar] [CrossRef]
- Ghahramani, M.; Galle, N.J.; Duarte, F.; Ratti, C.; Pilla, F. Leveraging arti fi cial intelligence to analyze citizens’ opinions on urban green. City Environ. Interact. 2021, 10, 100058. [Google Scholar] [CrossRef]
- Klein, W.; Dove, M.R.; Felson, A.J. Urban Forestry & Urban Greening Engaging the unengaged: Understanding residents’ perceptions of social access to urban public space. Urban For. Urban Green. 2021, 59, 126991. [Google Scholar] [CrossRef]
- Rohil, M.K.; Ashok, Y. Results in Engineering Visualization of urban development 3D layout plans with augmented reality. Results Eng. 2022, 14, 100447. [Google Scholar] [CrossRef]
- Mehta, M.; Bhattacharyya, J. National Conference on Industry 4.0: Innovation, Transformation & Business Strategies; The Native Tribe: Kokrajhar, India, 2023. [Google Scholar] [CrossRef]
- Avakiat, S.; Roopsuwankun, P. The Important Factors Influencing the Purchase Decision of Products via Online Application (Mobile Application) of Consumers in Bangkok. Apheit Int. J. 2021, 10, 45–56. [Google Scholar]
- Shrestha, N. Factor Analysis as a Tool for Survey Analysis. Am. J. Appl. Math. Stat. 2021, 9, 4–11. [Google Scholar] [CrossRef]
- Arafat, S.M.Y.; Chowdhury, R. Cross-cultural adaptation and psychometric validation of research instruments: A methodological review. J. Behav. Health 2016, 5, 129–136. [Google Scholar] [CrossRef]
- Sim, M.; Kim, S.; Suh, Y. Sample Size Requirements for Simple and Complex Mediation Models. Educ. Psychol. Meas. 2022, 82, 76–106. [Google Scholar] [CrossRef]
- Härdle, W.K. Handbook of Partial Least Squares: Concepts, Methods and Applications; Springer Handbooks of Computational Statistics Series; Springer: Berlin/Heidelberg, Germany, 2012. [Google Scholar]
- Taber, K.S. The Use of Cronbach’s Alpha When Developing and Reporting Research Instruments in Science Education. Res. Sci. Educ. 2018, 48, 1273–1296. [Google Scholar] [CrossRef]
- Chirico, N.; Gramatica, P. Real external predictivity of QSAR models: How to evaluate It? Comparison of different validation criteria and proposal of using the concordance correlation coefficient. J. Chem. Inf. Model. 2011, 51, 2320–2335. [Google Scholar] [CrossRef]
- Rak, T. Cronbach’s alpha—What makes it really good? Some advice for planning and criticizing psychological questionnaires. Przegląd Psychol. 2023, 66, 151–167. [Google Scholar] [CrossRef]
- Franke, G.; Franke, G. Heuristics versus statistics in discriminant validity testing: A comparison of four procedures. Internet Res. 2018, 29, 430–447. [Google Scholar] [CrossRef]
- Cohen, P.; Cohen, J.; Teresi, J.; Marchi, M. Problems in the Measurement of Latent Variables in Structural Equations Causal Models. Appl. Psychol. Meas. 1990, 14, 183–196. [Google Scholar] [CrossRef]
- Davari, A.; Rezazadeh, A. Toward the measurement of Alliance Entrepreneurship; Initial Scale Development and Validation Toward the measurement of alliance entrepreneurship: Initial scale development and validation. Int. J. Manag. Enterp. Dev. 2015, 14, 103–125. [Google Scholar] [CrossRef]
- Suhan, M.; Nayak, S.; Nayak, R.; Spulbar, C.; Bai, G.V.; Birau, R.; Anghel, L.C.; Stanciu, C.V. Exploring the sustainable effect of mediational role of brand commitment and brand trust on brand loyalty: An empirical study. Econ. Res. Istraz. 2022, 35, 6422–6444. [Google Scholar] [CrossRef]
- Cardozo, O.D.; García-Palomares, J.C.; Gutiérrez, J. Application of geographically weighted regression to the direct forecasting of transit ridership at station-level. Appl. Geogr. 2012, 34, 548–558. [Google Scholar] [CrossRef]
- Cuong, D.T.; Khoi, B. The Effect of Brand Image and Perceived Value on Satisfaction and Loyalty at Convenience Stores in Vietnam. J. Adv. Res. Dyn. Control Syst. 2019, 11, 1446–1454. [Google Scholar]
- Sánchez-Infante Hernández, J.P.; Yañez-Araque, B.; Moreno-García, J. Moderating effect of firm size on the influence of corporate social responsibility in the economic performance of micro-, small- and medium-sized enterprises. Technol. Forecast. Soc. Chang. 2020, 151, 119774. [Google Scholar] [CrossRef]
- Rapoport, A. History and Precedent in Environmental Design; Springer: Berlin/Heidelberg, Germany, 1990. [Google Scholar] [CrossRef]
- Park, K. Psychological park accessibility: A systematic literature review of perceptual components affecting park use. Landsc. Res. 2017, 42, 508–520. [Google Scholar] [CrossRef]
- Wang, Z.; Jiang, H.; Zhang, W.; Liu, L. The Problem Analysis and Solution Suggestion in the Process of City Information Model Construction. In Proceedings of the 2020 4th International Conference on Smart Grid and Smart Cities (ICSGSC), Osaka, Japan, 18–21 August 2020; pp. 109–112. [Google Scholar] [CrossRef]
- Schindler, M.; Le Texier, M.; Caruso, G. How far do people travel to use urban green space? A comparison of three European cities. Appl. Geogr. 2022, 141, 102673. [Google Scholar] [CrossRef]

| Authors’ Names | Date of Research | Criteria | Sub-Criteria | Procedures |
|---|---|---|---|---|
| [1] | 2016 | Psychological, architectural, and digital aspects | Care for comfort of usage, rest and relax zones, good communication for making objects clear to follow, meeting the needs of residents, improving people’s quality of life, favorable social networking, good restoration process, emphasizing valuable elements | Review of metamorphosed spaces |
| [18] | 2020 | The role of urban underground infrastructures in urban planning decisions | Spatial and dynamic relationships between infrastructures’ features above and below city streets | VR |
| [11] | 2020 | Environmental perception and affective appraisal | Architecture and public space design that is pleasant, exciting, relaxing, safe, interesting, active, and familiar | Panel evaluation of 360-degree videos of real environments and mobile-based virtual reality platform |
| [26] | 2021 | Sentiment classification | _ _ _ | Artificial intelligence (AI) |
| [27] | 2021 | Nodes of belonging, narratives of space, expanding boundaries | People, activities, novelty, ability, implicit cultural understandings, structural constructs, specific stories, personal memories, direct visual reactions, spatially, temporally, socially | |
| [6] | 2021 | Land use, buildings’ height, density, development ratio, green ratio, public services, urban design | _ _ _ | Eye-gaze tracking and data processing |
| [5] | 2022 | Macro and micro factors of physical environment, natural factors, social factors | Mixed use, height, density, public transportation, attractiveness and aesthetic factors, active frontage, access to light, walkability, green space, quality of noise, air pollution, social relationships, crime, social security | PLS-SEM |
| [28] | 2022 | Creation of new structures, recreation of existing designs | _ _ _ | BIM and augmented reality (AR) |
| [9] | 2023 | Public participation and consensus | Actors, methods, levels, approaches, and conflicts | Statistical analysis methods |
| [13] | 2023 | Social, spatial, and lifestyle component | Leisure activities, interpersonal relationships, outdoor gathering areas, connected buildings, friendly walking routes, natural landscape, workout equipment, gardening, plant-based community, individual healthy habit plan | CIM and UDT |
| [10] | 2023 | Public opinion prediction and its revolutionary trends | _ _ _ | Improved multi-objective gray wolf optimizer |
| Dimension | Sub-Dimensions | Supporting Literature |
|---|---|---|
| Safety | Care for comfort, improve quality of life, ability, access to light, pollution, walkability | [5,11,18,24] |
| Attractiveness | Novelty, gardening, natural landscape, structural constructs | [5,6,23,29] |
| Facilities | Workout equipment, outdoor dining facilities, walking routes | [13,22] |
| Activities | Leisure activities, rest and relax zones | [22,23] |
| Social Environment | Outdoor gathering areas, interpersonal relationships, favorable social networking | [5,10,22,23] |
| Row | Structure (Variable) | Symbol Used |
|---|---|---|
| 1 | Safety | Sa |
| 2 | Attractiveness | At |
| 3 | Facilities | Fa |
| 4 | Activities | Ac |
| 5 | Social environment | So |
| 6 | Formation of public opinion | Pu |
| Dimensions | Frequency | Frequency Percentage | |
|---|---|---|---|
| Gender | Male | 82 | 68.3 |
| Female | 38 | 31.7 | |
| Age | 20–30 years old | 26 | 21.7 |
| 30–40 years old | 61 | 50.8 | |
| 40–50 years old | 27 | 22.5 | |
| Over 50 years old | 6 | 5.0 | |
| Marital status | Married | 75 | 62.5 |
| Single | 45 | 37.5 | |
| Education level | Diploma and associate degree | 15 | 12.5 |
| Bachelor’s degree | 77 | 64.2 | |
| Graduate degree | 20 | 16.7 | |
| Doctorate | 8 | 6.7 | |
| Work experience | 5 to 10 years | 31 | 25.8 |
| 6 to 11 years | 42 | 35.0 | |
| 11 to 15 years | 33 | 27.5 | |
| Over 15 years | 14 | 11.7 | |
| Total | 120 | 100% | |
| Dimensions | Mean | Median | Mode | Standard Deviation | Minimum | Maximum |
|---|---|---|---|---|---|---|
| Safety | 3.78 | 4.00 | 4.00 | 0.918 | 2.00 | 5.00 |
| Attractiveness | 4.18 | 4.00 | 4.00 | 0.796 | 2.00 | 5.00 |
| Facilities | 4.17 | 4.00 | 4.00 | 0.803 | 1.00 | 5.00 |
| Activities | 4.15 | 4.00 | 5.00 | 0.895 | 2.00 | 5.00 |
| Social environment | 4.01 | 4.00 | 4.00 | 0.850 | 2.00 | 5.00 |
| Formation of public opinion | 4.27 | 4.00 | 4.00 | 0.719 | 2.00 | 5.00 |
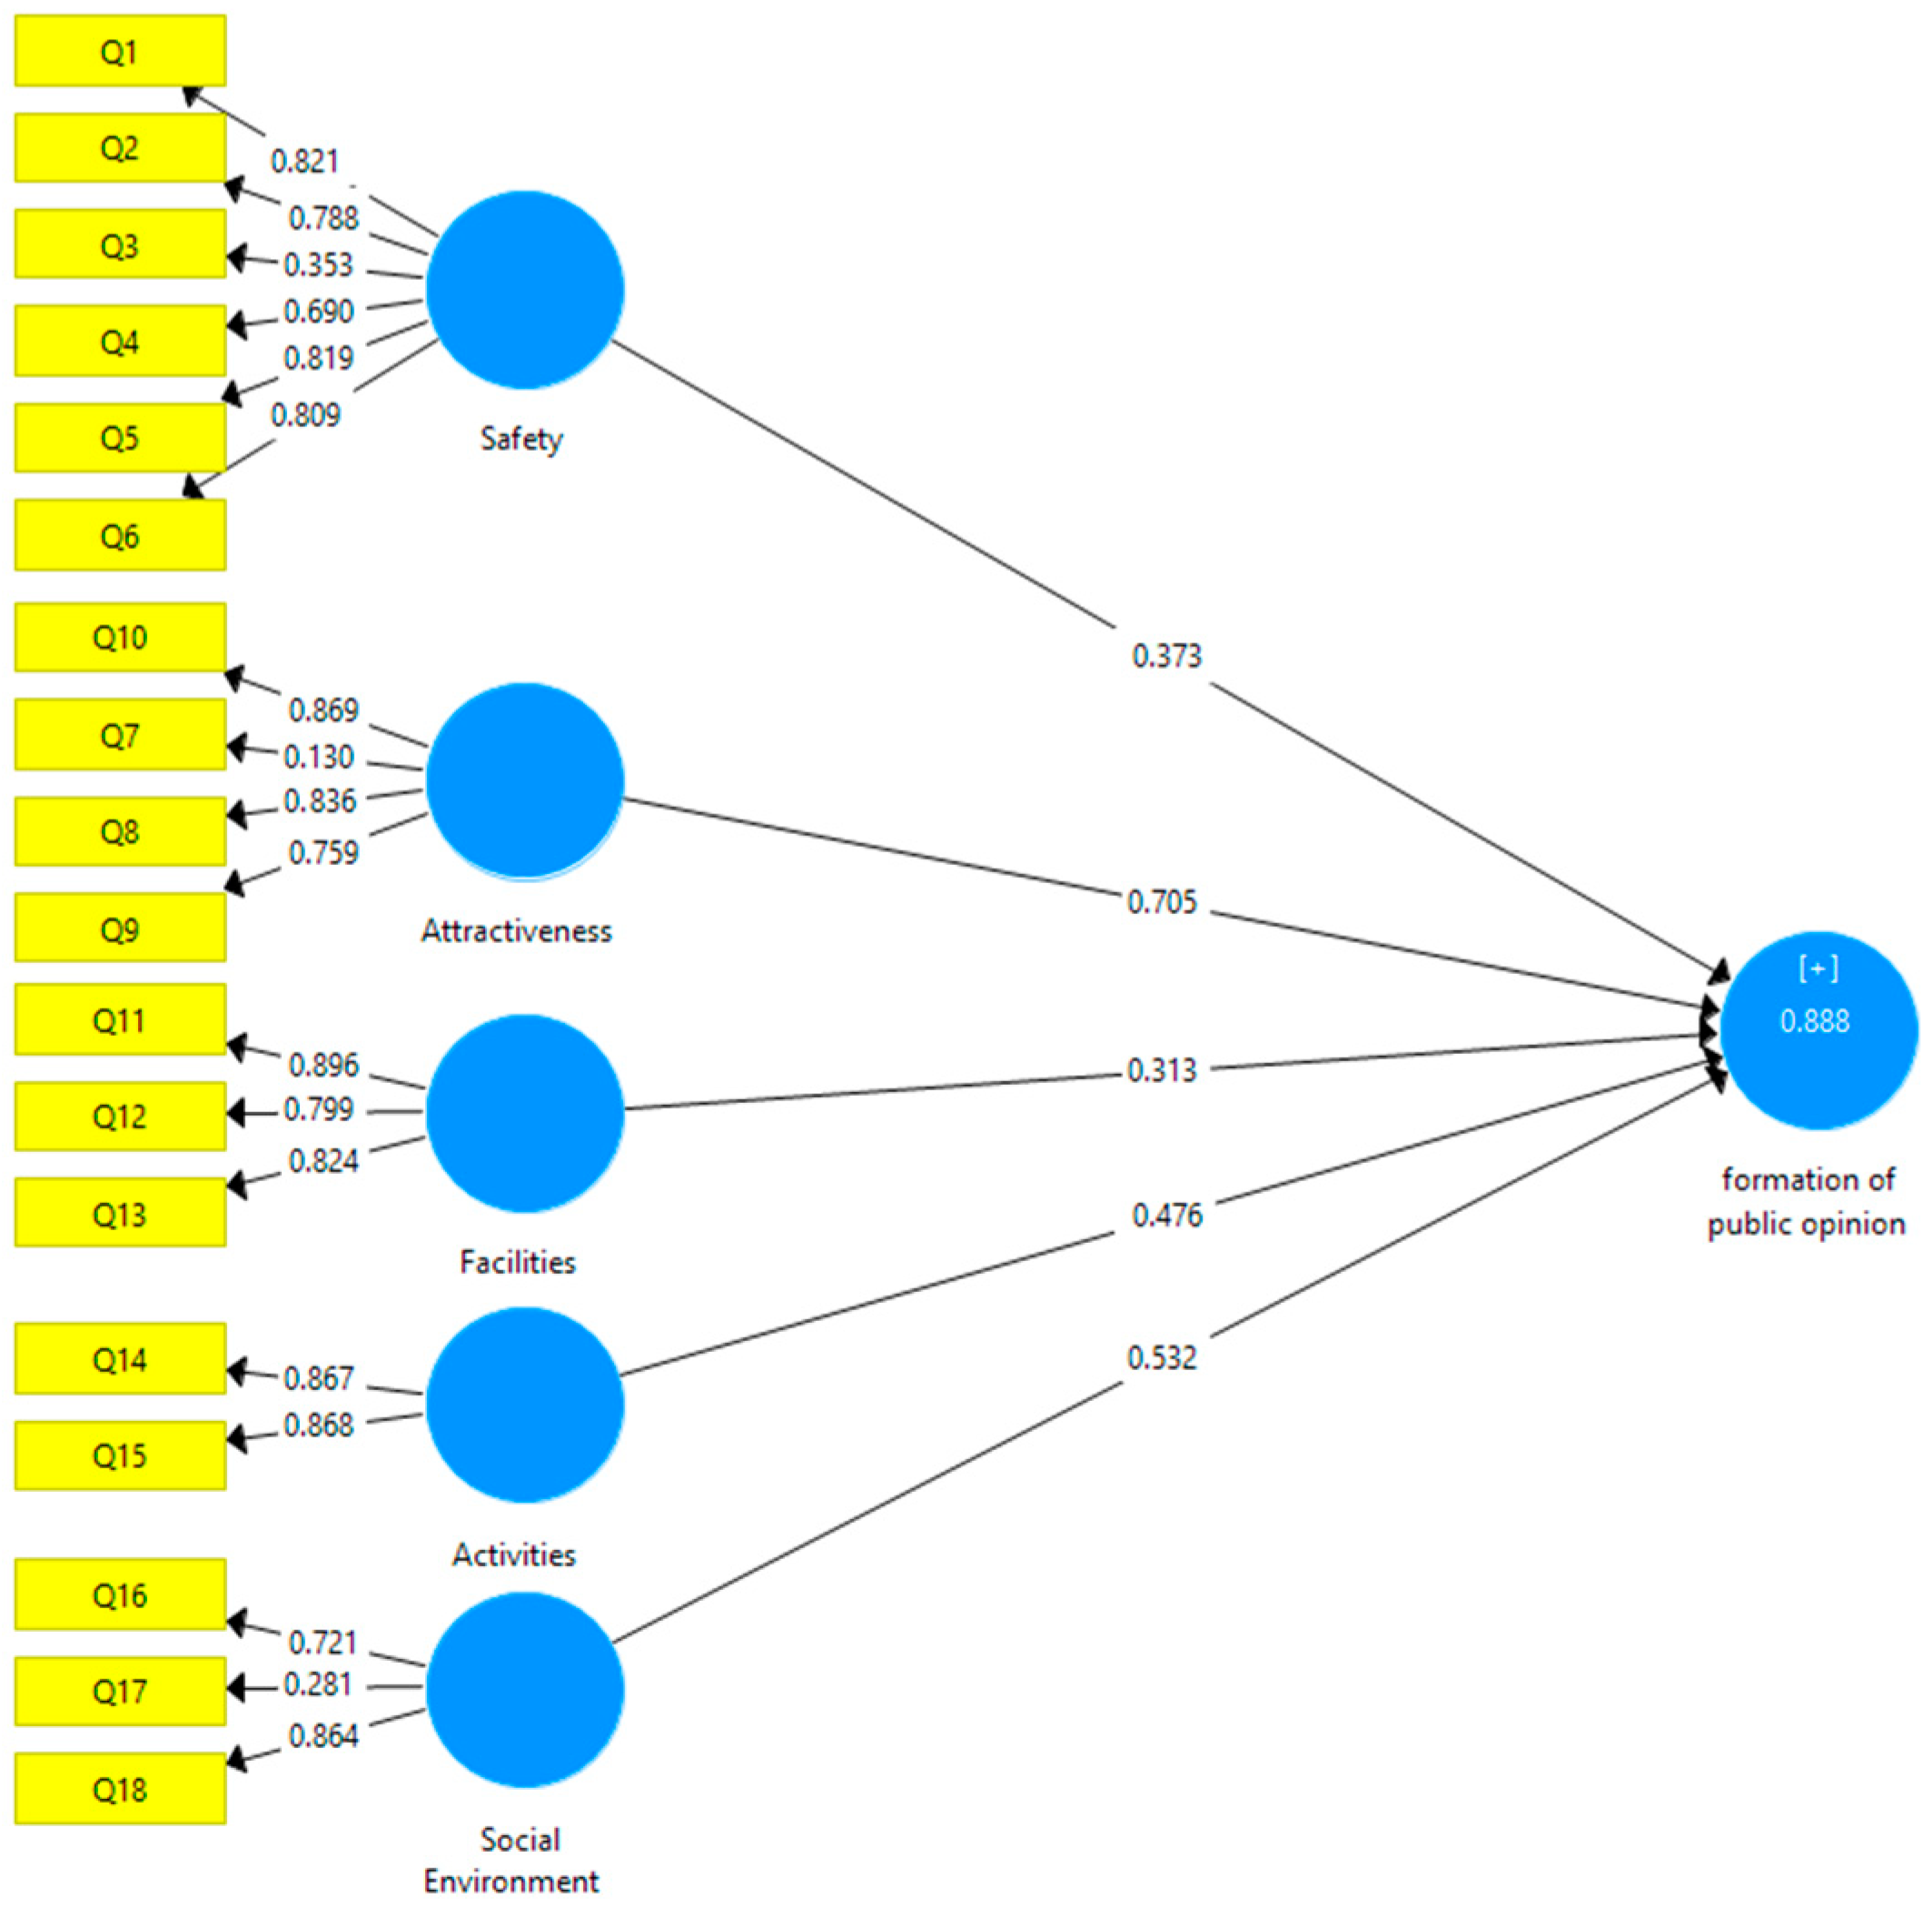
| Structure | Question Number | Factor Loading |
|---|---|---|
| Safety | Q1 | 0.821 |
| Q2 | 0.788 | |
| Q3 | 0.353 | |
| Q4 | 0.690 | |
| Q5 | 0.819 | |
| Q6 | 0.809 | |
| Attractiveness | Q7 | 0.130 |
| Q8 | 0.836 | |
| Q9 | 0.759 | |
| Q10 | 0.869 | |
| Facilities | Q11 | 0.896 |
| Q12 | 0.799 | |
| Q13 | 0.824 | |
| Activities | Q14 | 0.867 |
| Q15 | 0.868 | |
| Social Environment | Q16 | 0.721 |
| Q17 | 0.281 | |
| Q18 | 0.864 |
| Row | Dimension | Cronbach’s Alpha | CR | Rho_A |
|---|---|---|---|---|
| 1 | Activities | 0.789 | 0.863 | 0.803 |
| 2 | Attractiveness | 0.811 | 0.875 | 0.828 |
| 3 | Facilities | 0.929 | 0.940 | 0.944 |
| 4 | Safety | 0.900 | 0.919 | 0.910 |
| 5 | Social environment | 0.866 | 0.833 | 0.821 |
| 6 | Public opinion formation | 0.837 | 0.841 | 0.854 |
| Row | Dimension | AVE |
|---|---|---|
| 1 | Activities | 0.525 |
| 2 | Attractiveness | 0.700 |
| 3 | Facilities | 0.521 |
| 4 | Safety | 0.801 |
| 5 | Social environment | 0.582 |
| 6 | Public opinion formation | 0.711 |
| Ac | At | Fa | Sa | So | Pu | |
|---|---|---|---|---|---|---|
| Activities | 0.724 | |||||
| Attractiveness | 0.317 | 0.836 | ||||
| Facilities | 0.534 | 0.202 | 0.721 | |||
| Safety | 0.266 | 0.745 | 0.343 | 0.894 | ||
| Social environment | 0.242 | 0.667 | 0.654 | 0.307 | 0.763 | |
| Public opinion formation | 0.404 | 0.556 | 0.202 | 0.527 | 0.557 | 0.843 |
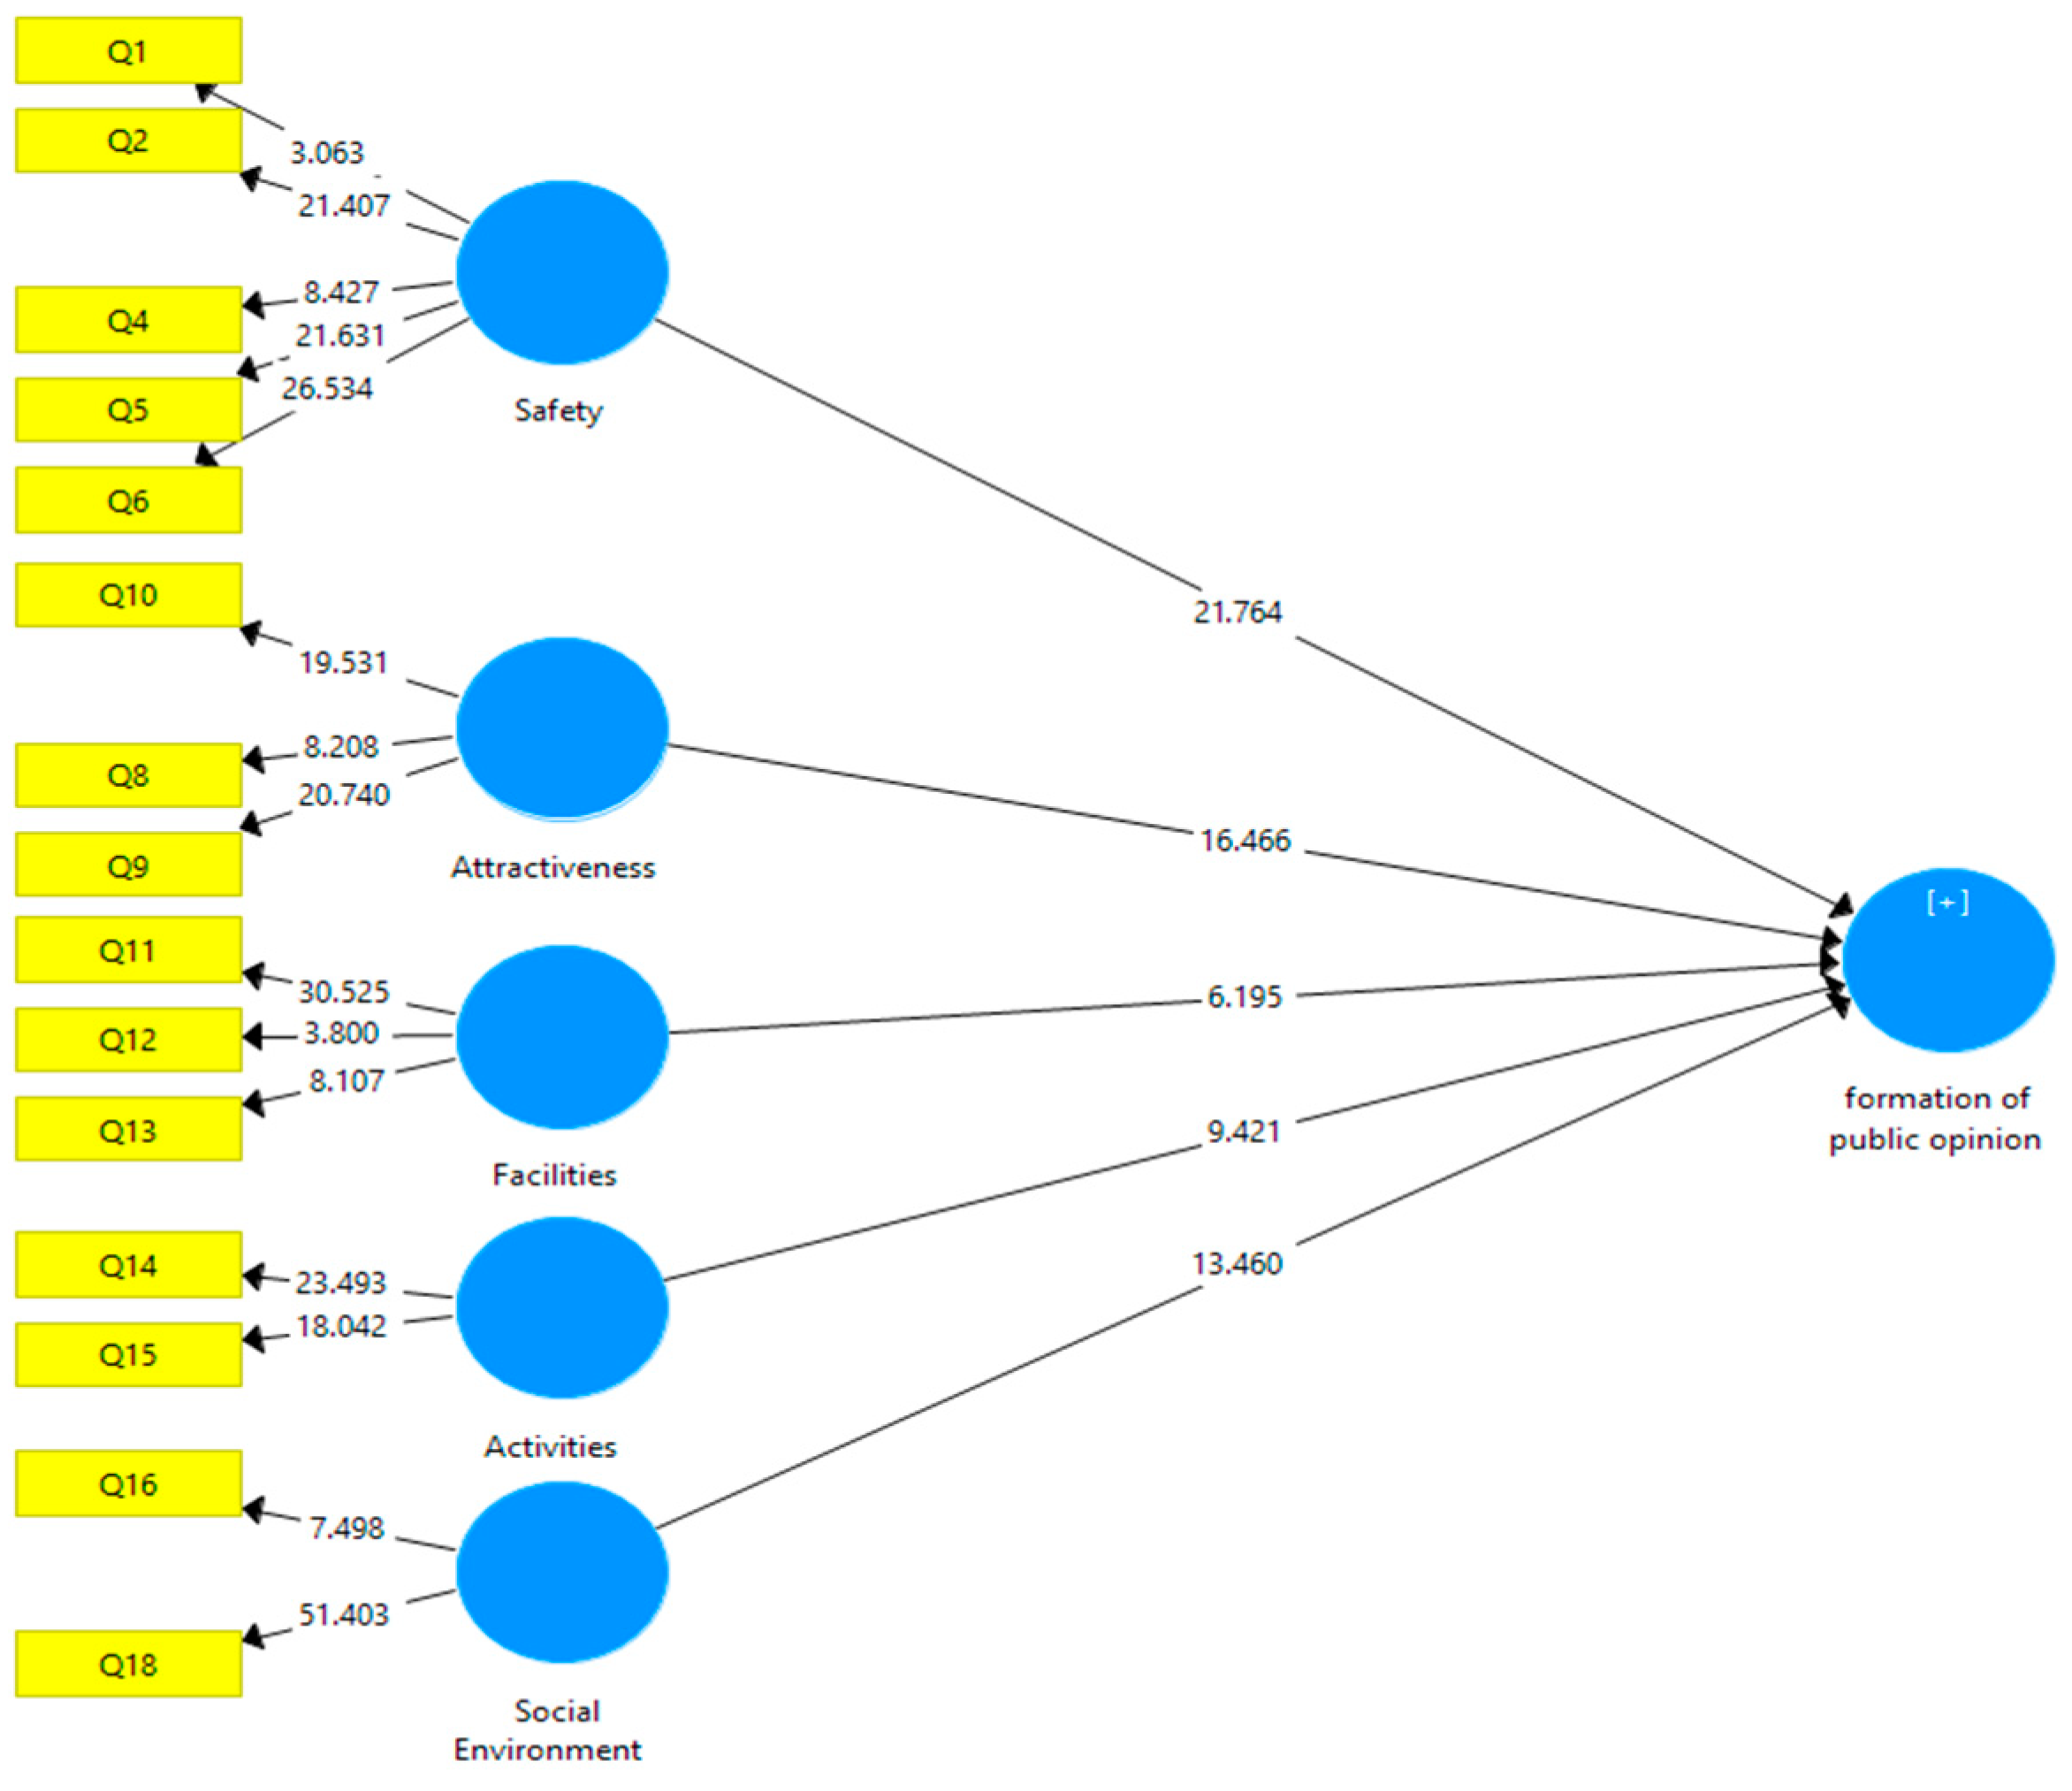
| Row | Path | t-Value |
|---|---|---|
| 1 | Safety → public opinion formation | 21.764 |
| 2 | Attractiveness → public opinion formation | 16.466 |
| 3 | Facilities ← public opinion formation | 6.195 |
| 4 | Activities ← public opinion formation | 9.421 |
| 5 | Social environment ← public opinion formation | 13.460 |
| Row | Path | Regression Coefficient |
|---|---|---|
| 1 | Safety → formation of public opinion | 0.558 |
| 2 | Attractiveness → formation of public opinion | 0.588 |
| 3 | Facilities → formation of public opinion | 0.316 |
| 4 | Activities → formation of public opinion | 0.409 |
| 5 | Social Environment → formation of public opinion | 0.503 |
| Row | Dimension | R-Squared (R2) Values |
|---|---|---|
| 1 | Formation of public opinion | 0.776 |
| Row | Path | f2 |
|---|---|---|
| 1 | Safety → formation of public opinion | 0.654 |
| 2 | Attractiveness → formation of public opinion | 0.237 |
| 3 | Facilities → formation of public opinion | 0.438 |
| 4 | Activities → formation of public opinion | 0.621 |
| 5 | Social environment → formation of public opinion | 0.570 |
| Row | Dimension | Q2 Values |
|---|---|---|
| 1 | Activities | 0.253 |
| 2 | Attractiveness | 0.379 |
| 3 | Facilities | 0.352 |
| 4 | Safety | 0.310 |
| 5 | Social environment | 0.397 |
| 6 | Formation of public opinion | 0.378 |
| Hypothesis Title | Standard Error | (T-Value) | Path Coefficient | p-Value | Status |
|---|---|---|---|---|---|
| Safety → formation of public opinion | 0.029 | 21.764 | 0.558 | 0.000 | Accepted |
| Attractiveness → formation of public opinion | 0.045 | 16.466 | 0.588 | 0.000 | Accepted |
| Facilities → formation of public opinion | 0.052 | 6.195 | 0.316 | 0.003 | Accepted |
| Activities → formation of public opinion | 0.119 | 9.421 | 0.409 | 0.000 | Accepted |
| Social environment → formation of public opinion | 0.069 | 13.460 | 0.503 | 0.000 | Accepted |
| Research Model Dimensions | Mean | Rank | Sig | Priority |
|---|---|---|---|---|
| Safety | 3.78 | 4.81 | 0.000 | 5 |
| Attractiveness | 4.18 | 6.52 | 1 | |
| Facilities | 4.17 | 6.02 | 2 | |
| Activities | 4.15 | 5.75 | 3 | |
| Social environment | 4.01 | 5.11 | 4 |
Disclaimer/Publisher’s Note: The statements, opinions and data contained in all publications are solely those of the individual author(s) and contributor(s) and not of MDPI and/or the editor(s). MDPI and/or the editor(s) disclaim responsibility for any injury to people or property resulting from any ideas, methods, instructions or products referred to in the content. |
© 2024 by the authors. Licensee MDPI, Basel, Switzerland. This article is an open access article distributed under the terms and conditions of the Creative Commons Attribution (CC BY) license (https://creativecommons.org/licenses/by/4.0/).
Share and Cite
Shao, L.; Liu, Z.; Zhou, Z. Examining How Urban Public Spaces and Virtual Spaces Affect Public Opinion in Beijing, China. Sustainability 2024, 16, 5249. https://doi.org/10.3390/su16125249
Shao L, Liu Z, Zhou Z. Examining How Urban Public Spaces and Virtual Spaces Affect Public Opinion in Beijing, China. Sustainability. 2024; 16(12):5249. https://doi.org/10.3390/su16125249
Chicago/Turabian StyleShao, Lingfang, Zhengxian Liu, and Zijin Zhou. 2024. "Examining How Urban Public Spaces and Virtual Spaces Affect Public Opinion in Beijing, China" Sustainability 16, no. 12: 5249. https://doi.org/10.3390/su16125249
APA StyleShao, L., Liu, Z., & Zhou, Z. (2024). Examining How Urban Public Spaces and Virtual Spaces Affect Public Opinion in Beijing, China. Sustainability, 16(12), 5249. https://doi.org/10.3390/su16125249