
Spatial Network Structure and Shift Path Prediction of Ecological Welfare Performance in Chinese Cities—Evidence from 284 Cities


Abstract
1. Introduction
2. Research Implications
3. Literature Review
3.1. Defining EWP Performance
3.2. Accounting and Assessment of EWP Performance
3.3. Advances in Spatio-Temporal Research on EWP Performance
3.4. Research Gap
4. Study Regions and Data Sources
4.1. Study Regions
4.2. Data Sources
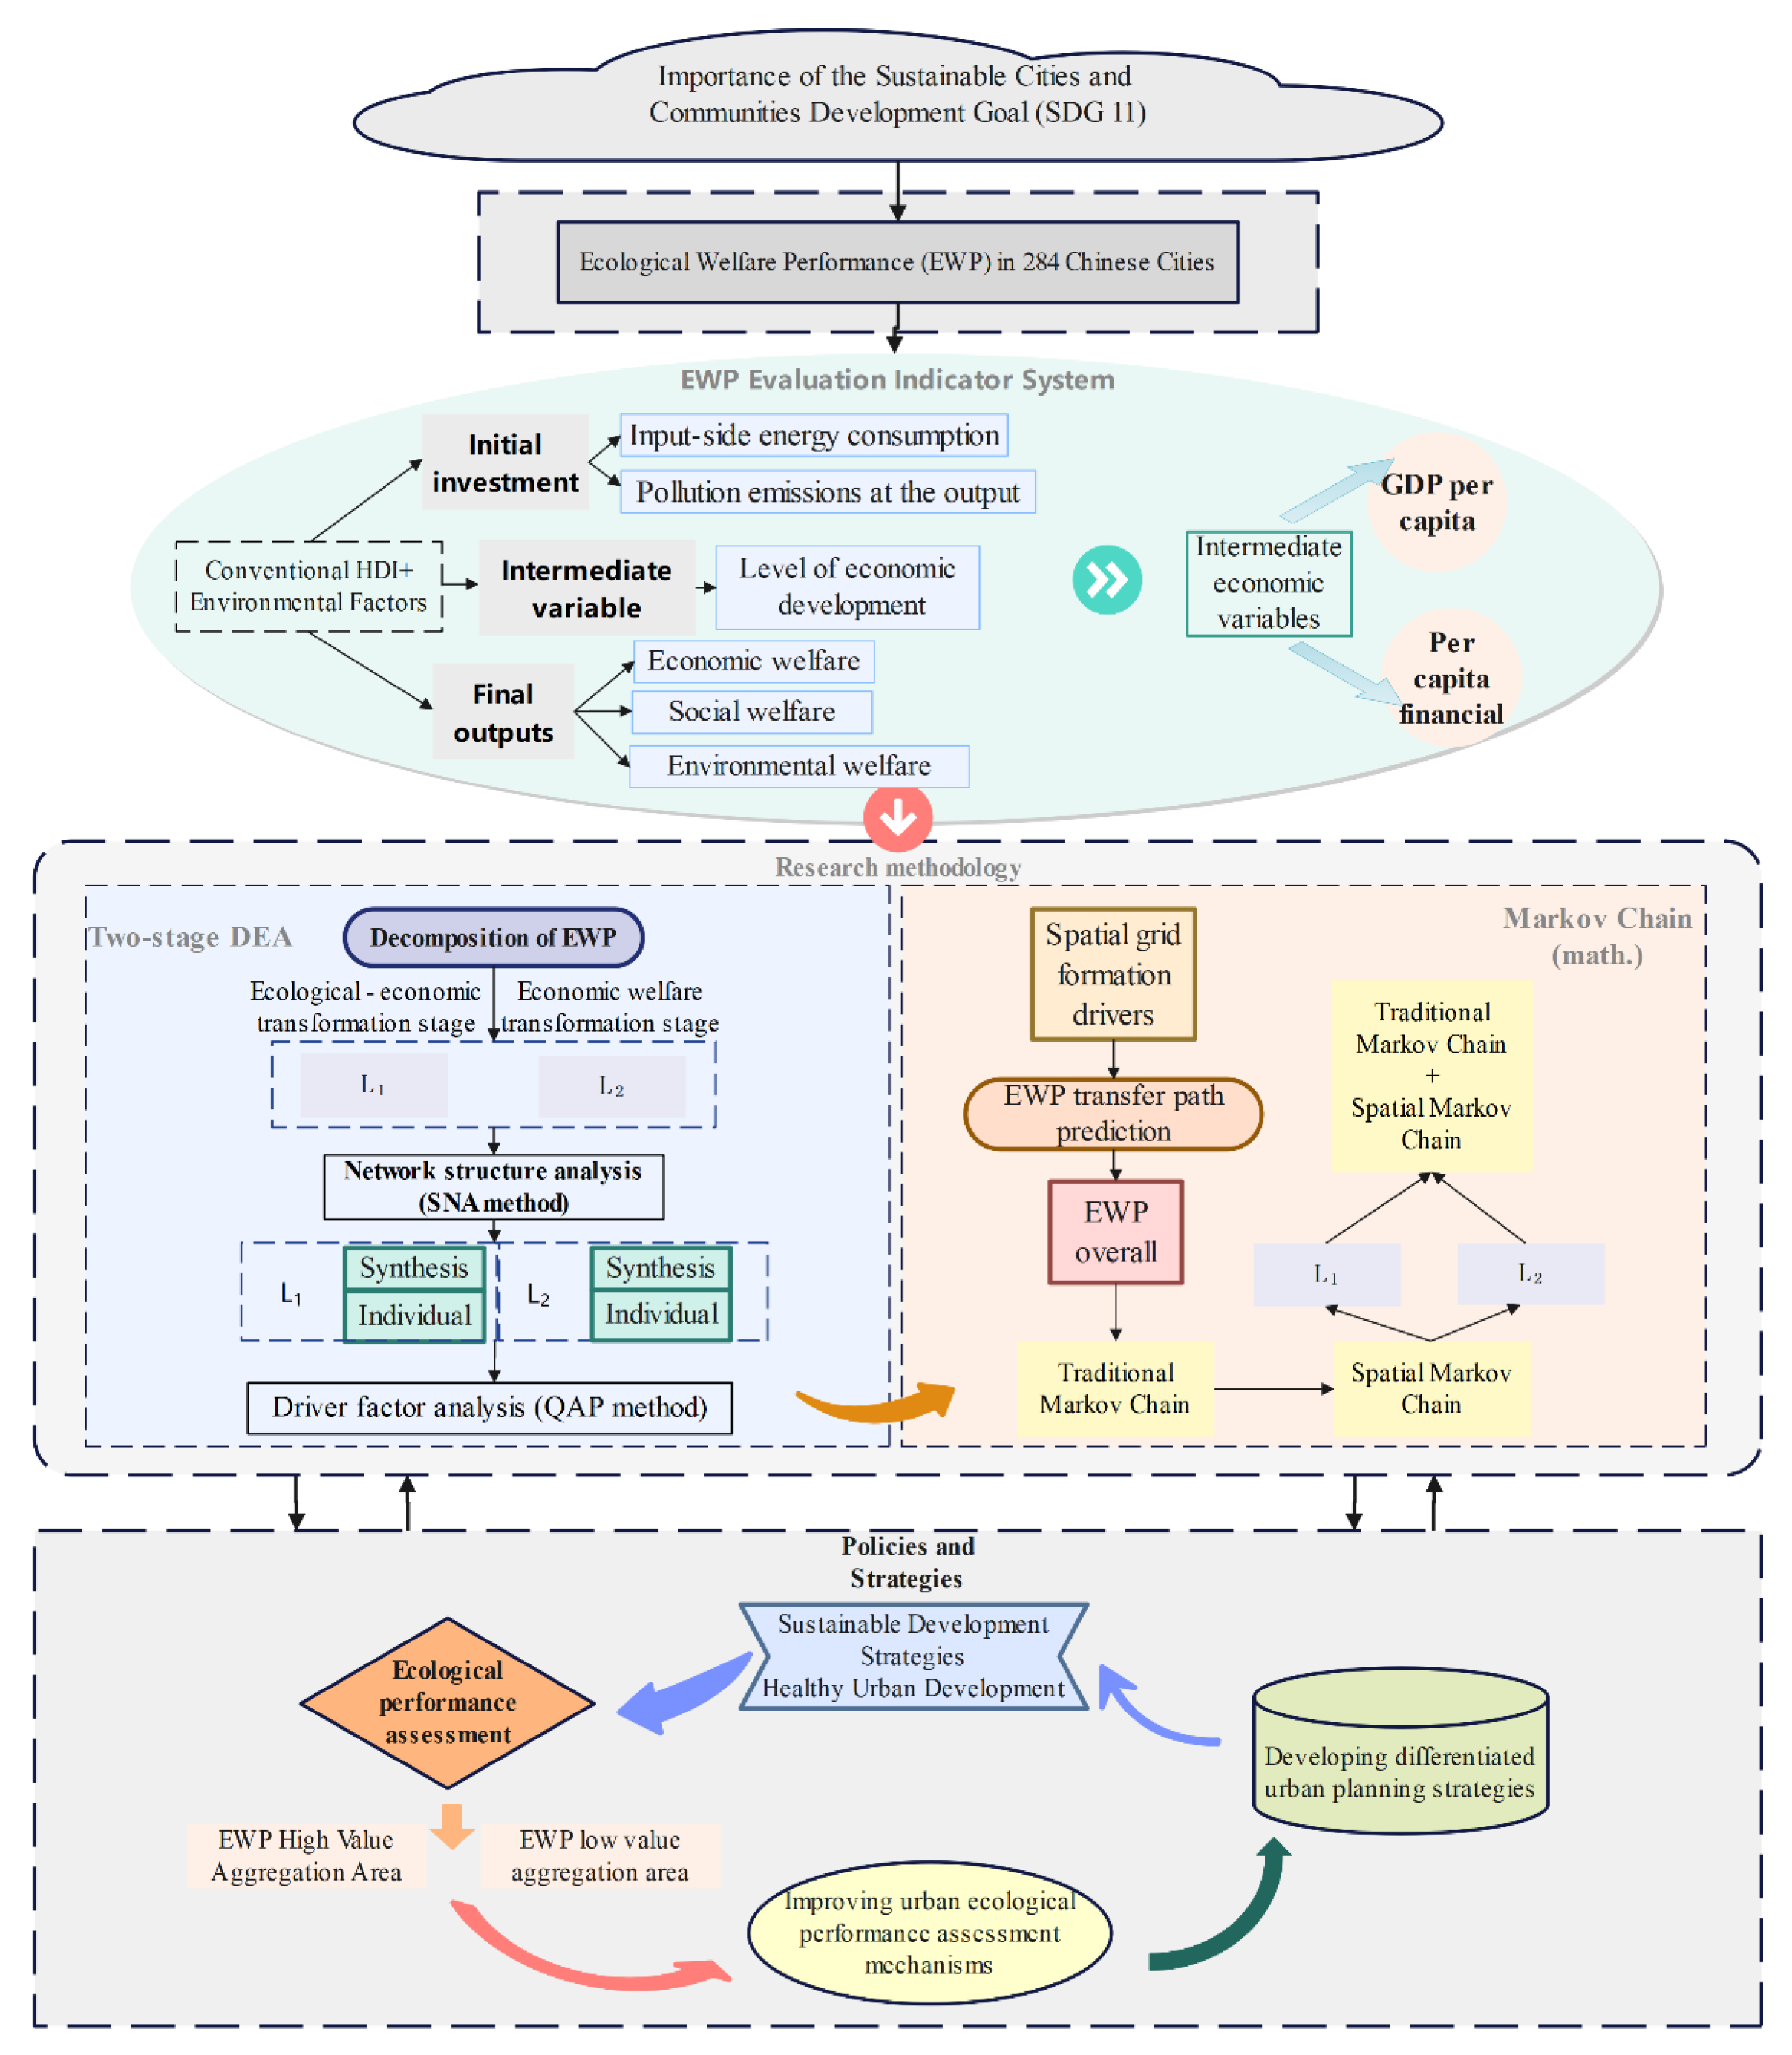
5. Methods
5.1. Two-Stage DEA Model
5.1.1. Ecological–Economic Transformation Phase
5.1.2. Economic Welfare Transformation Stage
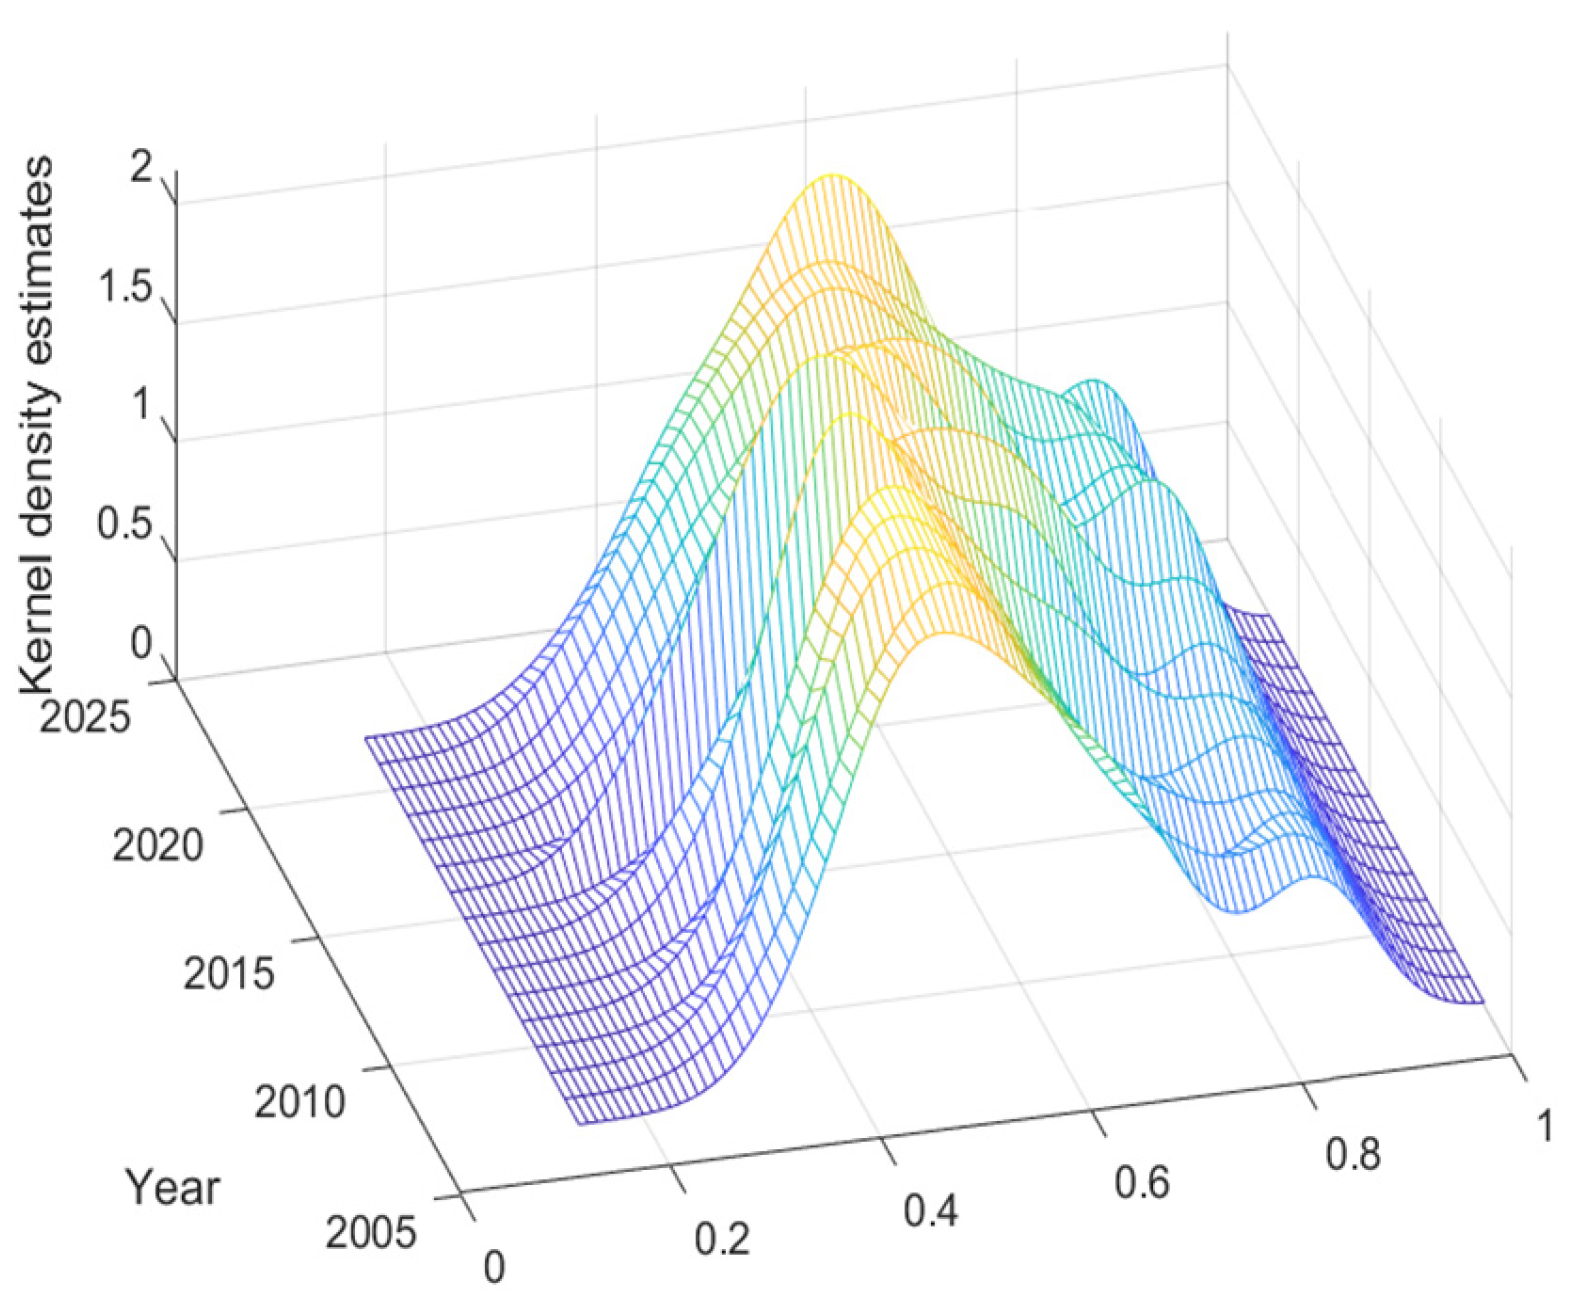
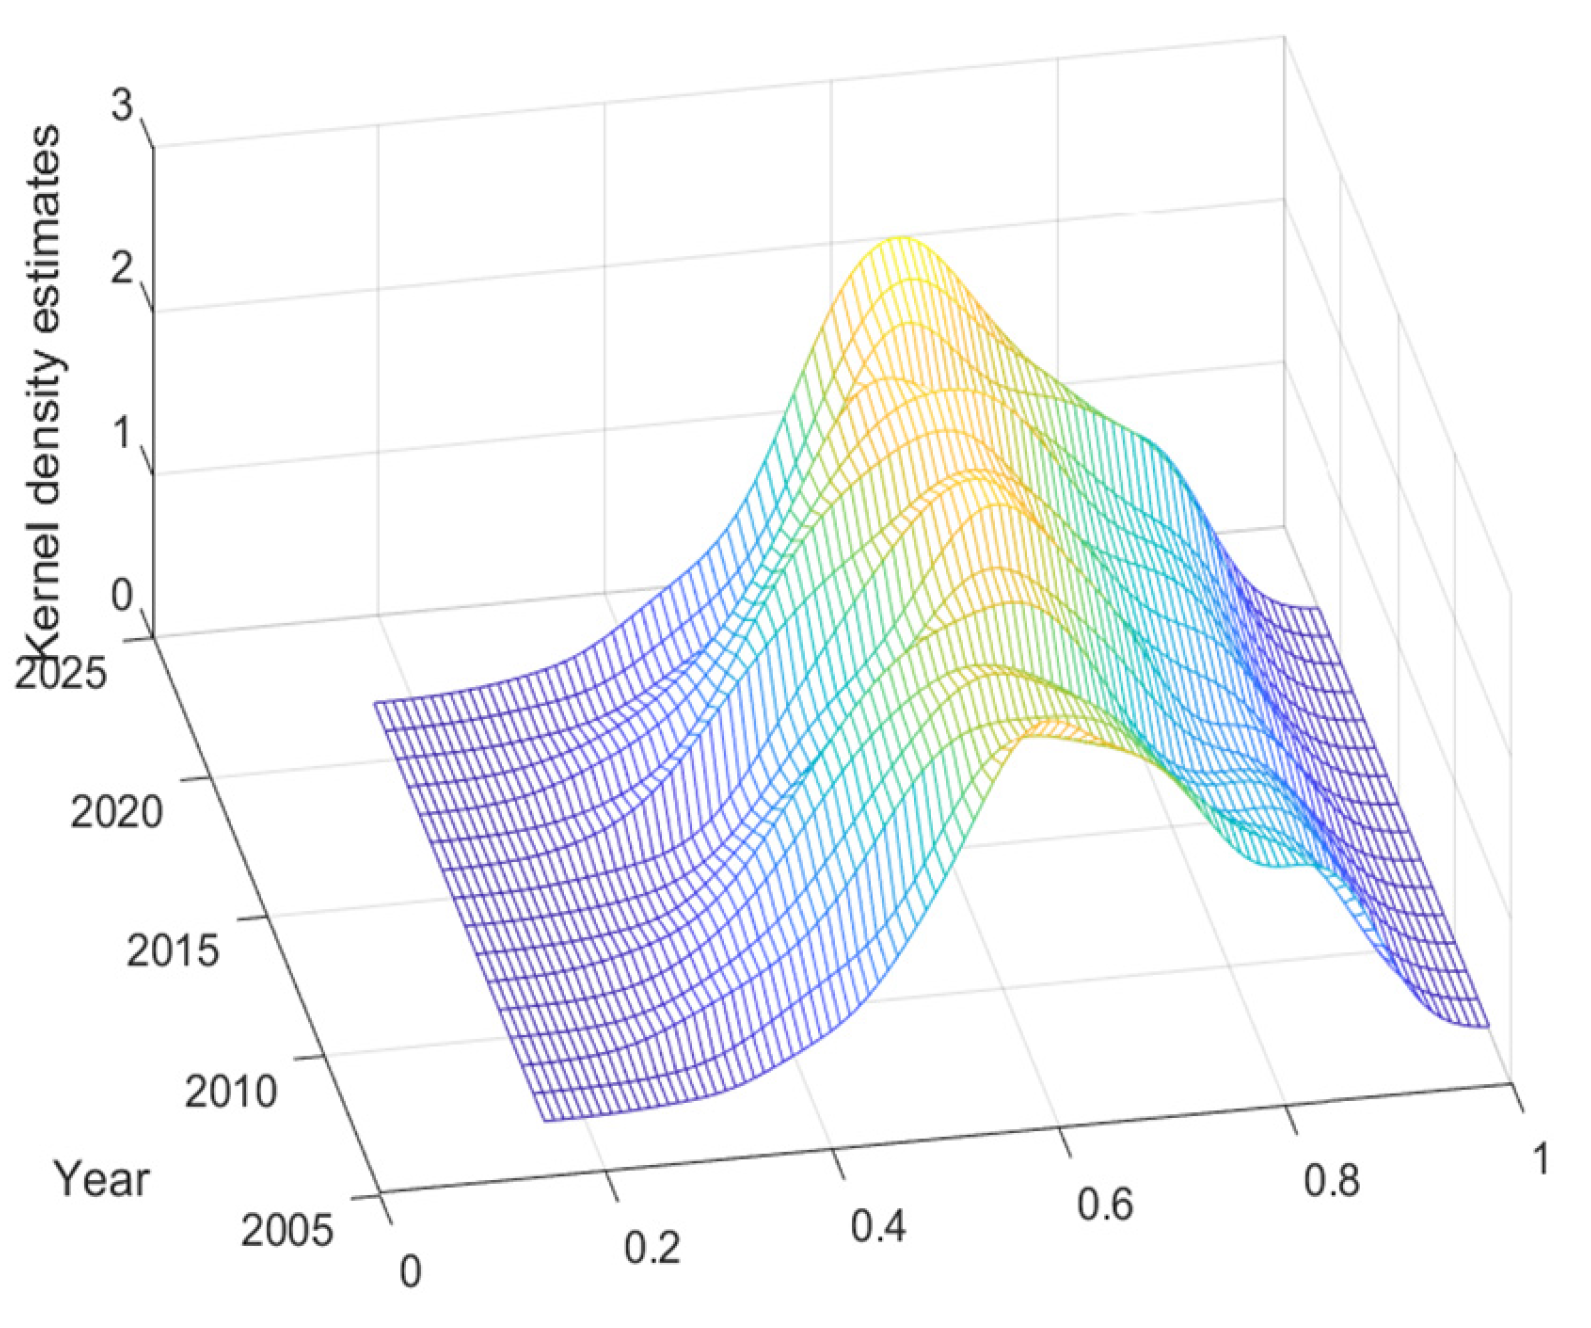
5.2. Kernel Density Estimate
5.3. SNA Method
5.3.1. Modified Gravitational Modeling and Network Calculations
5.3.2. QAP Model
5.4. Markov Chain Model
5.4.1. Traditional Markov Chain Model
5.4.2. Spatial Markov Chain
6. Results
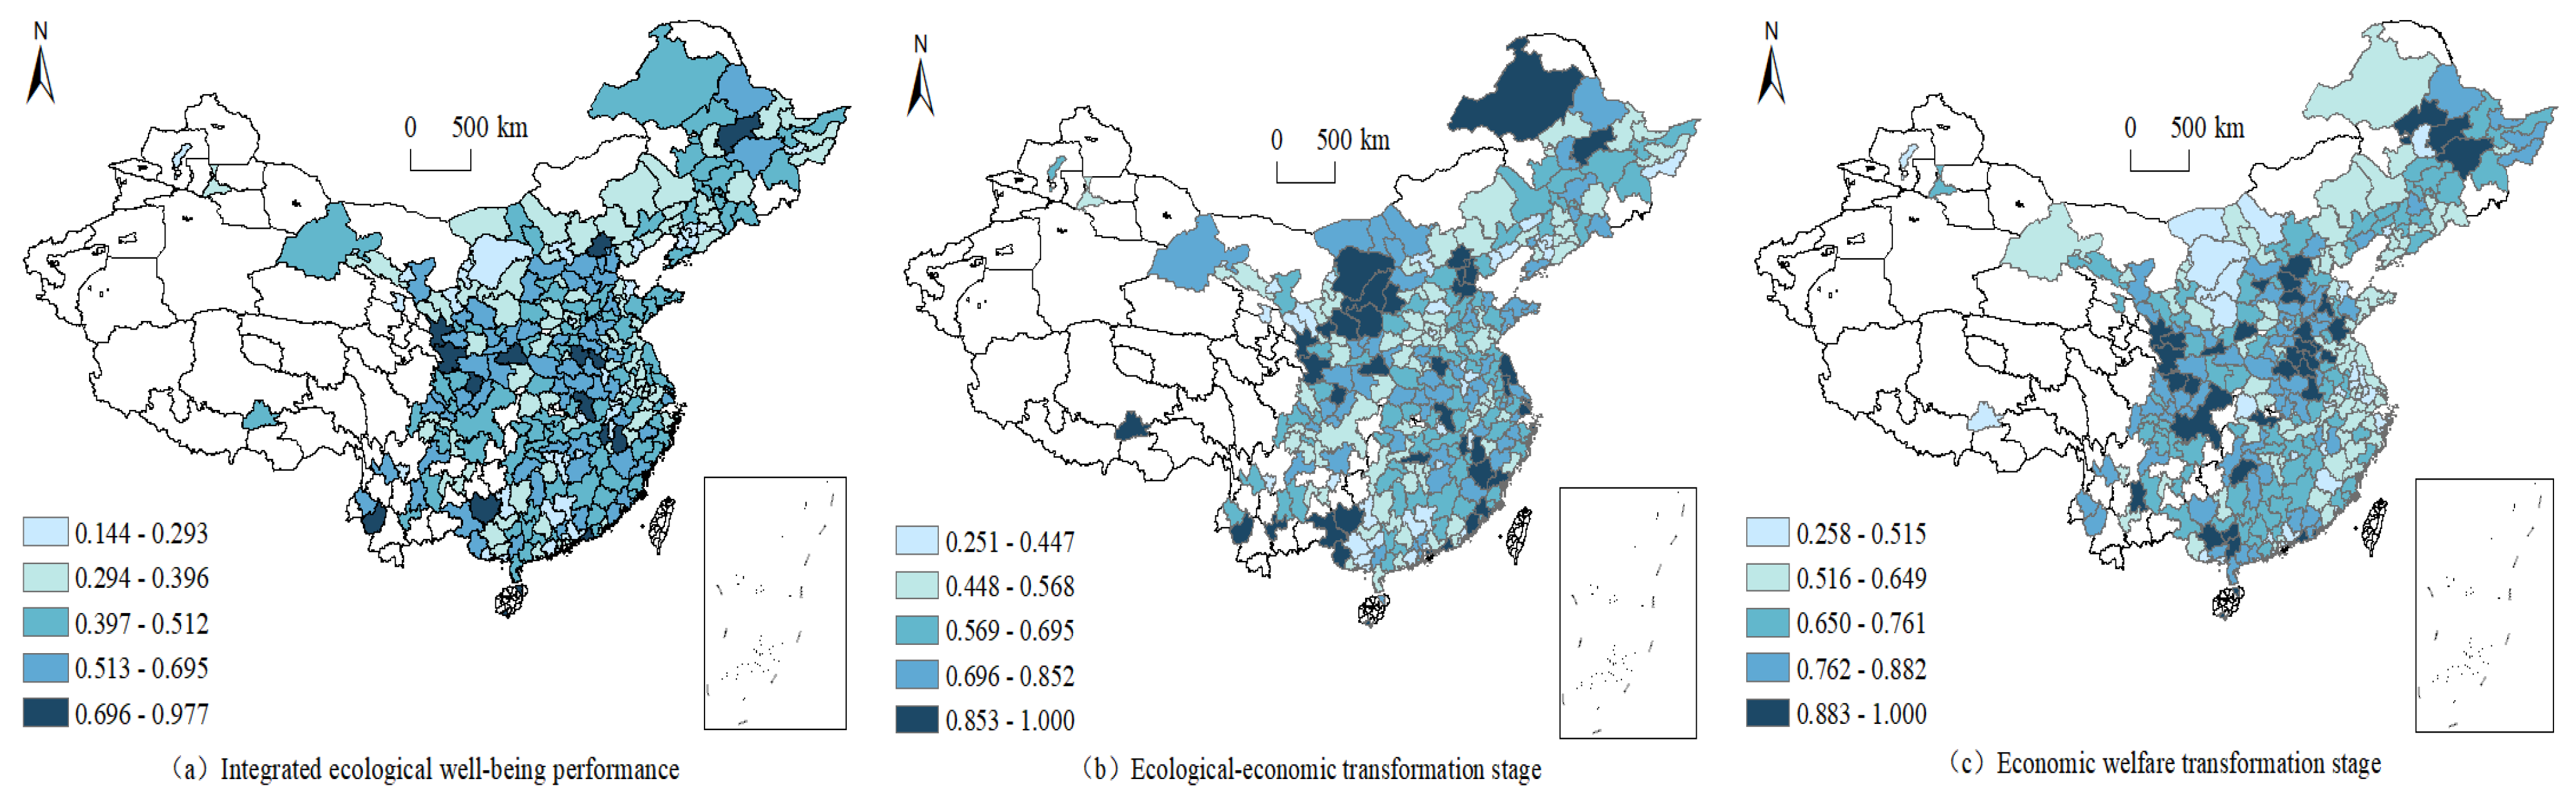
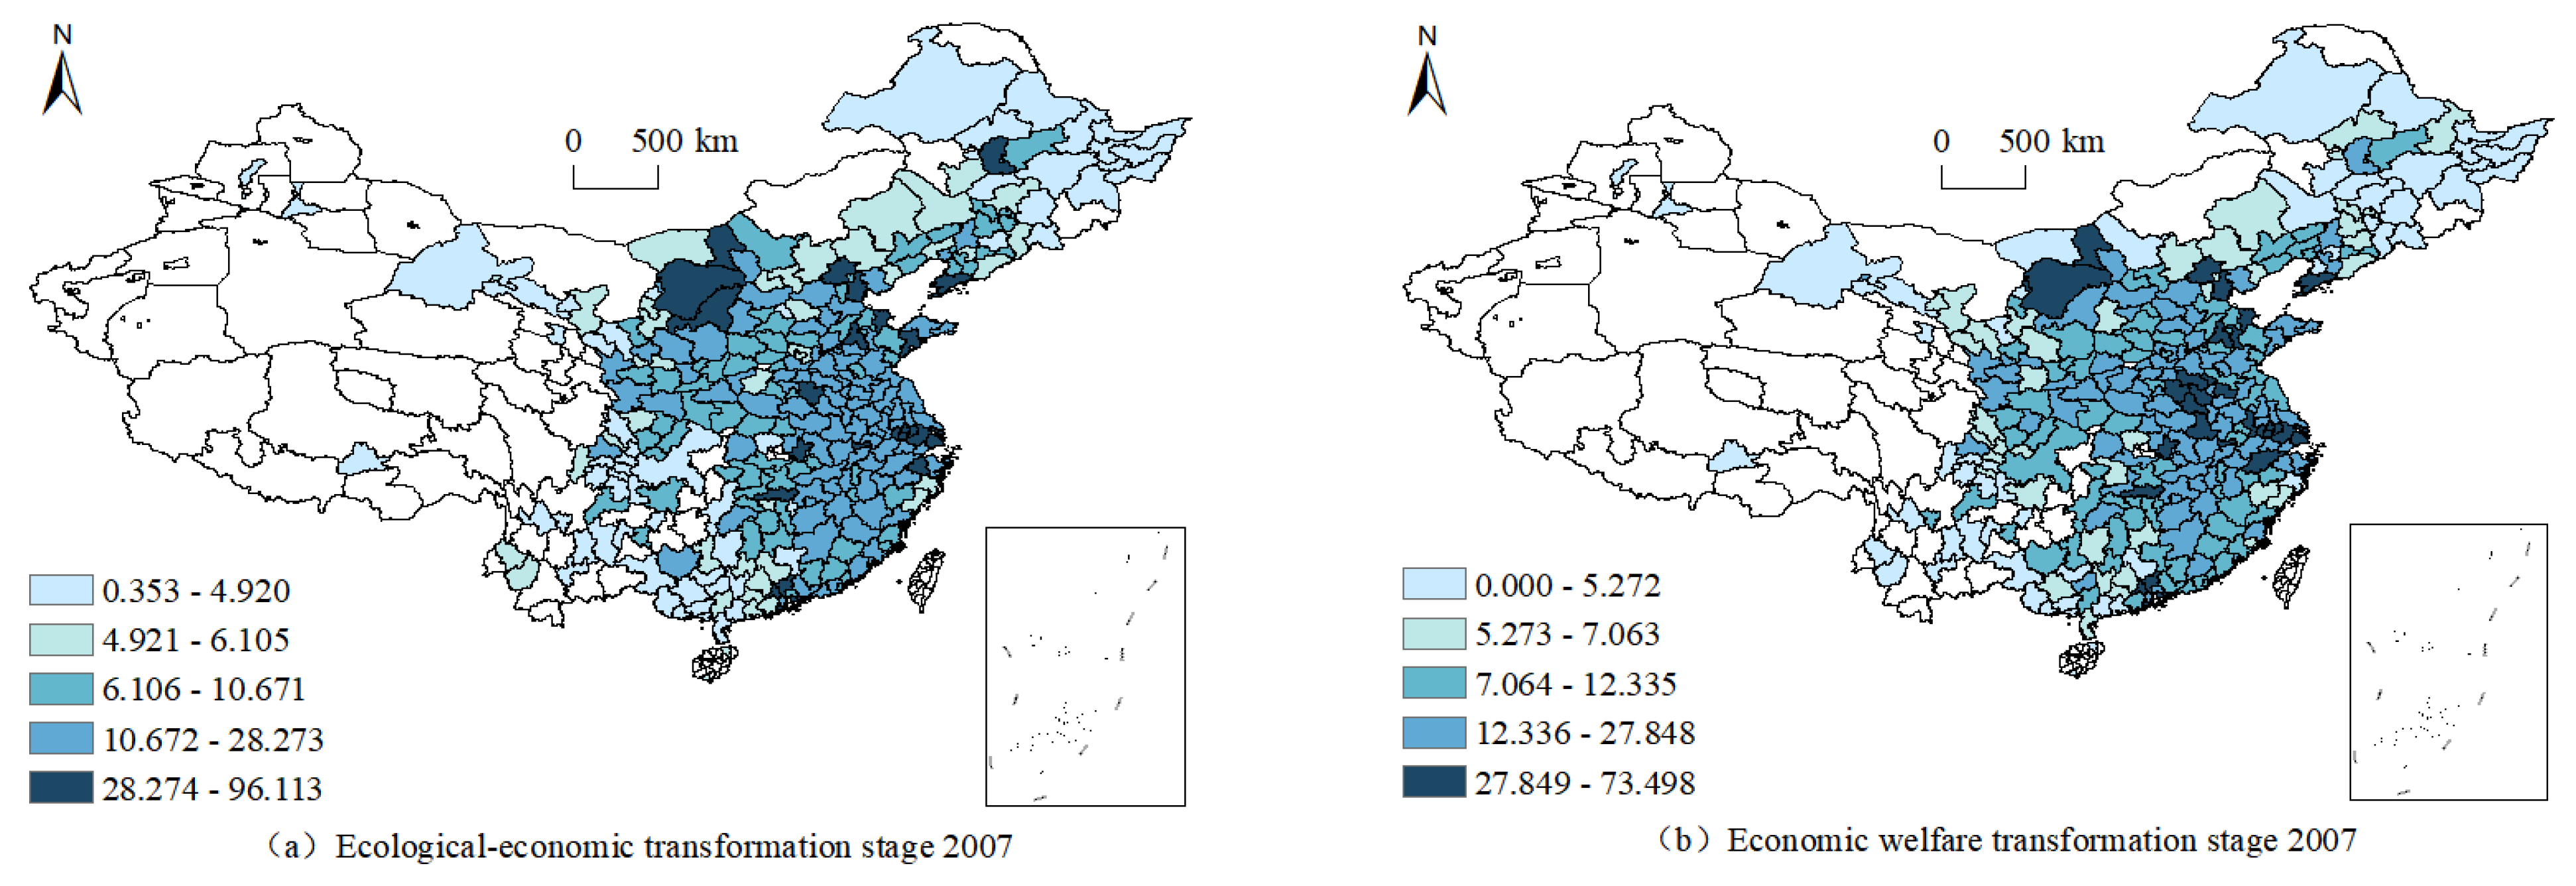
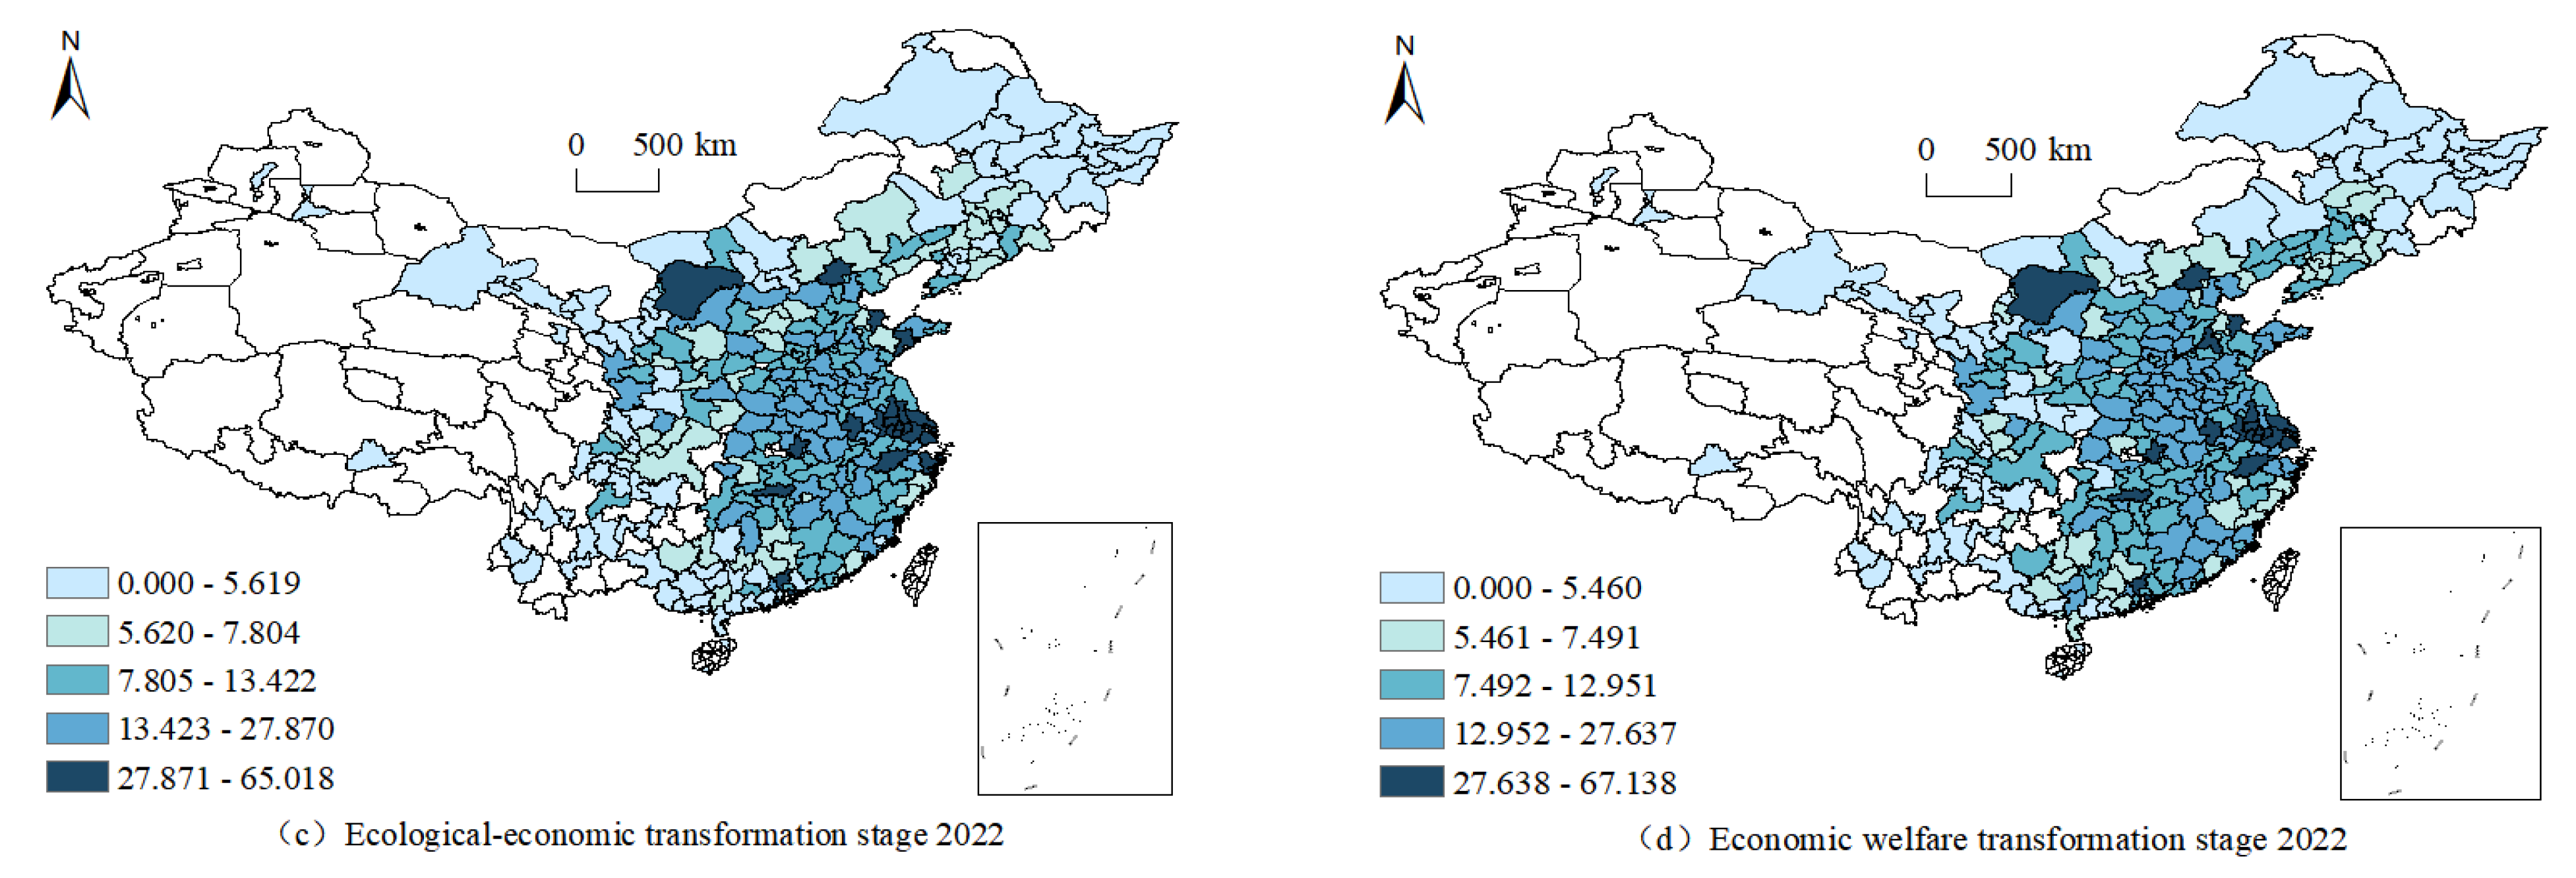
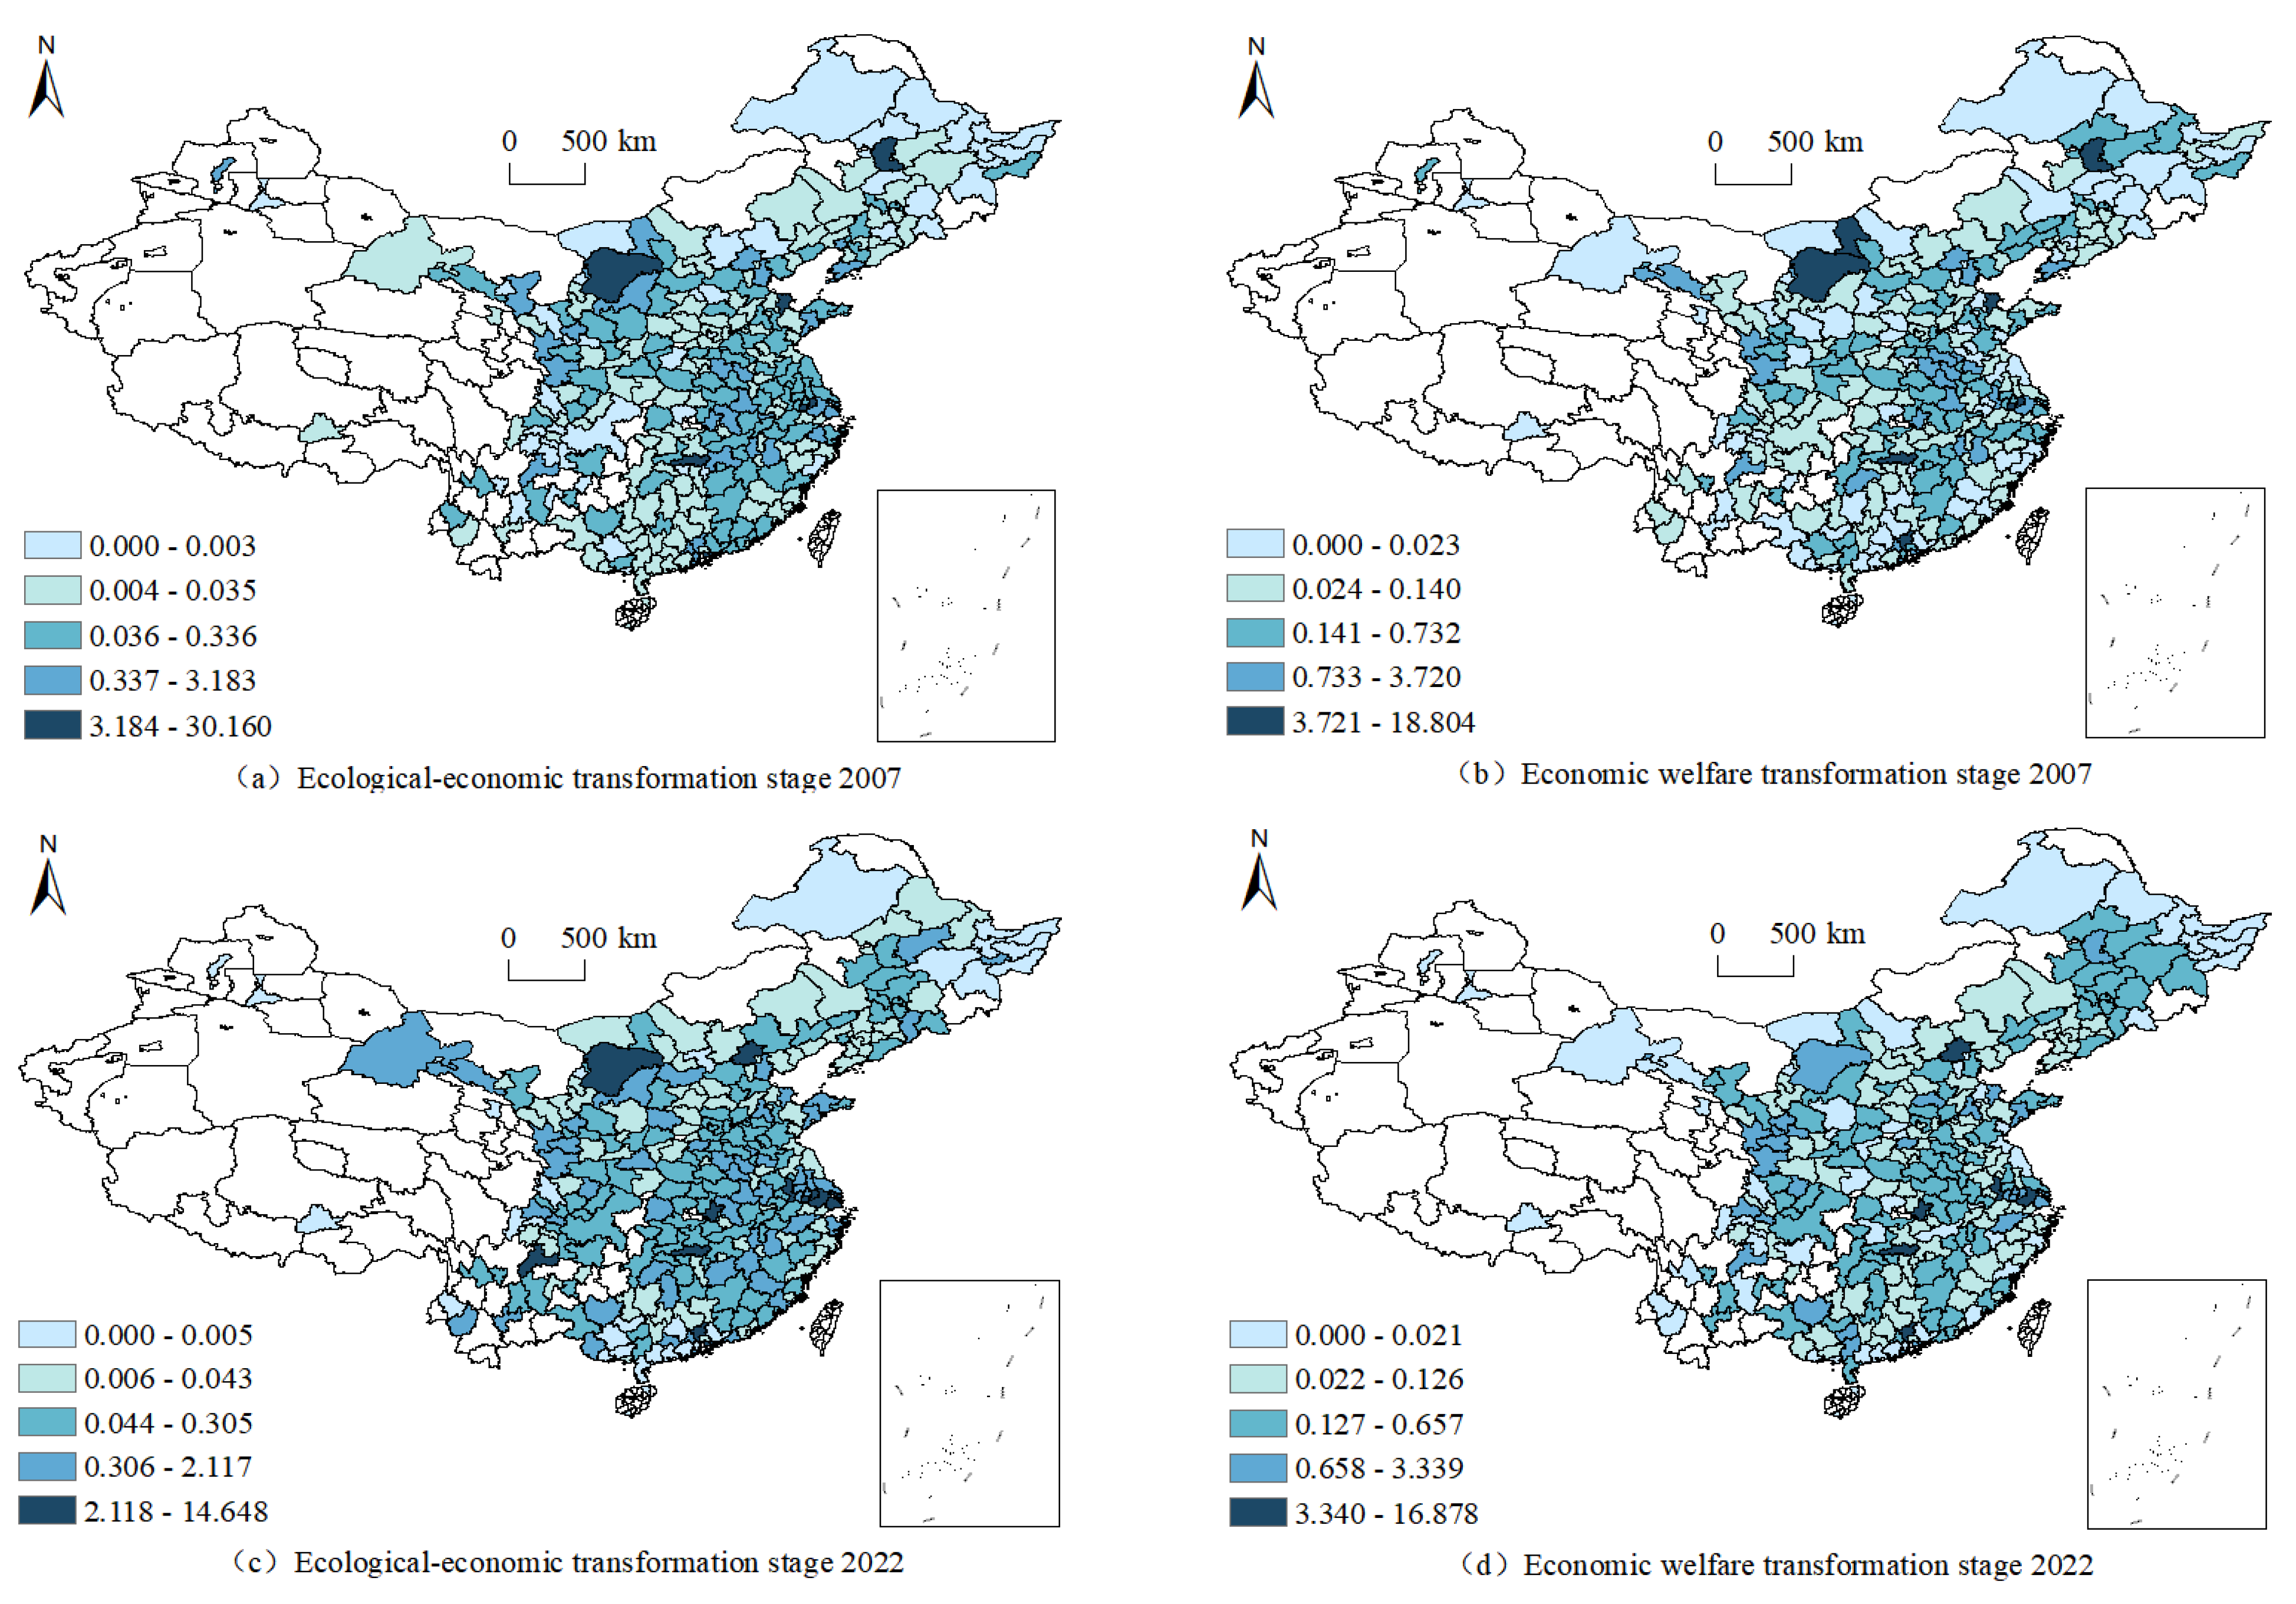
6.1. Features of the Overall EWP and Sub-Phase Distribution
6.2. EWP Sub-Phase Network Characterisation and Drivers
6.2.1. Features and Evolutionary Trends of the Overall Network Structure in the
EWP Sub-Phase
6.2.2. Individual Network Characteristics in the EWP Sub-Stage
- (1)
- Degree centrality
- (2)
- Betweenness centrality
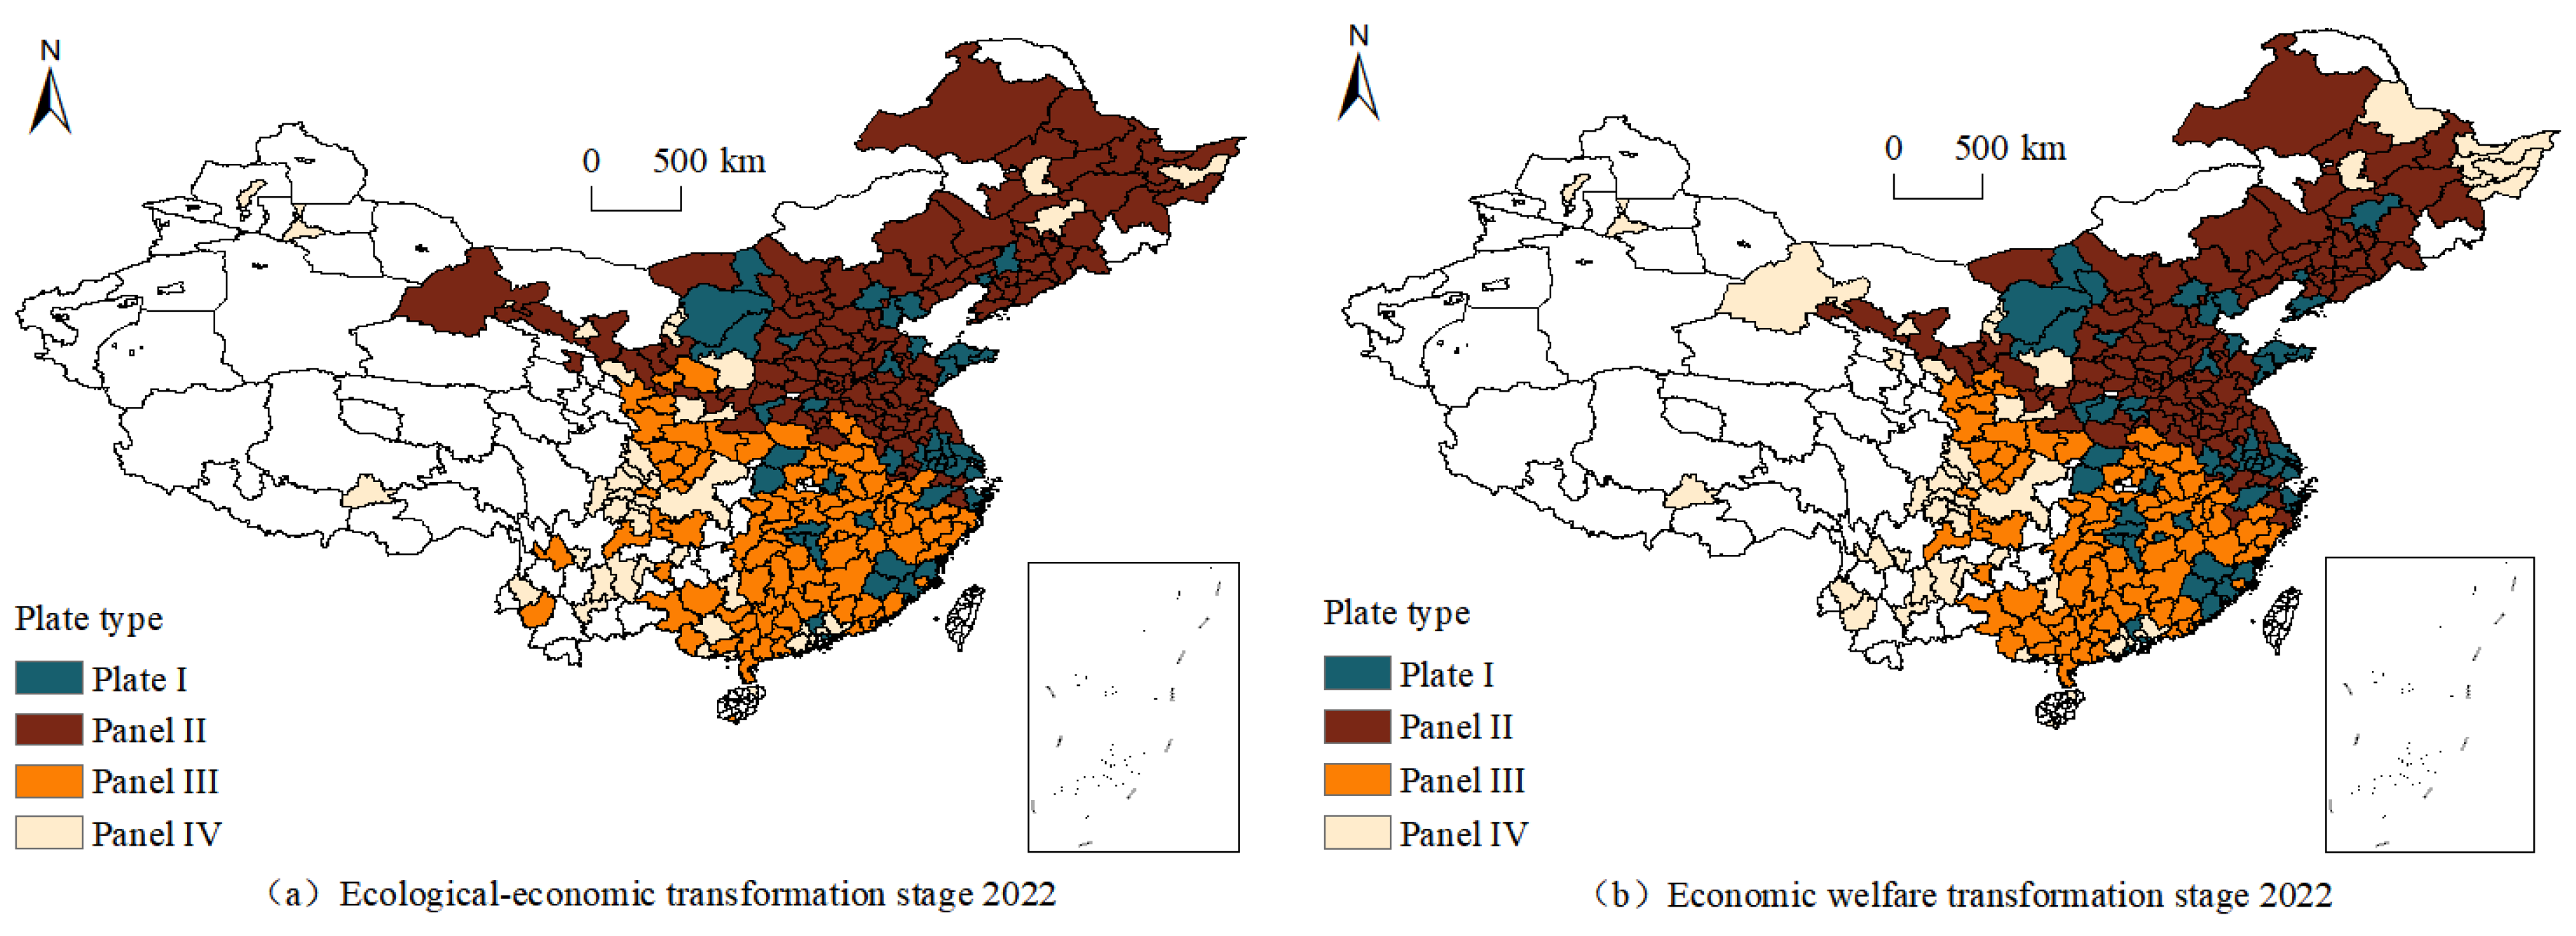
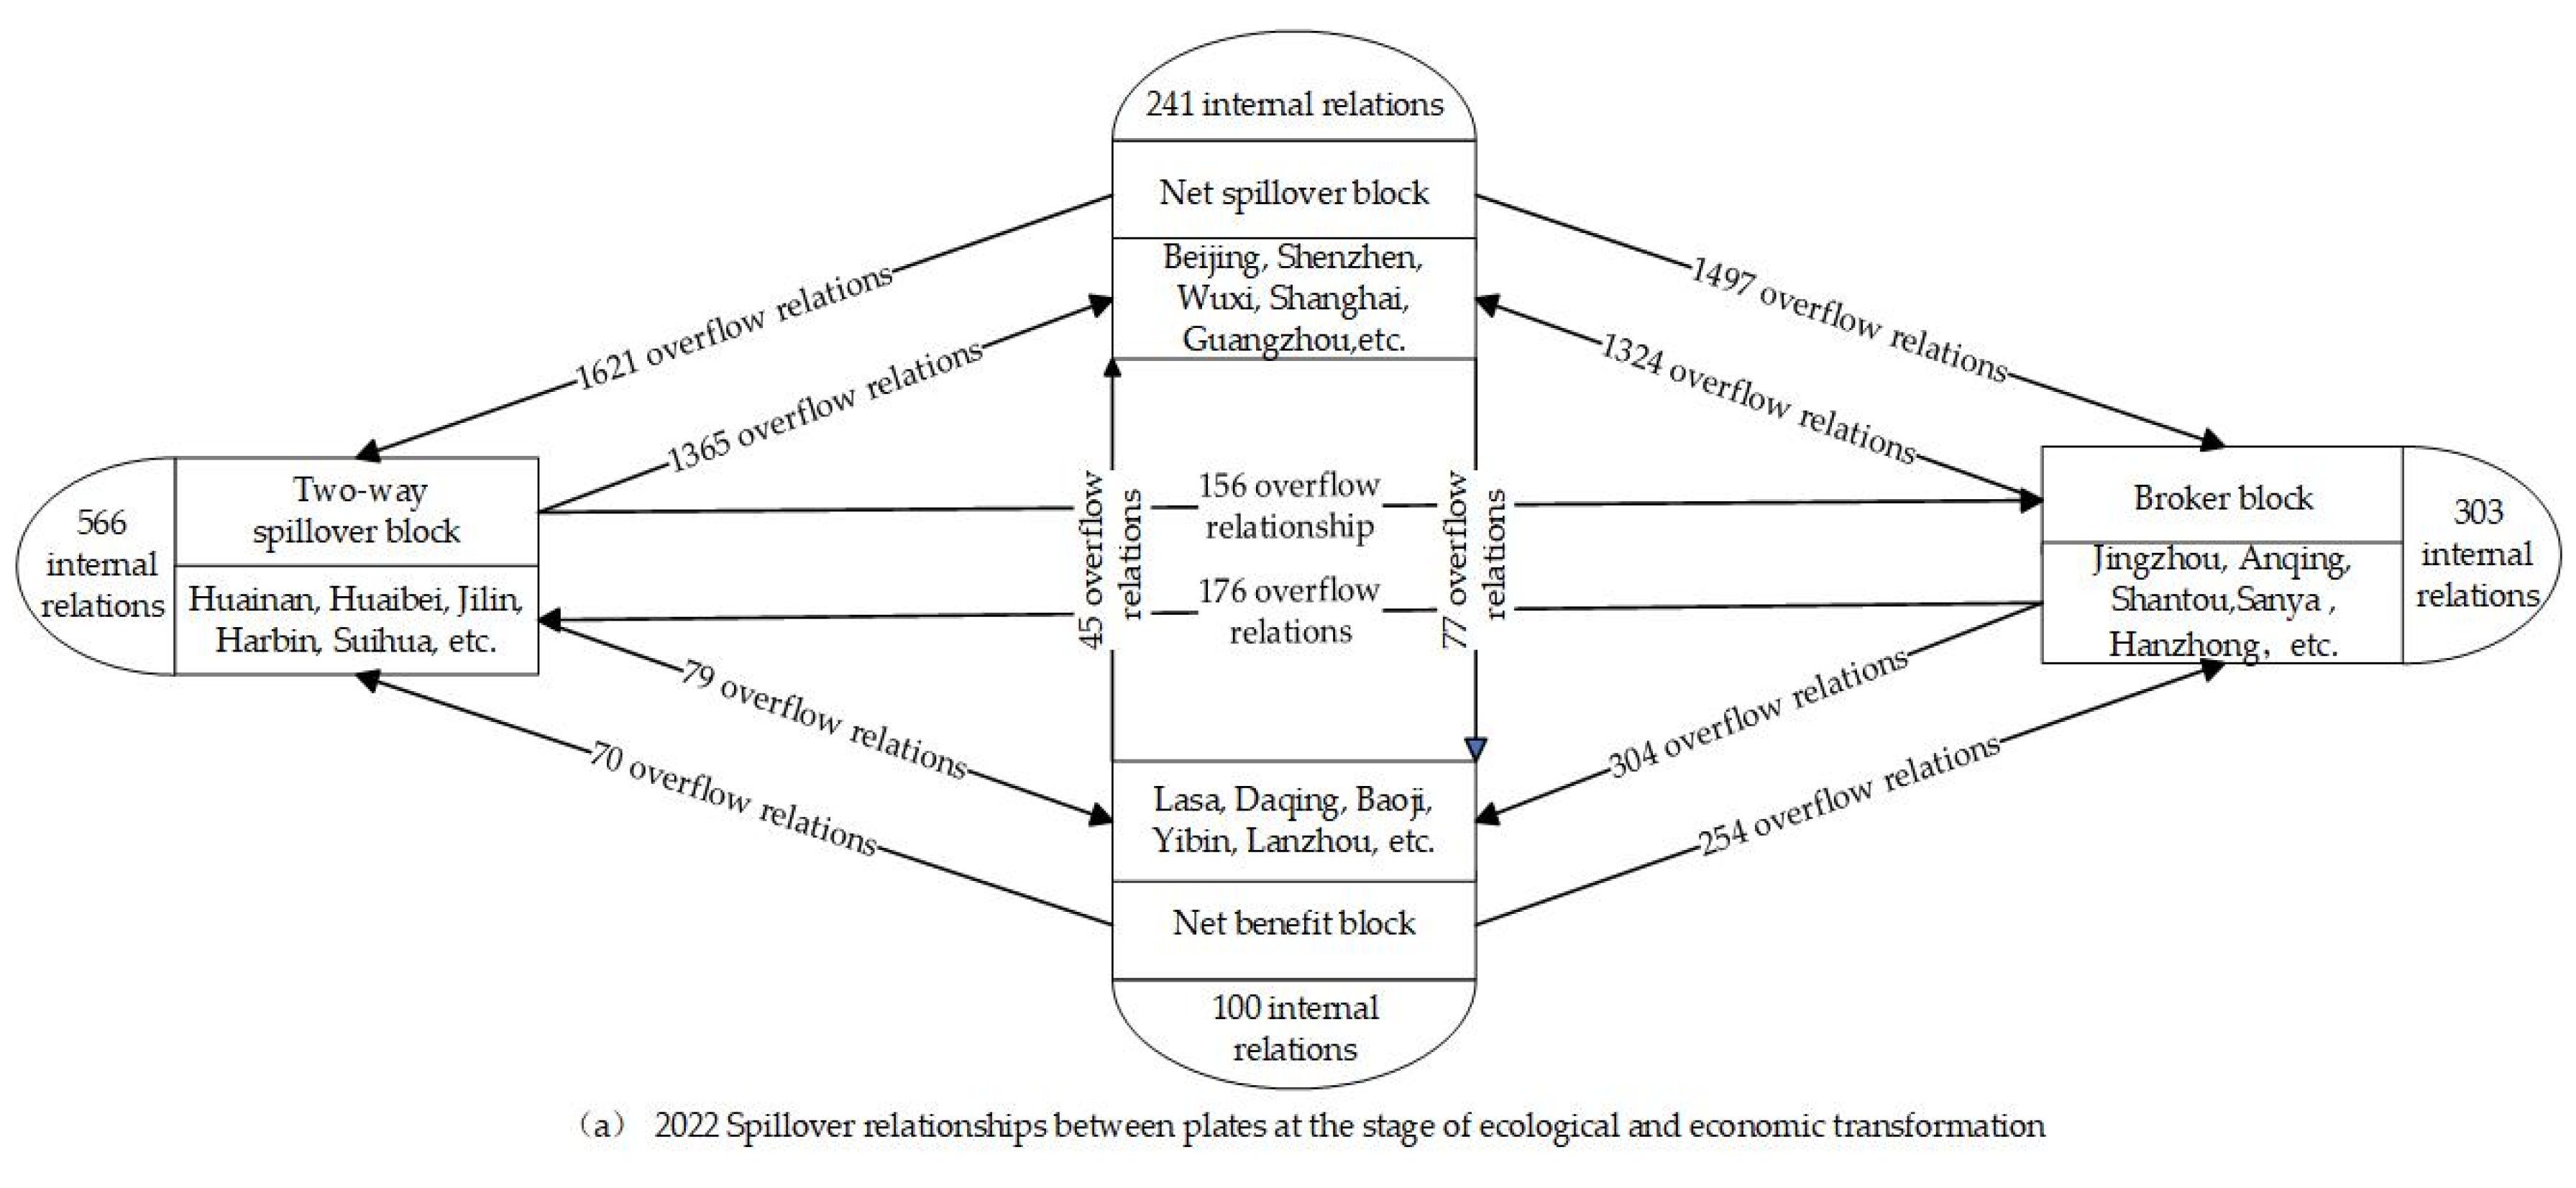
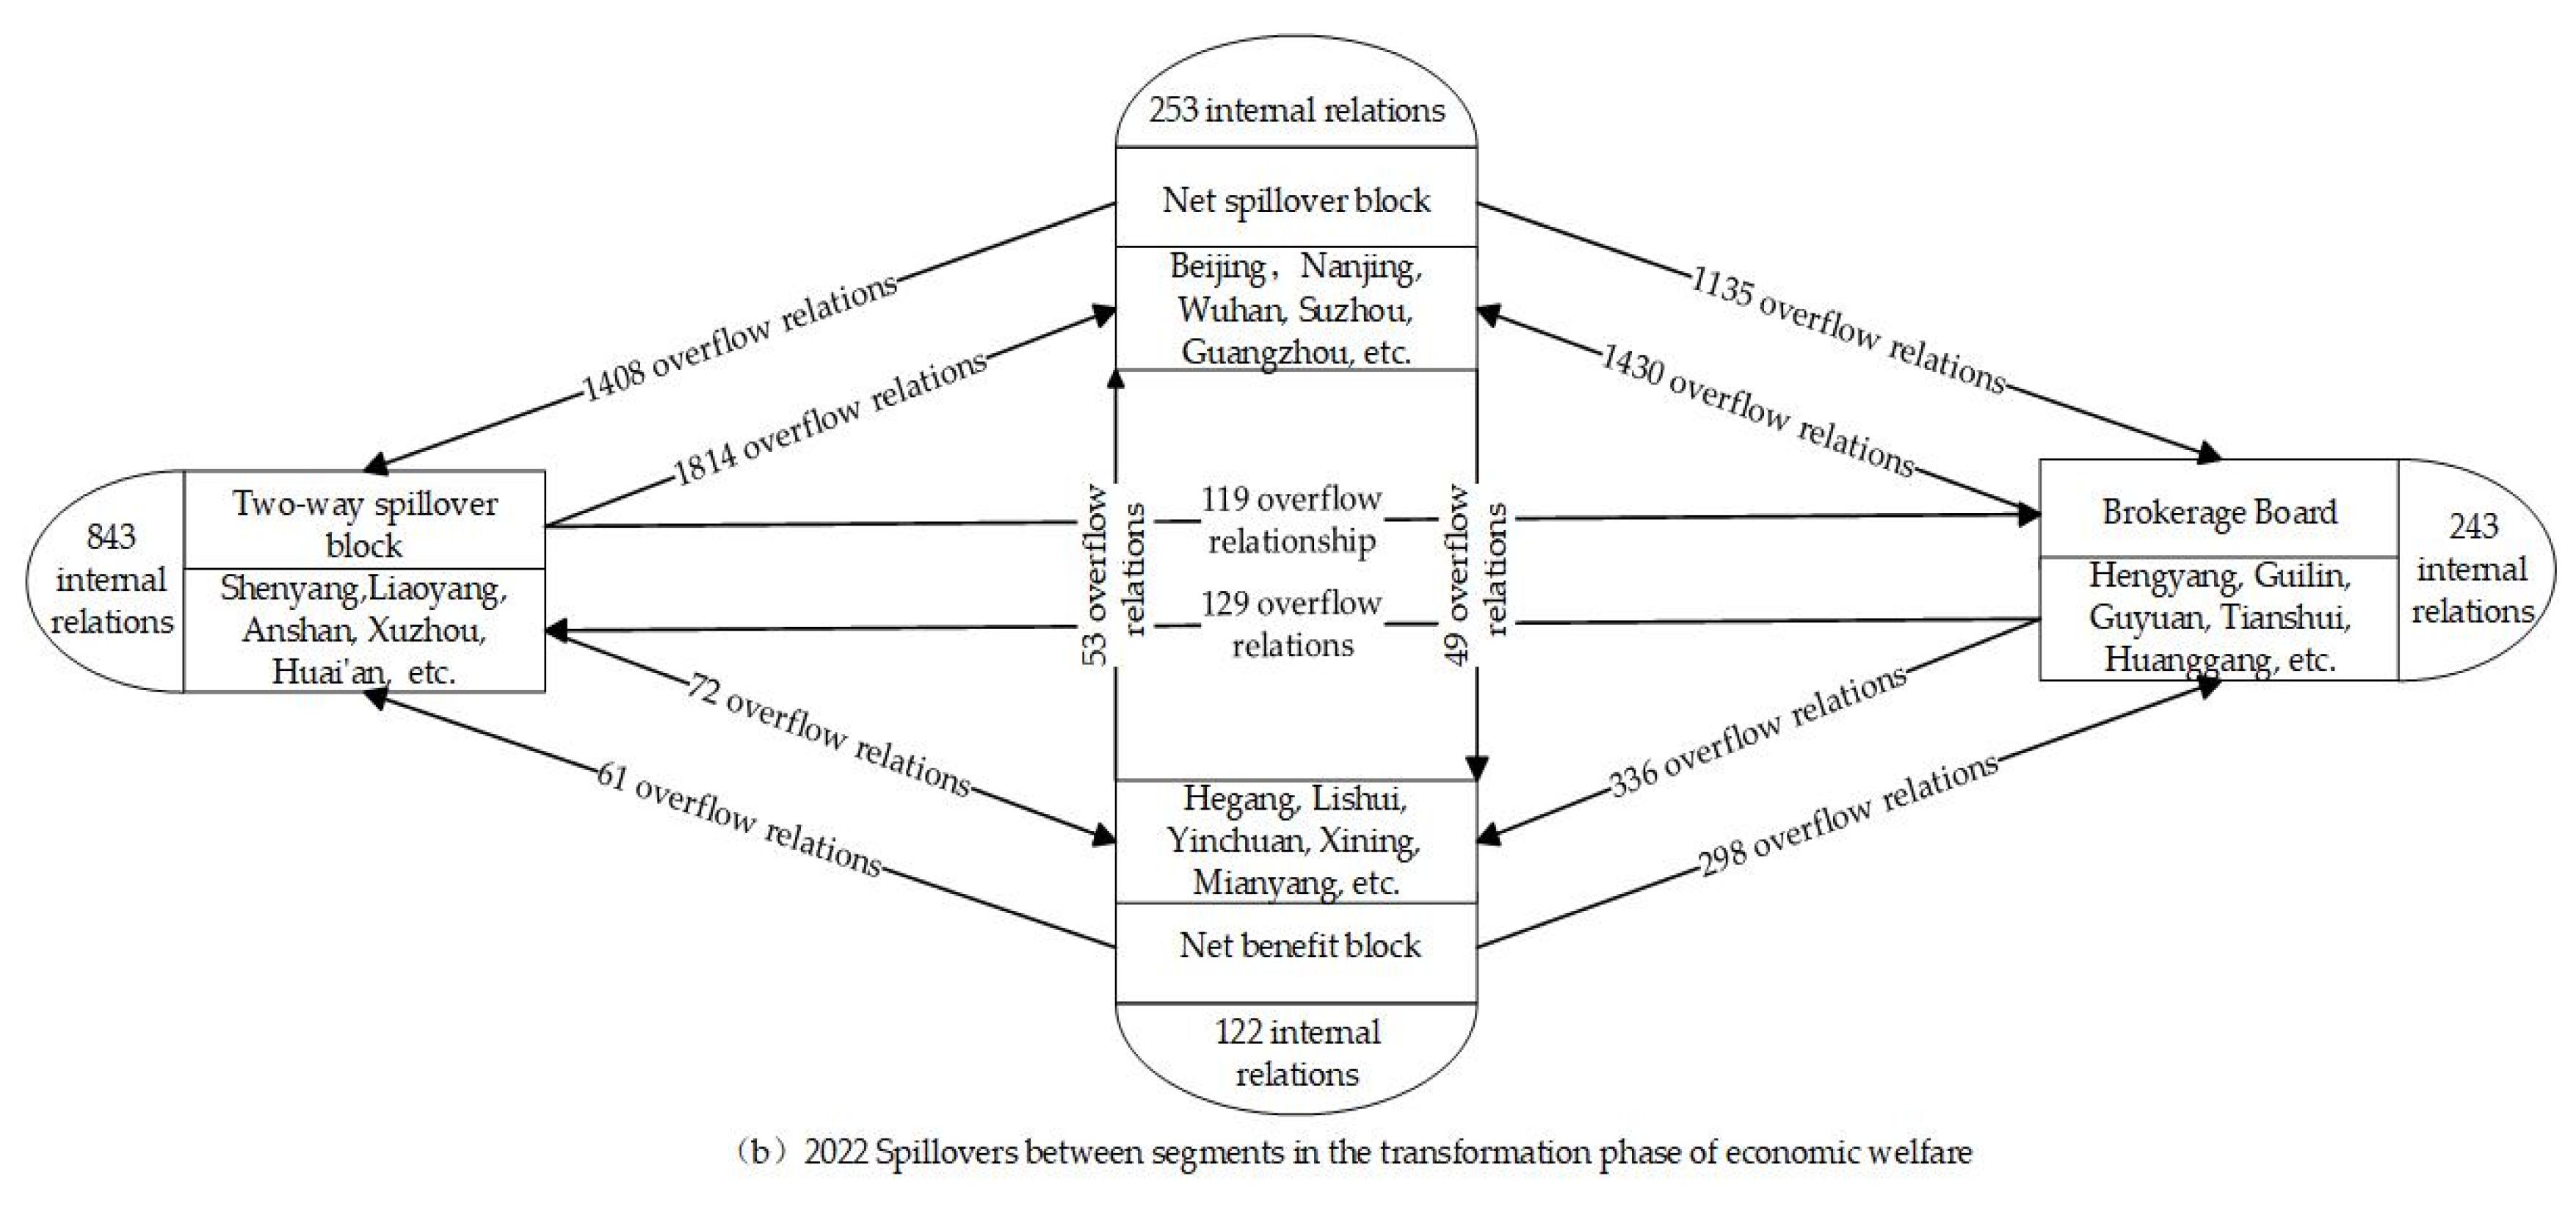
6.2.3. Sub-Stage Block Model Analysis
- (1)
- After analyzing the results, we find that the net spillover block is Plate I. In L1, the spillover relationships between Plate I and Panel II, III, and IV are 1621, 1497, and 77, respectively. At the same time, there are 241 correlations within the plate, representing cities such as Beijing, Wuxi, and Guangzhou, which are at the forefront of economic development and are subject to the EWP spillover effect on the areas around them. In L2, on the other hand, there are 1408, 1135, and 49 correlations between Plate I and Panel II, Panel III, and Panel IV, respectively, and 253 correlations within the plate. Representative cities such as Beijing, Wuhan, and Nanjing receive a greater economic income and absorb technology from surrounding cities. This data distribution shows that the net spillover block performs well in maintaining and enhancing its own EWP level and has a solid radiating effect, which can effectively promote linkages and interactions with other blocks.
- (2)
- We identify the two-way spillover block as Panel II. In L1, Panel II establishes 1365, 156, and 79 spillover relationships with the first, third, and fourth plates, respectively. There are also 566 spillover relationships within the plate, such as those of Huainan and Jilin. These cities have more ecological resources and better ecological policymaking, which drives environmental policymaking in the surrounding cities. After entering L2, Panel II has 1814, 119, and 61 overflow affiliations to Panel II, Panel III, and Panel IV, respectively, while the number of overflow relationships within the plate is 843, with Shenyang and Xuzhou being representative cities. This type of city has a more complete implementation of welfare policies and influences the development of welfare policies in surrounding cities. The second block shows a high degree of activity in its internal operation and has quite strong external spillover linkages with other blocks. As a result, the second block has more significant development potential, and its EWP mean is relatively high.
- (3)
- The broker block is Panel III, receiving 303 internal relationships in L1, transmitting 1324 and 176 affiliations to Panel I and Panel II, respectively, transmitting 304 affiliations to Panel IV, and receiving a total of 1907 affiliations from all blocks, with representative cities such as Anqing, Sanya, etc. In L2, it receives 243 internal relations, transmits 1430, 129, and 336 associative ties to Panel I, Panel II, and Panel IV, respectively, and receives a total of 1552 associative relations from each board, with Guilin, Tianshui, etc., being representative cities in this interval. It can be seen that the broker plate receives external relations in the spatial association network and is also responsible for transmitting them to other blocks.
- (4)
- Panel IV is the net benefit block. In L1, Panel IV aggregates 460 associative relationships from the first three blocks and constructs 100 associative relationships internally, with Lhasa and Lanzhou being representative cities. In L2, Panel IV receives 457 affiliations and maintains 122, with Yinchuan and Mianyang being representative cities. This demonstrates the duality of factor flows between blocks, with spillovers from high-level cities to low-level cities and reverse flows from low-level cities to high-level cities due to the siphon effect.
6.2.4. QAP Regression Analysis
6.3. Markov-Chain-Based EWP Transfer Path Prediction
6.3.1. Research on the Spatio-Temporal Transfer Path of China’s Urban EWP Level Based on Traditional Markov Chain
6.3.2. Research on Spatial and Temporal Transfer Paths of EWP Levels in Chinese Cities Based on Spatial Markov Chain
7. Discussion, Conclusion and Recommendations
7.1. Discussion
7.1.1. Methodological Insights
7.1.2. Limitations and Future Directions
7.2. Conclusions and Recommendations
- (1)
- Throughout the observed period, levels of EWP in urban China have generally improved, rising from 0.8732 in 2007 to 0.9913 in 2022. Both sub-stages, L1 and L2, show upward trends. L1 demonstrates consistent annual growth, peaking at 13.4%, while L2 only shows growth in 2013, 2018, and 2020. Post 2016, L2 and the overall EWP moved inversely, indicating that the economic welfare transition stage is a key constraint for EWP advancement, suggesting new areas for future research and improvement.
- (2)
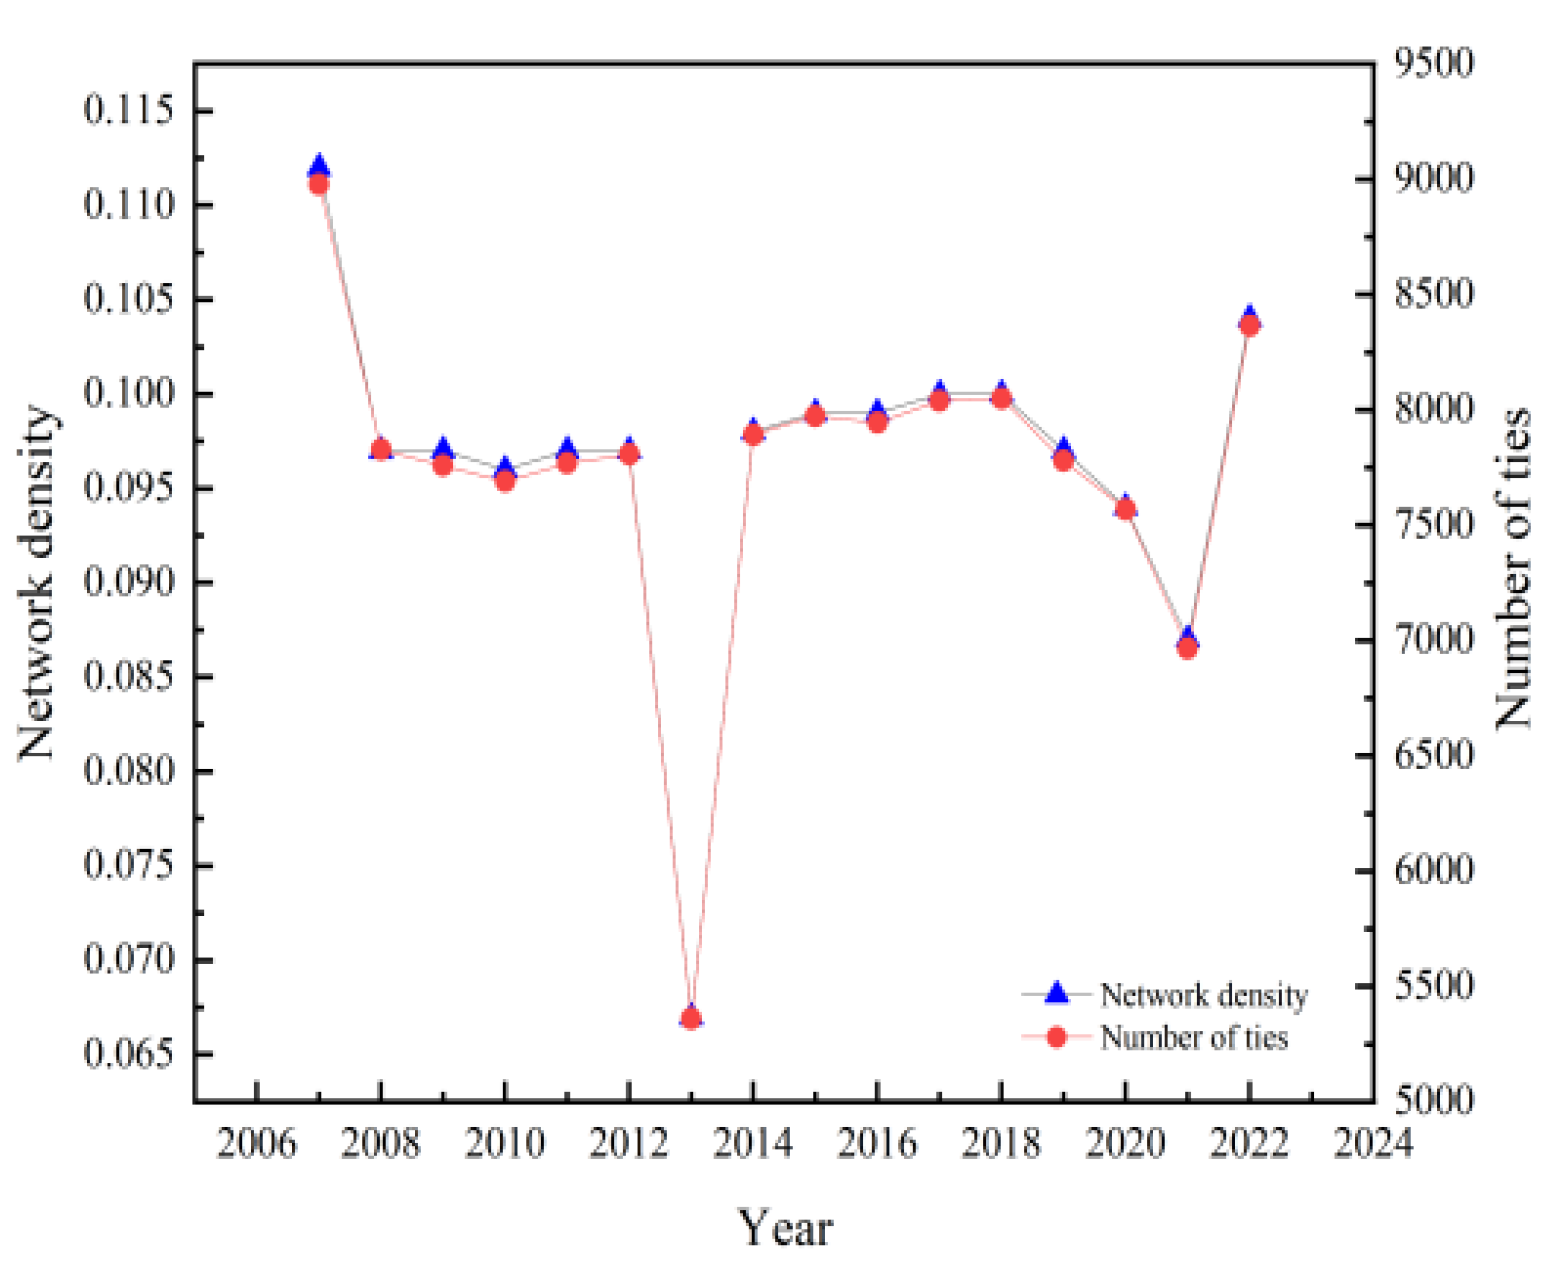
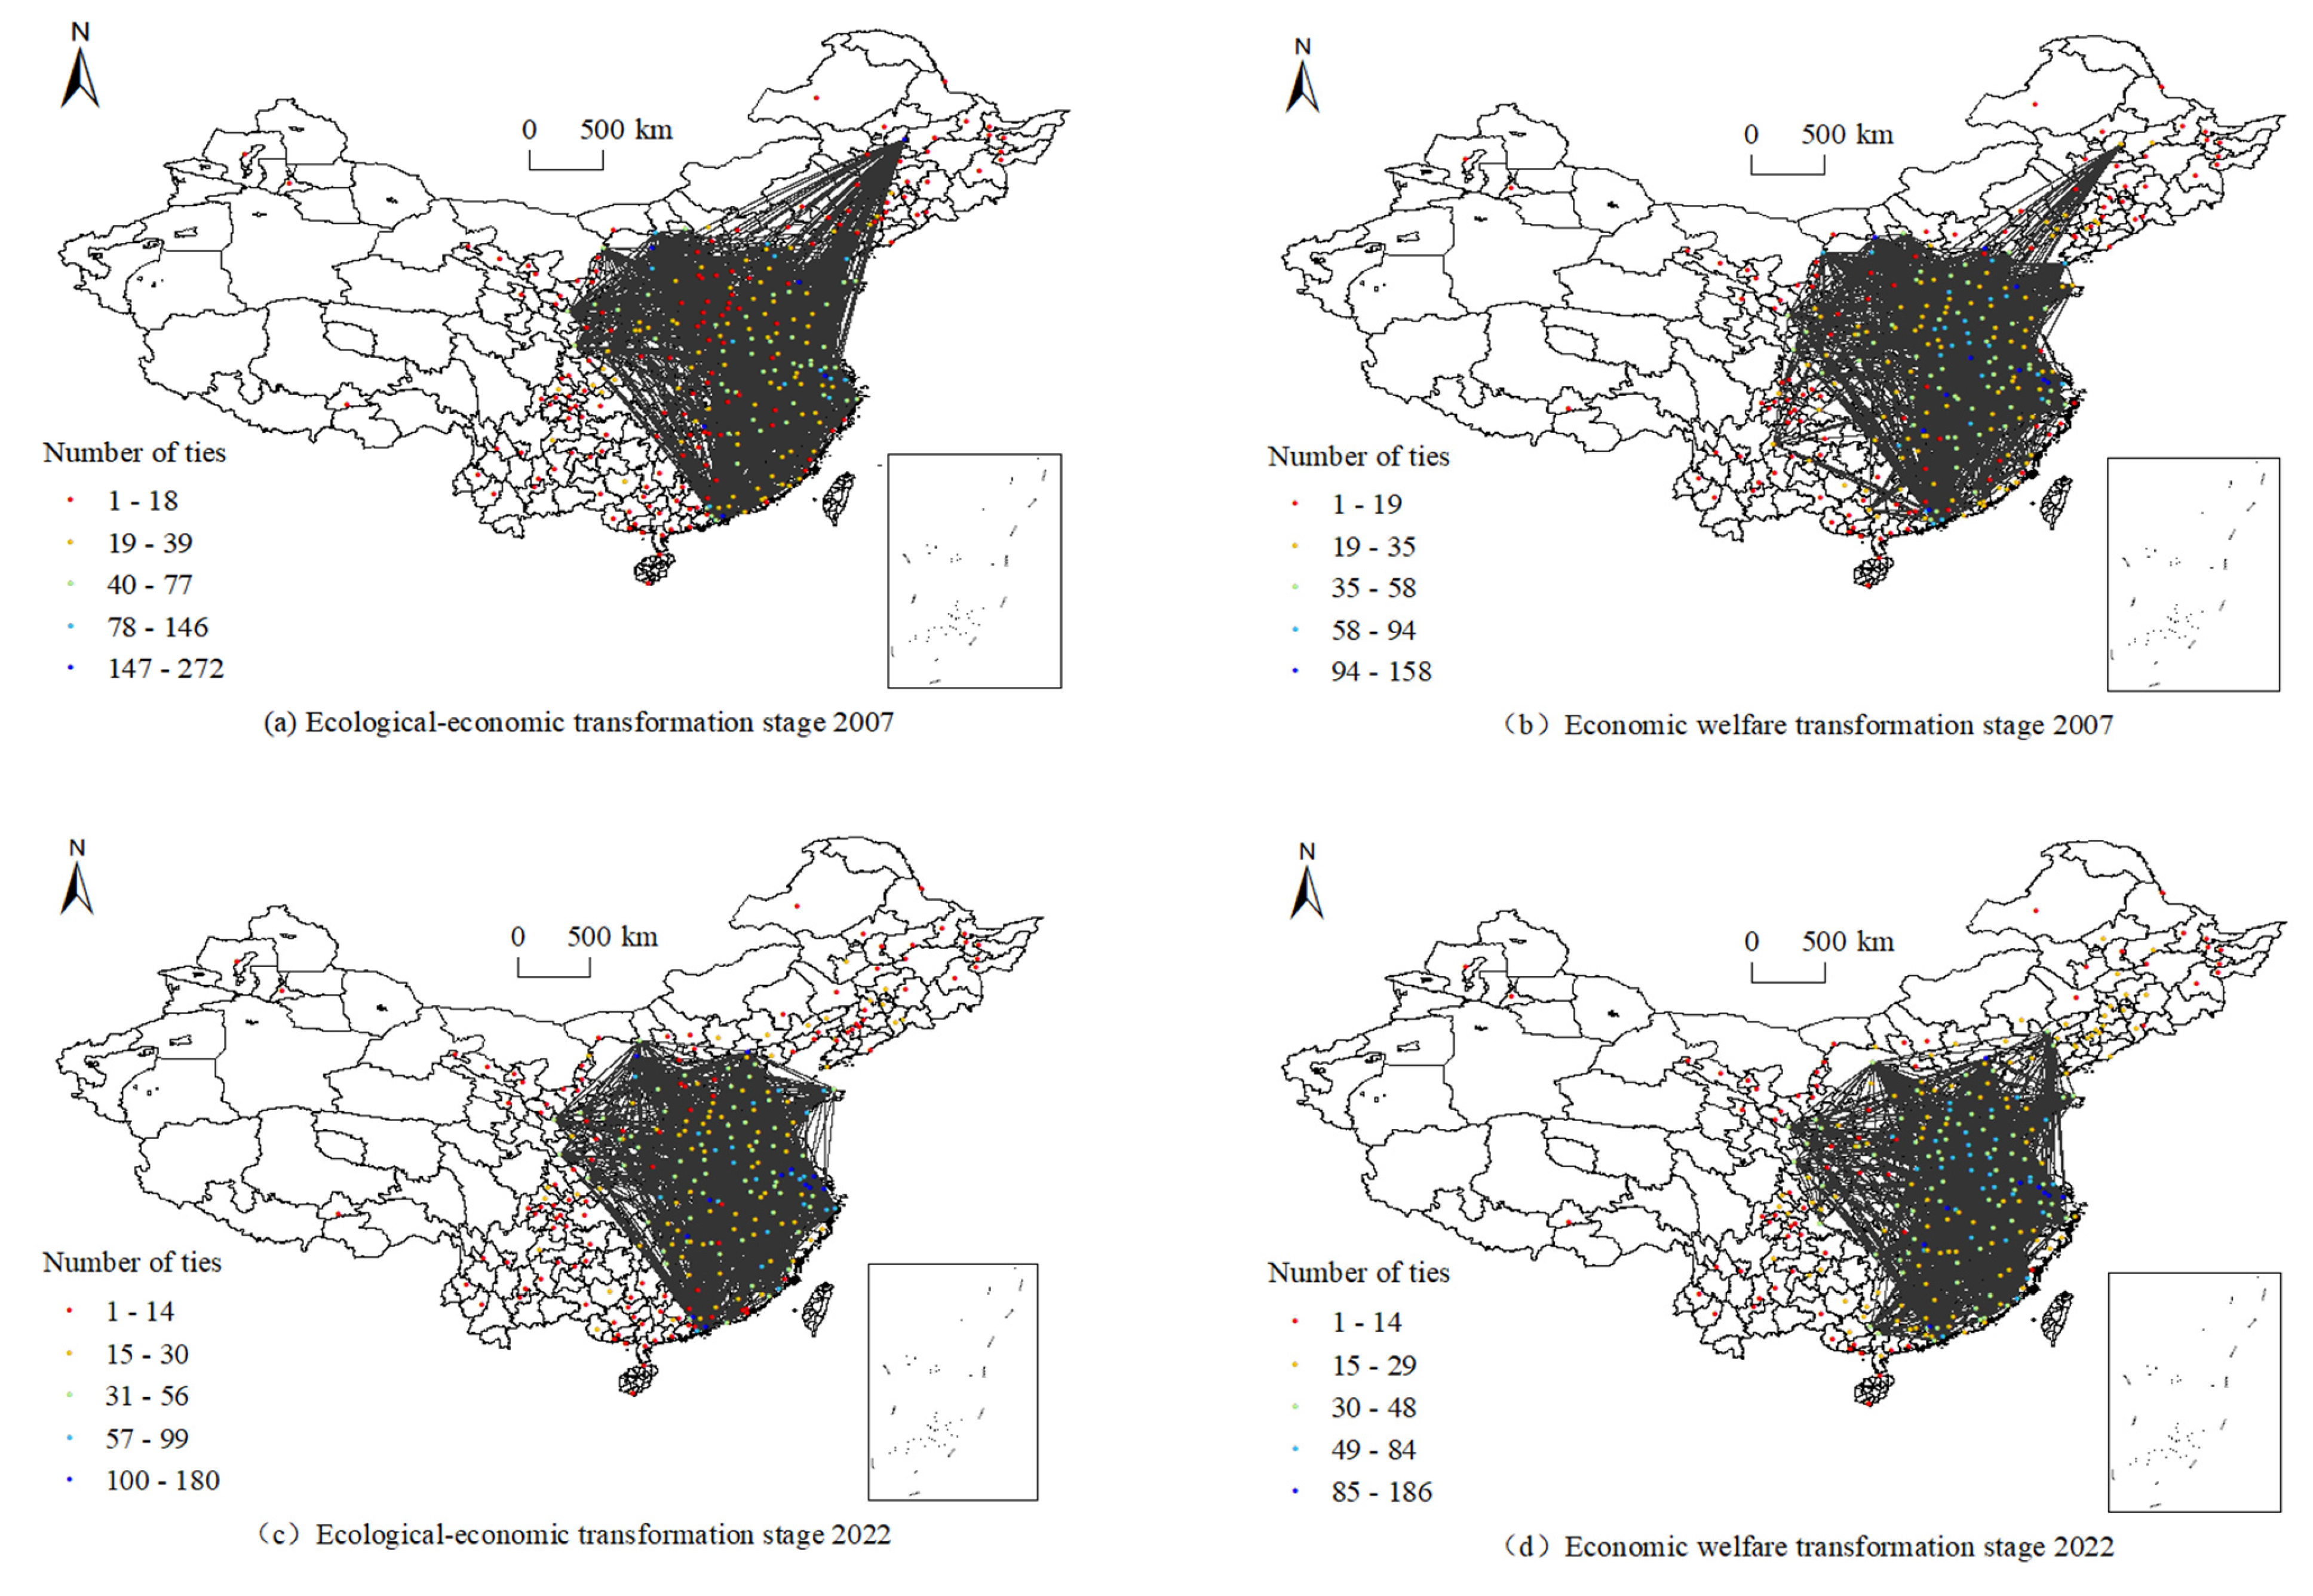
- Exploring the overall network structure of the EWP sub-stage, this study found that the spatial correlation of EWP in China forms a complex, multi-threaded network, with the YRD region having a clear single-core structure. China’s EWP network is imbalanced, being “dense in the east and sparse in the west”. More developed eastern cities act as core “bridges” and “intermediaries.” The L1 network is denser and more complex than the L2 network. Overall network density is low with many redundant relationships, indicating a need to enhance network tightness and stability. The hierarchical structure reveals disparities between high- and low-EWP regions, with an imbalance in cities’ network positions. Understanding these characteristics, improving the EWP transmission mechanism, and broadening the spillover channels of EWPs are crucial for China to achieve SDG11. The government should enhance L2 network compactness by promoting inter-city resource mobility, ultimately strengthening the EWP network.
- (3)
- Analyzing the spatial network of the EWP sub-stages reveals an agglomeration pattern with “local clustering” and “global connections”, centered mainly in the eastern coastal regions. This has led to a significant Matthew effect, concentrating advantages and resources in these prosperous areas. In contrast, the central-western and northeastern regions have lower network densities, functioning primarily as bridges within the network. This disparity indicates an opportunity to enhance the EWP spatial network’s structure and connectivity by better integrating these regions. Increasing network density in these areas can promote balanced resource distribution, knowledge exchange, and environmental welfare practices, contributing to more equitable and sustainable development. Strengthening these “bridge” regions is crucial for improving the overall effectiveness and resilience of the EWP spatial network.
- (4)
- The EWP sub-phase local network study found that cities in the southeast region of L1 have higher and more clustered degree centrality values, while those below average are mostly in the western fringe. Provincial capitals hold central positions and lead in terms of network relevance in L2. The betweenness centrality indicates that the north-central region, with its geographic and transportation advantages, acts as a hub, while the northeastern and southwestern areas are more peripheral. In L2, provincial capitals play a crucial role by transmitting information to other cities, enhancing network cohesion. The L1 network is mainly influenced by eastern cities, while provincial capitals dominate L2. Future improvements in the EWP spatial network should focus on provincial capitals and city clusters.
- (5)
- Our block model analysis shows that cities within the two-way spillover segment of EWP are mainly in central and Northern China, such as Huainan and Jilin in L1, and in central and eastern regions, like Shenyang and Xuzhou in L2. In L1, these cities focus on ecological protection and have high ecological economy conversion efficiency, influencing surrounding cities to adopt better environmental policies. In L2, these cities have economic advantages, leading others to develop economically and improve social welfare. Both stages have significant spillover effects on and from other cities. The net beneficiary block includes cities that gain more resources and benefits from EWP spillover effects.
- (6)
- To explore the construction of spatial correlation networks in the EWP sub-stages, this study uses the QAP model. The formation and development of these networks are significantly influenced by IS, UB, D, FD, TI, ML, and EC. However, L1’s network is not affected by EC, indicating it has a greater impact on L2 concerning technological innovation. To improve EWP network relevance, cross-regional EWP networks and regional EWP cites should be built, promoting a new development pattern of “promoting the whole with the local”. Geographic proximity (D) is crucial as it decreases cooperation time and reduces costs, enhancing city collaboration. In addition, there are obvious differences in the economic development patterns of the eastern, central, and western regions, which require the active promotion at the national level of the formation of a regional ecological engineering pattern of “point by point, overall promotion” to promote the flow of regional ecological resources and the spillover of EWP dynamics.
- (7)
- Our study of EWP transfer paths found that the level of EWP in each city remained stable in both stages, showing spatially positive correlations. “Club convergence” was observed, with the traditional Markov chain analysis indicating varying levels of convergence and difficulty in short-term leaps. Although L2 showed cross-state transfer with a maximum probability of 0.357, L1 had a higher likelihood of transitioning to a high level. Urban EWP transfer is influenced by neighboring cities’ differentiation, suggesting a spatial spillover effect in which high-EWP cities enhance adjacent cities. Future optimization of EWP paths should start from L2, promoting capital and technology cooperation, enhancing high-level and lagging cities, and avoiding downward transfers to improve overall EWP. Higher EWP levels drive neighboring cities higher, while lower levels inhibit upward movement, indicating polarized transfer probabilities.
7.3. Recommendations
Author Contributions
Funding
Institutional Review Board Statement
Informed Consent Statement
Data Availability Statement
Conflicts of Interest
References
- National Bureau of Statistics. Available online: https://data.stats.gov.cn/ (accessed on 18 January 2024).
- Guan, X.; Wei, H.; Lu, S.; Dai, Q.; Su, H. Assessment on the urbanization strategy in China: Achievements, challenges and reflections. Habitat Int. 2018, 71, 97–109. [Google Scholar] [CrossRef]
- He, B.; Zhao, D.; Zhu, J.; Darko, A.; Gou, Z. Promoting and implementing urban sustainability in China: An integration of sustainable initiatives at different urban scales. Habitat Int. 2018, 82, 83–93. [Google Scholar] [CrossRef]
- Guo, J.; Yu, Z.; Ma, Z.; Xu, D.; Cao, S. What factors have driven urbanization in China? Environ. Dev. Sustain. 2022, 24, 6508–6526. [Google Scholar] [CrossRef]
- Zhao, Z.; Pan, Y.; Zhu, J.; Wu, J.; Zhu, R. The Impact of Urbanization on the Delivery of Public Service–Related SDGs in China. Sustain. Cities Soc. 2022, 80, 103776. [Google Scholar] [CrossRef]
- Han, J.; Wu, Q.; Zhang, L.; Lei, C. How can the urban emergency capability gap be measured? Construction of a standardized indicator system in China. Int. J. Disaster Risk Reduct. 2022, 80, 103236. [Google Scholar] [CrossRef]
- Wu, D.; Rao, P. Urbanization and Income Inequality in China: An Empirical Investigation at Provincial Level. Soc. Indic. Res. 2017, 131, 189–214. [Google Scholar] [CrossRef]
- Zhao, H.; Cui, J.; Wang, S.; Lindley, S. Customizing the coefficients of urban domestic pollutant discharge and their driving mechanisms: Evidence from the Taihu Basin, China. J. Environ. Manag. 2018, 213, 247–254. [Google Scholar] [CrossRef] [PubMed]
- Yu, B. Ecological effects of new-type urbanization in China. Renew. Sustain. Energy Rev. 2021, 135, 110239. [Google Scholar] [CrossRef]
- Lin, L.; Gao, T.; Luo, M.; Ge, E.; Yang, Y.; Liu, Z.; Zhao, Y.; Ning, G. Contribution of urbanization to the changes in extreme climate events in urban agglomerations across China. Sci. Total Environ. 2020, 744, 140264. [Google Scholar] [CrossRef]
- Luo, W.; Bai, H.; Jing, Q.; Liu, T.; Xu, H. Urbanization-induced ecological degradation in Midwestern China: An analysis based on an improved ecological footprint model. Resour. Conserv. Recycl. 2018, 137, 113–125. [Google Scholar] [CrossRef]
- Zhang, L.; You, S.; Zhang, M.; Zhang, S.; Yi, S.; Zhou, B. The effects of urbanization on air pollution based on a spatial perspective: Evidence from China. Front. Environ. Sci. 2022, 10, 1058009. [Google Scholar] [CrossRef]
- Lu, L.; Qureshi, S.; Li, Q.; Chen, F.; Shu, L. Monitoring and projecting sustainable transitions in urban land use using remote sensing and scenario-based modelling in a coastal megacity. Ocean Coast. Manag. 2022, 224, 106201. [Google Scholar] [CrossRef]
- Keith, M.; Birch, E.; Buchoud, N.J.A.; Cardama, M.; Cobbett, W.; Cohen, M.; Elmqvist, T.; Espey, J.; Hajer, M.; Hartmann, G.; et al. A new urban narrative for sustainable development. Nat. Sustain. 2023, 6, 115–117. [Google Scholar] [CrossRef]
- Dang, H.H.; Serajuddin, U. Tracking the sustainable development goals: Emerging measurement challenges and further reflections. World Dev. 2020, 127, 104570. [Google Scholar] [CrossRef]
- Zhang, Y.; Cai, X.; Jiao, L.; Mao, Y.; Huo, X.; Wu, Y. Using eco-efficiency and eco-wellbeing performance as indicators for urban sustainable development: A two-stage network analysis. Sustain. Dev. 2023, 1, 1825–1844. [Google Scholar] [CrossRef]
- Daly, H.E. The Economics of the Steady State. Am. Econ. Rev. 1974, 64, 15–21. [Google Scholar] [CrossRef]
- Long, X.; Yu, H.; Sun, M.; Wang, X.; Klemeš, J.J.; Xie, W.; Wang, C.; Li, W.; Wang, Y. Sustainability evaluation based on the Three-dimensional Ecological Footprint and Human Development Index: A case study on the four island regions in China. J. Environ. Manag. 2020, 265, 110509. [Google Scholar] [CrossRef]
- Zhang, S.; Zhu, D.; Shi, Q.; Cheng, M. Which countries are more ecologically efficient in improving human well-being? An application of the Index of Ecological Well-being Performance. Resour. Conserv. Recycl. 2018, 129, 112–119. [Google Scholar] [CrossRef]
- Bian, J.; Ren, H.; Liu, P. Evaluation of urban ecological well-being performance in China: A case study of 30 provincial capital cities. J. Clean. Prod. 2020, 254, 120109. [Google Scholar] [CrossRef]
- Hassan, S.T.; Xia, E.; Khan, N.H.; Shah, S.M.A. Economic growth, natural resources, and ecological footprints: Evidence from Pakistan. Environ. Sci. Pollut. Res. 2019, 26, 2929–2938. [Google Scholar] [CrossRef]
- Valenzuela-Venegas, G.; Salgado, J.C.; Díaz-Alvarado, F.A. Sustainability indicators for the assessment of eco-industrial parks: Classification and criteria for selection. J. Clean. Prod. 2016, 133, 99–116. [Google Scholar] [CrossRef]
- Sun, Q.; Ma, R.; Xi, Z.; Wang, H.; Jiang, C.; Chen, H. Nonlinear impacts of energy consumption and globalization on ecological footprint: Empirical research from BRICS countries. J. Clean. Prod. 2023, 396, 136488. [Google Scholar] [CrossRef]
- Zhang, Y.; Mao, Y.; Jiao, L.; Shuai, C.; Zhang, H. Eco-efficiency, eco-technology innovation and eco-well-being performance to improve global sustainable development. Environ. Impact Assess. Rev. 2021, 89, 106580. [Google Scholar] [CrossRef]
- Ma, H.; Han, Y.; Lv, K.; Bi, M.; Zhong, Y. Urban Eco-Efficiency and Its Influencing Factors in China Based on the Two-Stage Super-NEBM Model. Systems 2022, 10, 217. [Google Scholar] [CrossRef]
- Feng, Y.; Dong, X.; Zhao, X.; Zhu, A. Evaluation of urban green development transformation process for Chinese cities during 2005–2016. J. Clean. Prod. 2020, 266, 121707. [Google Scholar] [CrossRef]
- Feng, Y.; Zhong, S.; Li, Q.; Zhao, X.; Dong, X. Ecological well-being performance growth in China (1994–2014): From perspectives of industrial structure green adjustment and green total factor productivity. J. Clean. Prod. 2019, 236, 117556. [Google Scholar] [CrossRef]
- Wang, J.; Xiao, H.; Hu, M. Spatial spillover effects of forest ecological security on ecological well-being performance in China. J. Clean. Prod. 2023, 418, 138142. [Google Scholar] [CrossRef]
- Hu, M.; Pang, Y.; Jin, T.; Li, Z. Spatio-Temporal Evolution of EIWB and Influencing Factors: An Empirical Study from the Yangtze River Delta. Appl. Spat. Anal. Policy 2021, 14, 999–1024. [Google Scholar] [CrossRef]
- Zhou, L.; Zhang, Z. Ecological well-being performance and influencing factors in China: From the perspective of income inequality. Kybernetes 2023, 52, 1269–1293. [Google Scholar] [CrossRef]
- Cui, S.; Wang, Y.; Xu, P.; Li, L. Ecological welfare performance, industrial agglomeration and technological innovation: An empirical study based on Beijing–Tianjin–Hebei, Yangtze River Delta and Pearl River Delta. Environ. Dev. Sustain. 2024, 26, 1505–1528. [Google Scholar] [CrossRef]
- Su, Y.; Li, W.; Chen, M.; Wu, C.; Tan, X. Innovation policy and ecological welfare performance: Evidence from a quasi-natural experiment of China. Environ. Sci. Pollut. Res. 2023, 30, 100994–101013. [Google Scholar] [CrossRef]
- Liu, N.; Wang, Y. Urban Agglomeration Ecological Welfare Performance and Spatial Convergence Research in the Yellow River Basin. Land 2022, 11, 2073. [Google Scholar] [CrossRef]
- Behjat, A.; Tarazkar, M.H. Investigating the factors affecting the ecological well-being performance in Iran from 1994 to 2014. Environ. Dev. Sustain. 2021, 23, 13871–13889. [Google Scholar] [CrossRef]
- Han, Y.; Song, Z. On regional integration, fiscal income, and GDP per capita. Scott. J. Political Econ. 2022, 69, 506–532. [Google Scholar] [CrossRef]
- Liou, J.; Chiu, C. Analyzing the Relationship between CO2 Emission and Economic Efficiency by a Relaxed Two-Stage DEA Model. Aerosol Air Qual. Res. 2015, 15, 694–701. [Google Scholar] [CrossRef]
- Wang, Z.; Liu, Q.; Xu, J.; Fujiki, Y. Evolution characteristics of the spatial network structure of tourism efficiency in China: A province-level analysis. J. Destin. Mark. Manag. 2020, 18, 100509. [Google Scholar] [CrossRef]
- Wang, S.; Gao, S.; Huang, Y.; Shi, C. Spatiotemporal evolution of urban carbon emission performance in China and prediction of future trends. J. Geogr. Sci. 2020, 30, 757–774. [Google Scholar] [CrossRef]
- Li, Z.; Yu, K.; Zhong, J.; Yang, J.; Zhang, D.; Zhu, J. Spatial correlation network characteristics and influencing factors of water environmental efficiency in three major urban agglomerations in the Yangtze River Basin, China. Sustain. Cities Soc. 2024, 104, 105311. [Google Scholar] [CrossRef]
- Lu, R.; Yang, Z. Analysis on the structure and economic resilience capacity of China’s regional economic network. Appl. Econ. 2023, 56, 3920–3938. [Google Scholar] [CrossRef]
- Xia, M.; Li, J. Assessment of ecological well-being performance and its spatial correlation analysis in the Beijing-Tianjin-Hebei urban agglomeration. J. Clean. Prod. 2022, 362, 132621. [Google Scholar] [CrossRef]
- Yao, L.; Yu, Z.; Wu, M.; Ning, J.; Lv, T. The Spatiotemporal Evolution and Trend Prediction of Ecological Wellbeing Performance in China. Land 2020, 10, 12. [Google Scholar] [CrossRef]


| System Level | Normative Layer | Indicator Layer | |
|---|---|---|---|
| Initial investment | Input-side resource consumption | Energy consumption | Electricity usage per capita |
| Land depletion | Built-up area per capita | ||
| Consumption of water resources | Water usage per capita | ||
| Pollution emissions at the output | Wastewater discharges | Industrial wastewater discharges per capita | |
| Exhaust gas emission | Per capita industrial SO2 emissions | ||
| Solid waste emissions | Per capita municipal waste collection | ||
| Intermediate variable | Level of economic development | Personal income | GDP per person |
| Public Revenues | Fiscal revenue per person | ||
| Final outputs | Economic welfare | Consumer demand | Total retail sales of consumer goods per capita |
| Social welfare | Education needs | Count of tertiary education establishments | |
| Medical needs | Hospitals per 10,000 inhabitants | ||
| Hospital beds per 10,000 residents | |||
| Hospital beds per 10,000 residents | |||
| Environmental welfare | Environmental benefits | Public green space area per person | |
| Parks per 10,000 people | |||
| Centralized sewage treatment rate | |||
| Non-hazardous disposal rate of domestic waste | |||
| Norm | Formula | |
|---|---|---|
| Global network | Network density | |
| Network hierarchy | ||
| Network efficiency | ||
| Personal network | Degree centrality | |
| Betweenness centrality | ||
| Driving Factor | Alphanumeric | Introduction to Indicators |
|---|---|---|
| Ecological resource endowment | EC | Urban green coverage |
| Urbanization level | UB | Urbanization |
| Geographic distance | D | Geographic distance between cities |
| Industrial structure | IS | Secondary sector’s value added as a percentage of GDP |
| Technological innovation | TI | Total R&D investment |
| Environmental regulations | ER | Environmental pollution investment as a percentage of GDP |
| Level of external openness | FD | Total foreign direct investment (FDI) |
| Medical care level | ML | Financial medical expenditure |
| Stage | Plate | Number of Members | Percentage in the East | Percentage in the Central Region | Percentage in the West | Percentage in the North East | Board Connections |
|---|---|---|---|---|---|---|---|
| L1 | Plate I | 44 | 61.36% | 27.27% | 6.82% | 4.55% | Net spillover |
| Panel II | 107 | 27.10% | 29.91% | 16.82% | 26.17% | Two-way spillover | |
| Panel III | 89 | 25.84% | 41.57% | 32.59% | 0.00% | Broker | |
| Panel IV | 44 | 15.91% | 0.00% | 77.27% | 6.82% | Net benefit | |
| L2 | Plate I | 52 | 53.85% | 32.69% | 7.69% | 5.77% | Net spillover |
| Panel II | 102 | 31.37% | 31.37% | 22.55% | 14.71% | Two-way spillover | |
| Panel III | 79 | 24.05% | 40.51% | 35.44% | 0.00% | Broker | |
| Panel IV | 51 | 13.73% | 0.00% | 72.54% | 13.73% | Net benefit |
| Stage | Variable | 2007 | 2022 | ||||
|---|---|---|---|---|---|---|---|
| Un-Stdized Coefficient | Stdized Coefficient | Significance | Un-Stdized Coefficient | Stdized Coefficient | Significance | ||
| L1 | IS | 0.152 * | 0.015 * | 0.011 | 0.002 *** | 0.048 *** | 0.003 |
| UB | 0.213 *** | 0.030 *** | 0.000 | 0.006 *** | 0.235 *** | 0.000 | |
| D | −0.013 *** | −0.069 *** | 0.000 | −0.018 *** | −0.408 *** | 0.000 | |
| FD | −0.013 | −0.001 | 0.431 | 0.005 ** | 0.033 *** | 0.021 | |
| ER | −0.013 | −0.002 | 0.364 | −0.006 | −0.008 | 0.261 | |
| TI | 0.008 | 0.001 | 0.387 | 0.008 ** | 0.030 ** | 0.037 | |
| EC | −0.031 | −0.025 | 0.368 | −0.001 | −0.023 | 0.104 | |
| ML | 0.218 *** | 0.0201 *** | 0.002 | 0.027 *** | 0.063 *** | 0.001 | |
| Intercept | 0.115 | 0 | 0.168 | 0 | |||
| L2 | IS | 0.225 ** | 0.014 ** | 0.018 | 0.001 *** | 0.038 *** | 0.004 |
| UB | 0.255 *** | 0.023 *** | 0.001 | 0.006 *** | 0.239 *** | 0.000 | |
| D | −0.016 *** | −0.054 *** | 0.000 | −0.019 *** | −0.431 *** | 0.000 | |
| FD | −0.020 | −0.001 | 0.452 | 0.006 *** | 0.039 *** | 0.004 | |
| ER | −0.0001 | −0.00001 | 0.554 | −0.005 | −0.007 | 0.278 | |
| TI | −0.032 | −0.002 | 0.345 | 0.004 * | 0.017 * | 0.098 | |
| EC | −0.127 * | −0.007 * | 0.061 | −0.001 * | −0.023 * | 0.072 | |
| ML | 0.295 ** | 0.018 ** | 0.001 | 0.025 *** | 0.056 *** | 0.001 | |
| Intercept | 0.151 | 0 | 0.189 | 0 | |||
| t/t + 1 | n | 1 (Low) | 2 (Lower) | 3 (Medium) | 4 (Higher) | 5 (High) |
|---|---|---|---|---|---|---|
| 1 (low) | 213 | 0.671 | 0.315 | 0.014 | 0.000 | 0.000 |
| 2 (lower) | 1803 | 0.023 | 0.776 | 0.194 | 0.006 | 0.000 |
| 3 (medium) | 1578 | 0.000 | 0.167 | 0.714 | 0.114 | 0.006 |
| 4 (higher) | 464 | 0.000 | 0.017 | 0.321 | 0.541 | 0.121 |
| 5 (high) | 202 | 0.000 | 0.010 | 0.069 | 0.228 | 0.693 |
| Regional Background | t | t + 1 | |||||
|---|---|---|---|---|---|---|---|
| n | Low | Lower | Medium | Higher | High | ||
| low | 0 | 0.000 | 0.000 | 0.000 | 0.000 | 0.000 | |
| lower | 0 | 0.000 | 0.000 | 0.000 | 0.000 | 0.000 | |
| medium | 44 | 0.000 | 0.000 | 0.659 | 0.318 | 0.023 | |
| higher | 140 | 0.000 | 0.021 | 0.243 | 0.600 | 0.136 | |
| high | 101 | 0.000 | 0.001 | 0.059 | 0.248 | 0.683 | |
| low | 19 | 0.789 | 0.211 | 0.000 | 0.000 | 0.000 | |
| lower | 33 | 0.030 | 0.879 | 0.091 | 0.000 | 0.000 | |
| medium | 0 | 0.000 | 0.000 | 0.000 | 0.000 | 0.000 | |
| higher | 0 | 0.000 | 0.000 | 0.000 | 0.000 | 0.000 | |
| high | 0 | 0.000 | 0.000 | 0.000 | 0.000 | 0.000 | |
| low | 24 | 0.750 | 0.167 | 0.083 | 0.000 | 0.000 | |
| lower | 55 | 0.055 | 0.891 | 0.055 | 0.000 | 0.000 | |
| medium | 0 | 0.000 | 0.000 | 0.000 | 0.000 | 0.000 | |
| higher | 0 | 0.000 | 0.000 | 0.000 | 0.000 | 0.000 | |
| high | 0 | 0.000 | 0.000 | 0.000 | 0.000 | 0.000 | |
| low | 0 | 0.000 | 0.000 | 0.000 | 0.000 | 0.000 | |
| lower | 0 | 0.000 | 0.000 | 0.000 | 0.000 | 0.000 | |
| medium | 1 | 0.000 | 1.000 | 0.000 | 0.000 | 0.000 | |
| higher | 17 | 0.000 | 0.059 | 0.353 | 0.412 | 0.176 | |
| high | 7 | 0.000 | 0.000 | 0.143 | 0.143 | 0.714 | |
| None | low | 157 | 0.637 | 0.357 | 0.006 | 0.000 | 0.000 |
| lower | 1666 | 0.022 | 0.769 | 0.202 | 0.007 | 0.000 | |
| medium | 1520 | 0.000 | 0.169 | 0.718 | 0.109 | 0.005 | |
| higher | 301 | 0.000 | 0.013 | 0.359 | 0.522 | 0.106 | |
| high | 70 | 0.000 | 0.000 | 0.086 | 0.271 | 0.643 | |
| Spatial Hysteresis | t/t + 1 | L1 | L2 | ||||||||
|---|---|---|---|---|---|---|---|---|---|---|---|
| n | 1 | 2 | 3 | 4 | n | 1 | 2 | 3 | 4 | ||
| Traditional Markov | 1 | 1093 | 0.711 | 0.243 | 0.038 | 0.007 | 1099 | 0.828 | 0.146 | 0.022 | 0.005 |
| 2 | 1072 | 0.191 | 0.503 | 0.255 | 0.051 | 1054 | 0.128 | 0.646 | 0.187 | 0.039 | |
| 3 | 1037 | 0.032 | 0.221 | 0.535 | 0.212 | 1053 | 0.018 | 0.175 | 0.624 | 0.183 | |
| 4 | 1058 | 0.009 | 0.034 | 0.192 | 0.765 | 1054 | 0.003 | 0.032 | 0.178 | 0.787 | |
| Markov-I | 1 | 172 | 0.727 | 0.250 | 0.012 | 0.012 | 391 | 0.857 | 0.128 | 0.013 | 0.003 |
| 2 | 84 | 0.179 | 0.560 | 0.226 | 0.036 | 166 | 0.247 | 0.608 | 0.108 | 0.036 | |
| 3 | 62 | 0.000 | 0.210 | 0.532 | 0.258 | 43 | 0.116 | 0.302 | 0.512 | 0.070 | |
| 4 | 40 | 0.050 | 0.025 | 0.100 | 0.825 | 13 | 0.077 | 0.154 | 0.308 | 0.462 | |
| Markov-II | 1 | 493 | 0.738 | 0.215 | 0.037 | 0.010 | 416 | 0.825 | 0.149 | 0.022 | 0.005 |
| 2 | 413 | 0.189 | 0.540 | 0.211 | 0.061 | 390 | 0.126 | 0.690 | 0.159 | 0.026 | |
| 3 | 285 | 0.011 | 0.193 | 0.575 | 0.221 | 223 | 0.018 | 0.238 | 0.605 | 0.139 | |
| 4 | 246 | 0.016 | 0.033 | 0.228 | 0.724 | 138 | 0.000 | 0.051 | 0.174 | 0.775 | |
| Markov-III | 1 | 363 | 0.675 | 0.267 | 0.055 | 0.003 | 202 | 0.762 | 0.193 | 0.035 | 0.010 |
| 2 | 476 | 0.202 | 0.468 | 0.288 | 0.042 | 378 | 0.093 | 0.635 | 0.222 | 0.050 | |
| 3 | 508 | 0.045 | 0.254 | 0.500 | 0.201 | 562 | 0.011 | 0.149 | 0.646 | 0.194 | |
| 4 | 480 | 0.006 | 0.042 | 0.188 | 0.765 | 527 | 0.002 | 0.036 | 0.188 | 0.774 | |
| Markov-IV | 1 | 41 | 0.659 | 0.293 | 0.049 | 0 | 47 | 0.766 | 0.17 | 0.064 | 0 |
| 2 | 77 | 0.143 | 0.455 | 0.338 | 0.065 | 103 | 0.087 | 0.602 | 0.291 | 0.019 | |
| 3 | 171 | 0.035 | 0.181 | 0.579 | 0.205 | 217 | 0.014 | 0.143 | 0.627 | 0.217 | |
| 4 | 244 | 0 | 0.02 | 0.209 | 0.77 | 339 | 0.003 | 0.009 | 0.165 | 0.823 | |
| State Type | L1 | L2 | ||||||||
|---|---|---|---|---|---|---|---|---|---|---|
| 1 | 2 | 3 | 4 | 1 | 2 | 3 | 4 | |||
| Traditional Markov | Initial state | 0.243 | 0.271 | 0.246 | 0.239 | 0.391 | 0.232 | 0.222 | 0.155 | |
| stationary | 0.214 | 0.244 | 0.265 | 0.277 | 0.195 | 0.236 | 0.269 | 0.300 | ||
| Spatial Markov | Stationary | 1 | 0.585 | 0.281 | 0.100 | 0.035 | 0.219 | 0.237 | 0.195 | 0.350 |
| 2 | 0.259 | 0.329 | 0.228 | 0.184 | 0.197 | 0.232 | 0.285 | 0.286 | ||
| 3 | 0.105 | 0.225 | 0.331 | 0.339 | 0.199 | 0.251 | 0.271 | 0.278 | ||
| 4 | 0.086 | 0.164 | 0.329 | 0.421 | 0.114 | 0.188 | 0.341 | 0.357 | ||
Disclaimer/Publisher’s Note: The statements, opinions and data contained in all publications are solely those of the individual author(s) and contributor(s) and not of MDPI and/or the editor(s). MDPI and/or the editor(s) disclaim responsibility for any injury to people or property resulting from any ideas, methods, instructions or products referred to in the content. |
© 2024 by the authors. Licensee MDPI, Basel, Switzerland. This article is an open access article distributed under the terms and conditions of the Creative Commons Attribution (CC BY) license (https://creativecommons.org/licenses/by/4.0/).
Share and Cite
Yuan, R.; Ren, M.; Li, Z. Spatial Network Structure and Shift Path Prediction of Ecological Welfare Performance in Chinese Cities—Evidence from 284 Cities. Sustainability 2024, 16, 5282. https://doi.org/10.3390/su16135282
Yuan R, Ren M, Li Z. Spatial Network Structure and Shift Path Prediction of Ecological Welfare Performance in Chinese Cities—Evidence from 284 Cities. Sustainability. 2024; 16(13):5282. https://doi.org/10.3390/su16135282
Chicago/Turabian StyleYuan, Run, Mengjie Ren, and Zhigang Li. 2024. "Spatial Network Structure and Shift Path Prediction of Ecological Welfare Performance in Chinese Cities—Evidence from 284 Cities" Sustainability 16, no. 13: 5282. https://doi.org/10.3390/su16135282
APA StyleYuan, R., Ren, M., & Li, Z. (2024). Spatial Network Structure and Shift Path Prediction of Ecological Welfare Performance in Chinese Cities—Evidence from 284 Cities. Sustainability, 16(13), 5282. https://doi.org/10.3390/su16135282