Article

Evaluating the Determinants of Deforestation in Romania: Empirical Evidence from an Autoregressive Distributed Lag Model and the Bayer–Hanck Cointegration Approach

Department of Economic Informatics and Cybernetics, Bucharest University of Economic Studies, 0105552 Bucharest, Romania
*
Author to whom correspondence should be addressed.
Sustainability 2024, 16(13), 5297; https://doi.org/10.3390/su16135297
Submission received: 30 April 2024 / Revised: 31 May 2024 / Accepted: 20 June 2024 / Published: 21 June 2024
(This article belongs to the Section Sustainable Forestry)

Abstract

:
This study focuses on deforestation, a key aspect of the current environmental decline linked to worldwide economic development and increasing populations. It examines how renewable energy consumption (RENC), GDP per capita, urbanization (URB) and foreign direct investments (FDI) have influenced the expansion of forest areas (FAG) in Romania from 1990 to 2022, utilizing an autoregressive distributed lag (ARDL) model and the Bayer–Hanck cointegration approach. The main results of the paper are the following: GDP has a positive and statistically significant long-term influence on FAG; URB and FDI have a long-term negative impact on FAG; and RENC is not a significant determinant of FAG. In the short term, a 1% increase in URB leads to an 809.88% decrease in FAG, while a 1% increase in the first and second lag of URB leads to a 323.06%, and 216.26% increase in FAG. This suggests that as more land is developed for urban use (like building homes, businesses, and infrastructure), the immediate consequence is a significant reduction in the area available for forests. This effect indicates a strong inverse relationship between urbanization and the availability of land for forests in the short term. Our results underscore the importance of sustainable development strategies, including green urban planning and robust forest conservation, to offset the adverse effects of increased FDI on Romania’s environmental conservation, emphasizing the need for careful strategic planning and strong environmental policies to balance economic growth with forest protection.

1. Introduction

In the context of climate change and increasing concerns regarding environmental conservation, deforestation has become an extremely urgent and relevant issue globally. This concern is all the more pertinent in countries like Romania [1,2,3], which face specific challenges in managing natural resources and maintaining a sustainable balance between economic development and the conservation of forest ecosystems.
Forests serve as crucial carbon stores on land, playing a key role in reducing CO 2 emissions and other greenhouse gases (GHGs). They offer a wide array of ecosystem goods and services, such as support for livelihoods, socio-economic growth, ecosystem operations, and preservation of biodiversity, carbon management, nutrient recycling, and climate modulation. The rapid expansion of the human population, conversion of land for agricultural, industrial, and urban development, as well as inefficient forest management are identified as primary drivers of increased forest degradation [4].
Deforestation and forest degradation trigger a cascade of environmental impacts, markedly diminishing essential provisioning services and impacting biodiversity from local to global scales. These processes are accountable for approximately 15% of GHG emissions, contributing to higher global temperatures, altered weather patterns, and a rise in extreme weather occurrences [4]. Such climate changes jeopardize wildlife habitats and reduce the availability of food and water. Additionally, they lead to heightened soil erosion, disturbances in nutrient and water cycles, and disruptions to livelihoods.
Investing in natural ecosystems through strategies such as reducing emissions from deforestation and forest and enhancing initiatives to curb emissions from deforestation, forest degradation, and other forest-related actions plays a crucial role in lowering GHG emissions and bolstering forest carbon reserves. In recent years, Europe’s forest coverage has expanded, largely as a result of sustainable forestry management and reforestation initiatives, according to Prochazka et al. [5]. Efforts toward meeting the EU’s 2050 objective [6] of a decarbonized economy encompass the encouragement of sustainable bioenergy to replace fossil fuels. Consequently, it necessitates the implementation of sustainable forest management strategies and the safeguarding of regions rich in biodiversity, aiming to utilize biomass for generating electricity.
Next, we provide a brief overview of Romania’s forest landscape, including its historical significance and current challenges in forest conservation. This will give a clearer understanding of the context of our study. Romania’s forests are among the most extensive and biologically diverse in Europe, covering approximately 27% of the country’s land area [7]. These forests are primarily located in the Carpathian Mountains and are known for their vast tracts of virgin and old-growth forests which house a rich variety of wildlife. Historically, the forests of Romania have been fundamental in shaping the cultural and economic landscape of the country. The economic impact of Romanian forests has been important. From ancient times through to the modern era, wood from Romanian forests has been a crucial resource, driving the development of industries such as timber, furniture manufacturing, and even shipbuilding. The abundance of forests facilitated rural economies, with many communities depending on wood both for crafting traditional goods and as a primary fuel source. Furthermore, the forestry sector has historically been a significant employer and continues to play a vital role in rural areas.
On a broader scale, the historical significance of forests has instilled a sense of environmental stewardship among Romanians. Traditional forest management practices, often based on local ecological knowledge, have emphasized sustainability long before global conservation became a concern. These practices were not only about harvesting wood, but ensuring that the forest could regenerate and continue to provide resources for future generations.
Today, Romania’s forests face numerous conservation challenges. Illegal logging is the most critical threat, with illegal operations depleting forest resources at an alarming rate. The loss is not just economic but also ecological, impacting biodiversity and disrupting habitats for many species. Despite laws designed to protect forests, enforcement is often lax. Corruption and limited resources complicate the effective implementation of these laws, allowing illegal activities to persist. Economic pressures lead to deforestation for agricultural land, urban development, and infrastructure projects. This reduction in forest cover alters ecosystems and can lead to significant environmental consequences like soil erosion and decreased biodiversity. Rising temperatures and changing precipitation patterns affect forest health, potentially increasing vulnerability to pests, diseases, and fires. These changes challenge the traditional forest management practices and may require new conservation strategies to maintain forest health and resilience. While eco-tourism can be a boon for conservation efforts by providing economic incentives to preserve natural areas, excessive or poorly managed tourism can lead to habitat destruction and pollution. In response to these challenges, several conservation initiatives have been launched, by both the Romanian government and international bodies. Efforts include stricter law enforcement, sustainable forest management practices, reforestation projects, and promoting responsible tourism. Additionally, some areas of old-growth forests have been proposed as UNESCO World Heritage sites to provide additional protection and recognition at the global level.
Regarding Figure 1, the data presented relate to the distribution of land area in Romania covered by forests during the period 2000–2022. Starting in 2000, when the percentage was 27.71%, a constant and gradual increase in forest area can be observed, reaching a maximum of 30.12% and starting in 2016, a percentage that remains constant until 2021. In 2022, a slight decrease in the percentage of forest-covered area is observed, from 30.12% to 30.05%. This decrease could be the result of factors such as logging, illegal deforestation, or other economic activities that negatively impact the forest area. During the period 2000–2015, the forest-covered area increases consistently from 27.71% to 29.99%. This consistent annual growth indicates a series of effective reforestation and conservation measures and policies. Starting in 2016, the percentage of forest-covered area stabilizes at 30.12%. This suggests that, although significant progress was made in expanding the forest area up to 2015, the growth rate subsequently stopped, reaching a plateau. The constant increase in forest area between 2000 and 2015 indicates significant progress in reforestation and forest protection efforts in Romania. However, the subsequent stabilization and slight decrease in 2022 suggest the need to review and update forest management strategies to continue increasing forest area and combating deforestation. According to [8], in 2010, Romania’s natural forests spanned 6.32 million hectares, covering 32% of the country’s land area. By 2023, there was a reduction of 17.9 thousand hectares in its natural forests.
Our study represents a comprehensive investigation into the factors influencing deforestation in Romania, considering their direct impact on biodiversity, air and water quality, as well as on the quality of life and overall sustainability of the surrounding environment. By employing an Autoregressive Distributed Lag (ARDL) model and a Bayer–Hanck cointegration approach, this study proposes a rigorous analysis of the complex relationships among key variables, such as renewable energy consumption, GDP per capita, urbanization, and foreign direct investment (FDI), and the expansion of forest areas in Romania over a significant period from the early 1990s to the present.
Our research investigates the determinants behind the expansion of forest areas in Romania from 2000 to 2022. It adds to the current body of research on the factors driving forest growth in Romania by including renewable energy consumption as one of the variables under consideration. Also, our study aims to contribute to existing research on the factors influencing forest growth in Romania. It seeks to broaden the understanding by incorporating renewable energy consumption as one of the variables of interest. With these objectives in view, the research investigates the following specific questions:
RQ1: Is there a link between Romania’s economic development and its forest area expansion?
RQ2: How does utilizing electricity from renewable sources affect deforestation trends in Romania?
RQ3: To what extent is the FDI ecological halo hypothesis verified for Romania?
RQ1 delves into the relationship between economic growth and the expansion of forest areas, exploring whether economic development positively or negatively influences deforestation trends. RQ2 focuses on the impact of renewable energy consumption on deforestation patterns, aiming to determine whether increased use of renewable energy contributes to mitigating deforestation rates in Romania. RQ3 examines the validity of the foreign direct investment (FDI) ecological halo hypothesis in the Romanian context, assessing whether FDI inflows lead to environmental improvements or exacerbate deforestation pressures.
Our research is structured into several chapters. Section 2 presents the state of knowledge in the field and examines the relevant scientific publications related to the topic analyzed in our study. Section 3 introduces the variables used in our analysis to fulfill the stated purpose in the introductory section, and also describes the methodological flow of applying the ARDL model and the Bayer–Hanck cointegration approach. Our study concludes with Section 4, which is dedicated to drawing conclusions, providing future recommendations, and exploring potential research directions, while also presenting some potential limitations of our study.

2. Literature Review

This section provides a summary of prior research in deforestation, highlighting its global significance and emphasizing the need for a more comprehensive understanding of the factors that influence it, including specific studies on circular economy and renewable energy. The inclusion of these two topics in our analysis is crucial due to their relevance in addressing environmental challenges and promoting sustainable development. The circular-economy concept focuses on maximizing resource efficiency and minimizing waste generation, which can directly impact deforestation rates by reducing the demand for raw materials obtained from forests. Similarly, renewable energy sources play a vital role in mitigating climate change and reducing greenhouse gas emissions, which are significant drivers of deforestation. Therefore, investigating the interplay between deforestation, circular-economy practices, and renewable energy usage provides valuable insights for crafting effective environmental policies and sustainable land management strategies. Employing the ARDL approach in the context of Romania’s deforestation issue introduces a fresh perspective in bridging the existing research gap in this area. The literature review will be structured into five subsections, as follows.

2.1. Economic Growth and Deforestation

Deforestation represents an extensive and permanent process of cutting down forests, with a significant impact on the environment and biodiversity. Moreover, deforestation is one of the most serious threats to forest ecosystems and biodiversity globally, and in Romania, a country with a rich forest heritage, proper management of these resources is essential for maintaining ecological balance and promoting sustainable development [10,11].
The study by Rădulescu et al. [6] indicates a decoupling in the relationship between GDP growth and the reduction in forested areas in Romania over 22 years. This phenomenon is largely attributed to factors such as rural-to-urban migration, changes in consumption habits (moving from the use of firewood to natural gases, among others), and enhancements in the regulatory landscape surrounding forestry products.
In another study [12], authors explore the determinants of FAG for Finland for the period 1990–2022. The findings indicate that an increase in forest area is positively associated with both renewable energy production and urban development; economic expansion is inversely related to forest area growth; and, in the short term, an increase in forest area shows a positive association with all examined factors. Within the framework of the STIRPAT model for Finland for the period 1990–2022, the study by Kinnunen et al. [13] proves that GDP and urbanization increase greenhouse gas emissions, while renewable energy reduces them. Another study by Georgescu and Kinnunen [14] tests the existence of the Environmental Kuznets Curve (EKC) for Finland using data from 1990 to 2021. By means of the ARDL model, the study finds evidence of a U-shaped EKC between GDP and the environmental footprint. Georgescu et al. [15] make a comparison between Nordic countries and Southeast European countries. The conclusion of the study is that Nordic countries exhibit higher levels of urbanizations and economic development, coupled with progressive environmental policies that result in lower CO2 emissions per capita. In contrast, Southeast European countries are in a phase of rapid urbanization and economic development, and are making efforts to improve infrastructure and environmental sustainability.
The authors Bâra and Oprea [16] use confirmatory factor analysis (CFA) to develop a reliable measurement model and pinpoint the factors likely to boost awareness of pro-environmental actions. Paper [17] presents a big data framework that enhances electricity consumption forecasting for residential buildings using smart meters and weather data, employing advanced machine learning algorithms, including a novel FF-ANN model, to select the most accurate short-term load forecast method. Paper [18] proposes an adaptive direct load control strategy using IoT to optimize electricity use and improve grid efficiency, demonstrating up to 22.62% savings in electricity bills in simulations with 114 homes.
In the study conducted by Nica et al. [19], the ARDL model is used to examine whether greenhouse gas emissions from production activities and labor productivity per employed person and per hour worked affect the generation of municipal waste per capita. The authors’ research aims to explore the integration of the circular economy as a pivotal strategy for promoting sustainability in Romania.
Furthermore, the exploration of the circular economy as a significant strategy for promoting sustainability in Romania was also analyzed in the study conducted by Chiriță and Georgescu [20], where their approach included a cybernetics perspective. Both the strategies based on the circular economy and the objectives of our study address aspects of promoting environmental sustainability. For instance, da Silva et al. [21] analyze in their study how the forest sector achieves material and energy synergies, based on a specific model of the circular economy.
Other approaches focus on the energy sector, aiming to investigate whether greenhouse gas emissions and renewable energy can influence GDP. In the study conducted by Androniceanu et al. [22], the authors explore this approach for Romania, using the ARDL model to examine the causal relationship between greenhouse gas emissions, foreign direct investments, renewable energy, and GDP.
The direct causes of economic growth leading to deforestation could be agricultural expansion, infrastructure development and resource extraction. Forested areas are often cleared to accommodate new fields and pastures. This type of deforestation is particularly prevalent in developing countries, where agriculture remains a significant economic sector. Economic expansion necessitates improved infrastructure such as roads, highways, and urban areas. The construction of such infrastructure typically requires significant land clearing, which often occurs at the expense of forested lands. This not only leads to direct loss of trees, but also fragments habitats and increases accessibility for further deforestation. Economic growth can increase demand for natural resources such as timber, minerals, and oil. Forested regions often suffer from this when trees are harvested for wood and land is mined for resources. Indirect causes for deforestation could be the market dynamics and investments. As economies grow, so does the purchasing power of the population, which can increase the demand for products derived from deforestation. These demands encourage further deforestation to meet both domestic and global markets. Increased economic activity often attracts more investment in sectors like agriculture and mining, which can lead to deforestation if conducted unsustainably.
The relationship between income and deforestation is theoretically grounded in the U-shaped Kuznets Curve developed by Grossman and Krueger [23]. This concept suggests that in less-developed countries, economic growth first leads to environmental degradation, as seen in increased deforestation. Yet, once GDP per capita crosses a certain threshold, this trend of environmental degradation, including deforestation, tends to level off, and no longer worsens with further economic growth. In more-developed economies, this might even result in afforestation as economic conditions improve.
Cuaresma and Heger [24] find that economic progress in developing economies tends to correlate with an increase in tree cover loss. However, this relationship varies across different regions and income levels. Specifically, the observed trend where economic advancement leads to greater tree-cover loss predominantly pertains to Africa and Latin America, which include some of the poorest economies. In some Asian economies, which have a higher average income per capita, deforestation rates actually decline as economic development improves. Moreover, in countries with the highest income levels per capita, no significant impact on forest cover loss due to economic development improvements is noticed.
Nguyen and Nguyen [25] analyzed a dataset covering 148 countries from 1991 to 2017 and uncovered an uneven long-term relationship between the shadow economy and deforestation.
Pablo-Romero et al. [26] discover a positive relation between forested areas and economic growth for a group of 19 Latin American countries using ordinary and generalized least-squares and quantile regression.
EKC for deforestation is not supported in this case. Some studies have confirmed the presence of EKC for deforestation [27,28], while others have found no evidence to support it [29,30]. According to Caravaggio [31], higher-income nations are generally undergoing reforestation.

2.2. Renewable Energy Consumption and Deforestation

Tanner and Johnston [32] discovered that governments could lower deforestation rates by implementing ecological policies that increase rural access to renewable energy, thereby reserving biomass consumption for daily needs.
Ponce et al. [33] study a set of world countries with different income levels by means of panel ARDL and conclude that an increase in renewable energy consumption correlates with an increase in forest cover ranging between 0.02 and 0.04 square kilometers.
The paper by Wassie and Adaramola [34] provides an in-depth review and analysis of how small-scale renewable energy technologies (SRETs) can potentially reduce deforestation in the Eastern African region. The review indicates that effective and consistent use of SRETs could markedly decrease household consumption of traditional biomass and fossil fuels, thereby reducing deforestation.
Nazir et al. [35] investigated the development of a wind energy atlas, showing a strong link between the adoption of clean energy and decreased deforestation.

2.3. Urbanization and Deforestation

Ehrhardt-Martinez [36] suggests that in terms of forest cover, urbanization may be a preferable indicator of development.
Bhattarai and Hammig [37] emphasize the significance of demographic variables used in earlier models. They note that deforestation has been attributed to population factors, a tendency driven largely by the challenge of obtaining reliable data for certain countries, particularly in developing economies.
Nathaniel and Bekun [38] utilized the vector error-correction Granger causality approach and panel ARDL to investigate the relationship between urbanization and deforestation, considering the influences of energy consumption, trade openness, and economic growth using data from 1971 to 2015. The findings indicate that economic growth, energy consumption, and urbanization significantly contribute to deforestation in Nigeria. Yameogo [39] analyzes the impact of globalization and urbanization on deforestation in Burkina Faso from 1980 to 2017. Utilizing the ARDL approach, the empirical results confirm that in the long term, globalization, urbanization, and agricultural land use significantly increase deforestation, while a higher population density is associated with reduced deforestation rates.

2.4. Political, Institutional, and Governance Structures and Deforestation

The link between democracy and deforestation has been a central and contentious topic for many years. There remains significant debate over whether democracy influences deforestation. Authors like Neumayer [40] have argued that authoritarian regimes might be better positioned to implement environmental protection measures, provided they prioritize such actions. On the other hand, there are numerous claims, including those by Didia [41] and Shandra et al. [42], that democracy positively affects environmental outcomes due to enhanced civil liberties and increased political engagement.
Cary and Bekun [43] analyze a sample of 154 countries over the periods 1990–2000 and 2000–2010 and show that democracy reduces deforestation rates. When incorporating democracy spillover effects—meaning the influence on deforestation rates from changes in democracy levels in neighboring countries—the results still indicate that increased democracy leads to lower deforestation rates. Furthermore, it appears that having more democratic neighbors results in further reductions in deforestation.
The study by Acheampong and Opoku [44] concentrates on ensuring rural–urban equality in access to electricity and clean cooking technologies and fuels for a set of 45 sub-Saharan African countries during 2000–2020 using the two-step generalized-method-of-moments estimator. Energy consumption fails to address issues of access, equality, justice, and the transition to modern and clean energy.
Democracies often have better mechanisms for environmental protection because of transparency, accountability and public participation in policy-making processes. Citizens can voice their concerns about environmental degradation and influence policy through voting and activism. This could lead to the implementation of stricter environmental regulations and better enforcement. Wehkamp et al. [45] found that studies using environmental policies, environmental non-governmental organizations and rule-of-law as governance measures conclude that better governance reduces deforestation. Studies using democracy and rights conclude that better governance increases deforestation. Barbier and Tesfaw [46] found that forest transition in developing economies is influenced by rule-of-law and forest policy.

2.5. COVID-19 Impact and the Financial Crisis

Significant global events greatly impact economic activities and, in turn, have profound effects on both forestation and deforestation [5]. Several studies [47,48,49] address the impact that the COVID-19 pandemic has had on the deforestation sector globally. For instance, Singhal et al. [50] analyze such a perspective in their study, based on the fact that the COVID-19 pandemic has exacerbated deforestation worldwide, which is a concern for biodiversity conservation.
The extensive effects of the COVID-19 pandemic have touched every aspect of life, including environmental conservation. This crisis likely resulted in decreased human activity in forest areas, which may have slowed down the rate of deforestation [51]. The economic pressures brought on by the pandemic could have driven some groups to increase their logging activities [52]. The COVID-19 pandemic triggered severe environmental crises. The pandemic restrictions led to increased deforestation in various regions, due to multiple factors. This situation impacted a large part of the population that relies on forests for their livelihood and survival [50,53]. According to Wunder et al. [54], approximately 645,000 hectares of rainforest were lost up to March 2020, with Indonesia accounting for nearly three times the loss, compared to March 2019. Several countries including Brazil, Colombia, Indonesia, and Nepal have reported an incidence of illegal forest resource extraction during the pandemic [55]. In Southeast Asia, Malaysia and Indonesia had the highest forest losses combined with illegal timber extraction from rainforests [56]. Madagascar also experienced an increase in deforestation during the pandemic [57]. In Central Europe, the more substantial forest cover losses in 2020 occurred in Germany and in the Czech Republic, attributed to insufficient forest management practices due to a shortage of human resources and reduced budgets during the pandemic [58].
In conclusion, the literature review underscores the critical importance of understanding deforestation and its drivers on a global scale. It emphasizes the necessity for comprehensive research on the factors influencing deforestation, including the exploration of circular-economy principles and renewable energy. The integration of these themes into our analysis is paramount, due to their relevance in addressing environmental challenges and advancing sustainable development goals. The circular-economy concept, aimed at maximizing resource efficiency and minimizing waste generation, directly impacts deforestation rates by reducing the demand for forest-derived raw materials. Similarly, renewable energy sources play a crucial role in mitigating climate change and reducing greenhouse gas emissions, significant drivers of deforestation. Therefore, investigating the interplay between deforestation, circular-economy practices, and renewable energy usage provides valuable insights for crafting effective environmental policies and sustainable land-management strategies. Overall, the literature underscores the urgency of addressing deforestation through interdisciplinary research approaches and the implementation of holistic strategies that promote environmental conservation and sustainable development.

3. Data and Methodology

The ARDL approach is proposed for investigating the effects of renewable energy consumption (RENC), foreign direct investments (FDIs), gross domestic product (GDP), and urbanization (URB) on forest area growth (FAG). Table 1 presents the variables description and their source for the timeframe 1990–2022. FAG is calculated based on the comparison of forest coverage from one year to the previous one. FDI represents capital flows from foreign investors and can significantly impact the host country’s economic development and environmental policies. By focusing on FDI, this study aims to capture the influence of international investment on FAG, which might differ from the impact of domestic investments. Unlike total investment, FDI comes with technological transfer, managerial expertise, and practices from more-developed economies, which can contribute to more efficient and sustainable use of resources. This could have a direct effect on environmental outcomes, including FAG. While the study does not include total investment directly, FDI can serve as a proxy for overall investment trends, particularly in sectors that are attractive to foreign investors. URB is often directly correlated with population growth. As more people migrate to urban areas, the overall population density in these areas increases. This reflects broader demographic changes, making URB a good indicator of population dynamics. In this study, URB is a proxy measure for population growth, a fact supported by [59,60]. URB assumes the conversion of rural or forested land into urban spaces for housing, infrastructure and industry. This process impacts FAG, making URB a relevant factor to study in relation to changes in forest cover. URB is associated with socio-economic development, including higher income levels, better infrastructure and more job opportunities. With increased urbanization comes higher demand for resources such as timber, land and energy. This increased demand leads to deforestation and a decrease in forest areas. URB reflects population pressures on forest resources. The policies governing urban expansion, zoning regulations and land use planning in urban areas can affect forest conservation and reforestation efforts. Thus, URB can be a more appropriate indicator of policy impacts on forest areas. URB reflects migration patterns from rural to urban areas. This migration can lead to abandoned agricultural land in rural areas, which might naturally revert to forests or be targeted for reforestation projects. This dynamic makes URB a complex and insightful variable for studying forest area changes. While Romania’s overall population has been declining steadily in recent years, from a peak of 23.2 million in 1990 to 19.12 million in 2021, the patterns of urbanization and the associated economic and policy factors have driven land use changes that contribute to deforestation. By focusing on urbanization, our study captures these dynamics more accurately, reflecting the dependence among urban growth, economic development and environmental impact.
We use throughout the paper the terms “deforestation” and “forest area growth” deliberately, to reflect the dynamic nature of forest area changes in Romania. Our intention is to provide both the reduction and increase in forest areas. The term FAG has a larger meaning, reflecting both forest expansion, when its value is positive, and forest loss, when its value is negative. Deforestation is often driven by economic activities, such as agriculture and urban development, whereas FAG can result from deliberate human efforts to restore forests. Deforestation has a negative environmental impact, including loss of biodiversity and increased carbon emissions. FAG has positive environmental impacts, such as carbon sequestration, improved biodiversity, and ecosystem restauration.
This study investigates the impact of GDP, FDI, RENC, and URB on FAG in Romania over the period from 1990 to 2022. It aims to understand how the growth of forested areas correlates with the real GDP per capita among other macroeconomic indicators, following the framework proposed by Murshed et al. [61] The model used to depict this relationship is expressed through the dependence Equation (1):
F A G t = a 0 + a 1 G D P t + a 2 R E N C t + a 4 U R B t + a 5 F D I t + ε t
The time series data have been transformed into natural logarithms. This logarithmic transformation smooths out sudden fluctuations in the data and stabilizes the variance within the time series [62]. Equation (1) becomes an ARDL (n, p, q, r, s) model:
Δ F A G t = a 0 + k = 1 n a 1 Δ F A G t k + k = 1 p a 2 Δ G D P t k + k = 1 q a 3 Δ R E N C t k + k = 1 r a 4 Δ U R B t k + k = 1 s a 5 Δ F D I t k + λ 1 F A G t 1 + λ 2 G D P t 1 + λ 3 R E N C t 1 + λ 4 U R B t 1 + λ 5 F D I t 1 + ε t
In Equation (2), Δ is the first difference operator and ε t is the noise. n, p, q, r and s are lag lengths which will be determined later. The study investigates the cointegration relationship among FAG, GDP, RENC, and URB using the joint cointegration test proposed by Bayer and Hanck [63]. This test consolidates four cointegration methodologies: Engle and Granger [64], Johansen [65], Boswijk [66], and Banerjee et al. [67], denoted as EG, J, BO, and BA, respectively. By pooling the strengths of these tests, it offers a more robust conclusion regarding cointegration. Each of the four cointegration tests are conducted independently. The Fisher-type combined test procedure is used to pool the p-values from each individual test:
E G J = [ ln ( P E G ) + ln ( P J ) ]
E G J B O B A = 2 [ ln ( P E G ) + ln ( P J ) + ln ( P B O ) + ln ( P B A ) ]
In Equations (3) and (4), PEG, PJ, PBO, and PBA denote the probabilities (4) associated with the EG, JOH, BO, and BDM tests, respectively.
The overall significance of the Bayer–Hanck cointegration test is determined by comparing the combined p-value to a critical value, indicating whether the null hypothesis of no cointegration can be rejected.
The null hypothesis is rejected if the calculated Fisher statistic exceeds the critical value specified by Bayer and Hanck [63].
The robustness of the analysis is confirmed through the application of the ARDL cointegration bounds test proposed by Pesaran et al. [68]. In comparison to other cointegration methods, such as the two-step approach by Engle and Granger [64] and the Johansen test [65], the ARDL model offers several econometric advantages. It eliminates the necessity for integration of order one I (1) as required by Johansen and Juselius [69]. Also the long-term and short-term relationships are simultaneously estimated.
The null hypothesis of the ARDL cointegration bounds test assumes no cointegration, contrary to the alternative hypothesis suggesting cointegration presence. The F-statistic is computed and compared to the critical values set by Pesaran et al. [68]. If the F-statistic exceeds the upper threshold, the null hypothesis is rejected, indicating cointegration. Conversely, if the F-statistic falls below the lower threshold, the null hypothesis of no cointegration is accepted. If the F-statistic values lie within the lower and upper thresholds, then the cointegration test is inconclusive. In the presence of cointegration, the Error Correction Model (ECM) has the form:
Δ F A G t = a 0 + k = 1 n a 1 Δ F A G t k + k = 1 p a 2 Δ G D P t k + k = 1 q a 3 Δ R E N C t k + k = 1 r a 4 Δ U R B t k + k = 1 s a 5 Δ F D I t k   + Γ E C M t 1 + ε t
In Equation (5), Γ represents the coefficient that describes the short-term dynamics within the Error Correction Model (ECM). The error correction term (ECT) should be statistically significant and negative, with a minimum threshold of −2 [70]. The negative sign indicates the speed of adjustment at both short-term and long-term levels.
The ECM Equation (5) within the ARDL model is used to examine the adjustment dynamics following a deviation from the long-term equilibrium relationship among the variables.
To validate the long-term coefficients derived from the ARDL model, supplementary testing models were employed, including the fully modified ordinary least squares (FMOLS) method by Phillips and Hansen [71], dynamic ordinary least squares (DOLSs) by Stock and Watson [72], and canonical cointegration regression (CCR) by Park [73].
Various diagnostic tests were conducted to ensure the robustness of the model. These tests, such as the normality test, the Breusch–Pagan–Godfrey test, the ARCH test, the LM test, and the Ramsey RESET test confirm the normal distribution of the model, the absence of autocorrelation, and the stability of the results.
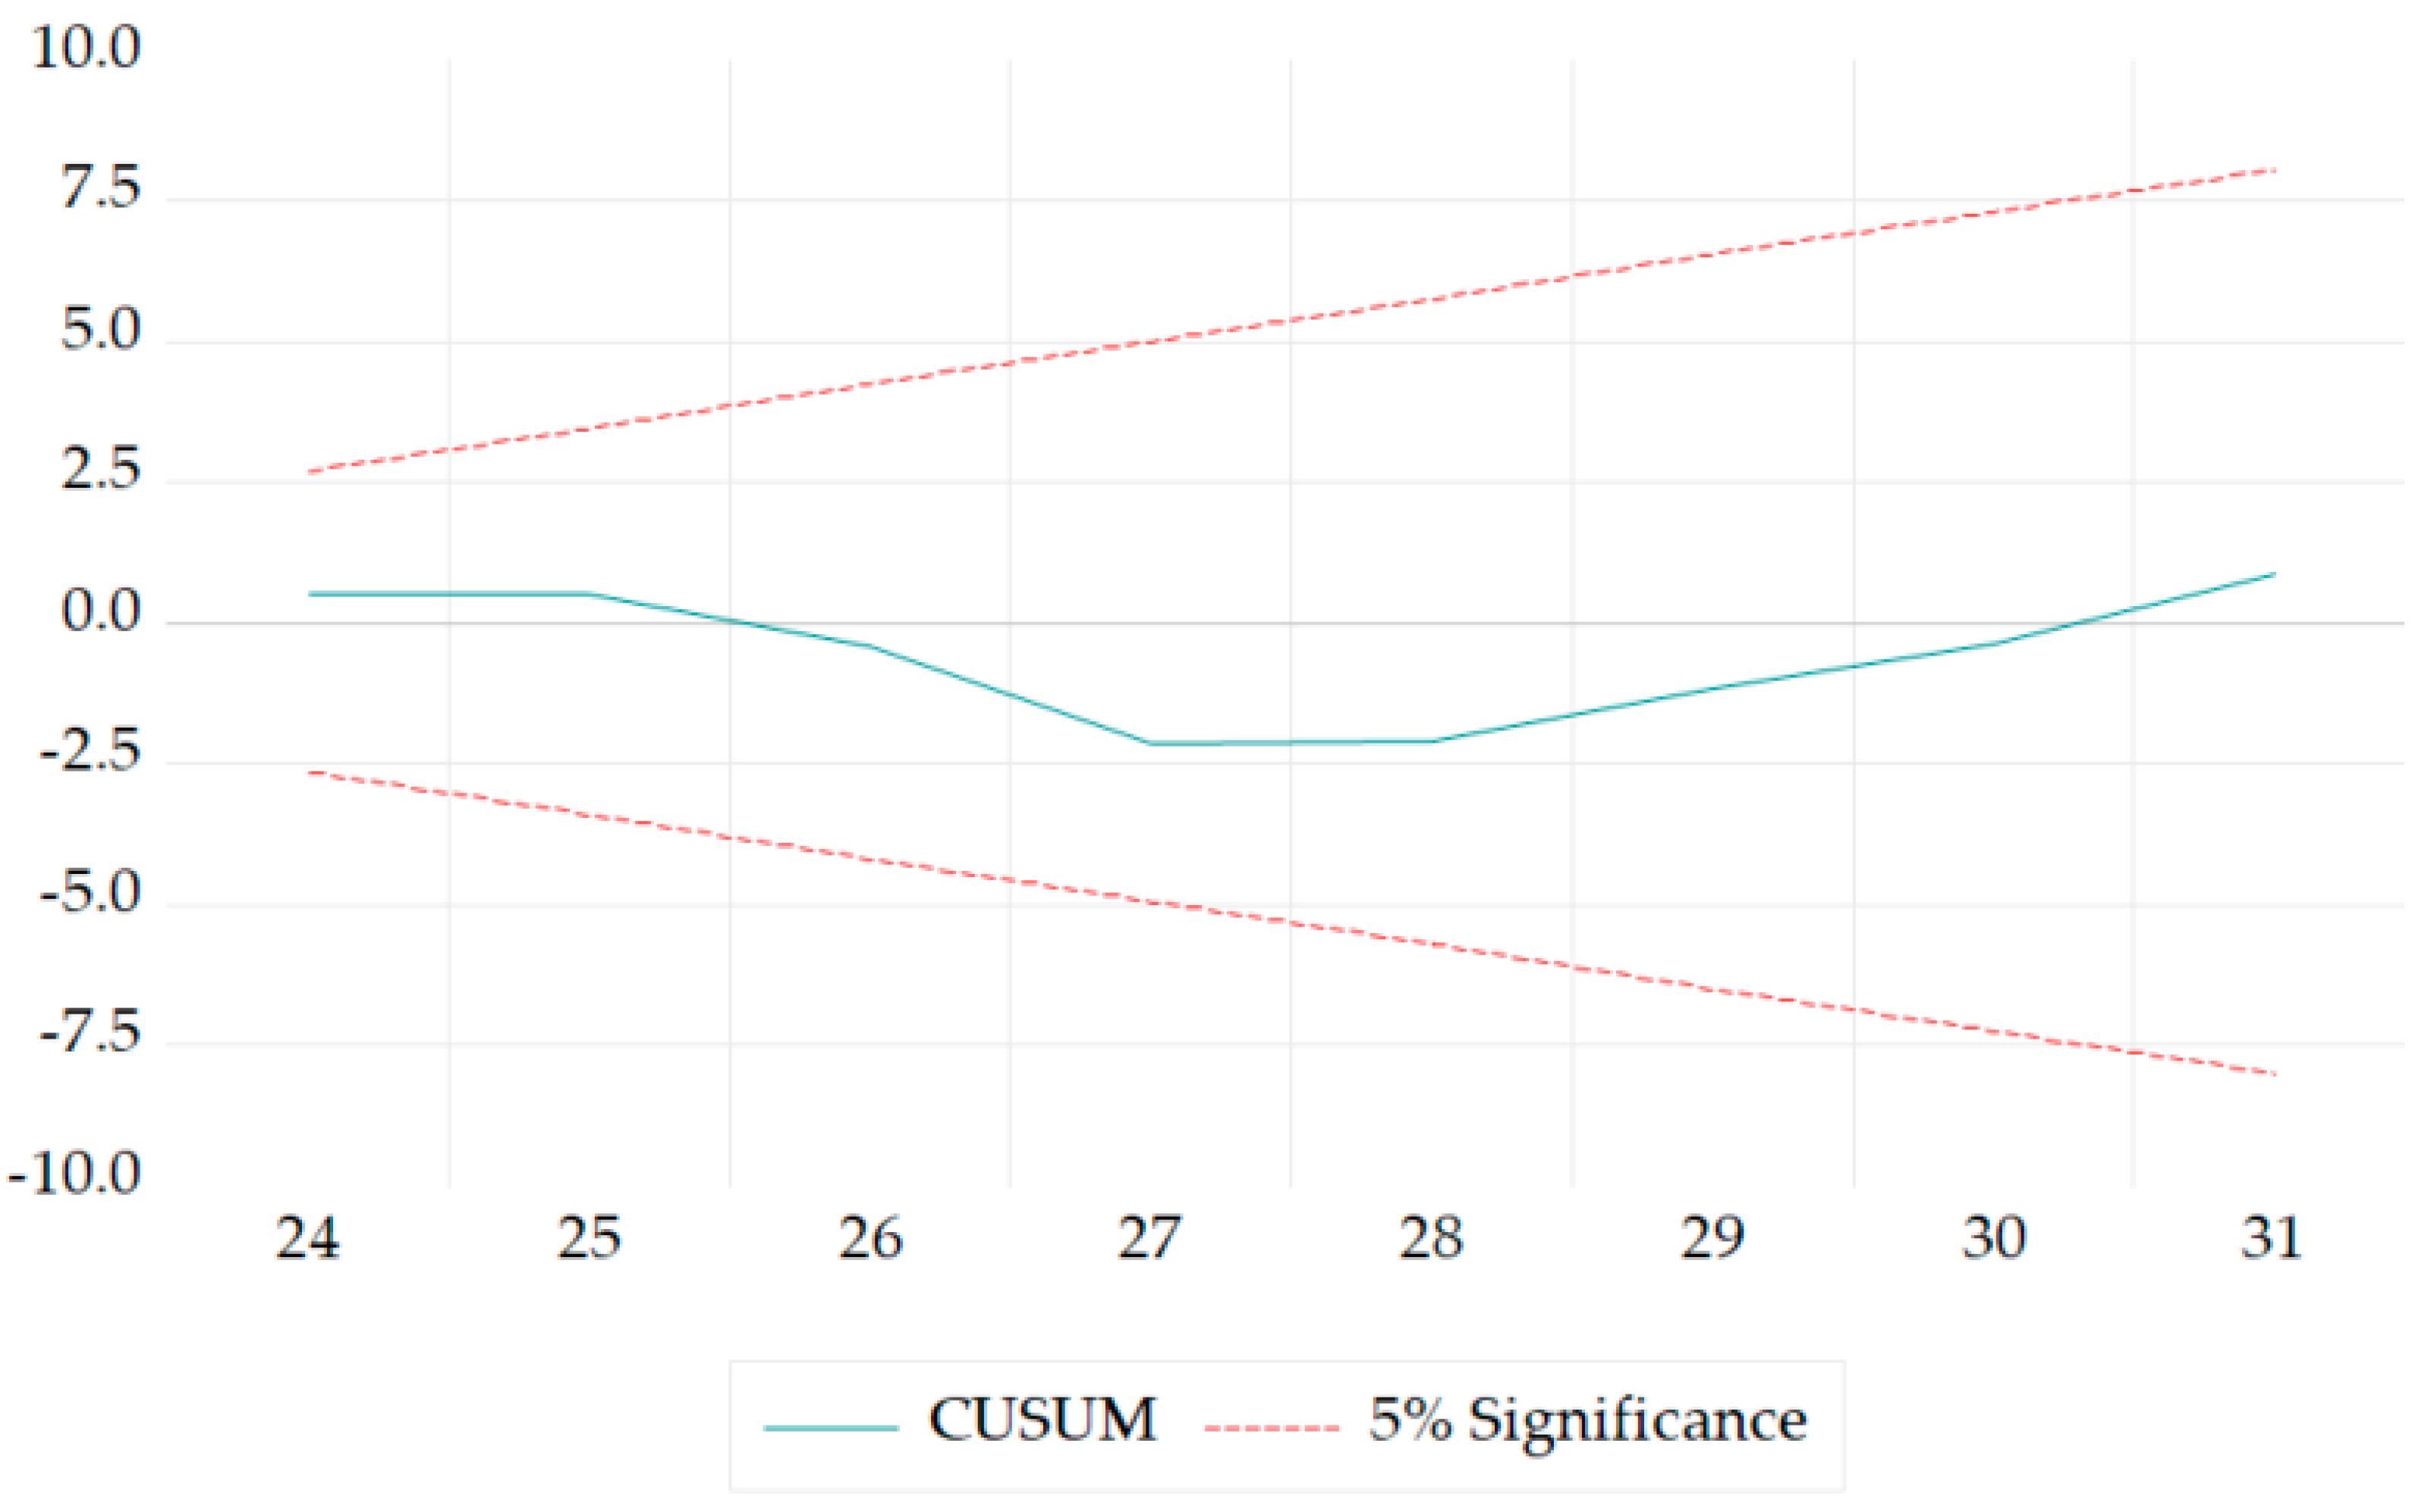
The model’s stability was evaluated using the cumulative sum (CUSUM) and cumulative sum of squares (CUSUMSQ) tests, as described by Brown et al. [74]. Pesaran and Shin [75] and Pesaran et al. [68] indicate that that these tests offer insights into the suitability of the ARDL-ECM model. Both tests involve plotting the residuals of the ECM. If the CUSUM and CUSUMSQ plots stay within the 5% critical boundary, the null hypothesis of parameter stability cannot be rejected, indicating the stability of the model.
During the manuscript preparation process, in order to ensure high accuracy and coherence of certain terms translated from Romanian to English, we used ChatGPT-4, a language model provided by OpenAI. The version number of the software is GPT-4. It was not used in any other manner; the creation of the work was carried out from the authors’ perspective. The methodological flow was presented by us based on the specialized literature as cited in the text. Additionally, the developed analyses, the provided results, and the study’s conclusions are our own.

4. Romania’s Forest Conservation Challenges: Empirical and Strategic Analyses

In this section, we present the findings of our study regarding the determinants of deforestation in Romania. The analysis encompasses various factors influencing forest area expansion and degradation, shedding light on the complex relationship between economic development, renewable energy consumption, urbanization, and foreign direct investment, and their impact on forest ecosystems.

4.1. Assessment of Deforestation Impact in Romania: PESTELE and SWOT Analyses

Using two complementary analyses, this section will address a detailed analysis of deforestation in Romania, highlighting the purpose of better understanding and formulating strategies based on the external and internal factors influencing this phenomenon.
In recent times, Romania has been facing a serious issue related to extensive deforestation [76]. This phenomenon refers to the removal of forests or groups of trees, followed by the use of the land for non-forestry purposes.
In Figure 2a, we observe the loss of tree cover, measured in hectares, in Romania for the period 2021–2023. This trend provides an important perspective on the impact of human activities on the forests of Romania and underscores the importance of ongoing monitoring and appropriate interventions in the management of natural resources. We can note in the year 2007 a massive loss of tree cover, totaling 35,327 hectares, possibly indicating intense deforestation or major natural events such as fires or storms. The years 2004, 2005, and 2020 also show considerable losses, suggesting periods of increased human activity in forests or other ecological disturbances. The years 2003 and 2015 recorded the lowest figures of tree cover loss, with 8780 and 9675 hectares lost, respectively. This could indicate successful conservation efforts or favorable weather conditions that contributed to the reduction in deforestation. The data show fluctuations from year to year, suggesting that variable factors such as changes in environmental policies, economic conditions (which affect the timber industry), and climate changes can have a significant impact on the rates of tree cover loss. Additionally, a notable increase in tree cover loss in 2020 and 2023 indicates a trend of returning to higher rates of deforestation after a relatively calm period between 2016 and 2019. This could be motivated by increasing economic pressure to exploit natural resources or by the relaxation of environmental regulations.
In Figure 2b, information regarding the gross carbon emissions from the forests of Romania is presented, measured in megagrams (Mg) of CO 2 , for the period from 2001 to 2023. This trend reflects the impact of tree cover loss on carbon emissions, a crucial indicator for understanding the effects of deforestation on climate change. We can observe that the year 2007, correlated with massive tree cover loss, marks the highest value for gross carbon emissions, indicating a particularly severe year in terms of forest loss or major events that contributed to this increased emission, such as extensive wildfires or massive deforestation. Additionally, the year 2020 shows a significant increase in emissions, with 14,560,319 Mg of CO 2 , reflecting possible intensifications of forestry activities or other major disturbances. The year 2003 presents the lowest emissions recorded in the analyzed interval, with 3,601,512 Mg of CO 2 , which could suggest effective conservation efforts or favorable climatic conditions that limited forest loss in that year. Considerable annual fluctuations are observed, suggesting that variable factors, such as changes in environmental policies, forest management practices, economic conditions (which affect the timber industry), and climatic phenomena (for example, droughts or floods) can have a major impact on carbon emission rates. After a peak in 2007, emissions temporarily decreased, but the overall trend shows fluctuations, with significant increases in 2012, 2016, and again in 2020, indicating periods of return to deforestation or other environmental events that increase carbon emissions.
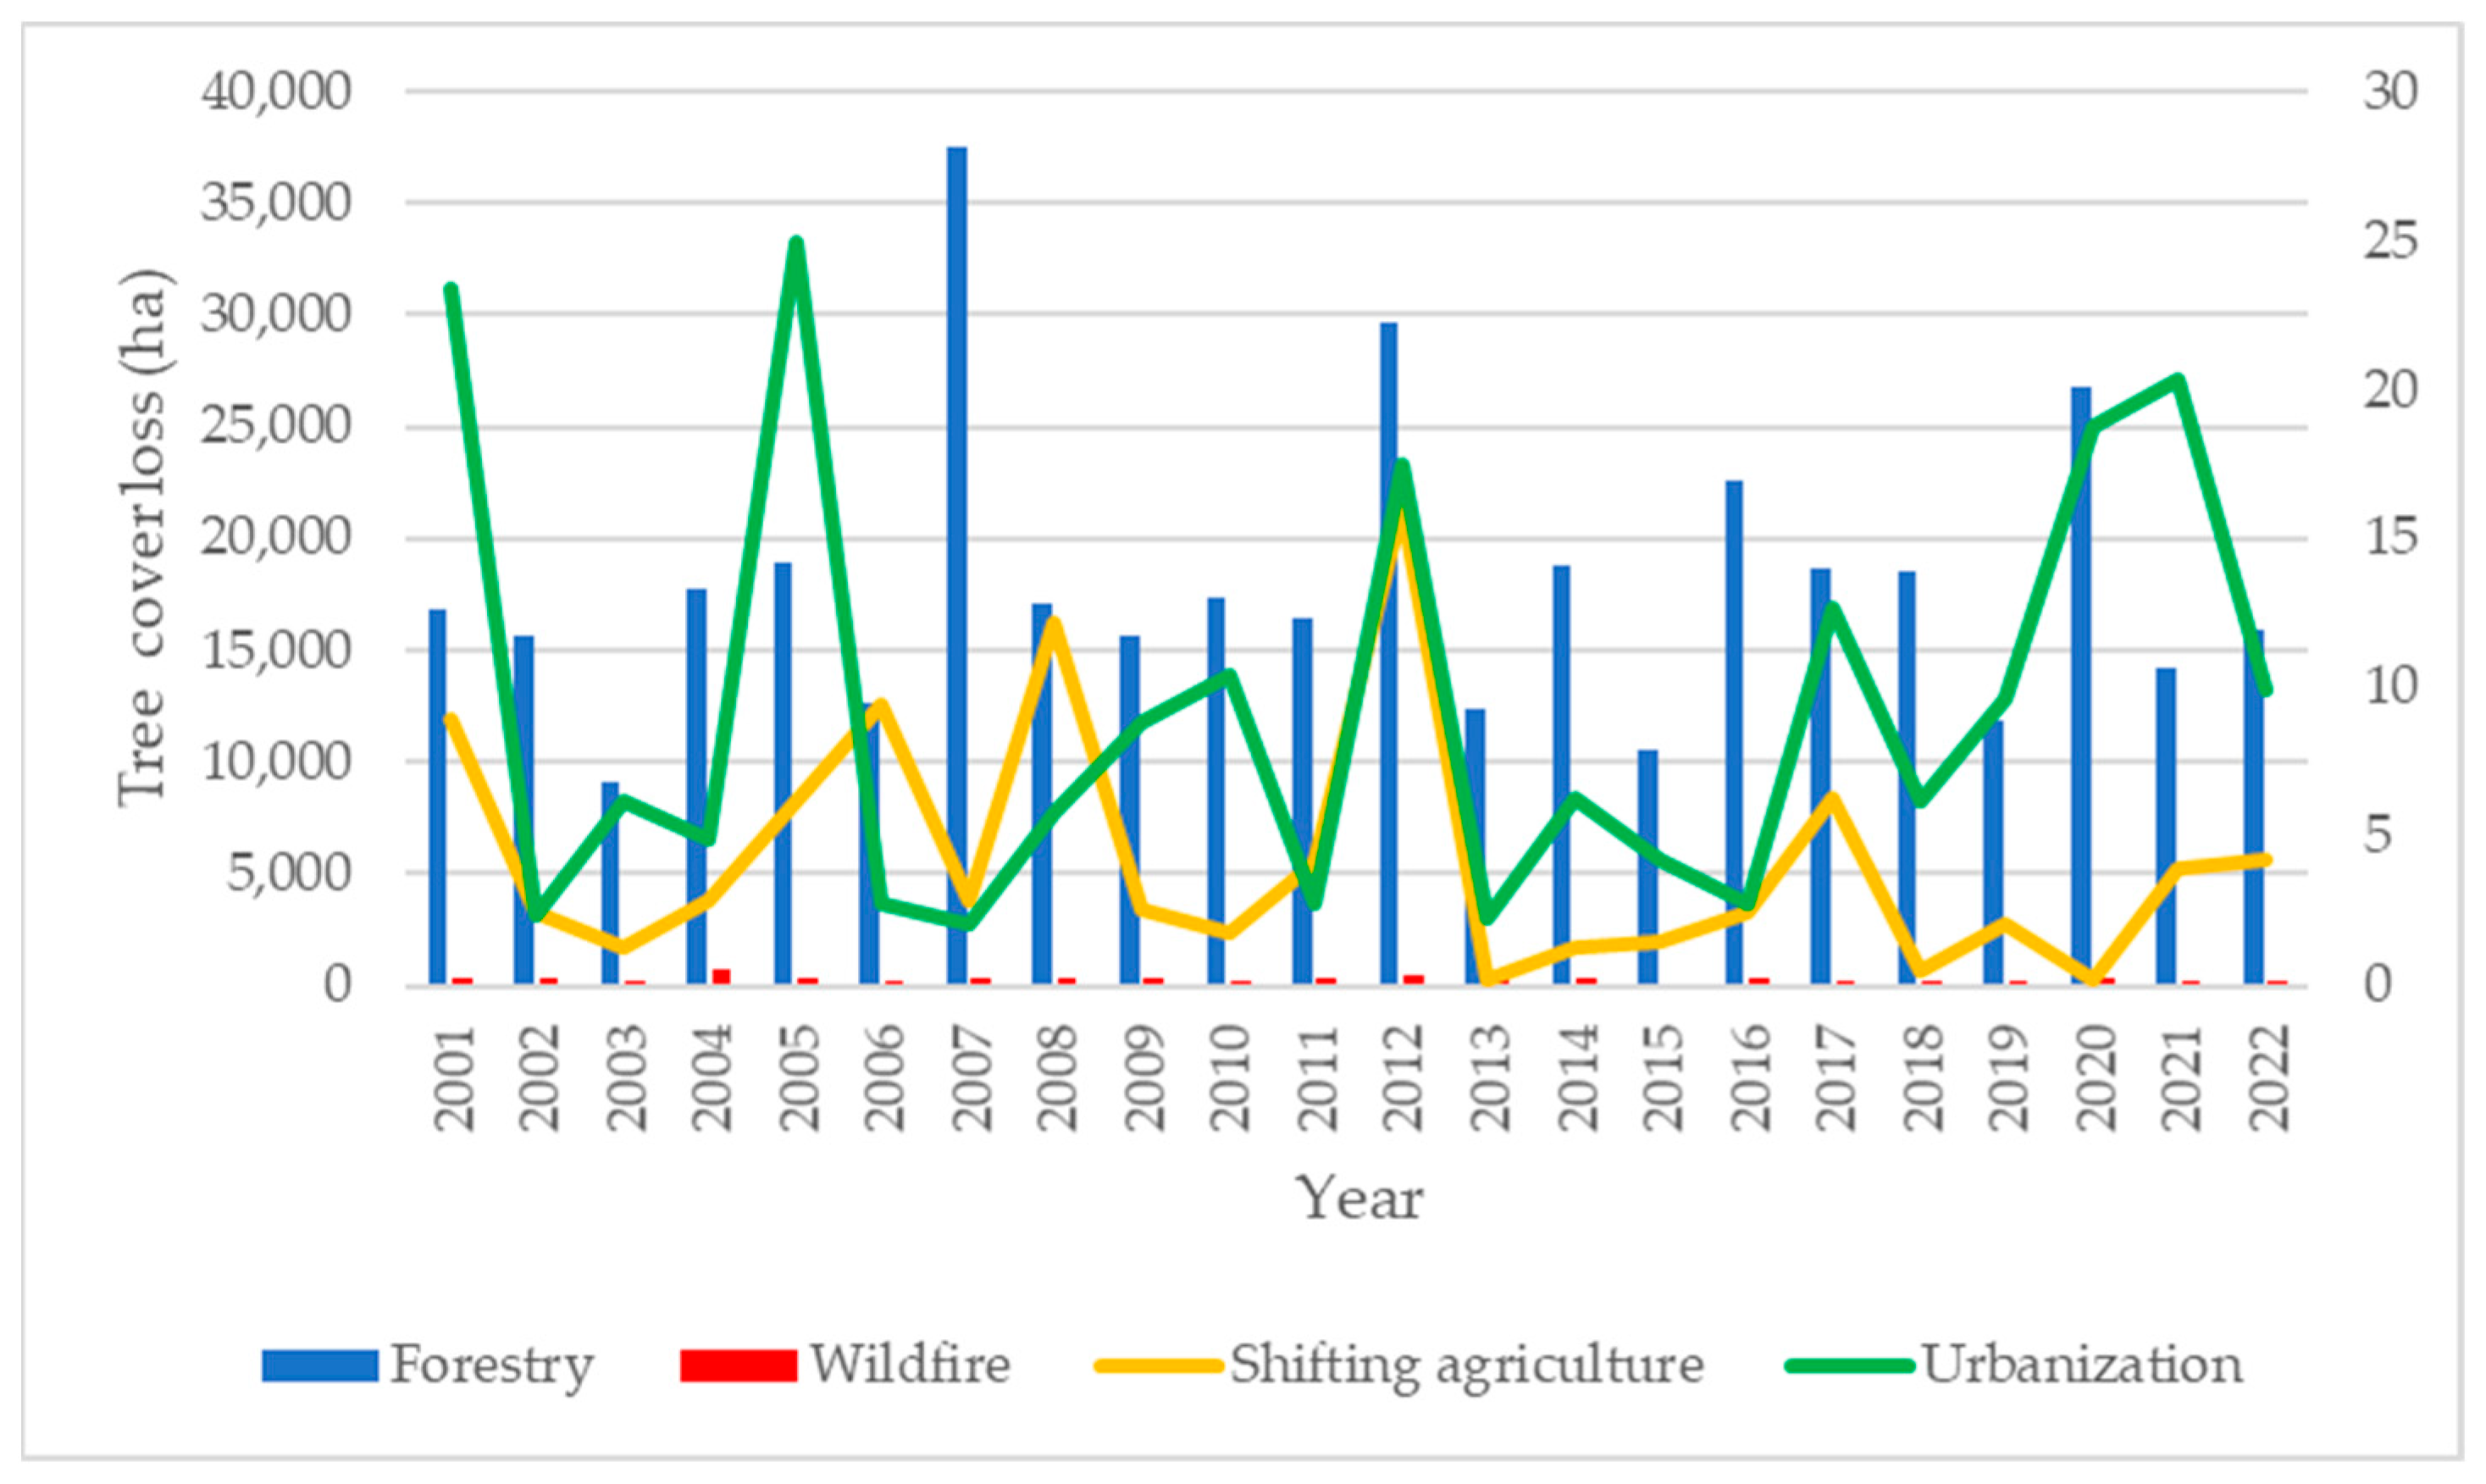
In Figure 3, a detailed perspective on the main causes of tree cover loss in Romania over the period from 2001 to 2023 has been presented. This graph breaks down the tree cover loss into four main categories: forestry activities, shifting agriculture, wildfires, and urbanization.
We observe that forestry activities are the primary cause of tree cover loss each year, with significantly higher values compared to the other three categories. This indicates that forestry exploitation is a major and consistent factor in deforestation in Romania. The years with the highest losses due to forestry activities include 2007, 2012, 2020, and 2023, with each of these years recording significant increases. The year 2007 stands out, with the greatest loss, 37,468 hectares, followed by 2020 with 26,724 hectares, and 2023 with 25,081 hectares. Wildfires have also contributed to tree cover loss, with a notable peak in 2004, where approximately 790 hectares were lost due to fires. Although the contribution of wildfires is smaller compared to forestry activities, they represent a source of annual variability in tree cover loss. Urbanization has had a relatively small but consistent impact on tree cover loss. However, the trend is increasing, especially in recent years (for example, 2020 with 18.74 hectares and 2023 with 21.06 hectares lost), suggesting that urban expansion is becoming an increasingly pressing issue. Shifting agriculture contributes the least to tree cover loss, with minor annual variations. However, the years 2012 and 2023 show a slight increase in the impact of this activity.
Thus, this information underscores the need for stringent conservation measures and sustainable management of forests in Romania. The growing impact of urbanization and fluctuations caused by natural fires requires careful planning and the implementation of proactive strategies to reduce risks and impacts on forests.
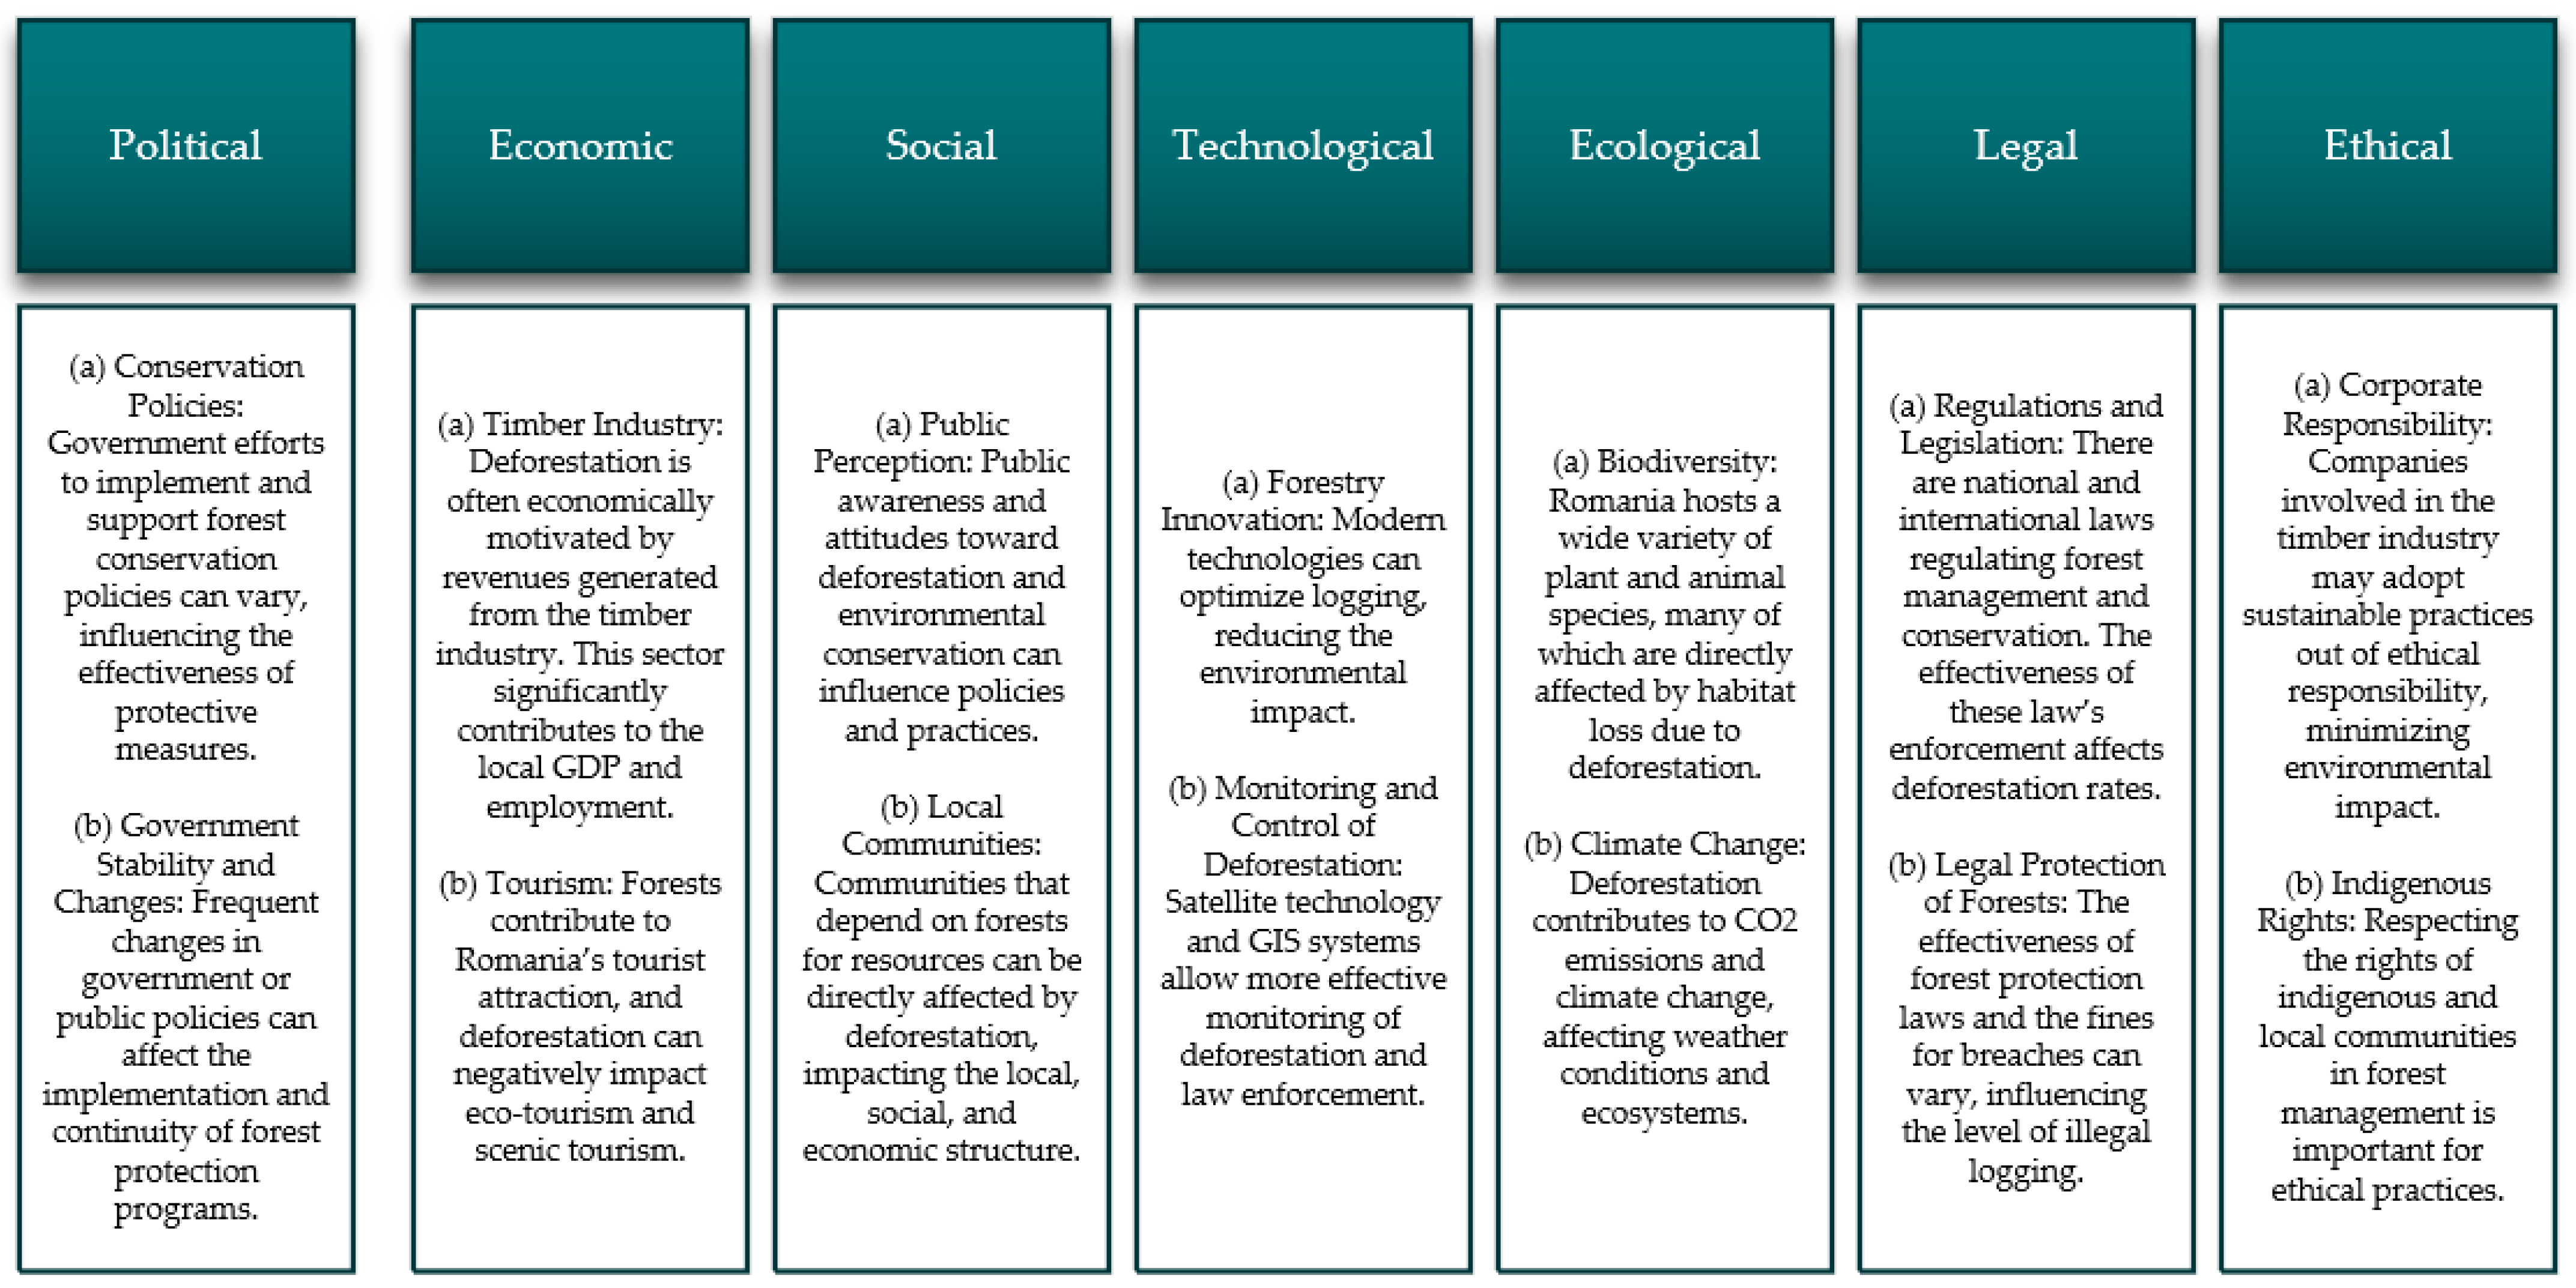
In Figure 4, an analysis of external factors from a political, economic, social, technological, ecological, legal, and ethical (PESTELE) perspective, which influences deforestation in Romania, has been conducted.
The PESTELE analysis [22,77] serves as a critical strategic instrument for identifying and comprehending the risks and opportunities within an organization’s or economic system’s external environment. This tool aids managers in foreseeing changes and trends within the economic landscape, allowing them to make well-informed decisions to tackle challenges and leverage potential opportunities.
The PESTELE analysis conducted for deforestation in Romania offers a nuanced understanding of the various external factors that impact forest management and conservation in the country. This comprehensive examination highlights the interconnectedness of political, economic, social, technological, ecological, legal, and ethical factors in shaping the landscape of deforestation and forest preservation. Deforestation in Romania is influenced by a complex interplay of diverse factors that go beyond simple economic gains for the timber industry. Political stability, economic priorities, social awareness, technological advancements, ecological considerations, legal frameworks, and ethical imperatives all play significant roles in determining the rate and extent of forest cover loss. The PESTELE analysis underscores the need for integrated and holistic strategies that align all sectors and stakeholders. Coordinated efforts that include government policies, economic incentives, social engagement, technological solutions, ecological conservation, legal enforcement, and ethical practices are essential to effectively tackle the challenges of deforestation. Also, the government’s role emerges as pivotal in setting and enforcing policies that balance economic development with environmental sustainability. Political will and governmental stability are crucial for the continuity and effectiveness of conservation initiatives.
This PESTELE analysis not only delineates the breadth of factors influencing deforestation, but also calls for a concerted effort to mitigate its effects through comprehensive, multi-faceted strategies. It is clear that protecting Romania’s forests from ongoing deforestation pressures requires a robust and adaptive approach that incorporates economic, ecological, and social dimensions. Ensuring the health and sustainability of forests is not just about preserving biodiversity and maintaining ecological balance, but is also crucial for the socio-economic stability and environmental legacy of Romania.
Performing a SWOT analysis on deforestation in Romania helps to assess the internal strengths and weaknesses, as well as the external opportunities and threats associated with forest management and deforestation practices.
In Figure 5, a SWOT analysis has been conducted. From the perspective of strengths, Romania harbors various ecosystems and diverse species, highlighting its significant ecological value and conservation potential. Additionally, Romania has a foundation of laws and environmental regulations aimed at forest conservation and sustainable management. For example, as of 29 June 2023, Regulation (EU) 2023/1115 concerning products associated with deforestation and forest degradation came into effect [78]. This establishes a strict framework of rules for the marketing and export from the European Union of certain basic products and derivatives that are associated with deforestation and forest degradation [79]. This regulation is part of a broader EU effort to combat global deforestation and protect biodiversity, thereby contributing to the goals of the European Green Deal and the EU’s 2030 biodiversity strategy [80].
Despite the existence of environmental laws and regulations, a weakness is that their enforcement may be weak, due to a lack of resources or corruption [81,82]. Another potential weakness could be the inadequate planning in the forestry sector, which can lead to unsustainable exploitation practices [83]. In terms of opportunities, the development of eco-tourism could be an alternative source that reduces economic dependence on timber exploitation while promoting conservation [84]. The use of modern technology could be another opportunity, such as satellite imagery and drone surveillance for more efficient monitoring and management of forest areas [85]. Illegal activities continue to pose a significant threat to forest conservation efforts, driven by high profits and weak law enforcement [85]. Changing climatic conditions can exacerbate forest vulnerabilities by increasing the risks of wildfires, pest epidemics, and other natural disturbances [86].
This SWOT analysis reveals that although Romania’s forests are valuable ecological assets with substantial local support for their conservation, significant challenges persist due to enforcement issues and economic pressures. Seizing opportunities such as eco-tourism and international partnerships could mitigate some of these pressures. However, addressing threats related to illegal logging and land conversion requires robust policies and innovative management strategies. Effectively addressing these internal and external factors is crucial for the sustainable management of Romania’s forests and the reduction of deforestation rates.

4.2. Analyzing Romania’s Forest Dynamics: An ARDL and Bayer–Hanck Cointegration Approach

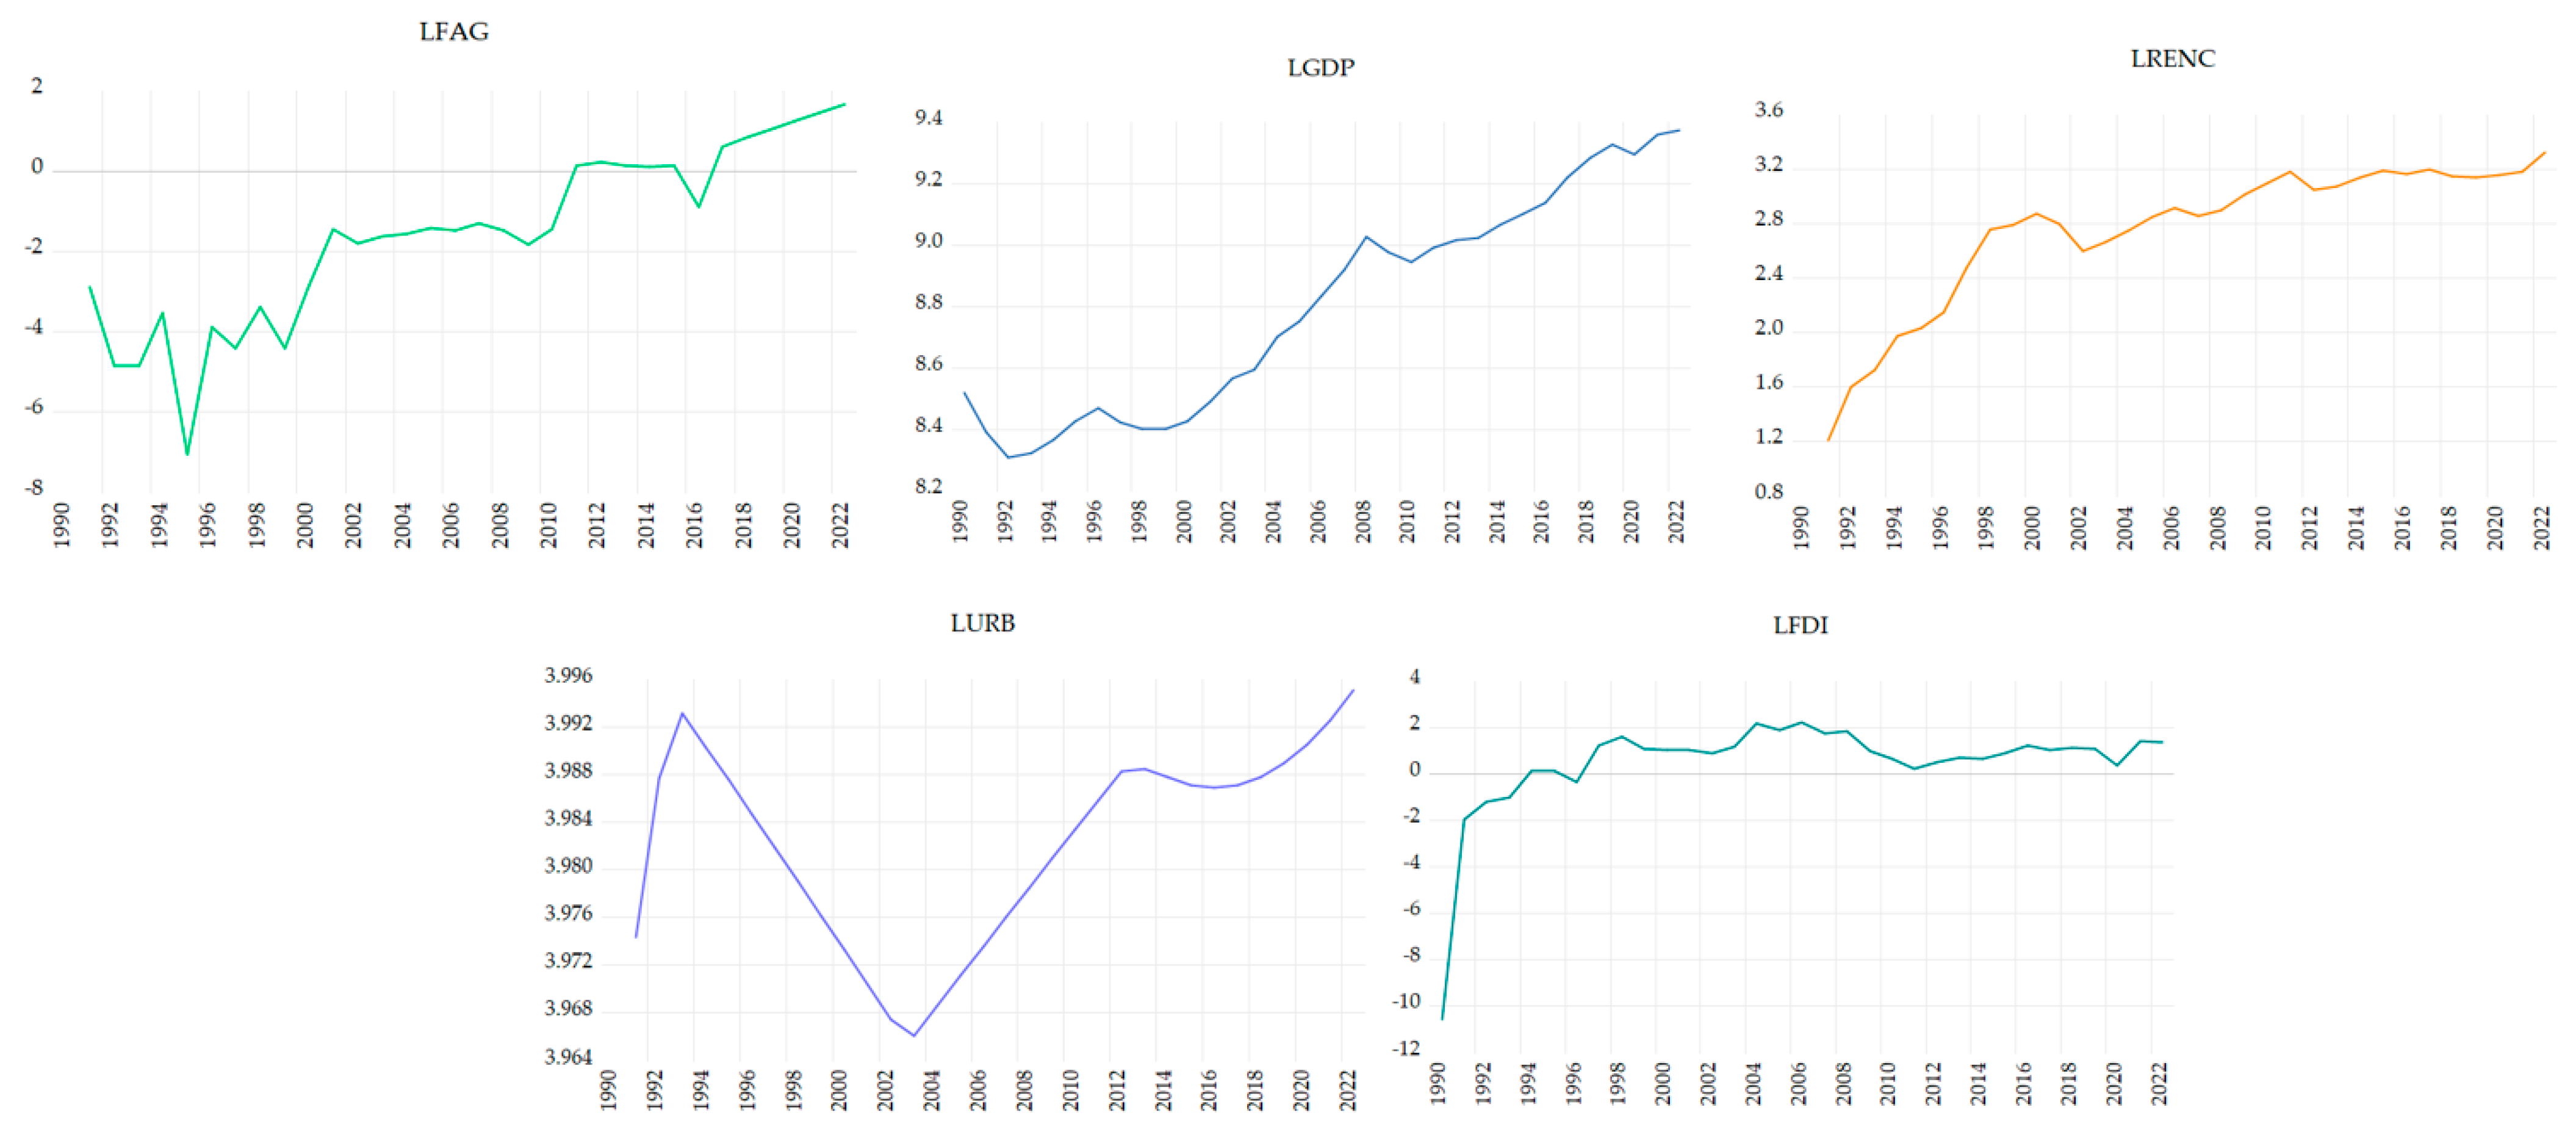
Through rigorous econometric analysis employing the ARDL model and Bayer–Hanck cointegration approach, we unveil significant insights into Romania’s forest dynamics. Figure 6 presents the yearly progression of the five indicators for Romania from 1990 to 2022. It highlights upward trends in FAG, GDP, RENC and FDI, alongside a marked surge in URB in the latter years.
Table 2 provides descriptive statistics for variables after logarithmic transformation. The mean for URB is 3.98, with its maximum reaching 3.99. GDP has an average of 8.77, characterized by a minimal variability of 0.33. URB, similarly, exhibits slight variability at 0.01. FAG, GDP, and URB display platykurtic distributions, indicating flatter peaks compared to a normal distribution, whereas FDI and RENC show leptokurtic distributions, characterized by more peaked distributions.
Initially, standard tests are conducted to determine the stationarity of the dataset at both the original level and the first difference. This involves utilizing the augmented Dickey–Fuller (ADF) test, as outlined by Dickey and Fuller [87], the results of which are presented in Table 3. Additionally, the Vogelsang and Perron breakpoint unit root test [88] is applied, and its findings are displayed in Table 4. The rationale for employing a breakpoint unit root test arises from the possibility of ADF tests providing skewed outcomes when a structural break is present, a scenario underscored by Dogan and Ozturk [89]. For the subsequent application of the ARDL bounds testing approach, it is imperative that all variables show stationarity, whether at their original level (I (0)) or after the first difference (I (1)). The probabilities are documented in parentheses within Table 3 and Table 4, where Table 4 also specifies the years of any breaks. According to the data in Table 3, FAG, GDP, and URB are found to be of order 0 integration (I (0)), indicating stationarity at the original level. Conversely, RENC and FDI are of order 1 integration (I (1)), showing stationarity only after the first difference. From Table 4, one can see that FAG and GDP are I (1), while RENC, URB and FDI are I (0).
Therefore, the ARDL approach emerges as the optimal model, exhibiting unbiasedness and superior performance compared to other models tailored for smaller sample sizes. According to Table 5, three out of five criteria suggest that a lag length of 3 is the most favorable selection for the vector autoregression (VAR) model.
The first step prior to estimating an ARDL model involves performing cointegration analysis using the bounds testing approach. This test is designed to either refute or confirm the null hypothesis, which asserts that there is no cointegration among the variables. The chosen model is ARDL (3,3,2,3,3). Therefore n = 3, p = 3, q = 2, r = 3, and s = 3.
Table 6 reveals that the F-statistics values computed for both the EG-JOH and EG-JOH-BO-BDM methods exceed their respective critical values at the 5% significance level. Consequently, this supports the rejection of the null hypothesis, which posits a lack of cointegration at the 5% level. The inference is that the variables are cointegrated.
The ARDL cointegration bounds test results are presented in Table 7. Table 7 reveals that the calculated F-statistic is 5.81, surpassing the upper critical bound for I (1), signifying cointegration among the variables. The estimated long-term coefficients are presented in Table 8.
Also, from Table 8, one can see that GDP has a positive and statistically significant long-term influence on FAG. A 1% increase in GDP exerts a 13.24% increase in FAG. As the society becomes wealthier, there is often a shift in values towards greater environmental consciousness.
In Romania, this could translate into stronger public and political will for forest conservation and reforestation projects. Economic prosperity can provide both the public and private sectors with more resources to invest in sustainable forestry practices, reforestation projects, and the development of protected areas. Increased GDP might also enable the adoption of advanced technologies that enhance forest management and monitoring. With economic growth, the government may have more capacity to implement and enforce environmental regulations, manage natural resources sustainably, and participate in international environmental agreements. Economic resources can also support the establishment of incentives for forest conservation, such as payments for ecosystem services. As countries develop economically, there is often a shift away from resource-intensive industries toward service-oriented sectors. In Romania, such a transition could reduce the pressure on forests for timber and land, contributing to forest area growth.
RENC does not significantly influence FAG in the long term. The relationship between renewable energy consumption and forest area growth is more indirect compared to other factors like land use policy, conservation efforts, and agricultural practices. Renewable energy primarily reduces the reliance on fossil fuels and decreases greenhouse gas emissions, which positively impacts overall environmental health and can contribute to climate change mitigation. However, these benefits might not translate directly or immediately into increased forest areas.
The impact of renewable energy on forest area also depends on the type of renewable resources being utilized. For instance, solar and wind energy have minimal direct interaction with forest growth. In contrast, biomass energy, which could potentially have a more direct relationship with forest management, might not be the primary source of renewable energy in Romania or might be sourced in a manner that does not significantly affect forest areas (e.g., using agricultural waste rather than wood). The state of forest areas is heavily influenced by existing forest management practices, conservation policies, and reforestation efforts. If these practices are effective, increases in renewable energy consumption might not have a discernible additional impact on forest growth, especially if forests are already being managed sustainably. The effects of increased renewable energy consumption on ecosystems and forest areas might occur over a very long timeframe. The immediate benefits of renewable energy—such as reduced air and water pollution—might not translate into noticeable changes in forest area growth over the short or medium term. Moreover, the statistical analysis might not capture these effects due to time lags and the scale of measurement. In the context of Romania, economic development could lead to increased land-use pressure for agriculture, urbanization, and infrastructure development. Even with a rise in renewable energy consumption, these pressures might counteract potential positive impacts on forest areas, especially if economic growth results in greater demand for land, potentially leading to deforestation or forest degradation.
A 1% increase in URB leads to a 317.52% long-term decrease in FAG. The magnitude of the effect (317.52%) is extraordinarily high, and implies a drastic reduction in forest area growth as a result of relatively small increases in urbanization. This suggests that urban expansion and development significantly encroach upon forest lands, leading to deforestation or hindering forest regeneration and expansion in Romania. The long-term nature of the effect highlights the fact that the consequences of urbanization on forest areas are not immediate, but manifest over an extended period. This could be due to the cumulative effects of urban sprawl, the ongoing conversion of forest land to urban or industrial uses, and the possible neglect of reforestation and conservation efforts as urban areas expand. The following factors could contribute to this relationship. Urbanization increases the demand for land, not only for housing and commercial spaces, but also for infrastructure such as roads and utilities. This can lead to the direct conversion of forest areas to urban use. Urban expansion can fragment forest landscapes, disrupting ecosystems and diminishing the viability of remaining forest patches. Weak enforcement of forest conservation policies or inadequate urban planning might exacerbate the impact of urbanization on forest areas.
A 1% increase in FDI leads to a 1.38% long-term decrease in FAG. FDI is a critical driver of economic growth, bringing in capital, technology, and expertise. It often leads to the expansion of industries and infrastructure development. While this can bolster economic development, it can also increase the pressure on natural resources, including forests, especially if the investment is in resource-intensive sectors like mining, agriculture, or construction. Increased FDI might lead to greater demand for land for industrial, agricultural, or urban development projects. In cases where governance and environmental regulations are not stringent or well-enforced, this can result in deforestation or hinder efforts to expand forest areas. The 1.38% long-term decrease in FAG could reflect the cumulative impact of these land use changes driven by FDI. The effect of FDI on forest areas also hinges on the country’s environmental policies and their enforcement.
In Romania, if environmental regulation is not robust or if it does not keep pace with the rate of FDI, then investment might lead to environmental degradation, including the reduction in forest areas. The specific figure (1.38% decrease) suggests that, on balance, FDI might not be channeling into sectors or projects that are neutral or positive for forest growth, or that the negative impacts on forests from some investments outweigh positive contributions.
The negative ECT value indicates that a long-term equilibrium relationship exists between the FAG and the selected independent variables (GDP, urbanization, FDI, and renewable energy consumption). This suggests that despite short-term fluctuations, these variables move together in the long term. The magnitude of the ECT, −1.54, signifies the speed at which deviations from the long-term equilibrium are corrected. In this context, a value of −1.54 means that any short-term disequilibrium in the forest area growth is corrected by approximately 154% in the subsequent period. This unusually high adjustment speed suggests a rapid return to equilibrium, potentially indicating over-adjustment or a highly responsive relationship between forest area growth and the explanatory variables.
The short-term dynamics of FAG, GDP, URB and RENC are captured in Table 9. In the short term, a 1% increase in URB leads to an 809.88% decrease in FAG, while a 1% increase in the first and second lag of URB leads to a 323.06%, and 216.26% increase in FAG. This suggests that as more land is developed for urban use (like building homes, businesses, and infrastructure), the immediate consequence is a significant reduction in the area available for forests. One notices a strong inverse relationship between urbanization and the availability of land for forests in the short term. The further results are that a 1% increase in urbanization has a positive effect on forest area growth in subsequent periods—specifically, a 323.06% increase after the first lag (a certain period after the initial urbanization) and a 216.26% increase after the second lag. This suggests a more complex relationship over time. After the initial loss of forest area due to urban development, there might be increased efforts or policies aimed at reforestation or improving forest area growth in areas not immediately affected by urbanization. These lagged positive effects could be due to factors like enhanced urban planning, green initiatives, afforestation programs, or changes in land use policies that aim to compensate for the initial loss of forest areas. This specific analysis is contextualized within Romania, implying that these dynamics between urbanization and forest area growth are observed in this country. The situation might vary in different countries, based on their environmental policies, urbanization rate, land management practices, and the initial extent of forested areas.
Additionally, FMOLS, DOLS and CCR verify the results obtained through the ARDL model. These methods are crucial for confirming the precision of the statistical analysis concerning the research variables, in light of the cointegration relationships identified earlier. As observed in Table 10, the signs for FMOLS, DOLS, and CCR largely align with the long-term outcomes of the ARDL model.
The null hypotheses H 0 and their outcomes are reported in Table 11. These results indicate that all tests accepted the null hypothesis, thus confirming the adequacy of the model used and the validity of the results obtained in the analysis.
The stability of the model is assessed using the CUSUM and the CUSUM of Squares tests, with the results depicted in Figure 7 and Figure 8. The stability of the model’s parameters is confirmed by both tests, as the trajectories for CUSUM and CUSUM of Squares remain within the 5% significance level, delineated by a red dashed line.
The post-estimation analysis of the ARDL-ECM model confirms the dynamic characteristics within the time series. This dynamic characteristic underscores the interdependencies and lagged effects among the variables studied, revealing how changes in one variable can impact others, over time. Such insights are crucial for understanding the underlying dynamics of the system under investigation and can inform policy-making and strategic decision-making processes aimed at addressing the identified relationships and their implications.

5. Discussion

The findings from the ARDL model have several implications for sustainable forestry and forest management in Romania.
Since GDP positively influences FAG in the long term, policies that foster economic growth should be designed to support sustainable forestry practices. Economic incentives for sustainable forest management can help align economic development with environmental goals. Policymakers should leverage this by integrating forestry conservation into economic growth strategies. Investments in eco-friendly technologies and sustainable industries can drive economic growth while preserving forest areas [90].
The negative impact of URB on FAG in both the short and long term highlights the need for green urban planning. Integrating green spaces and implementing urban policies that minimize deforestation are important for maintaining forest areas. Urban development plans should incorporate green spaces and ensure that infrastructure projects do not encroach on vital forest areas. Techniques such as vertical urban development and the creation of urban green belts can help mitigate deforestation. Implementing strict zoning laws that designate certain areas for conservation can help balance urban expansion with forest preservation [91].
The negative influence of FDI on FAG suggests that current investment practices may lead to increased deforestation. It is essential to regulate FDI, to ensure that it contributes to sustainable development. Investments should be directed towards eco-friendly projects that support forest conservation. Policies should incentivize foreign investments in sustainable projects, such as renewable energy, sustainable agriculture, and eco-tourism, which do not compromise forest areas. Strengthening environmental regulations and monitoring the environmental impact of foreign investments can ensure that economic benefits do not come at the cost of forest degradation [92,93].
The lack of a significant impact of RENC on FAG indicates that renewable energy policies alone may not be sufficient to influence forestry outcomes. Additional measures, such as targeted forest management programs and incentives for preserving forest areas, are necessary. Combining renewable energy policies with forest conservation strategies can create synergies that benefit both energy production and forest preservation. For example, promoting agroforestry and using forest residues for biomass energy can support both sectors. Educating stakeholders about the benefits of renewable energy and providing incentives for practices that integrate energy production with forest conservation can enhance the impact of renewable energy on forest areas.
While this study found RENC not to be a significant determinant of FAG, other research suggests that the transition to renewable energy can reduce pressure on forests by decreasing the demand for traditional biomass fuels [94].
The significant short-term decrease in forest area due to urbanization emphasizes the need for immediate interventions. Policies to control urban sprawl, promote vertical urban development, and protect peri-urban forested areas can mitigate this impact. Implementing measures to control urban sprawl and encouraging the redevelopment of existing urban areas can reduce the pressure on forests. Identifying and protecting critical forest areas from urban encroachment can help preserve biodiversity and ecosystem services.
Overall, these results suggest that sustainable development strategies should balance economic growth with forest conservation [95]. Implementing robust environmental policies, promoting green urban planning, regulating FDI, and encouraging sustainable land use practices are essential steps toward sustainable forest management in Romania.

6. Conclusions and Recommendations

Our study highlights several essential aspects in understanding deforestation dynamics in Romania and the factors driving it. The detailed analysis of influences on forest area expansion and degradation reveals a complex relationship between economic development, renewable energy consumption, urbanization, and foreign direct investment, and their impact on forest ecosystems. Through rigorous economic analysis using the ARDL model and Bayer–Hanck cointegration approach, we have shed light on significant perspectives of Romania’s forest dynamics.
For policymakers and environmental planners, the significant and negative ECT underscores the importance of considering how economic growth, urbanization, FDI, and renewable energy consumption not only influence forest area growth in the immediate term, but also how they are likely to bring about adjustments that align with long-term environmental sustainability goals.
Our findings underscore the fact that GDP has a positive and statistically significant effect on FAG, indicating that a 1% increase in GDP results in a 13.24% increase in FAG. This suggests that economic growth can bolster environmental awareness and provide resources for investment in sustainable forestry practices. Additionally, we observed that RENC does not significantly influence FAG in the long term, and the relationship between renewable energy consumption and forest area growth is more indirect. URB has a significant negative impact on FAG in the long term, indicating a substantial decline in forest areas due to urbanization. Similarly, FDI also has a significant negative effect on FAG in the long term.
Short-term analysis reveals that urbanization has an immediate significant negative effect on FAG, while positive effects emerge later, suggesting a complex and evolving relationship between urbanization and forest area growth.
Like any study, potential limitations of our research need to be acknowledged. Firstly, our study focuses on Romania, which may limit the generalizability of the conclusions to other regions or countries with different socio-economic and environmental contexts. Additionally, our study primarily employs quantitative methods, which may not fully capture the complexity of the relationships between economic development, renewable energy use, and deforestation trends. Qualitative research methods could provide additional insights into the underlying mechanisms driving these relationships. Furthermore, while our study considers various factors influencing deforestation, there may be other unexplored variables that could also play significant roles. Addressing these limitations could enhance the robustness and applicability of future research in this field.
By integrating modern technology, strengthening enforcement measures and providing economic incentives, Romania can effectively address the challenges of illegal activities and climate changes, while capitalizing on opportunities for sustainable forest management. Remote sensing technology and geographic information systems (GISs) could be employed to monitor forest cover changes in real time. Satellite imagery can detect deforestation, forest degradation, and land use with high precision, enabling quick response to illegal logging activities. The cultivation of tree species that can withstand changing environmental conditions should be encouraged, thereby increasing forests’ ability to cope with climate change. Initiatives aimed at restoring degraded forest areas and improving biodiversity should be launched. Forestry practices like selective logging, preserving forest cover and protecting essential habitat should be implemented. Blockchain technology should be used to create transparent and tamper-proof records of timber harvests and transactions. This can help trace the origin of timber and ensure that it is legally sourced. Payments for ecosystem services (PES) schemes should be implemented to provide financial incentives to landowners and communities for maintaining and protecting forest ecosystems. The legal framework for forest protection should be strengthened, ensuring strict penalties for illegal activities.
Thus, regarding the three research questions established in the introduction of our study, we can conclude the following aspects. Regarding the link between Romania’s economic development and forest area expansion (RQ1), our results indicate a significant connection between Romania’s economic development and forest area expansion. As observed in our analysis, an increase in GDP has a positive and statistically significant effect on forest area growth. This suggests that economic growth may be associated with greater environmental awareness and may provide additional resources for investments in forest conservation and expansion. Concerning the second research question (RQ2), our analysis shows that the use of electricity from renewable sources does not significantly influence deforestation trends in Romania in the long term. Although renewable energy may contribute to reducing greenhouse gas emissions and protecting the environment overall, it does not appear to have a direct effect on the deforestation rate in our country. Finally, regarding the third research question (RQ3), based on our results, we observed that the ecological halo hypothesis for foreign direct investments in Romania is not fully verified. We found that foreign direct investments have a significant and negative effect on forest area expansion in our country over the long term. This suggests that, despite the potential economic benefits of foreign investments, they may have an adverse impact on the environment and contribute to deforestation.
Regarding the recommendations and future research directions, based on the findings of our study, our suggestions focus on a more detailed evaluation of the relationship between economic development and forest conservation and a thorough exploration of the impact of renewable energy on forests, as well as the analysis of complex interactions between environmental and socio-economic factors. While we have identified a significant link between GDP growth and forest area expansion in Romania, it is important to further investigate this relationship. Future studies could examine how different economic sectors and government policies influence forest management and propose specific strategies to promote sustainable economic development in line with environmental conservation. Additionally, although we did not identify a direct effect of renewable energy usage on deforestation rates in Romania, it would be beneficial to further investigate this relationship. Subsequent research could explore how policies and investments in renewable energy might influence land use practices and forest management in the context of climate change and environmental objectives. For a more comprehensive understanding of forest dynamics and the factors influencing them, it is important to analyze the complex interactions between environmental and socio-economic factors. Future studies could employ interdisciplinary approaches to explore how economic, social, and environmental changes interact and to identify the most effective forest conservation strategies in the context of a rapidly changing environment.

Author Contributions

Conceptualization, I.G. and I.N.; methodology, I.G. and I.N.; software, I.G. and I.N.; validation, I.G. and I.N.; formal analysis, I.G.; investigation, I.G. and I.N.; resources, I.G.; data curation, I.N.; writing—original draft preparation, I.G.; writing—review and editing, I.N.; visualization, I.G. and I.N.; supervision, I.G. and I.N.; project administration, I.G. and I.N. All authors have read and agreed to the published version of the manuscript.

Funding

This research received no external funding.

Institutional Review Board Statement

Not applicable.

Informed Consent Statement

Not applicable.

Data Availability Statement

Data are available upon request.

Acknowledgments

We express our gratitude to OpenAI for providing ChatGPT-4, which was used to translate some concepts from Romanian into English in this manuscript.

Conflicts of Interest

The authors declare no conflicts of interest.

List of Abbreviations

Full FormAcronym
FAForest Area
FAGForest Area Growth
RENCRenewable Energy Consumption
GDPGross Domestic Product
FDIForeign Direct Investments
URBUrbanization
ARDLAutoregressive Distributed Lag
EGEngle–Granger Test
JJohansen Test
BABanerjee Test
BOBoswijk Test
ADFAugmented Dickey–Fuller Test
VARVector Autoregressive
LogLLog Likelihood
LRLikelihood Ratio
FPEFinal Prediction Error
AICAkaike Information Criterion
SCSchwarz Criterion
HQHannan–Quinn Criterion
ECMError Correction Model
FMOLSFully Modified Ordinary Least Squares
DOLSDynamic Ordinary Least Squares
CCRCanonical Cointegrating Regression
ECTError Correction Term

References

  1. Cheval, S.; Bulai, A.; Croitoru, A.-E.; Dorondel, Ș.; Micu, D.; Mihăilă, D.; Sfîcă, L.; Tișcovschi, A. Climate Change Perception in Romania. Theor. Appl. Clim. 2022, 149, 253–272. [Google Scholar] [CrossRef] [PubMed]
  2. Petrescu-Mag, R.M.; Burny, P.; Banatean-Dunea, I.; Petrescu, D.C. How Climate Change Science Is Reflected in People’s Minds. A Cross-Country Study on People’s Perceptions of Climate Change. IJERPH 2022, 19, 4280. [Google Scholar] [CrossRef] [PubMed]
  3. Vlăduțescu, Ș.; Stănescu, G.C. Environmental Sustainability of Metaverse: Perspectives from Romanian Developers. Sustainability 2023, 15, 11704. [Google Scholar] [CrossRef]
  4. Kumar, R.; Kumar, A.; Saikia, P. Deforestation and Forests Degradation Impacts on the Environment. In Environmental Degradation: Challenges and Strategies for Mitigation; Singh, V.P., Yadav, S., Yadav, K.K., Yadava, R.N., Eds.; Water Science and Technology Library; Springer International Publishing: Cham, Switzerland, 2022; Volume 104, pp. 19–46. ISBN 978-3-030-95541-0. [Google Scholar]
  5. Prochazka, P.; Abrham, J.; Cerveny, J.; Kobera, L.; Sanova, P.; Benes, D.; Fink, J.-M.; Jiraskova, E.; Primasova, S.; Soukupova, J.; et al. Understanding the Socio-Economic Causes of Deforestation: A Global Perspective. Front. For. Glob. Chang. 2023, 6, 1288365. [Google Scholar] [CrossRef]
  6. Rădulescu, C.V.; Bran, F.; Ciuvăț, A.L.; Bodislav, D.A.; Buzoianu, O.C.; Ștefănescu, M.; Burlacu, S. Decoupling the Economic Development from Resource Consumption: Implications and Challenges in Assessing the Evolution of Forest Area in Romania. Land 2022, 11, 1097. [Google Scholar] [CrossRef]
  7. European Environment Agency. Romania Country Briefing-the European Environment. Available online: https://www.eea.europa.eu/soer/2015/countries/romania (accessed on 28 April 2024).
  8. Global Forest Watch. Available online: https://www.globalforestwatch.org/dashboards/country/ROU/?category=climate&location=WyJjb3VudHJ5IiwiUk9VIl0%3D (accessed on 27 April 2024).
  9. World Bank Distribution of Land Area in Romania Covered by Forest from 2006 to 2021 [Graph]. In Statista 2024. Available online: https://www.statista.com/statistics/435973/forest-area-as-percentage-of-land-area-romania/ (accessed on 28 April 2024).
  10. Hänggli, A.; Levy, S.A.; Armenteras, D.; Bovolo, C.I.; Brandão, J.; Rueda, X.; Garrett, R.D. A Systematic Comparison of Deforestation Drivers and Policy Effectiveness across the Amazon Biome. Environ. Res. Lett. 2023, 18, 073001. [Google Scholar] [CrossRef]
  11. Tanveer, A.; Song, H.; Faheem, M.; Daud, A. Caring for the Environment. How Do Deforestation, Agricultural Land, and Urbanization Degrade the Environment? Fresh Insight through the ARDL Approach. Env. Dev. Sustain. 2024. [Google Scholar] [CrossRef]
  12. Georgescu, I.; Kinnunen, J.; Nica, I. Assessing Forest Conservation for Finland: An ARDL-Based Evaluation. Sustainability 2024, 16, 612. [Google Scholar] [CrossRef]
  13. Kinnunen, J.; Georgescu, I.; Nica, I. Evaluating the Environmental Phillips Curve Hypothesis in the STIRPAT Framework for Finland. Sustainability 2024, 16, 4381. [Google Scholar] [CrossRef]
  14. Georgescu, I.; Kinnunen, J. Effects of FDI, GDP and Energy Use on Ecological Footprint in Finland: An ARDL Approach. World Dev. Sustain. 2024, 4, 100157. [Google Scholar] [CrossRef]
  15. Georgescu, I.A.; Oprea, S.-V.; Bâra, A. Investigating the Relationship between Macroeconomic Indicators, Renewables and Pollution across Diverse Regions in the Globalization Era. Appl. Energy 2024, 363, 123077. [Google Scholar] [CrossRef]
  16. Bâra, A.; Oprea, S.-V. What Makes Electricity Consumers Change Their Behavior? Influence of Attitude and Perceived Impact of DR Programs on Awareness. In Kybernetes; Emerald Publishing Limited: Bingley, UK, 2023. [Google Scholar] [CrossRef]
  17. Oprea, S.-V.; Bara, A. Machine Learning Algorithms for Short-Term Load Forecast in Residential Buildings Using Smart Meters, Sensors and Big Data Solutions. IEEE Access 2019, 7, 177874–177889. [Google Scholar] [CrossRef]
  18. Oprea, S.-V.; Bâra, A. Edge and Fog Computing Using IoT for Direct Load Optimization and Control with Flexibility Services for Citizen Energy Communities. Knowl.-Based Syst. 2021, 228, 107293. [Google Scholar] [CrossRef]
  19. Nica, I.; Chiriță, N.; Delcea, C. Towards a Sustainable Future: Economic Cybernetics in Analyzing Romania’s Circular Economy. Sustainability 2023, 15, 14433. [Google Scholar] [CrossRef]
  20. Chiriță, N.; Georgescu, I. Cybernetics Analysis of the Circular Economy from Romania. In Proceedings of the 22nd International Conference on Informatics in Economy (IE 2023), Bucharest, Romania,25–26 May 2023; Ciurea, C., Pocatilu, P., Filip, F.G., Eds.; Smart Innovation, Systems and Technologies; Springer Nature Singapore: Singapore, 2024; Volume 367, pp. 319–330. ISBN 978-981-9969-59-3. [Google Scholar]
  21. de Silva, F.A.; Simioni, F.J.; Hoff, D.N. Diagnosis of Circular Economy in the Forest Sector in Southern Brazil. Sci. Total Environ. 2020, 706, 135973. [Google Scholar] [CrossRef] [PubMed]
  22. Androniceanu, A.; Georgescu, I.; Nica, I.; Chiriță, N. A Comprehensive Analysis of Renewable Energy Based on Integrating Economic Cybernetics and the Autoregressive Distributed Lag Model—The Case of Romania. Energies 2023, 16, 5978. [Google Scholar] [CrossRef]
  23. Grossman, G.; Krueger, A. Environmental Impacts of a North American Free Trade Agreement; National Bureau of Economic Research: Cambridge, MA, USA, 1991; p. w3914. [Google Scholar]
  24. Crespo Cuaresma, J.; Heger, M. Deforestation and Economic Development: Evidence from National Borders. Land. Use Policy 2019, 84, e347–e353. [Google Scholar] [CrossRef]
  25. Nguyen, C.P.; Nguyen, B.Q. Environmental Foe or Friend: The Influence of the Shadow Economy on Forest Land. Land. Use Policy 2023, 124, 106456. [Google Scholar] [CrossRef]
  26. Pablo-Romero, M.P.; Sánchez-Braza, A.; Gil-Pérez, J. Is Deforestation Needed for Growth? Testing the EKC Hypothesis for Latin America. For. Policy Econ. 2023, 148, 102915. [Google Scholar] [CrossRef]
  27. Gill, A.R.; Viswanathan, K.K.; Hassan, S. A Test of Environmental Kuznets Curve (EKC) for Carbon Emission and Potential of Renewable Energy to Reduce Green House Gases (GHG) in Malaysia. Env. Dev. Sustain. 2018, 20, 1103–1114. [Google Scholar] [CrossRef]
  28. Yin, J.; Zheng, M.; Chen, J. The Effects of Environmental Regulation and Technical Progress on CO2 Kuznets Curve: An Evidence from China. Energy Policy 2015, 77, 97–108. [Google Scholar] [CrossRef]
  29. Katircioğlu, S.; Katircioğlu, S. Testing the Role of Urban Development in the Conventional Environmental Kuznets Curve: Evidence from Turkey. Appl. Econ. Lett. 2018, 25, 741–746. [Google Scholar] [CrossRef]
  30. Ajanaku, B.A.; Collins, A.R. Economic Growth and Deforestation in African Countries: Is the Environmental Kuznets Curve Hypothesis Applicable? For. Policy Econ. 2021, 129, 102488. [Google Scholar] [CrossRef]
  31. Caravaggio, N. A Global Empirical Re-Assessment of the Environmental Kuznets Curve for Deforestation. For. Policy Econ. 2020, 119, 102282. [Google Scholar] [CrossRef]
  32. Tanner, A.M.; Johnston, A.L. The Impact of Rural Electric Access on Deforestation Rates. World Dev. 2017, 94, 174–185. [Google Scholar] [CrossRef]
  33. Ponce, P.; Del Río-Rama, M.D.L.C.; Álvarez-García, J.; Oliveira, C. Forest Conservation and Renewable Energy Consumption: An ARDL Approach. Forests 2021, 12, 255. [Google Scholar] [CrossRef]
  34. Wassie, Y.T.; Adaramola, M.S. Potential Environmental Impacts of Small-Scale Renewable Energy Technologies in East Africa: A Systematic Review of the Evidence. Renew. Sustain. Energy Rev. 2019, 111, 377–391. [Google Scholar] [CrossRef]
  35. Nazir, M.S.; Bilal, M.; Sohail, H.M.; Liu, B.; Chen, W.; Iqbal, H.M.N. Impacts of Renewable Energy Atlas: Reaping the Benefits of Renewables and Biodiversity Threats. Int. J. Hydrogen Energy 2020, 45, 22113–22124. [Google Scholar] [CrossRef]
  36. Ehrhardt-Martinez, K. Social Determinants of Deforestation in Developing Countries: A Cross-National Study. Soc. Forces 1998, 77, 567. [Google Scholar] [CrossRef]
  37. Bhattarai, M.; Hammig, M. Institutions and the Environmental Kuznets Curve for Deforestation: A Crosscountry Analysis for Latin America, Africa and Asia. World Dev. 2001, 29, 995–1010. [Google Scholar] [CrossRef]
  38. Nathaniel, S.P.; Bekun, F.V. Environmental Management amidst Energy Use, Urbanization, Trade Openness, and Deforestation: The Nigerian Experience. J. Public Aff. 2020, 20, e2037. [Google Scholar] [CrossRef]
  39. Yameogo, C.E.W. Globalization, Urbanization, and Deforestation Linkage in Burkina Faso. Env. Sci. Pollut. Res. 2021, 28, 22011–22021. [Google Scholar] [CrossRef] [PubMed]
  40. Neumayer, E. Do Democracies Exhibit Stronger International Environmental Commitment? A Cross-Country Analysis. J. Peace Res. 2002, 39, 139–164. [Google Scholar] [CrossRef]
  41. Didia, D.O. Democracy, Political Instability and Tropical Deforestation. Glob. Environ. Change 1997, 7, 63–76. [Google Scholar] [CrossRef]
  42. Shandra, J.M.; Esparza, L.E.; London, B. Nongovernmental Organizations, Democracy, and Deforestation: A Cross-National Analysis. Soc. Nat. Resour. 2012, 25, 251–269. [Google Scholar] [CrossRef]
  43. Cary, M.; Bekun, F.V. Democracy and Deforestation: The Role of Spillover Effects. For. Policy Econ. 2021, 125, 102398. [Google Scholar] [CrossRef]
  44. Acheampong, A.O.; Opoku, E.E.O. Energy Justice, Democracy and Deforestation. J. Environ. Manag. 2023, 341, 118012. [Google Scholar] [CrossRef]
  45. Wehkamp, J.; Koch, N.; Lübbers, S.; Fuss, S. Governance and Deforestation—A Meta-Analysis in Economics. Ecol. Econ. 2018, 144, 214–227. [Google Scholar] [CrossRef]
  46. Barbier, E.B.; Tesfaw, A. Explaining Forest Transitions: The Role of Governance. Ecol. Econ. 2015, 119, 252–261. [Google Scholar] [CrossRef]
  47. Akinsorotan, O.A.; Olaniyi, O.E.; Adeyemi, A.A.; Olasunkanmi, A.H. Corona Virus Pandemic: Implication on Biodiversity Conservation. Front. Water 2021, 3, 635529. [Google Scholar] [CrossRef]
  48. Bhandari, M.S.; Pandey, S.; Dabral, A.; Meena, R.K.; Kant, R. Global Forestry Perspective: COVID-19 Impact and Assessment. Natl. Acad. Sci. Lett. 2021, 44, 571–574. [Google Scholar] [CrossRef] [PubMed]
  49. Bista, R.; Parajuli, R.; Giri, K.; Karki, R.; Song, C. Impacts of COVID-19 Pandemic on the Livelihoods of Rural Households in the Community Forestry Landscape in the Middle Hills of Nepal. Trees For. People 2022, 9, 100312. [Google Scholar] [CrossRef] [PubMed]
  50. Singhal, V.; Jinger, D.; Rathore, A.C.; Pal, R.; Samal, I.; Bhoi, T.K.; Paramesh, V.; Fahad, S.; Jaremko, L.; Abdelsalam, N.R.; et al. COVID-19, Deforestation, and Green Economy. Front. For. Glob. Chang. 2024, 6, 1305779. [Google Scholar] [CrossRef]
  51. Antonarakis, A.S.; Pacca, L.; Antoniades, A. The Effect of Financial Crises on Deforestation: A Global and Regional Panel Data Analysis. Sustain. Sci. 2022, 17, 1037–1057. [Google Scholar] [CrossRef] [PubMed]
  52. Vale, M.M.; Berenguer, E.; Argollo De Menezes, M.; Viveiros De Castro, E.B.; Pugliese De Siqueira, L.; Portela, R.D.C.Q. The COVID-19 Pandemic as an Opportunity to Weaken Environmental Protection in Brazil. Biol. Conserv. 2021, 255, 108994. [Google Scholar] [CrossRef] [PubMed]
  53. Rahman, M.S.; Alam, M.A.; Salekin, S.; Belal, M.A.H.; Rahman, M.S. The COVID-19 Pandemic: A Threat to Forest and Wildlife Conservation in Bangladesh? Trees For. People 2021, 5, 100119. [Google Scholar] [CrossRef]
  54. Wunder, S.; Kaimowitz, D.; Jensen, S.; Feder, S. Coronavirus, Macroeconomy, and Forests: What Likely Impacts? For. Policy Econ. 2021, 131, 102536. [Google Scholar] [CrossRef] [PubMed]
  55. Muche, M.; Yemata, G.; Molla, E.; Muasya, A.M.; Tsegay, B.A. COVID-19 Lockdown and Natural Resources: A Global Assessment on the Challenges, Opportunities, and the Way Forward. Bull. Natl. Res. Cent. 2022, 46, 20. [Google Scholar] [CrossRef]
  56. Chandra, W. Translated by Hans Nicholas Jong Illegal Loggers Use Pandemic as Cover to Ramp up Activity in Sulawesi Mongabay Series. Available online: https://news.mongabay.com/2021/05/illegal-loggers-use-pandemic-as-cover-to-ramp-up-activity-in-sulawesi/ (accessed on 28 May 2024).
  57. Eklund, J.; Jones, J.P.G.; Räsänen, M.; Geldmann, J.; Jokinen, A.-P.; Pellegrini, A.; Rakotobe, D.; Rakotonarivo, O.S.; Toivonen, T.; Balmford, A. Elevated Fires during COVID-19 Lockdown and the Vulnerability of Protected Areas. Nat. Sustain. 2022, 5, 603–609. [Google Scholar] [CrossRef]
  58. Berčák, R.; Holuša, J.; Kaczmarowski, J.; Tyburski, Ł.; Szczygieł, R.; Held, A.; Vacik, H.; Slivinský, J.; Chromek, I. Fire Protection Principles and Recommendations in Disturbed Forest Areas in Central Europe: A Review. Fire 2023, 6, 310. [Google Scholar] [CrossRef]
  59. Lo Cascio, E. 2 Urbanization as a Proxy of Demographic and Economic Growth. In Quantifying the Roman Economy; Bowman, A., Wilson, A., Eds.; Oxford University Press: Oxford, UK, 2009; pp. 87–106. ISBN 978-0-19-956259-6. [Google Scholar]
  60. Mahtta, R.; Fragkias, M.; Güneralp, B.; Mahendra, A.; Reba, M.; Wentz, E.A.; Seto, K.C. Urban Land Expansion: The Role of Population and Economic Growth for 300+ Cities. npj Urban. Sustain. 2022, 2, 5. [Google Scholar] [CrossRef]
  61. Murshed, M.; Ferdaus, J.; Rashid, S.; Tanha, M.M.; Islam, M.J. The Environmental Kuznets Curve Hypothesis for Deforestation in Bangladesh: An ARDL Analysis with Multiple Structural Breaks. Energ. Ecol. Environ. 2021, 6, 111–132. [Google Scholar] [CrossRef]
  62. Lütkepohl, H.; Xu, F. The Role of the Log Transformation in Forecasting Economic Variables. Empir. Econ. 2012, 42, 619–638. [Google Scholar] [CrossRef]
  63. Bayer, C.; Hanck, C. Combining Non-cointegration Tests. J. Time Ser. Anal. 2013, 34, 83–95. [Google Scholar] [CrossRef]
  64. Engle, R.F.; Granger, C.W.J. Co-Integration and Error Correction: Representation, Estimation, and Testing. Econometrica 1987, 55, 251. [Google Scholar] [CrossRef]
  65. Johansen, S. Statistical Analysis of Cointegration Vectors. J. Econ. Dyn. Control 1988, 12, 231–254. [Google Scholar] [CrossRef]
  66. Peter Boswijk, H. Testing for an Unstable Root in Conditional and Structural Error Correction Models. J. Econom. 1994, 63, 37–60. [Google Scholar] [CrossRef]
  67. Banerjee, A.; Dolado, J.; Mestre, R. Error-correction Mechanism Tests for Cointegration in a Single-equation Framework. J. Time Ser. Anal. 1998, 19, 267–283. [Google Scholar] [CrossRef]
  68. Pesaran, M.H.; Shin, Y.; Smith, R.J. Bounds Testing Approaches to the Analysis of Level Relationships. J. Appl. Econom. 2001, 16, 289–326. [Google Scholar] [CrossRef]
  69. Johansen, S.; Juselius, K. Maximum Likelihood Estimation and Inference on Cointegration—With applications to The DEMAND for Money. Oxf. Bull. Econ. Stat. 1990, 52, 169–210. [Google Scholar] [CrossRef]
  70. Samargandi, N.; Fidrmuc, J.; Ghosh, S. Is the Relationship between Financial Development and Economic Growth Monotonic? Evidence from a Sample of Middle-Income Countries. World Dev. 2015, 68, 66–81. [Google Scholar] [CrossRef]
  71. Phillips, P.C.B.; Hansen, B.E. Statistical Inference in Instrumental Variables Regression with I(1) Processes. Rev. Econ. Stud. 1990, 57, 99. [Google Scholar] [CrossRef]
  72. Stock, J.H.; Watson, M.W. A Simple Estimator of Cointegrating Vectors in Higher Order Integrated Systems. Econometrica 1993, 61, 783. [Google Scholar] [CrossRef]
  73. Park, J.Y. Canonical Cointegrating Regressions. Econometrica 1992, 60, 119. [Google Scholar] [CrossRef]
  74. Brown, R.L.; Durbin, J.; Evans, J.M. Techniques for Testing the Constancy of Regression Relationships Over Time. J. R. Stat. Soc. Ser. B Stat. Methodol. 1975, 37, 149–163. [Google Scholar] [CrossRef]
  75. Pesaran, M.H.; Shin, Y. An Autoregressive Distributed-Lag Modelling Approach to Cointegration Analysis. In Econometrics and Economic Theory in the 20th Century: The Ragnar Frisch Centennial Symposium; Strøm, S., Ed.; Cambridge University Press: New York, NY, USA, 1998; pp. 371–413. ISBN 978-0-521-63323-9. [Google Scholar]
  76. Map of Cut Forests in Romania. Available online: https://panorama.ro/harta-paduri-taiate-romania/ (accessed on 27 April 2024).
  77. Scarlat, E.; Nica, I. Bazele Analizei Afacerii; Economică Publishing: Bucharest, Romania, 2022; ISBN 978-606-0-93011-2. [Google Scholar]
  78. ASFOR. Available online: https://asfor.ro/2023/07/02/noul-regulament-european-privind-produsele-asociate-cu-defrisarile-si-degradarea-padurilor-o-noua-provocare-pentru-sectorul-forestier-romanesc/ (accessed on 27 April 2024).
  79. EUR-Lex REGULATION (EU) 2023/1115 of the European Parliament and of the Council of 31 May 2023 on the Making Available on the Union Market and the Export from the Union of Certain Commodities and Products Associated with Deforestation and Forest Degradation and Repealing Regulation (EU) No 995/2010. Available online: https://eur-lex.europa.eu/legal-content/RO/TXT/?uri=CELEX:32023R1115 (accessed on 27 April 2024).
  80. European Commission. Biodiversity Strategy for 2030. Available online: https://environment.ec.europa.eu/strategy/biodiversity-strategy-2030_en (accessed on 27 April 2024).
  81. Euroactiv. Romania’s Forests–Source of Biodiversity, Resource for ‘Wood Mafia’. Available online: https://www.euractiv.com/section/energy-environment/news/romanias-forests-source-of-biodiversity-resource-for-wood-mafia/ (accessed on 27 April 2024).
  82. Euronews Illegal Cutting of Forests in Romania, an Alarming Problem. Available online: https://www.euronews.ro/articole/taierile-ilegale-de-paduri-in-romania (accessed on 27 April 2024).
  83. Malek, Ž.; Zumpano, V.; Hussin, H. Forest Management and Future Changes to Ecosystem Services in the Romanian Carpathians. Env. Dev. Sustain. 2018, 20, 1275–1291. [Google Scholar] [CrossRef]
  84. Romanian-American Foundation. Development of Ecotourism Destinations. Available online: https://rafonline.org/en/program/development-of-ecotourism-destinations/# (accessed on 27 April 2024).
  85. Omdena. News from Romania: We Did a Groundbreaking App That Lets Us Together Protect a Country from Illegal Trees Cutting. Available online: https://www.omdena.com/blog/forest-guard-project-ai-powered-app-combating-illegal-deforestation-in-romania (accessed on 27 April 2024).
  86. Mihai, G.; Alexandru, A.-M.; Nita, I.-A.; Birsan, M.-V. Climate Change in the Provenance Regions of Romania over the Last 70 Years: Implications for Forest Management. Forests 2022, 13, 1203. [Google Scholar] [CrossRef]
  87. Dickey, D.A.; Fuller, W.A. Distribution of the Estimators for Autoregressive Time Series with a Unit Root. J. Am. Stat. Assoc. 1979, 74, 427. [Google Scholar] [CrossRef]
  88. Vogelsang, T.J.; Perron, P. Additional Tests for a Unit Root Allowing for a Break in the Trend Function at an Unknown Time. Int. Econ. Rev. 1998, 39, 1073. [Google Scholar] [CrossRef]
  89. Dogan, E.; Ozturk, I. The Influence of Renewable and Non-Renewable Energy Consumption and Real Income on CO2 Emissions in the USA: Evidence from Structural Break Tests. Env. Sci. Pollut. Res. 2017, 24, 10846–10854. [Google Scholar] [CrossRef] [PubMed]
  90. Wu, X.; Liu, G.; Bao, Q. Impact of Economic Growth on the Changes in Forest Resources in Inner Mongolia of China. Front. Environ. Sci. 2023, 11, 1241703. [Google Scholar] [CrossRef]
  91. Lin, Y.; Qiu, R.; Yao, J.; Hu, X.; Lin, J. The Effects of Urbanization on China’s Forest Loss from 2000 to 2012: Evidence from a Panel Analysis. J. Clean. Prod. 2019, 214, 270–278. [Google Scholar] [CrossRef]
  92. Hou, F.; Li, X.; Wu, C.; Yin, Y.; Xiao, H. The Impact of Foreign Direct Investment on the Forestry Industry Structure Upgrading: The Moderating Effect on Labor Migration. IJERPH 2023, 20, 2621. [Google Scholar] [CrossRef]
  93. Doytch, N.; Ashraf, A.; Nguyen, C.P. Foreign Direct Investment and Forest Land: A Sectoral Investigation. Environ. Sustain. Indic. 2024, 22, 100353. [Google Scholar] [CrossRef]
  94. Börjesson, P.; Hansson, J.; Berndes, G. Future Demand for Forest-Based Biomass for Energy Purposes in Sweden. For. Ecol. Manag. 2017, 383, 17–26. [Google Scholar] [CrossRef]
  95. Březina, D.; Michal, J.; Hlaváčková, P. The Impact of Natural Disturbances on the Central European Timber Market—An Analytical Study. Forests 2024, 15, 592. [Google Scholar] [CrossRef]
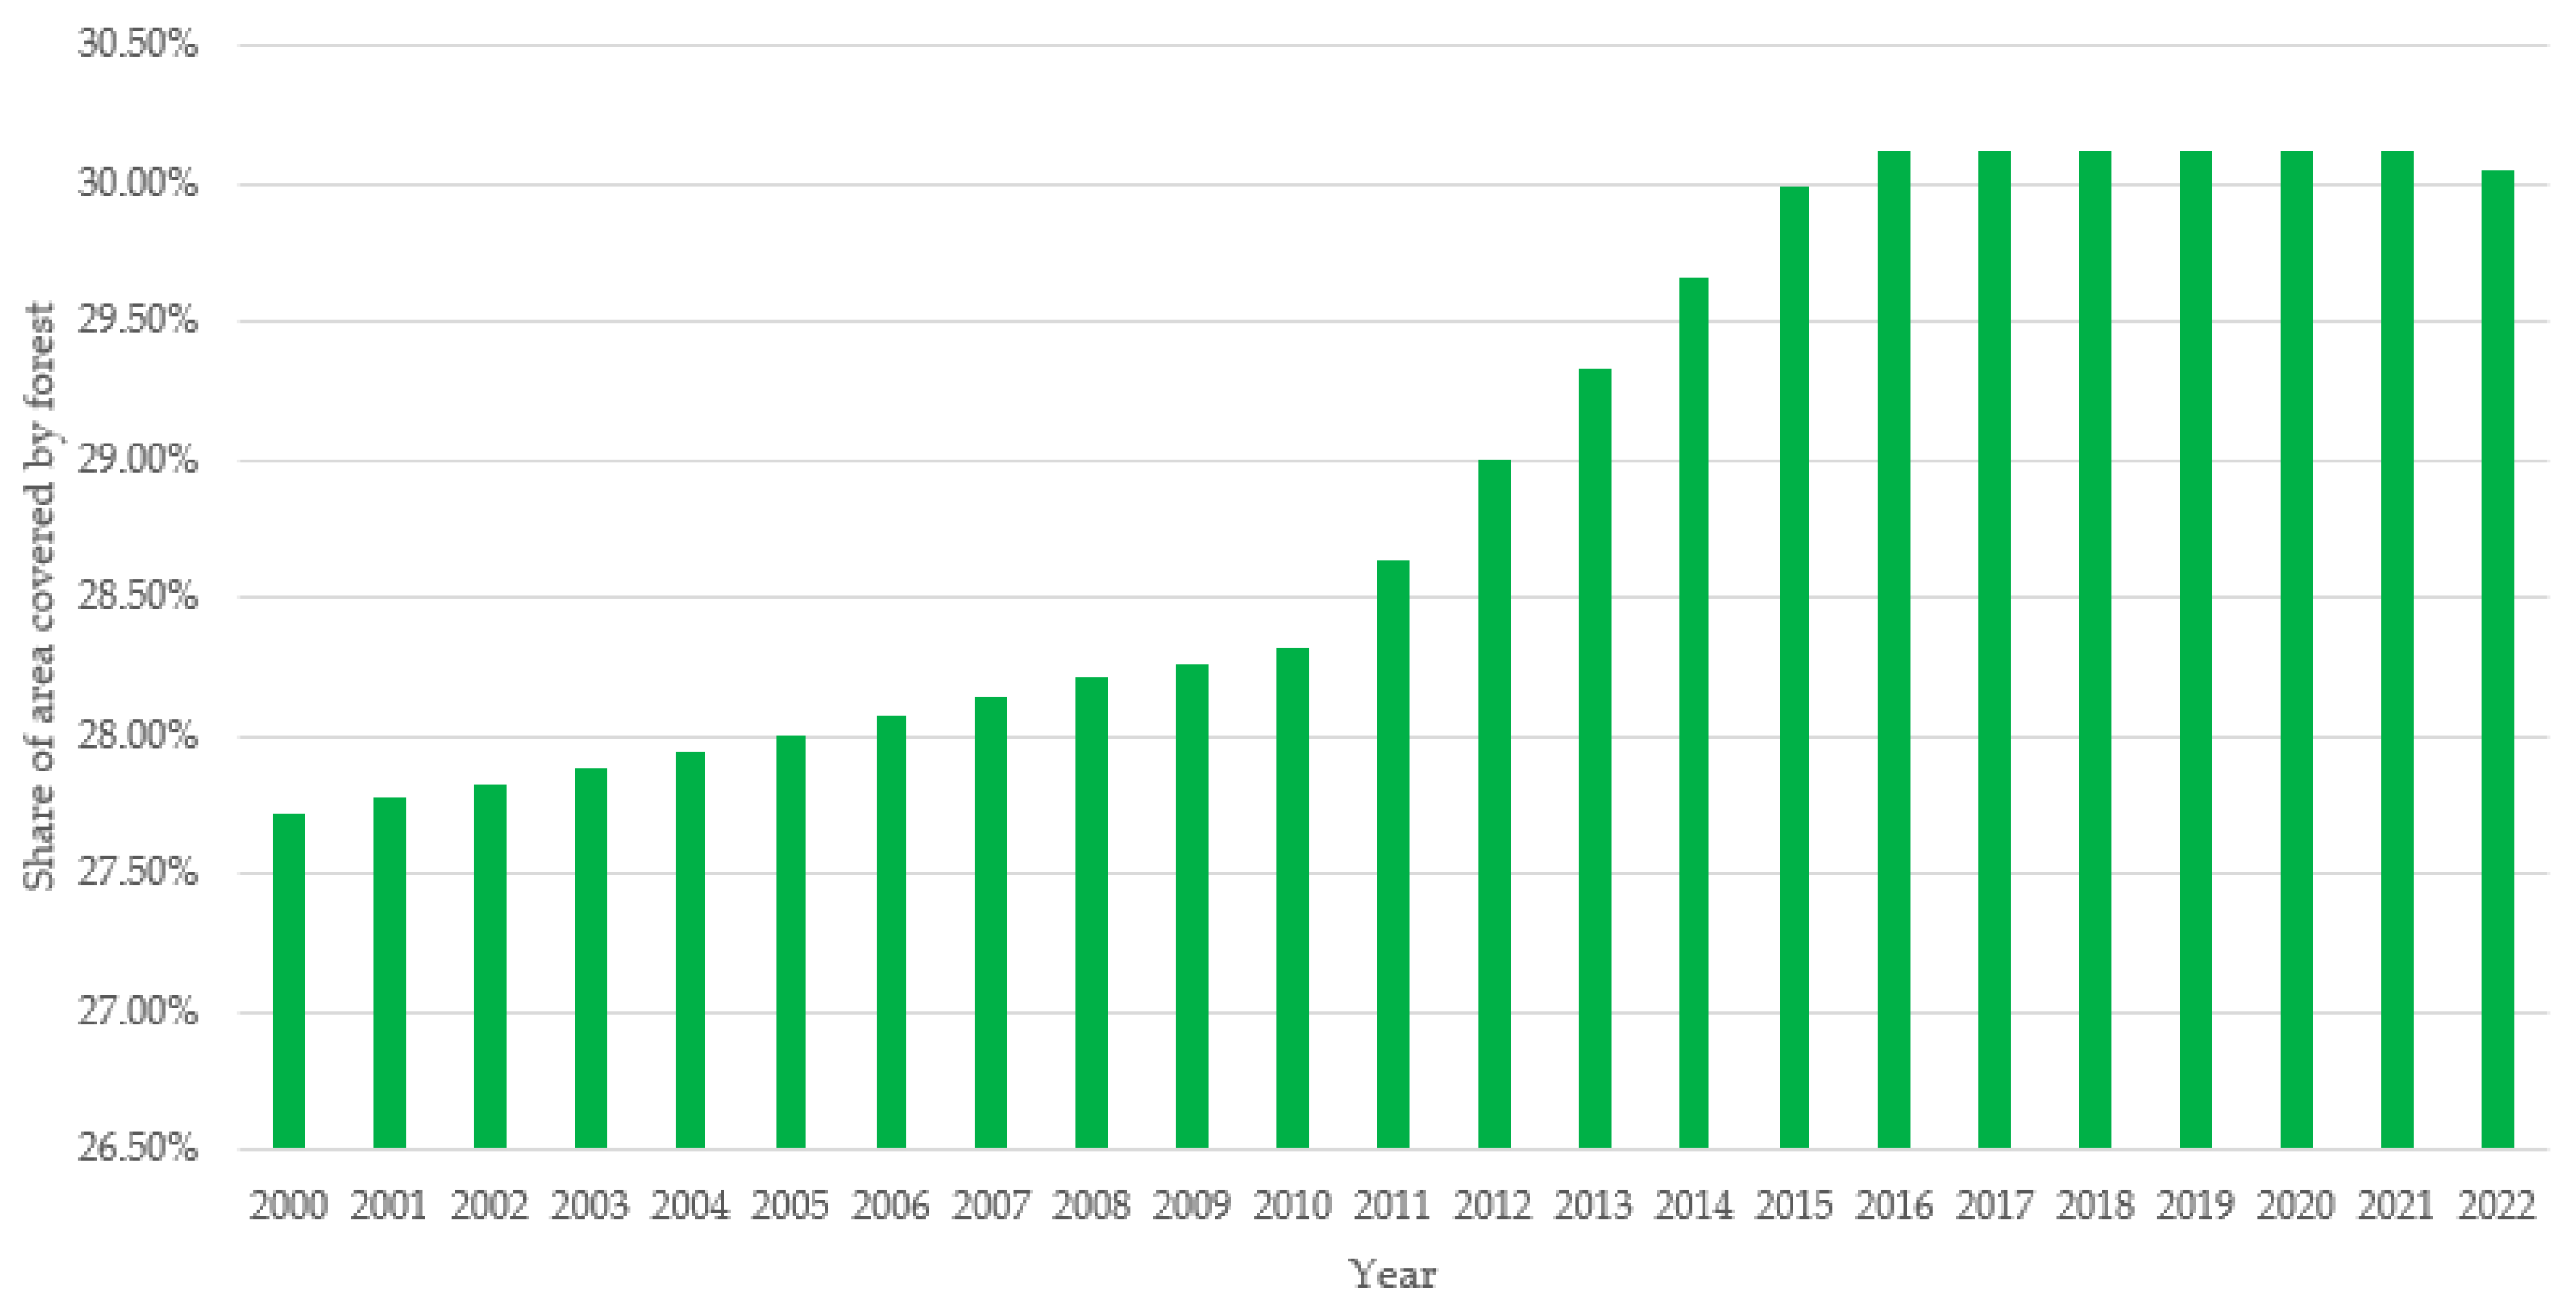
Figure 1. Coverage of Romania’s land area by forests from 2000 to 2022 according to [9].
Sustainability 16 05297 g001
Figure 2. Forest cover loss in Romania (a) and gross CO 2 equivalent emissions (b), according to [8].
Sustainability 16 05297 g002
Figure 3. Yearly tree cover reduction by primary cause in Romania, according to [8].
Sustainability 16 05297 g003
Figure 4. PESTELE analysis of deforestation in Romania.
Sustainability 16 05297 g004
Figure 5. SWOT analysis of deforestation in Romania.
Sustainability 16 05297 g005
Figure 6. The evolution of FAG, FDI, GDP, RENC and URB for Romania (1990–2022).
Sustainability 16 05297 g006
Figure 7. Plot of CUSUM for coefficients’ stability of ARDL model at 5% level of significance.
Sustainability 16 05297 g007
Figure 8. Plot of CUSUMSQ for coefficients’ stability of ARDL model at 5% level of significance.
Sustainability 16 05297 g008
Table 1. Variables specification.
VariableAcronymMeasurement UnitTimespanSource
Forest AreaFA% of land area1990–2022World Bank
Renewable Energy ConsumptionRENC% of total final energy consumption1990–2022World Bank
Gross Domestic ProductGDPConstant 2015 US$1990–2022World Bank
Foreign Direct InvestmentsFDI% of GDP1990–2022World Bank
UrbanizationURB%1990–2022World Bank
Table 2. Summary statistics.
LFAGLGDPLRENCLURBLFDI
Mean−1.798.772.783.980.76
Median−1.478.792.883.981.00
Maximum1.259.323.193.992.19
Minimum−7.058.301.603.96−1.97
Std. Dev.2.050.330.450.010.95
Skewness−0.550.09−1.29−0.56−1.03
Kurtosis2.731.543.642.024.12
Jarque–Bera1.602.698.932.806.98
Probability0.440.260.010.240.03
Table 3. ADF Unit Root Test Results.
VariableLevelFirst DifferenceOrder of Integration
T-StatisticsT-Statistics
FAG−1.18 (0.66)−9.98 *** (0.00)I (1)
GDP−0.78 (0.99)−4.46 *** (0.00)I (1)
RENC−4.70 *** (0.00)−4.33 *** (0.00)I (0)
URB−1.87 (0.34)−3.39 ** (0.01)I (1)
FDI−13.82 *** (0.00)−15.06 *** (0.00)I (0)
where **, and *** indicate the significance of variables at 5%, and 1% levels, respectively.
Table 4. Vogelsang and Perron Breakpoint Unit Root Test Results.
VariableT-StatisticsBreak YearOrder of Integration
LevelFirst DifferenceLevelFirst Difference
FAG−3.23 (0.54)−11.21 *** (0.00)19991995I (1)
GDP−1.97 (0.98)−4.54 ** (0.037)20001999I (1)
RENC−4.91 ** (0.01)−6.16 *** (0.00)20211998I (0)
URB−4.81 ** (0.01)−9.26 ** (0.01)20092004I (0)
FDI−15.75 *** (0.00)−15.42 *** (0.00)19972004I (0)
where **, *** indicate the significance of variables at 5%, and 1% levels, respectively.
Table 5. VAR Lag order selection criteria.
LagLogLLRFPEAICSCHQ
056.49N/A 1.52 × 10 8 −3.81−3.57−3.74
1193.10212.49 4.05 × 10 12 −12.08−10.64−11.65
2241.2757.09 * 9.00 × 10 13 −13.79−11.15 *−13.01
3278.5430.36 6.88 × 10 13 −14.70 *−10.86 *−13.56 *
where, the * denotes the lag order selected by the criterion. LR represents the sequential modified LR test statistic, with each test conducted at a 5% significance level. FPE indicates the final prediction error, while AIC represents the Akaike information criterion. SC stands for the Schwarz information criterion, and HQ represents the Hannan–Quinn information criterion.
Table 6. Bayer–Hanck cointegration test.
TestsEngle–Granger (EG)Johansen (J)Banerjee (BA)Boswijk (BO)
Test statistic−3.0080.14−2.2247.31
p-value0.570.000.610.00
EG-J56.385% critical value10.57
EG-J-BA-BO112.625% critical value20.14
Table 7. Results of ARDL cointegration bounds test.
Test StatisticValueK (Number of Regressors)
F-statistic5.814
Critical-value bounds
10%2.523.56
5%3.054.22
1%4.285.84
Table 8. Long-run estimated results.
VariablesCoefficientT-StatisticsProb.
GDP13.243.700.00 ***
RENC−1.47−0.730.48
URB−317.52−3.750.00 ***
FDI−1.38−2.990.01 **
C1151.803.690.00 ***
where, the **, and *** indicate the significance of variables at 5%, and 1% levels, respectively.
Table 9. ECM model for short-run estimated results.
VariablesCoefficientT-StatisticsProb.
D(FAG(-1))0.221.480.17
D(FAG((-2))0.292.520.03 **
D(GDP)7.243.130.01 ***
D(GDP(-1))−8.96−2.610.03 **
D(GDP(-2))−11.04−3.750.00 ***
D(RENC)−2.62−2.190.05 **
D(RENC(-1))3.863.460.00 ***
D(URB)−809.88−5.890.00 ***
D(URB(-1))323.062.480.03 **
D(URB(-2))216.263.230.01 ***
D(FDI)−0.32−1.380.20
D(FDI(-1))−0.662.010.07 *
D(FDI(-2))0.451.820.10 *
CointEq(-1)−1.54−7.530.00 ***
R-squared0.92
Adjusted R-squared0.85
where, the *, **, and *** indicate the significance of variables at 10%, 5%, and 1% levels, respectively.
Table 10. FMOLS, DOLS, and CCR long-term coefficients.
VariablesFMOLS
Coefficient, (T-Statistics), [p-Value]
DOLS
Coefficient, (T-Statistics), [p-Value]
CCR
Coefficient, (T-Statistics), [p-Value]
GDP7.04 (−8.84)
[0.00] ***
7.25 (6.72)
[0.00] ***
7.10 (7.78)
[0.00] ***
RENC0.30 (0.51)
[0.60]
0.05 (0.07)
[0.94]
0.33 (0.45)
[0.65]
URB−116.71 (−4.57)
[0.00] ***
−122.29 (−3.53)
[0.00] ***
−119.60 (−7.16)
[0.00] ***
FDI−0.73 (−3.22)
[0.00] ***
−0.75 (−2.43)
[0.02] **
−0.78 (−7.39)
[0.00] ***
C400.91 (4.10)
[0.00] ***
421.95 (3.19)
[0.00] ***
411.83 (6.55)
[0.00] ***
where, the **, and *** indicate the significance of variables at 5%, and 1% levels, respectively.
Table 11. Results of diagnostic and stability tests.
Diagnostic Test H 0 Decision
Statistics [p-Value]
χ 2 SERIALThere is no serial correlation in the residualsAccept H 0
0.85 [0.47]
χ 2 ARCHThere is no autoregressive conditional heteroscedasticityAccept H 0
0.08 [0.76]
χ 2 Jarque–BeraNormal distributionAccept H 0
0.29 [0.86]
χ 2 RamseyAbsence of model misspecificationAccept H 0
0.64 [0.54]
Disclaimer/Publisher’s Note: The statements, opinions and data contained in all publications are solely those of the individual author(s) and contributor(s) and not of MDPI and/or the editor(s). MDPI and/or the editor(s) disclaim responsibility for any injury to people or property resulting from any ideas, methods, instructions or products referred to in the content.