
Research on Coupling Coordination of Agricultural Carbon Emission Efficiency and Food Security in Hebei Province, China

 ,
,  ,
,  , and
, and
Abstract
1. Introduction
2. Study Area and Datasets
2.1. Study Area
2.2. Datasets
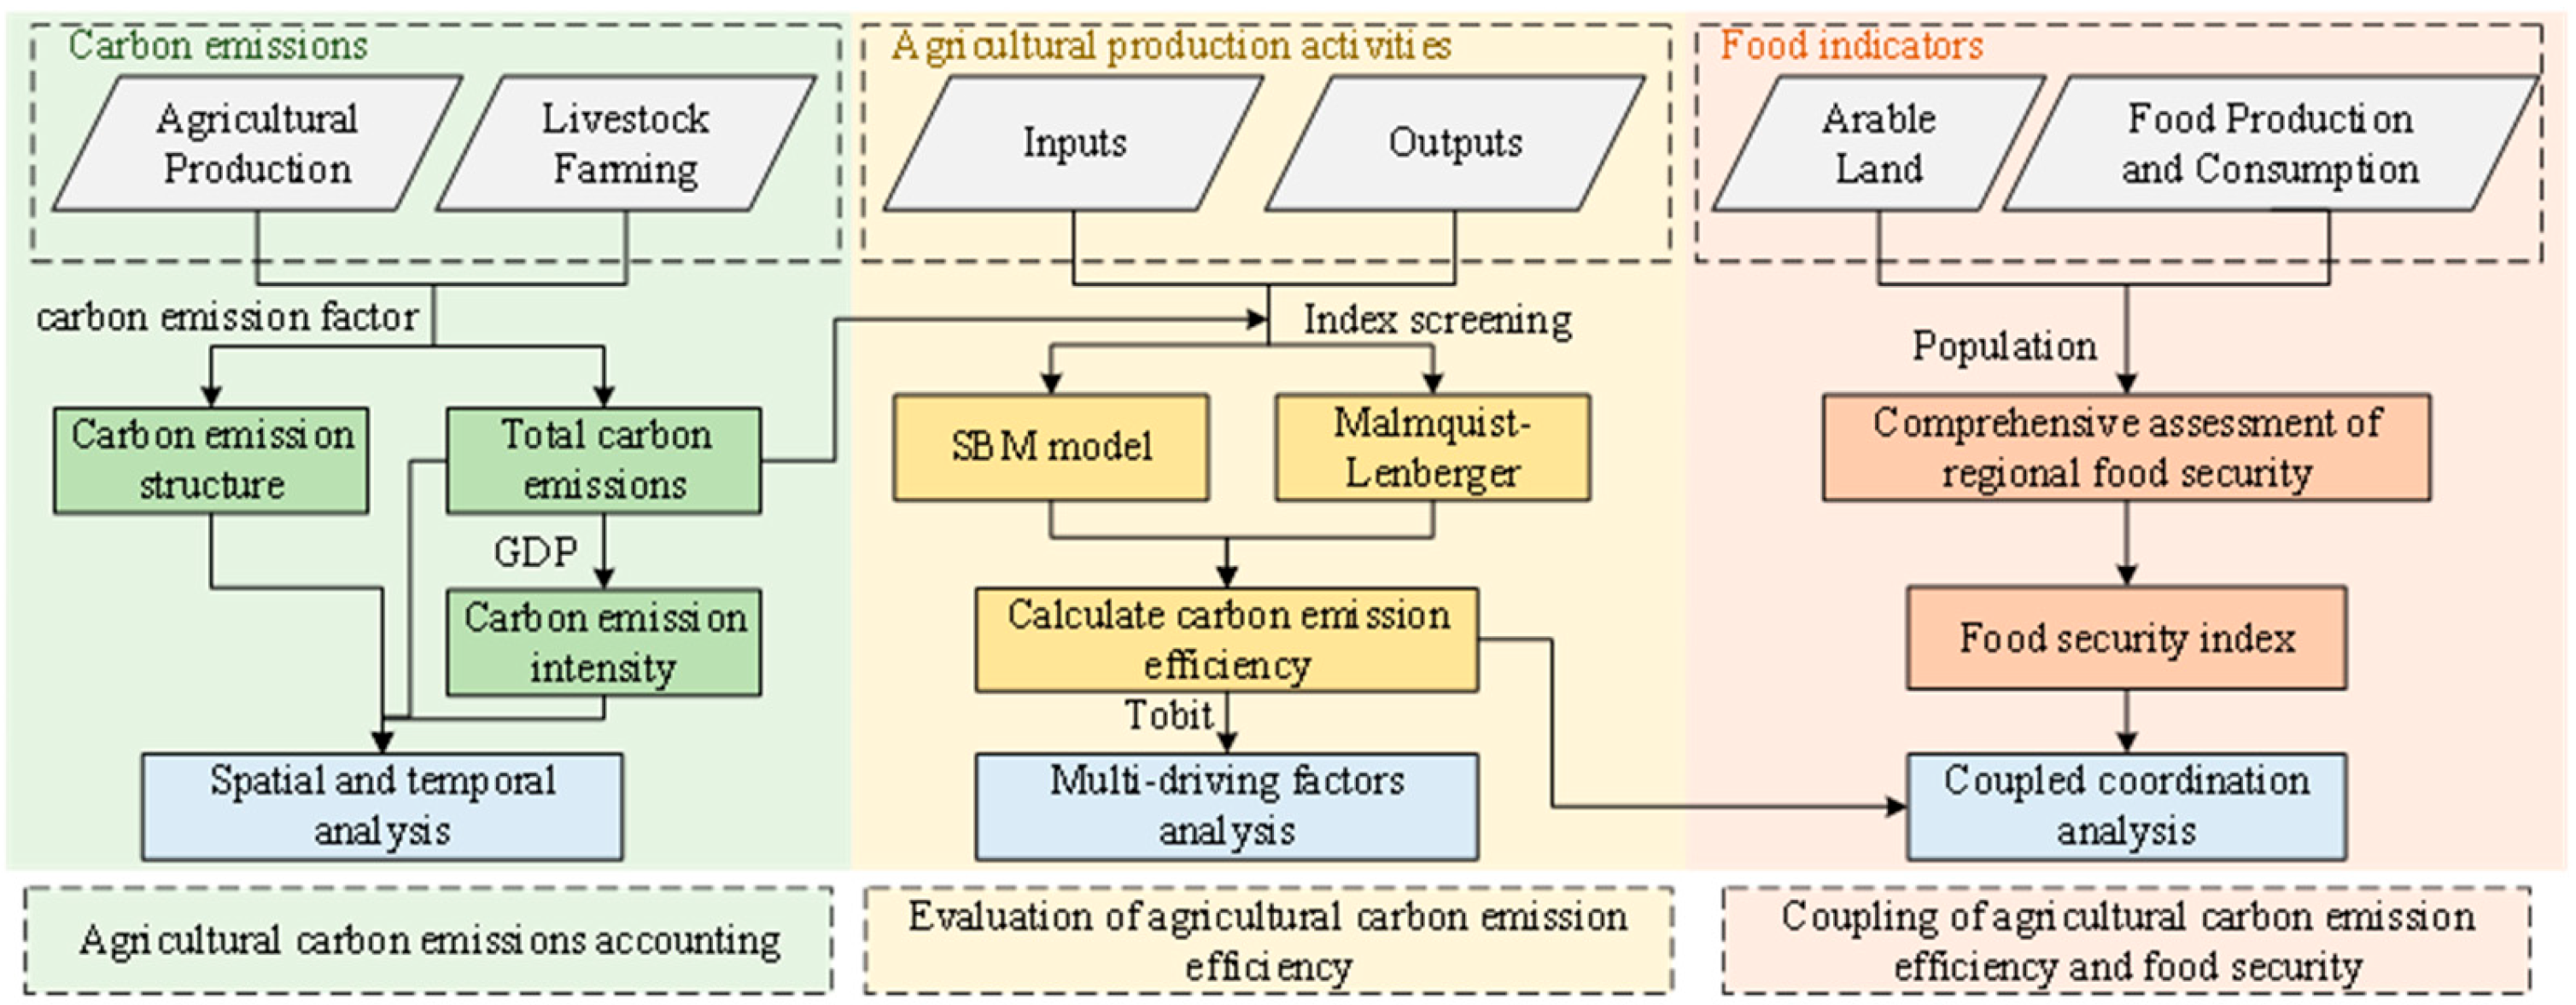
3. Theory
3.1. Agricultural Carbon Emission Calculation Model
3.2. Agricultural Carbon Emission Calculation Model
3.2.1. Construction of the Agricultural Carbon Emission Efficiency Evaluation Index System
3.2.2. SBM Model
3.2.3. Malmquist–Luenberger Index
3.2.4. Tobit Model
3.3. Comprehensive Evaluation Method of Food Security
3.4. Coupling Coordination Evaluation Method
4. Results and Analyses
4.1. Accounting and Analysis of Agricultural Carbon Emissions
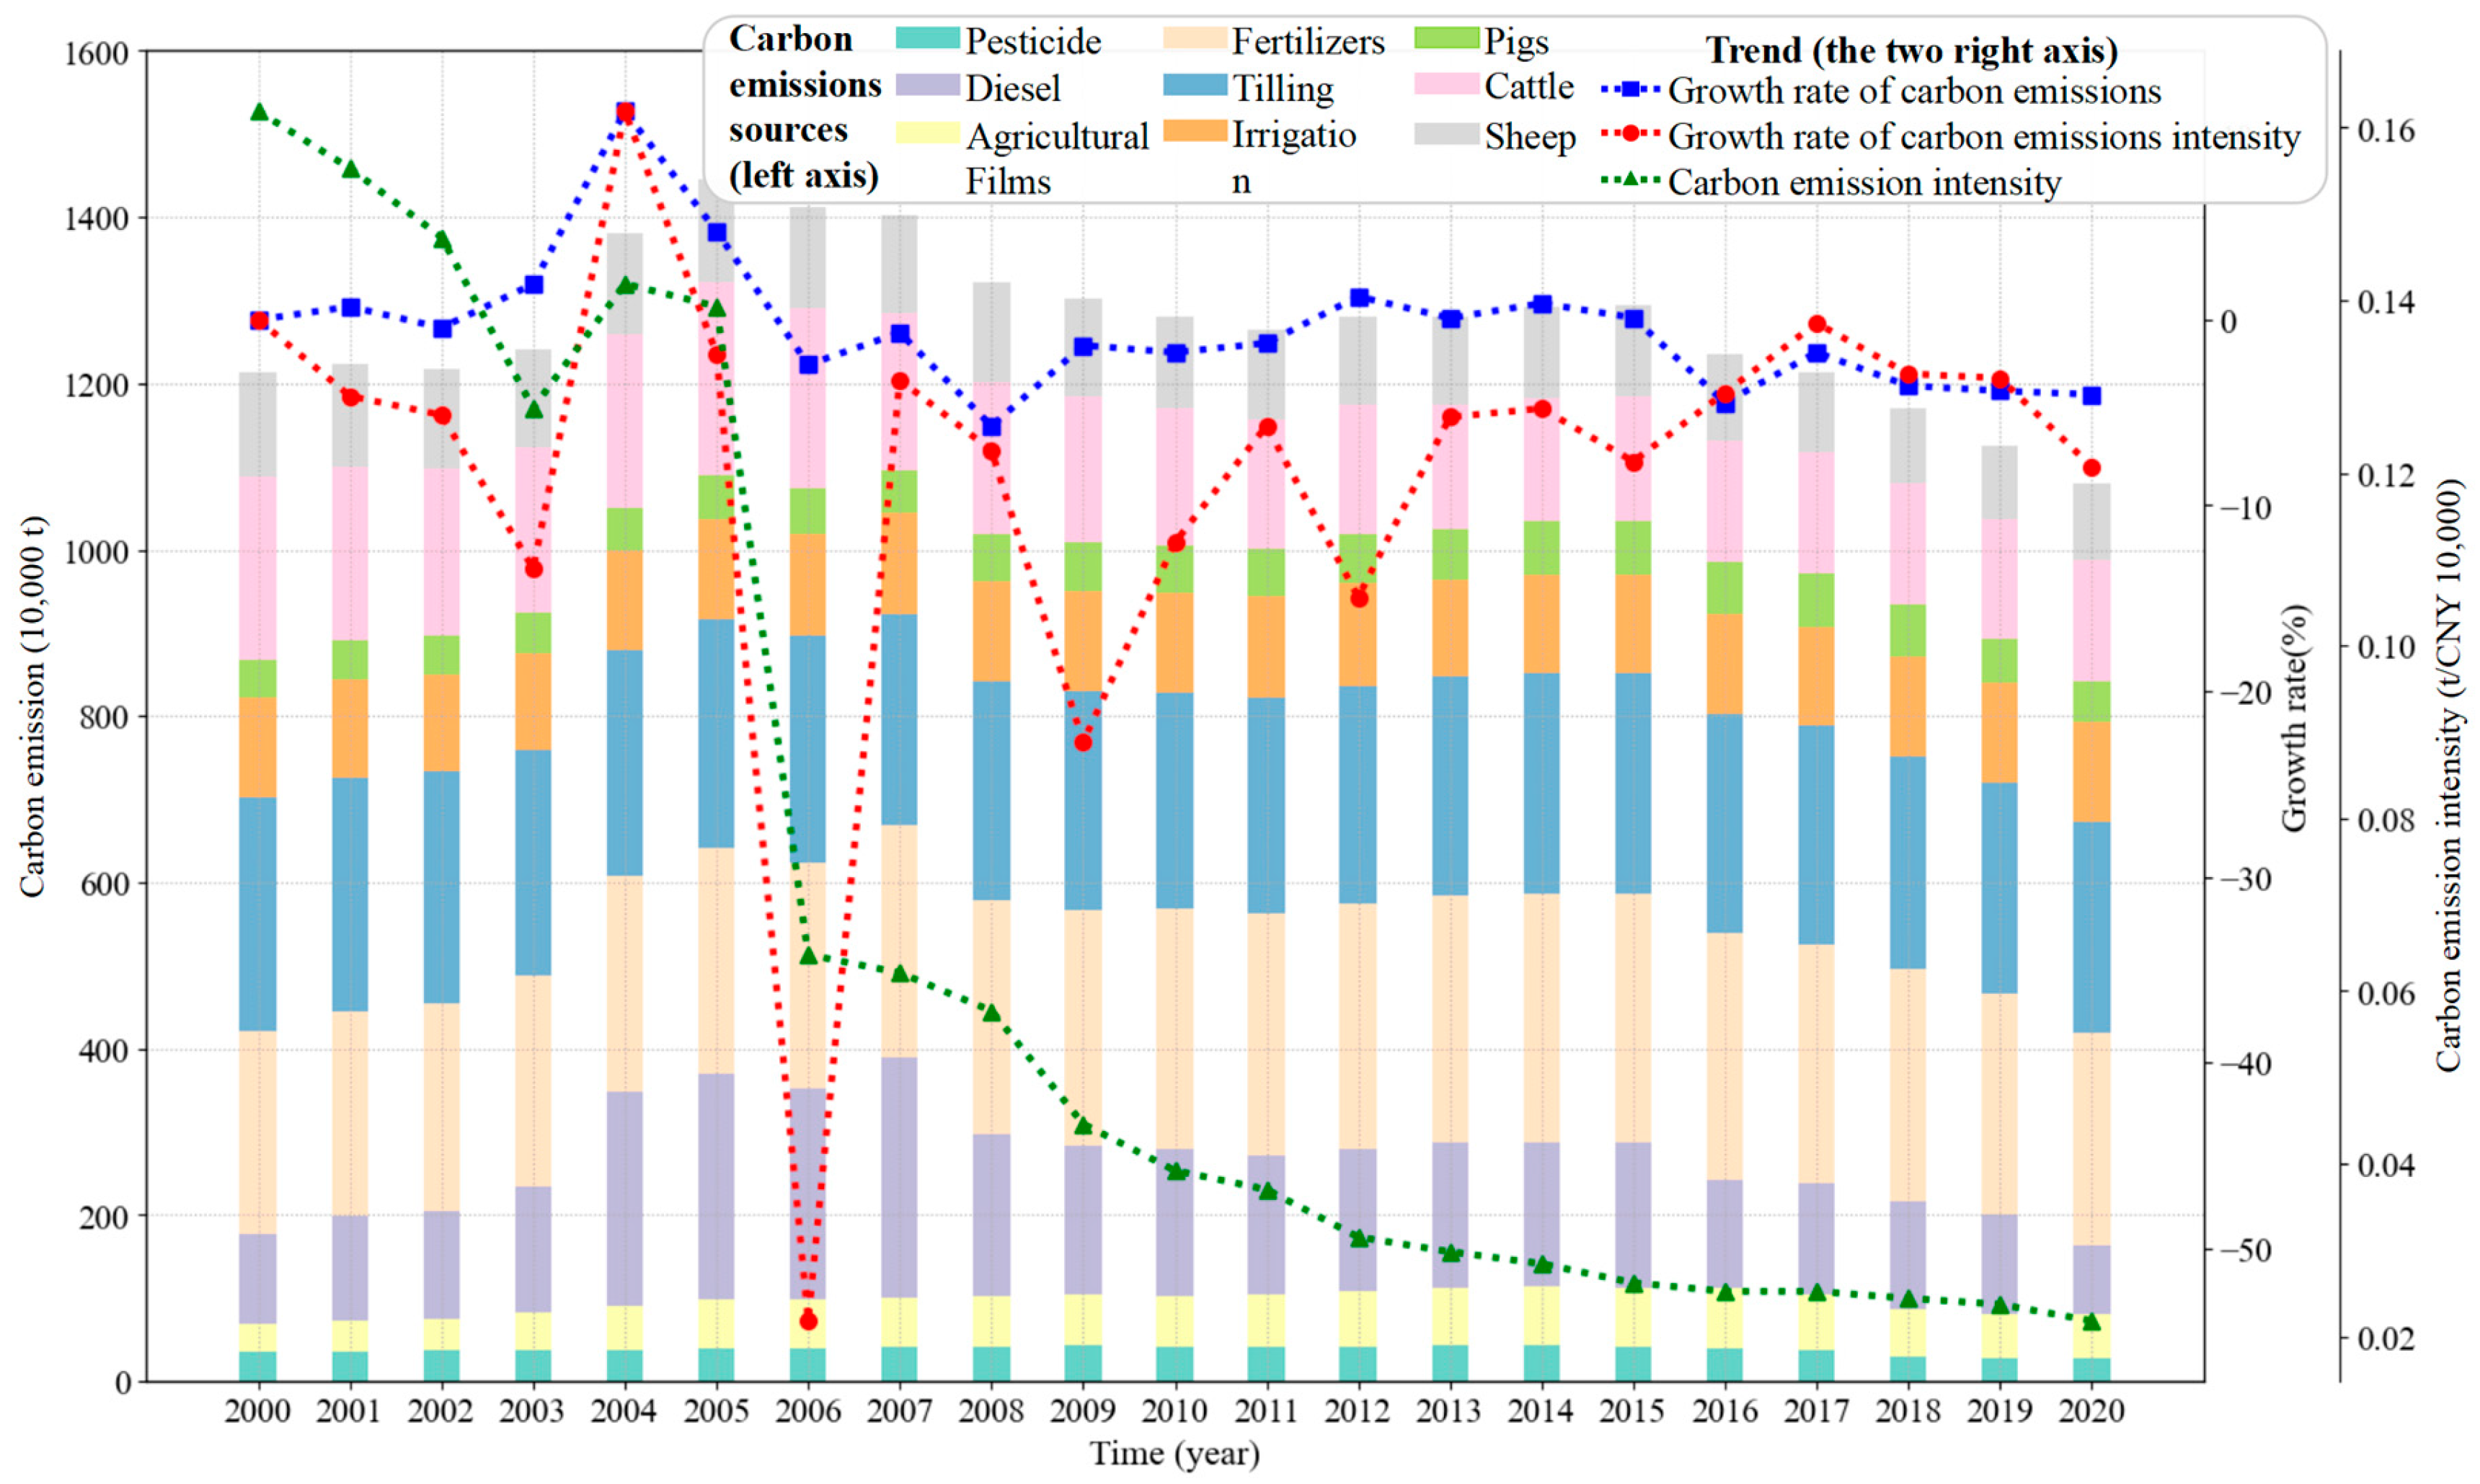
4.1.1. Temporal Evolution Characteristics of Agricultural Carbon Emissions
- (1)
- Total carbon emissions and carbon emissions structures
- (2)
- Carbon emissions and intensity of each city
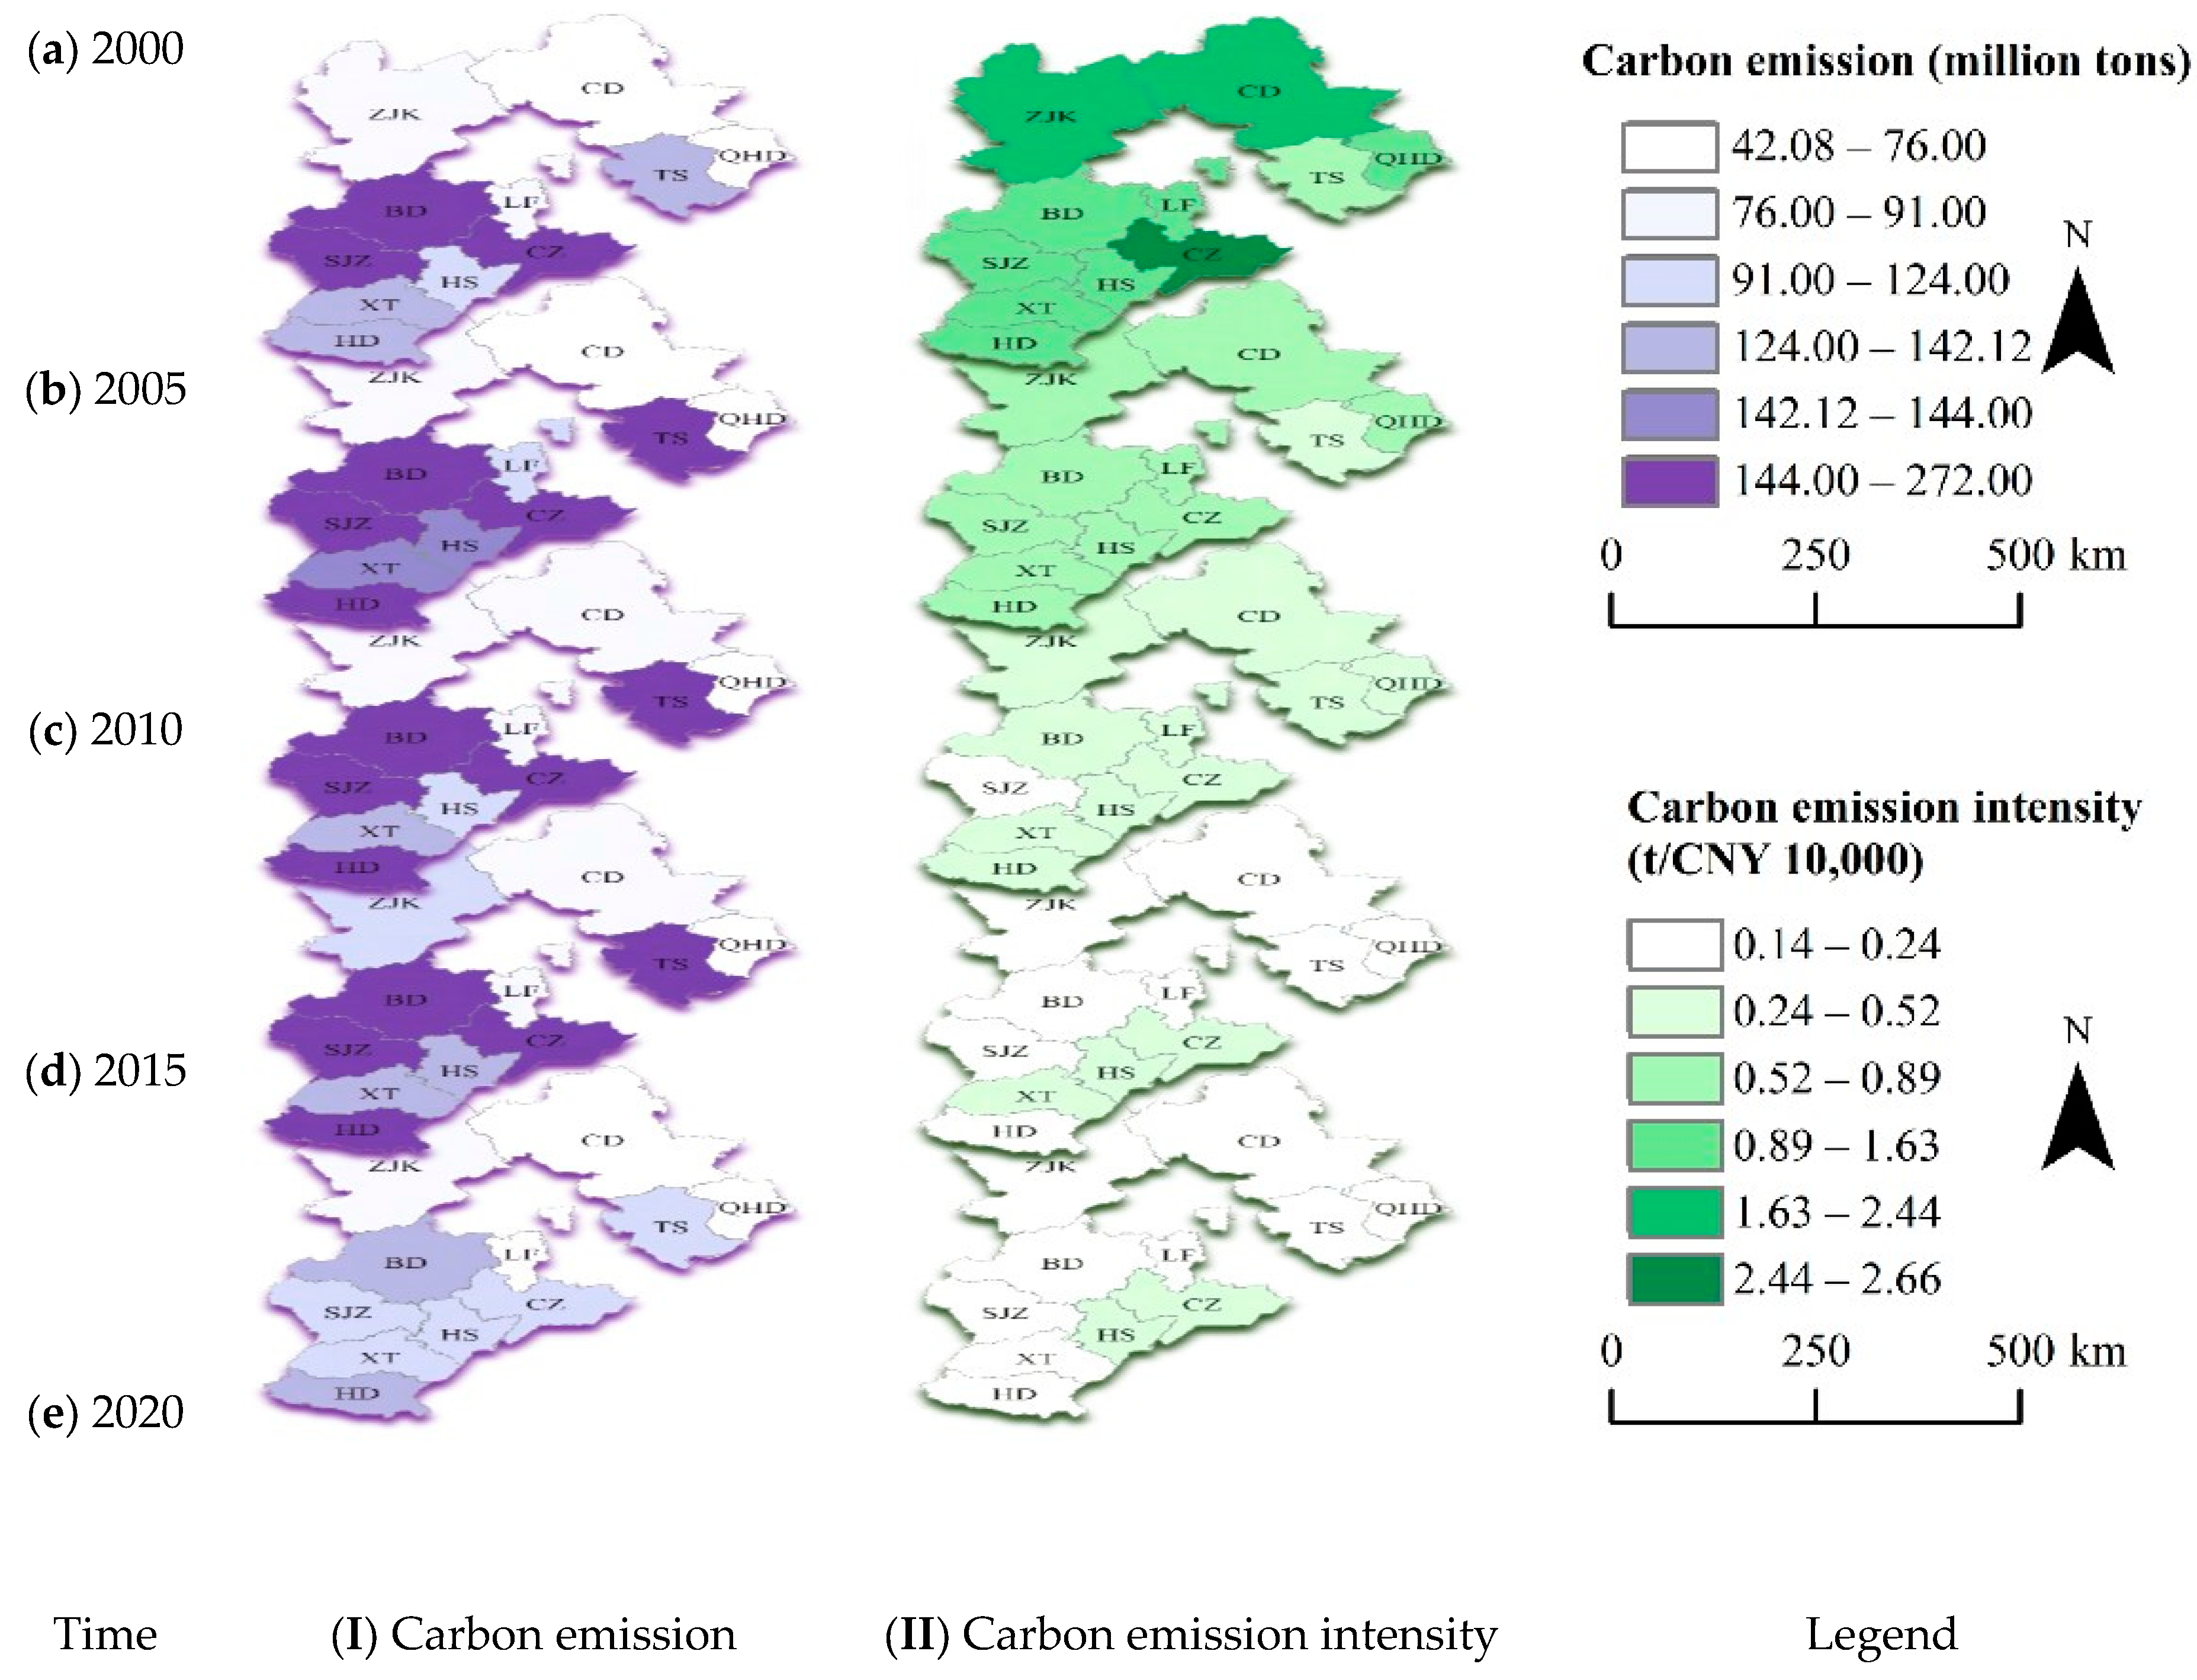
4.1.2. Spatial Evolution Characteristics of Agricultural Carbon Emissions
4.2. Evaluation of Agricultural Carbon Emission Efficiency in Hebei Province
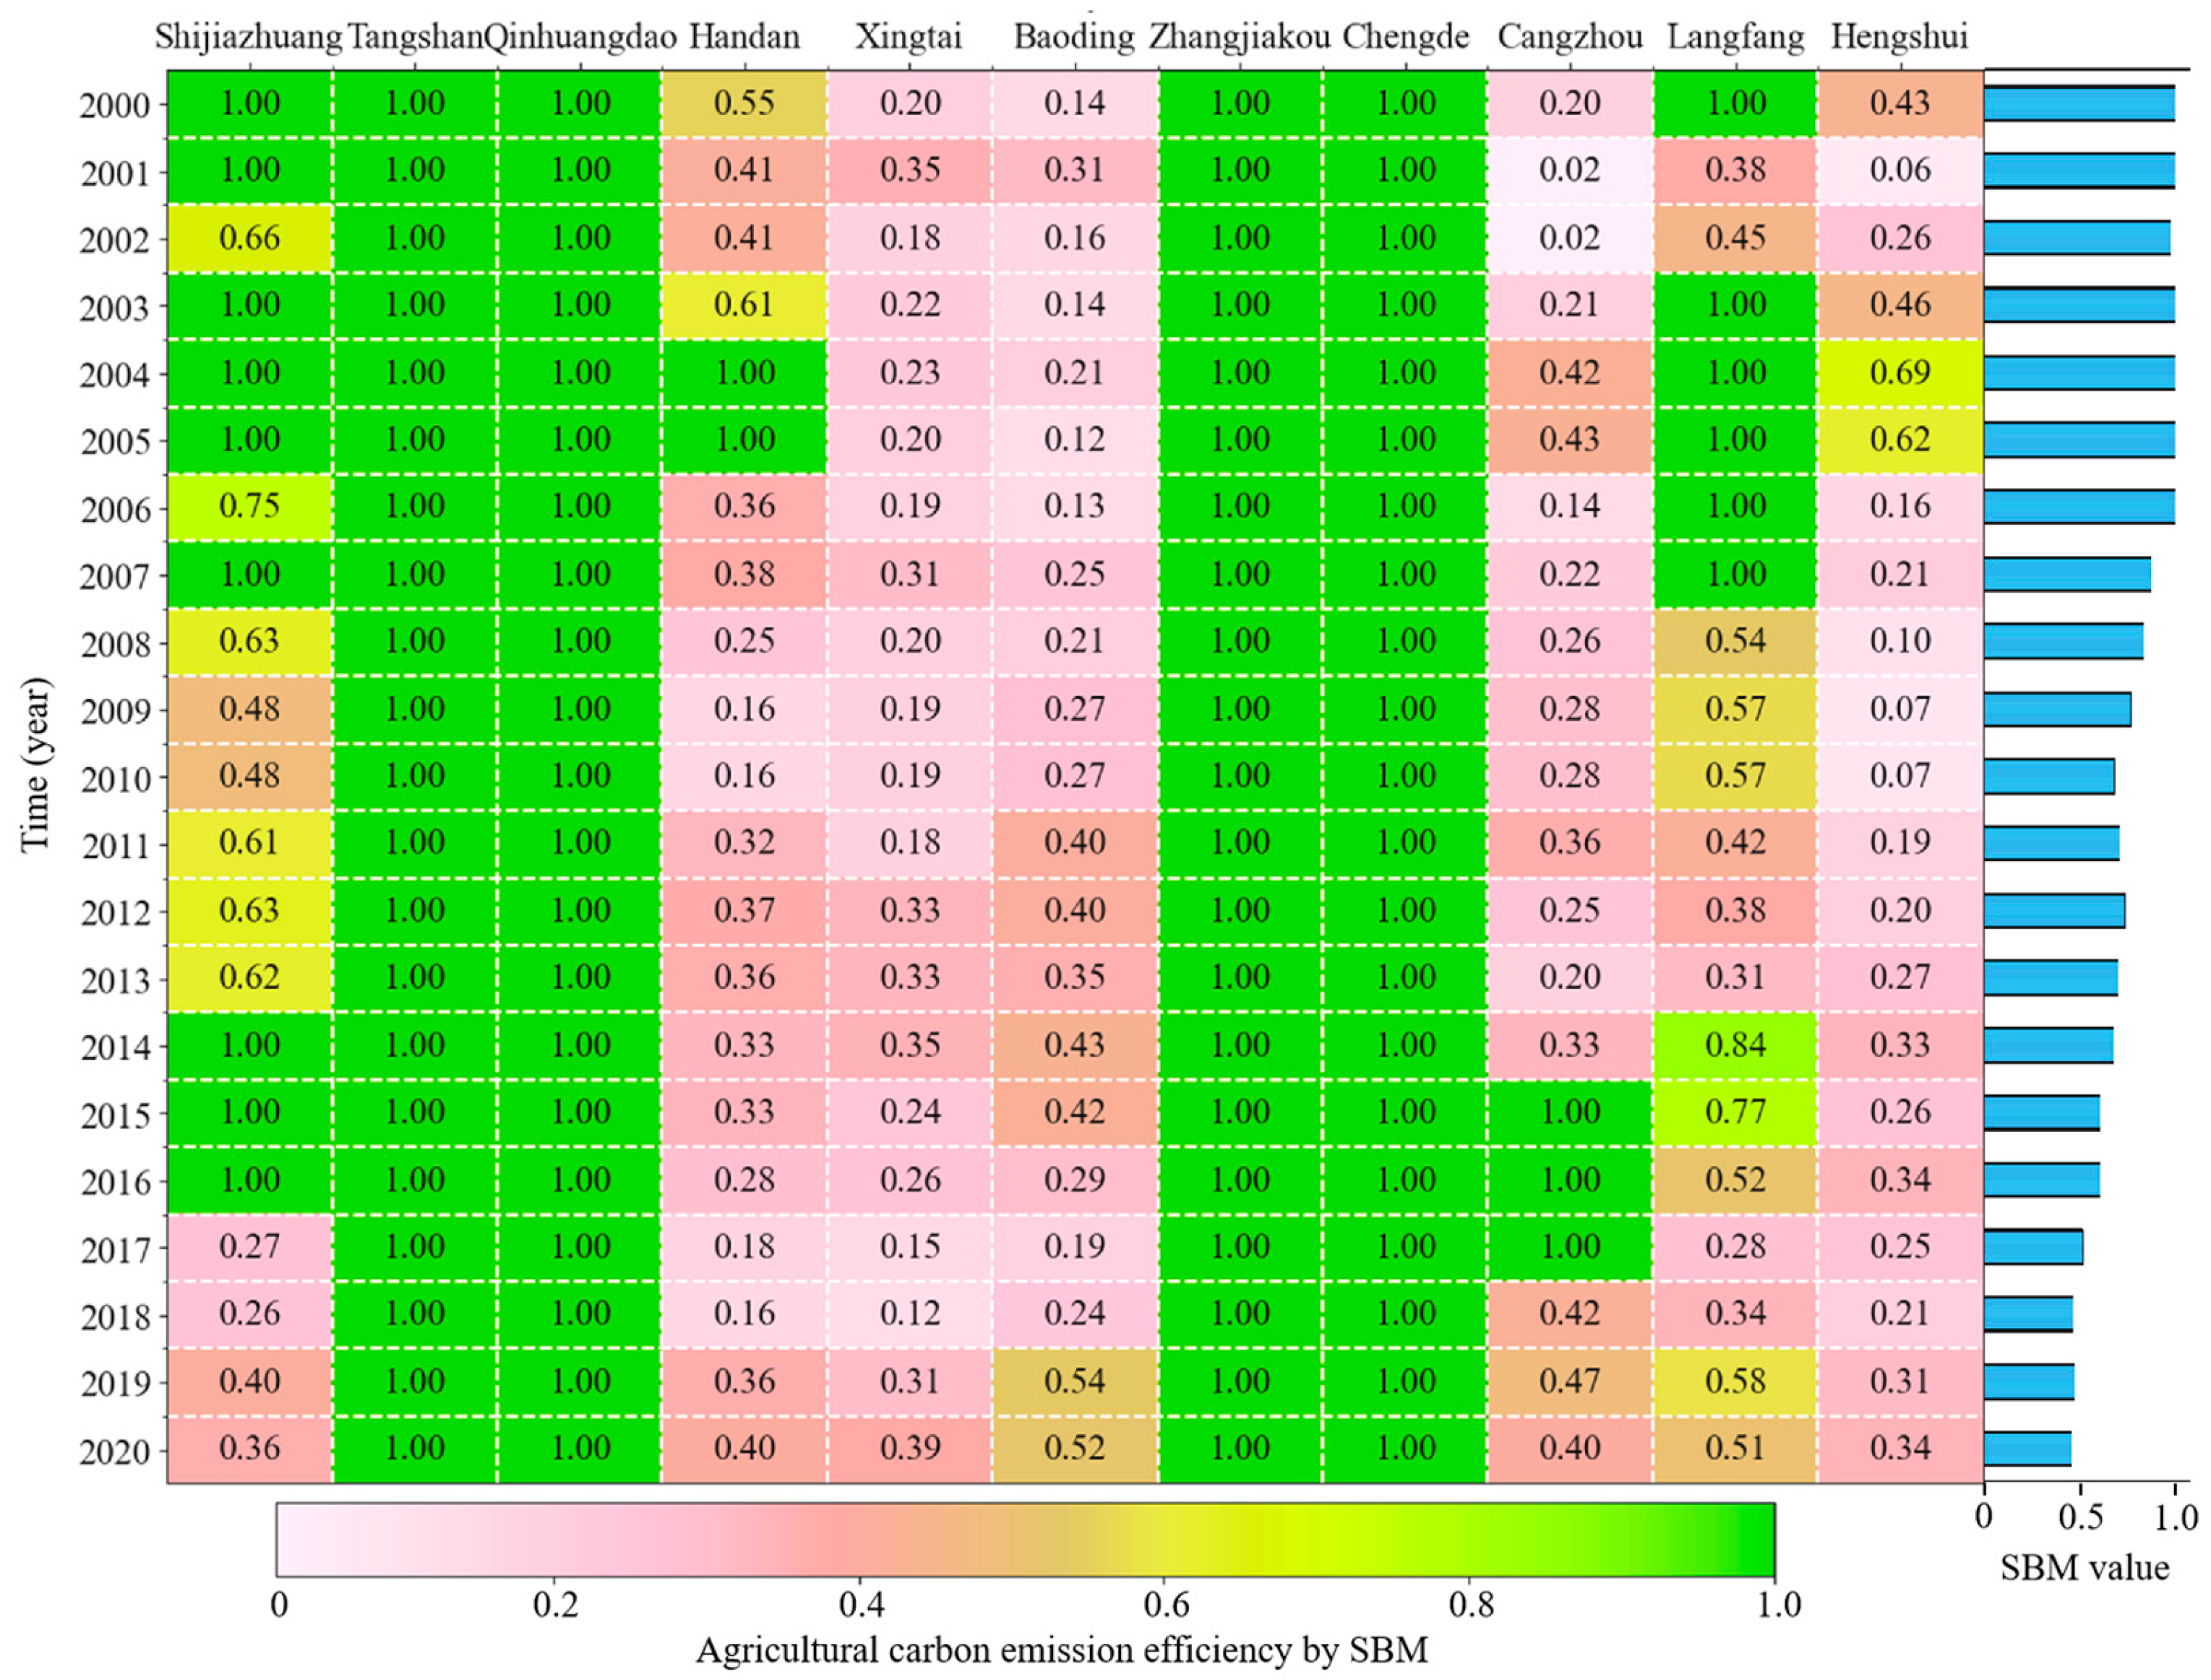
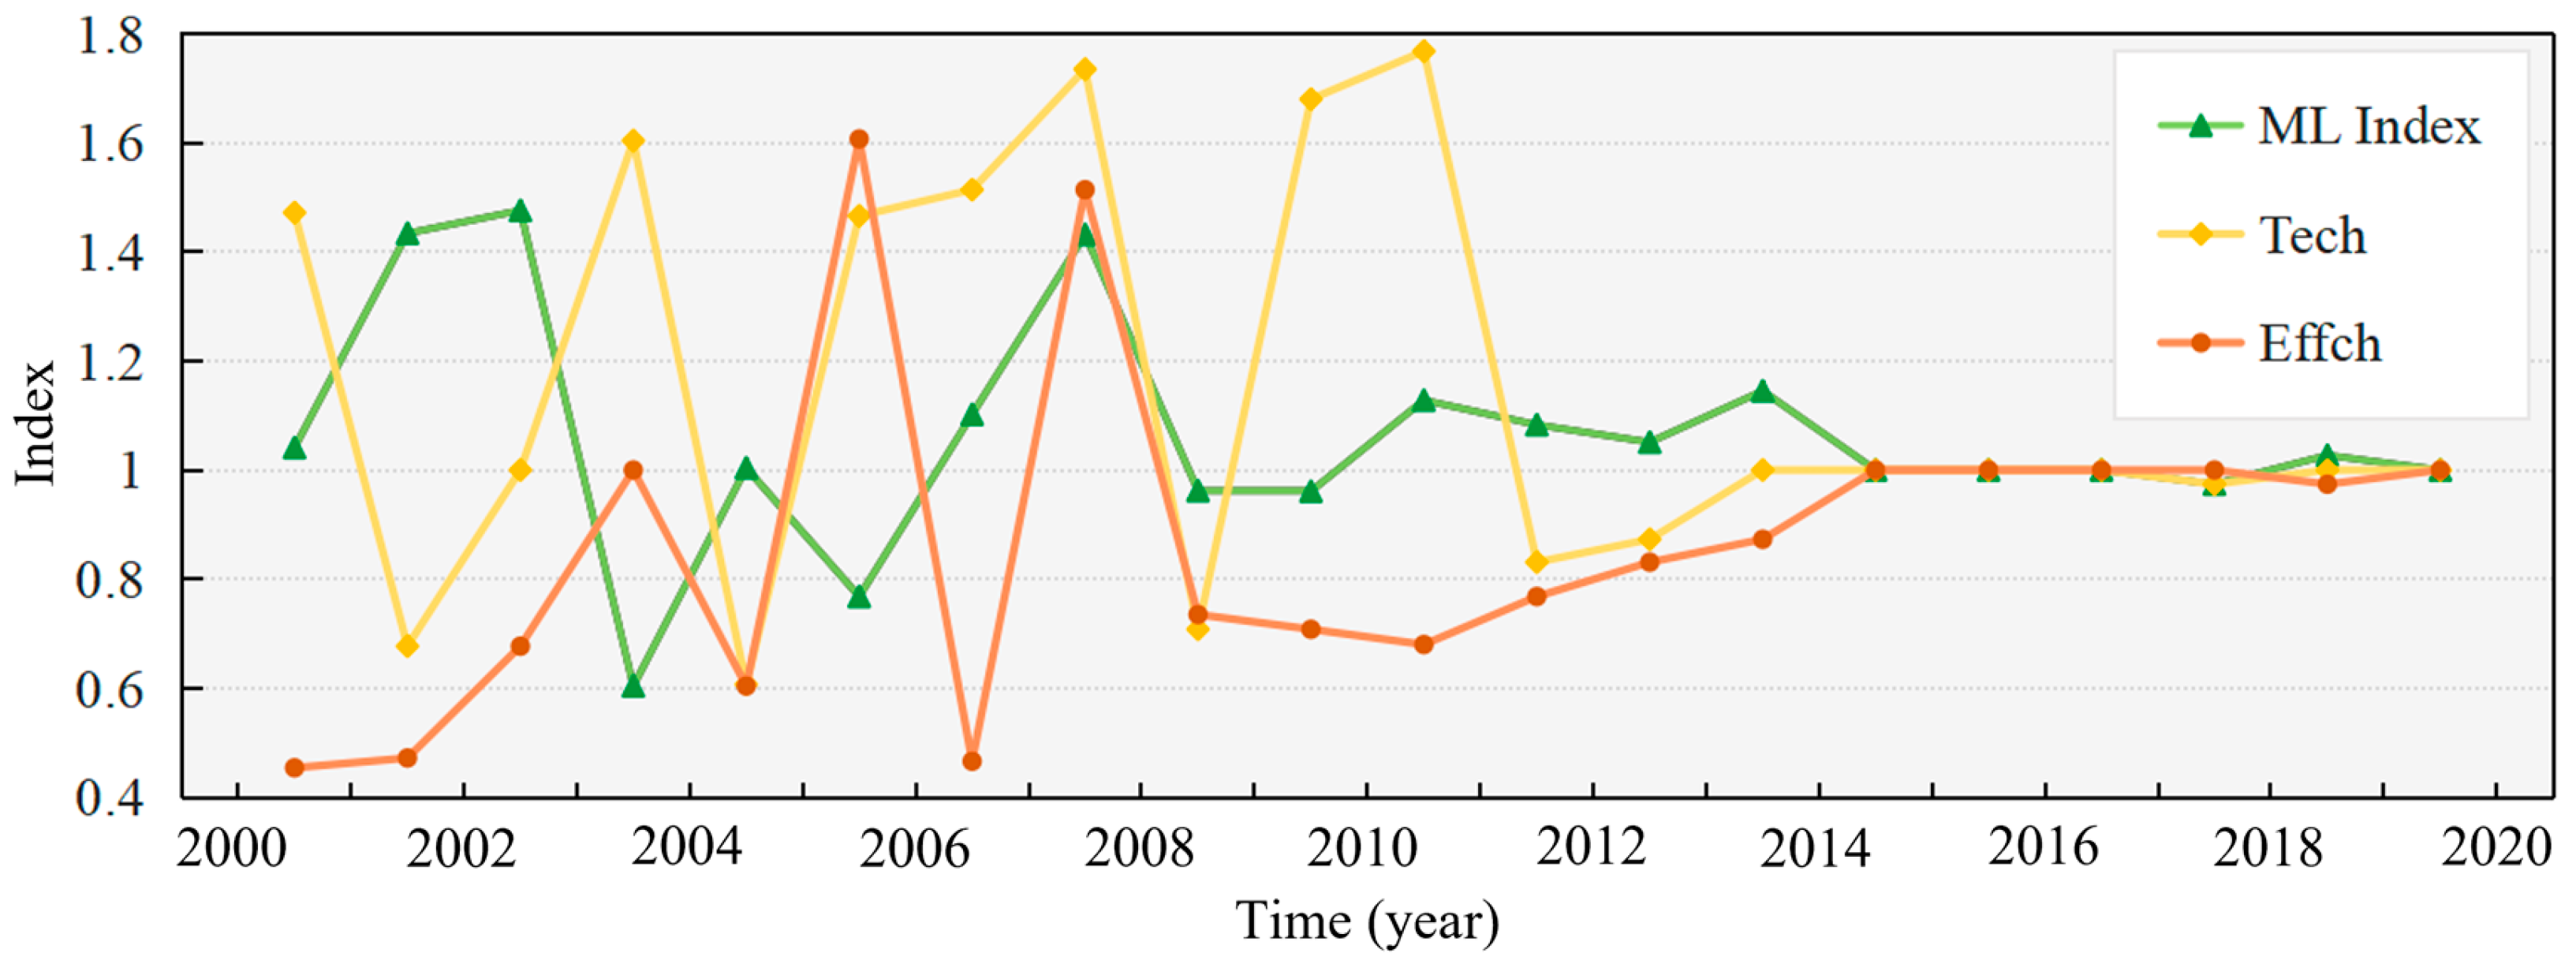
4.2.1. The Time Evolution Characteristics of Agricultural Carbon Emission Efficiency in Hebei Province
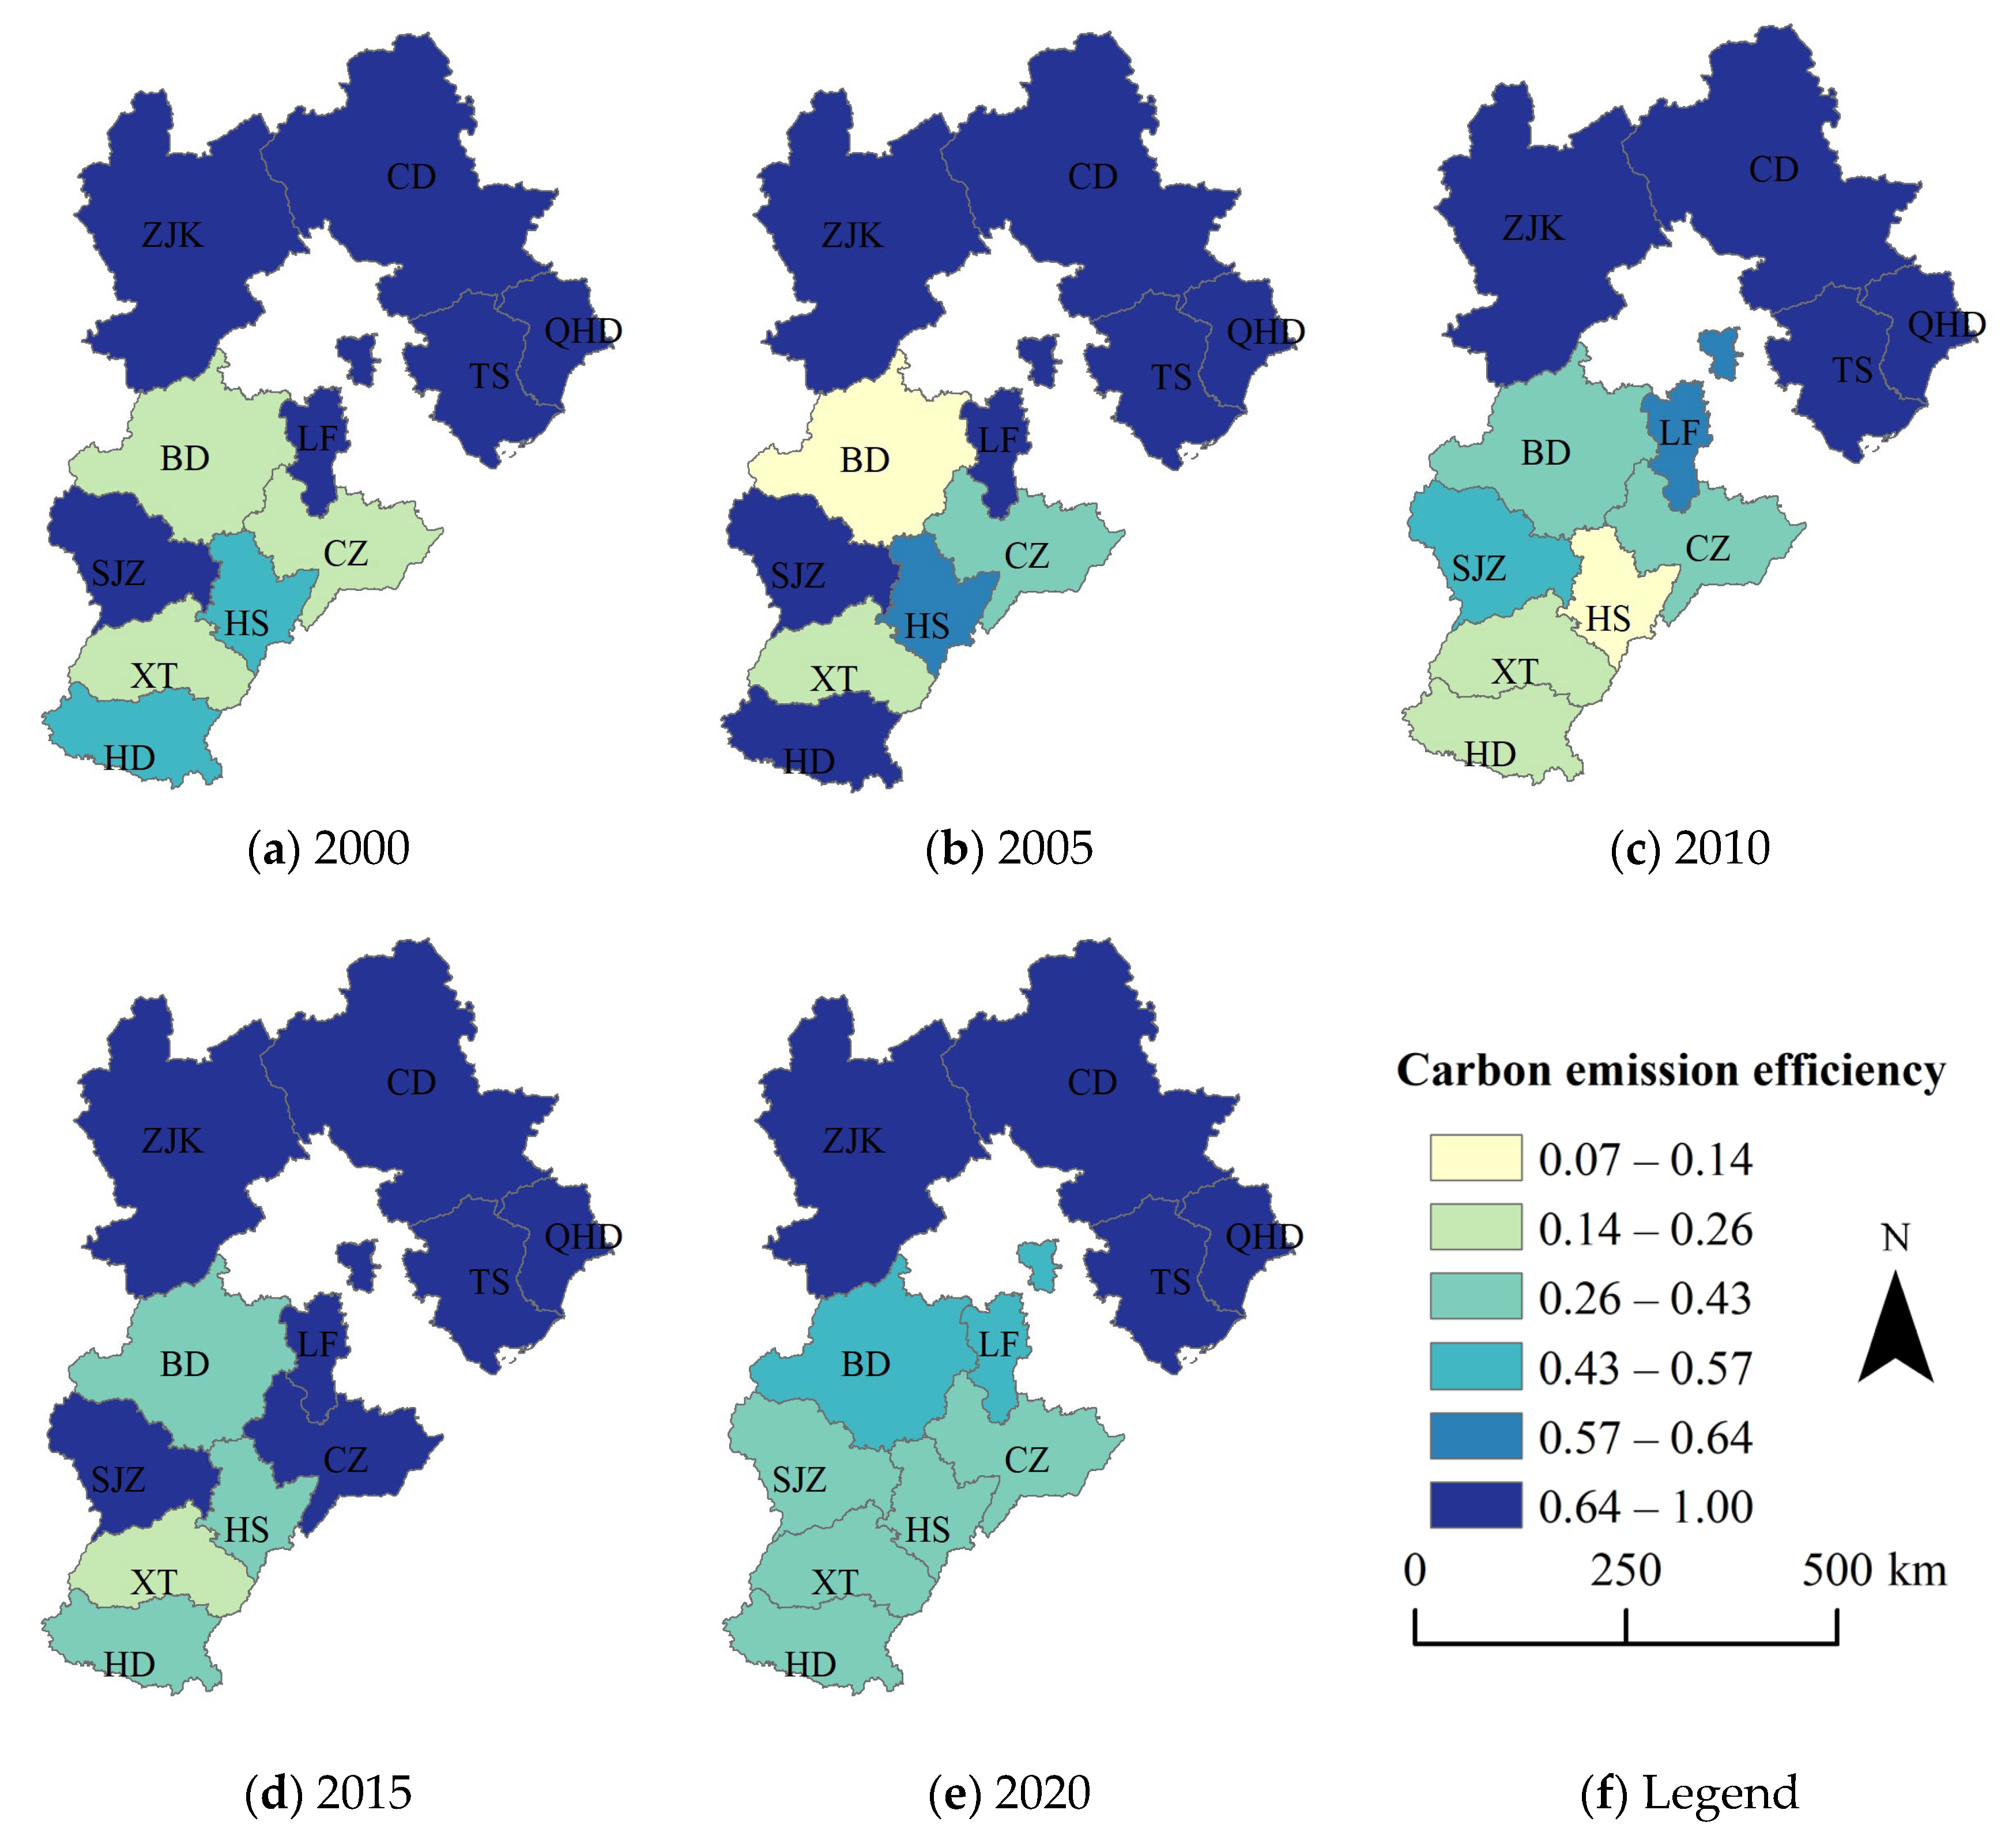
4.2.2. Spatial Evolution Characteristics of Agricultural Carbon Emission Efficiency in Hebei Province
4.3. Spatial and Temporal Changes in Food Security
4.3.1. Temporal Evolution
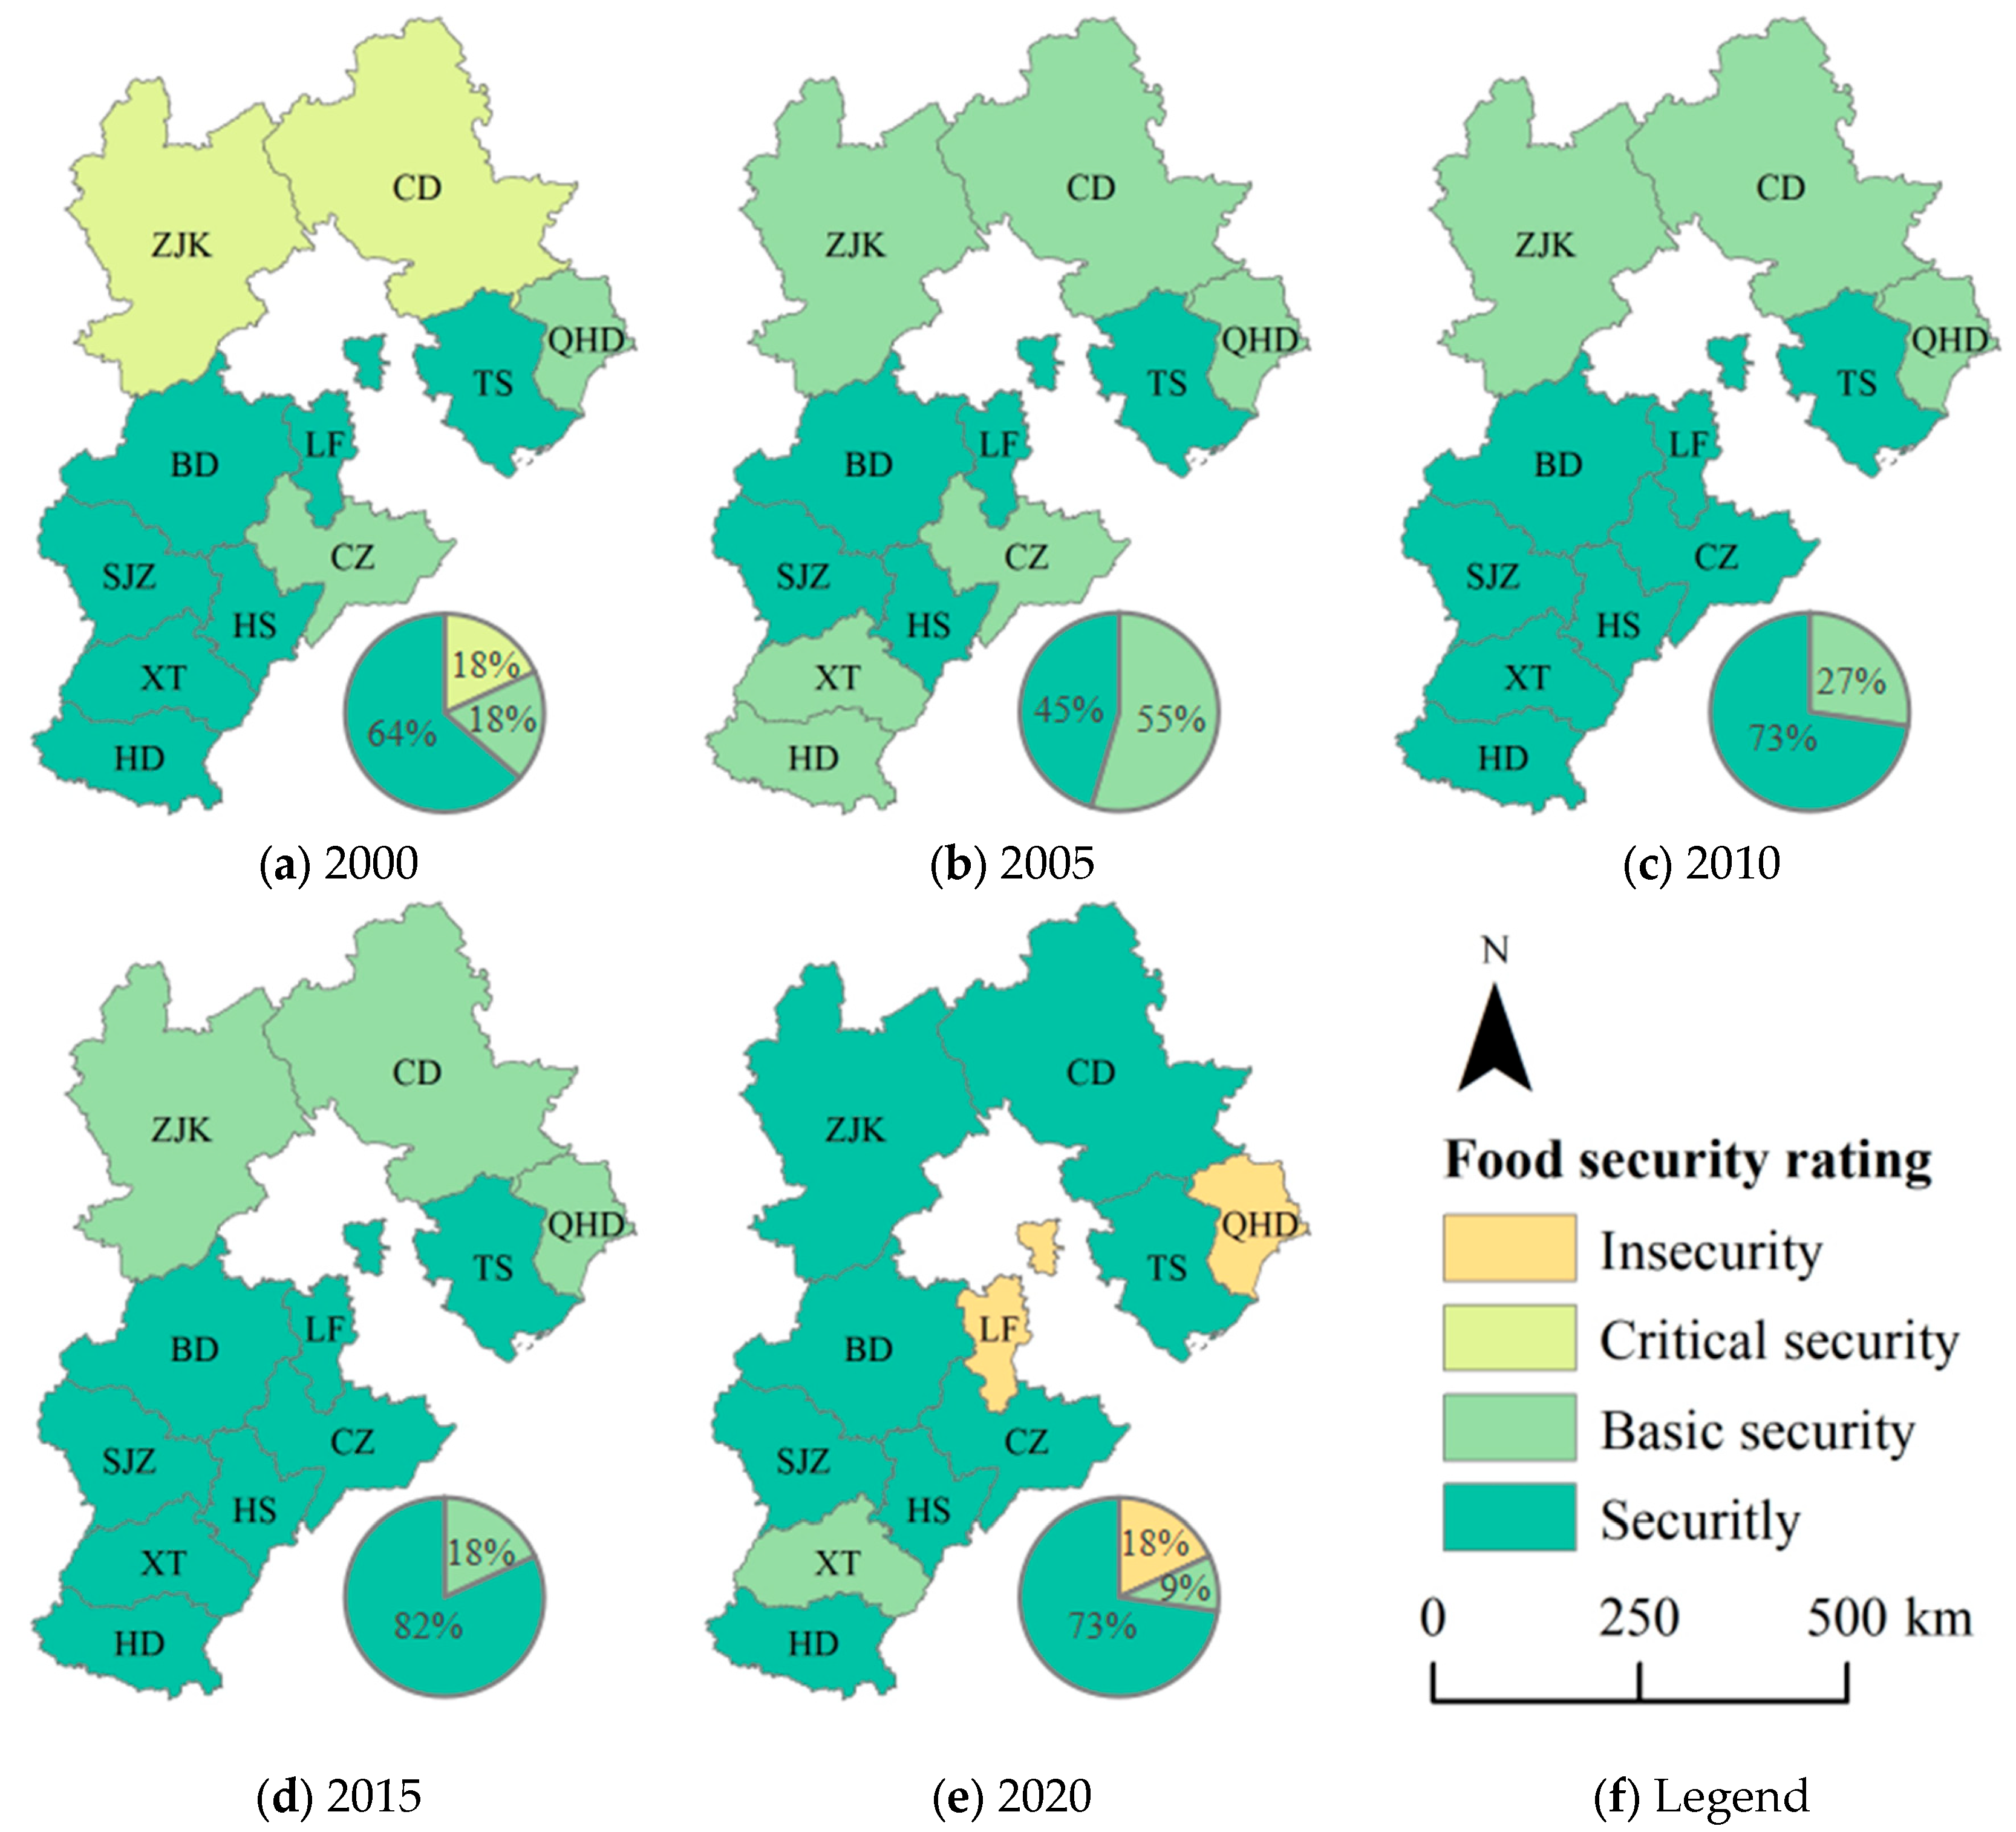
4.3.2. Spatial Evolution
4.4. Analysis of Coupling Coordination Degree between Agricultural Carbon Emission Efficiency and Food Security
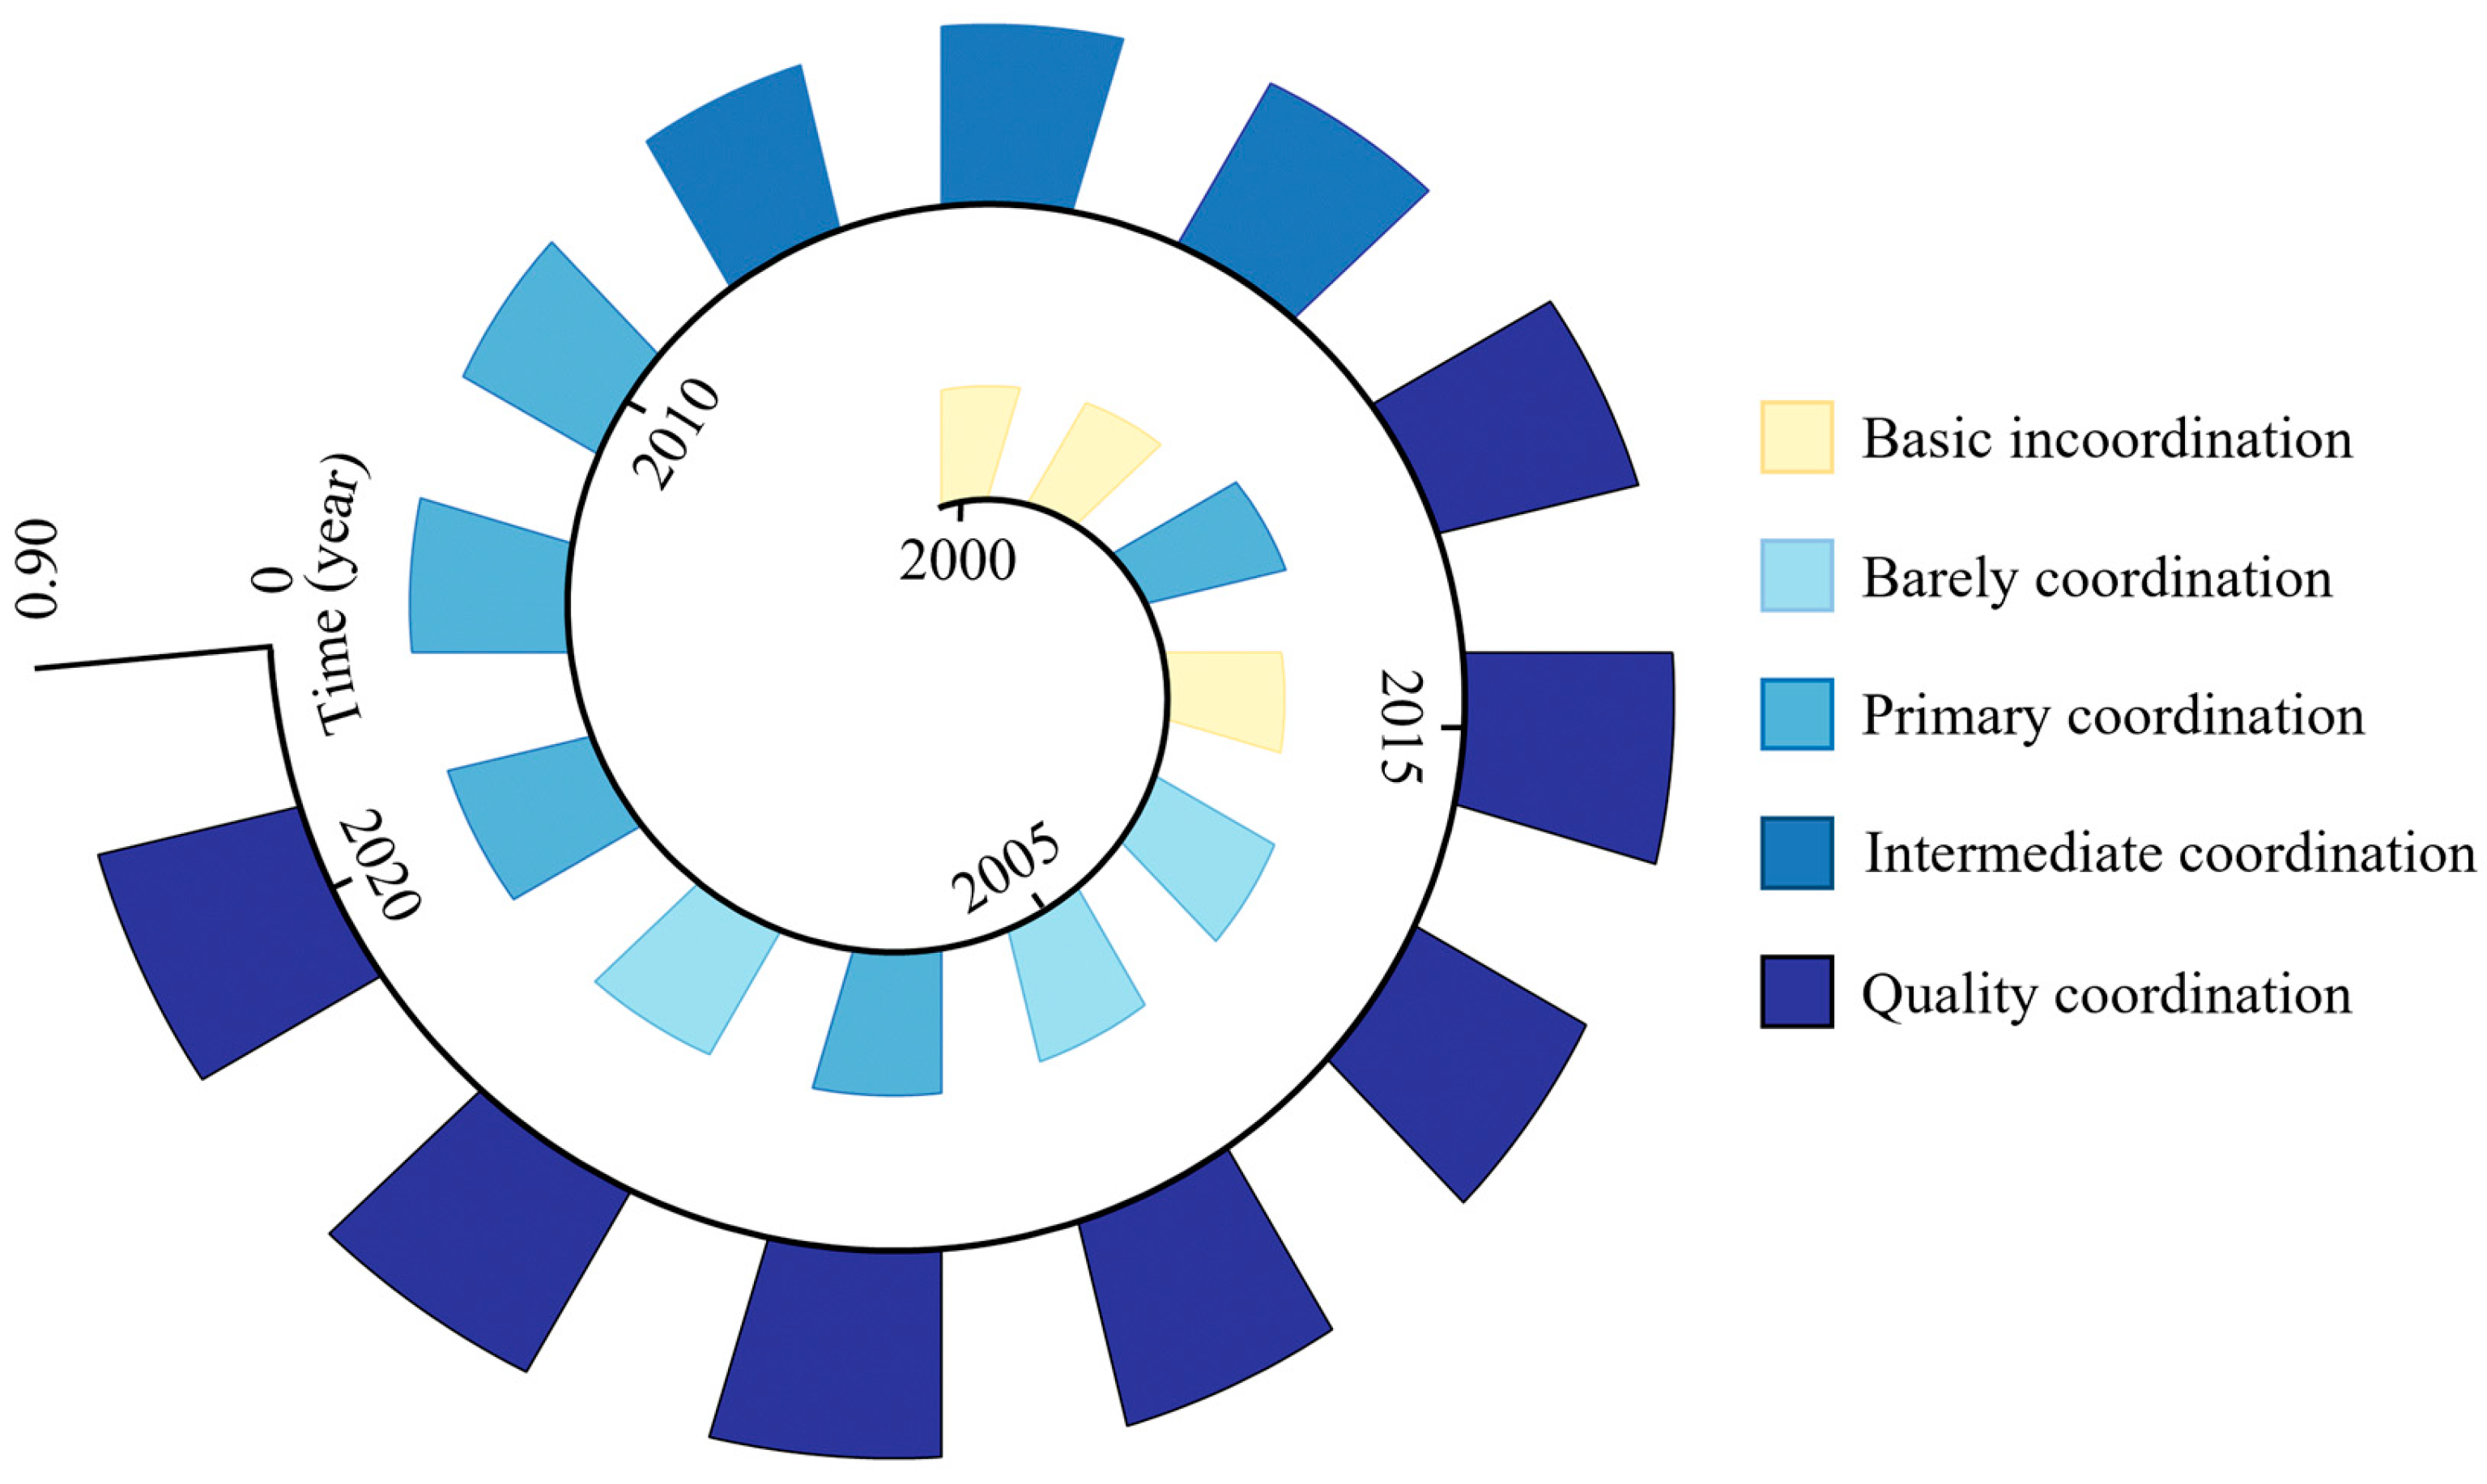
4.4.1. Temporal Evolution
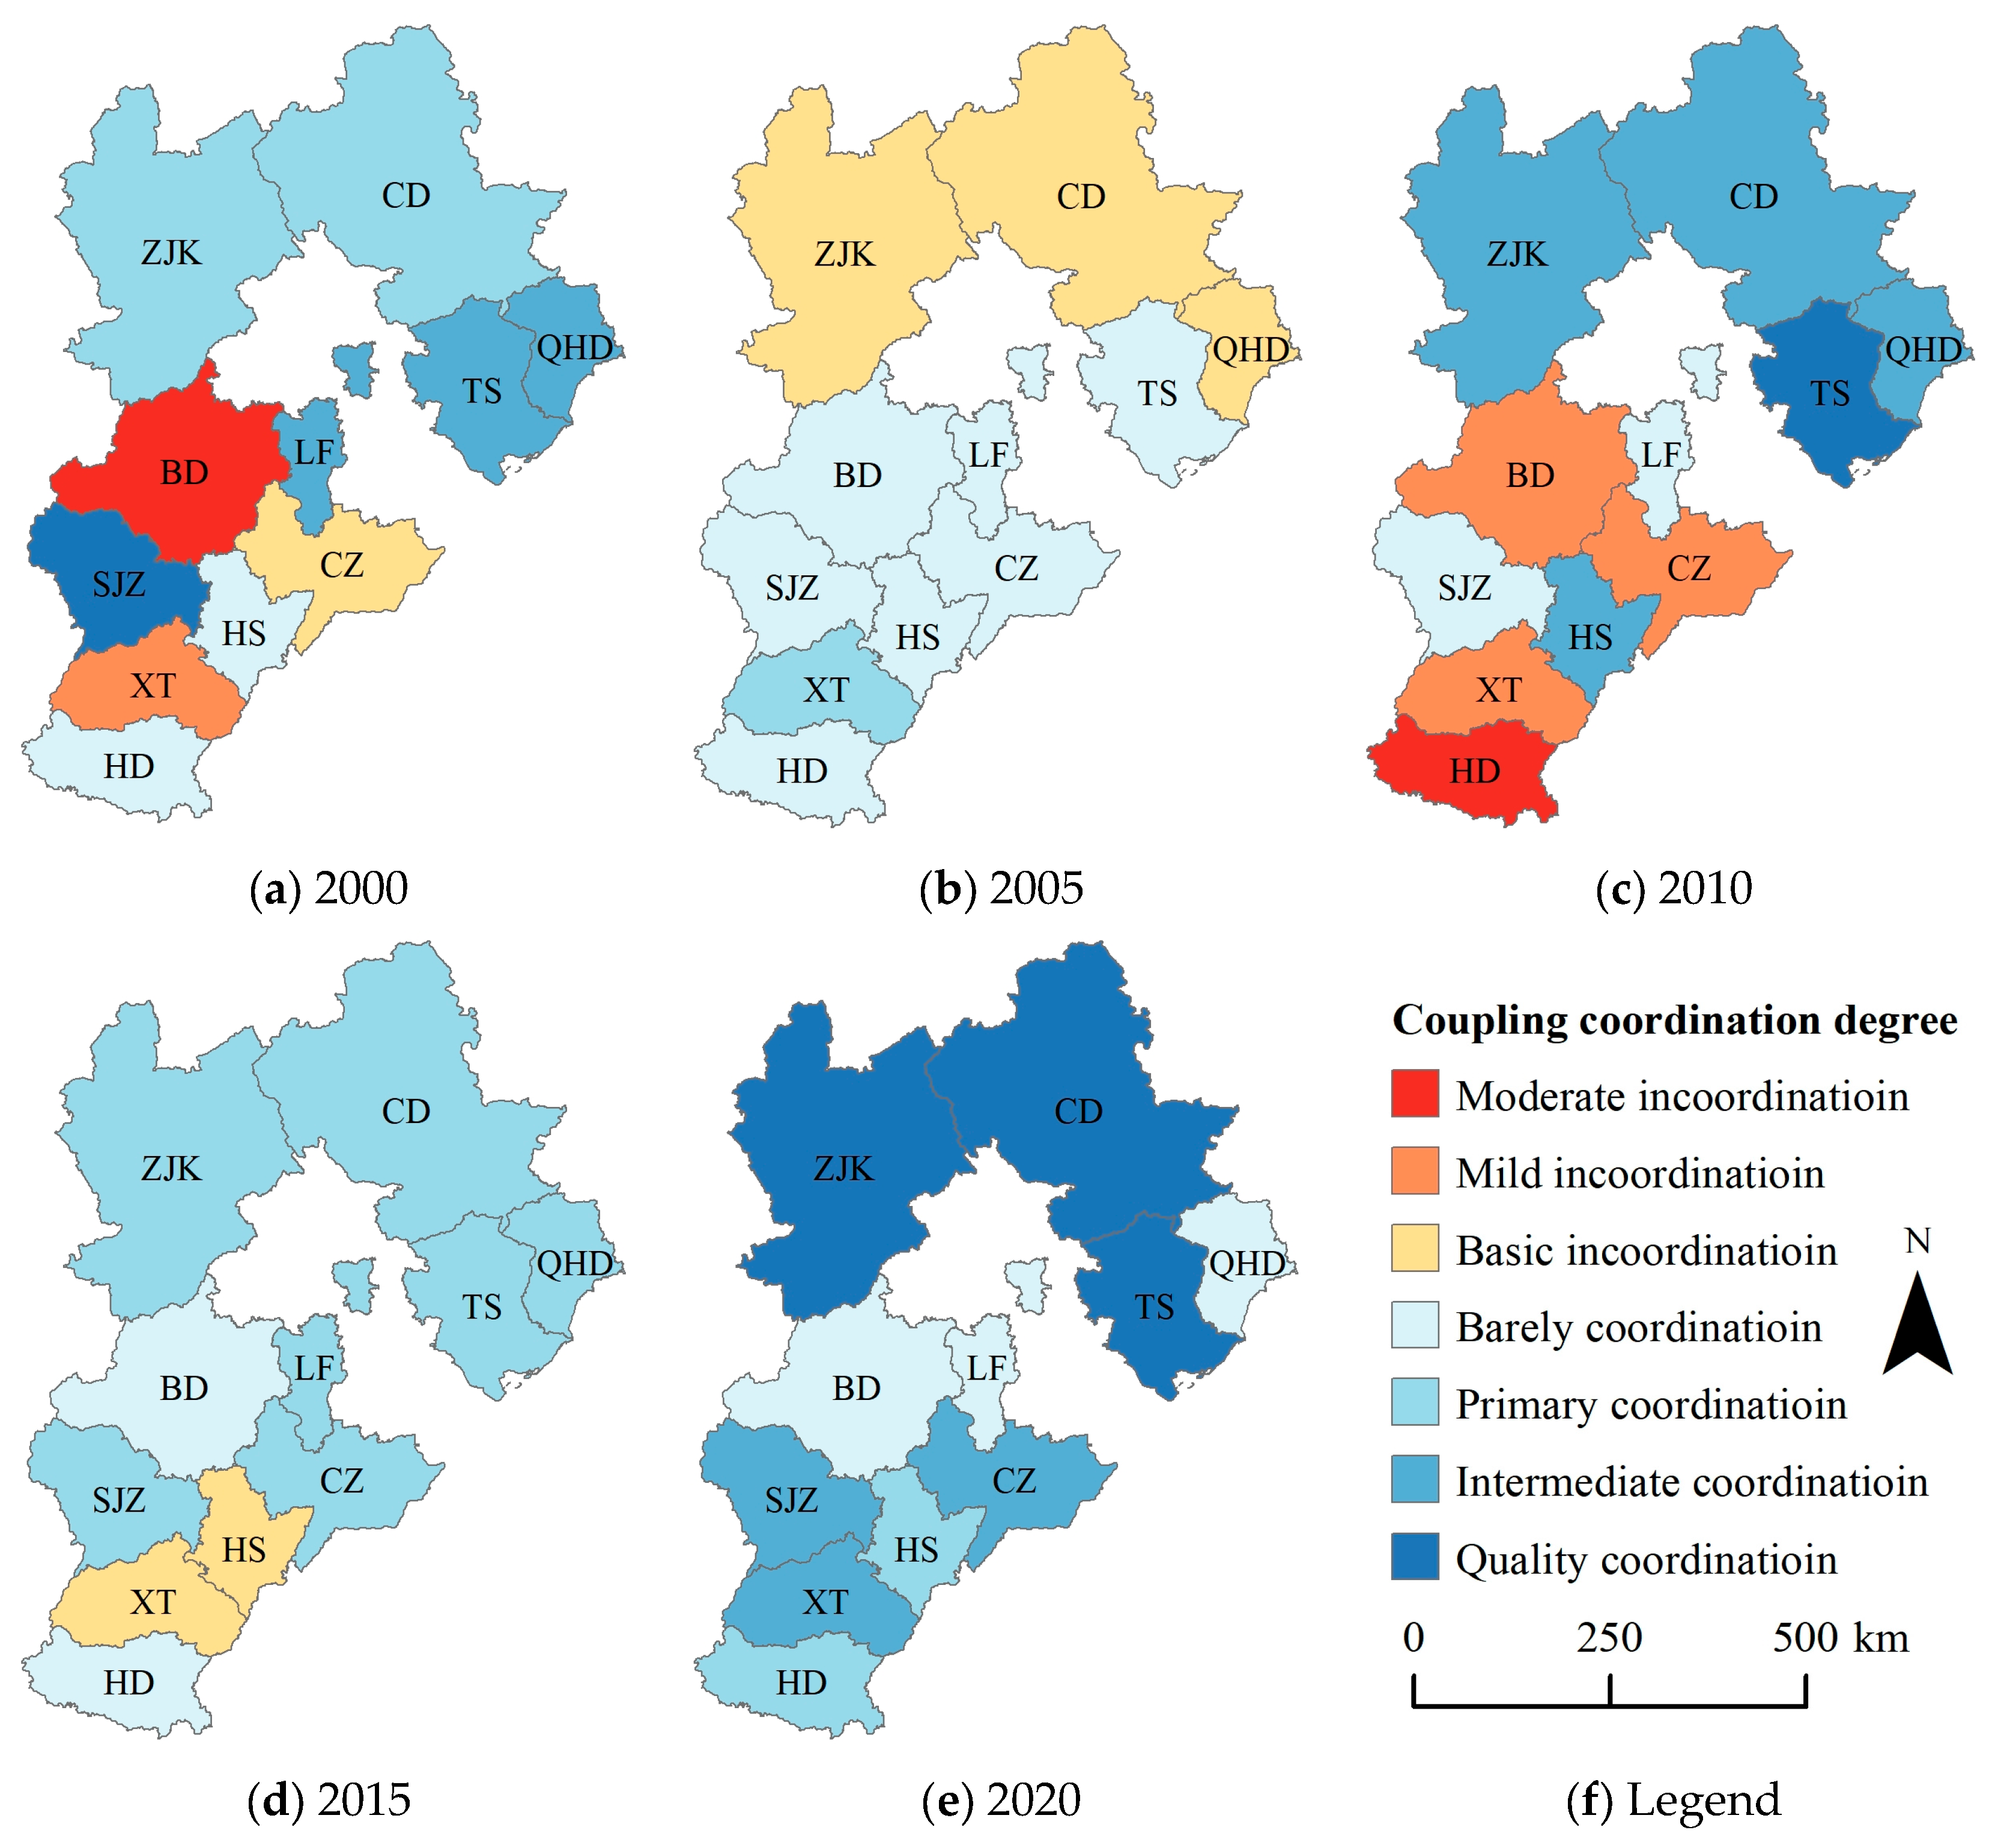
4.4.2. Spatial Evolution
5. Discussion
5.1. Analysis Examining the Influencing Factors of Agricultural Carbon Emission Efficiency in Hebei Province
5.2. Suggestions for Carbon Emission Reduction in Agricultural Development
6. Conclusions
- (1)
- The change in agricultural carbon emissions in Hebei Province was primarily divided into three stages that included a rapid growth period (2000–2005), a fluctuating decline period (2006–2015), and a continuous decline period (2016–2020). In terms of time, the total amount of agricultural carbon emissions in Hebei Province increased first and then fluctuated and decreased at a rate of 6.99% from 2000 to 2020 from 12.14 million t in 2000 to 10.80 million t in 2020. Agricultural carbon emission intensity decreased at a rate of 0.76%. In the carbon emission structure, agricultural fertilizer and plowed land accounted for 22% and 21% of agricultural emissions, and these are the two most important carbon sources. Spatially, agricultural carbon emissions in Hebei Province generally exhibit a distribution pattern that is high in the south and low in the north.
- (2)
- From a static perspective, the level of agricultural carbon emissions in Hebei Province from 2000 to 2020 was above average, and the carbon emission efficiency fluctuated at a rate of 0.0265 with an annual average of 0.765. From a dynamic perspective, the ML index of Hebei Province during 2000–2020 changed smoothly, and the fluctuation was small. The technological progress index generally exhibits a trend of fluctuating decline, and the average level is above 1. The technical efficiency index exhibits a fluctuating upward trend with an overall range of 0.45–1.07.
- (3)
- In regard to time, the D value of agricultural carbon emission efficiency and food security in Hebei Province changed from 0.486 to 0.866 from 2000 to 2020, and the overall coupling coordination degree exhibited a transition from non-coordination to quality coordination. The coupling coordination degrees are significantly different in space. In 2020, the agricultural carbon emission efficiency and food security in Hebei Province were highly matched, and all prefecture-level cities were in a coordinated state.
Author Contributions
Funding
Institutional Review Board Statement
Informed Consent Statement
Data Availability Statement
Acknowledgments
Conflicts of Interest
References
- Masson-Delmotte, V.; Zhai, P.; Pirani, A.; Connors, S.L.; Péan, C.; Berger, S.; Caud, N.; Chen, Y.; Goldfarb, L.; Gomis, M. Climate change 2021: The physical science basis. Contrib. Work. Group I Sixth Assess. Rep. Intergov. Panel Clim. Change 2021, 2, 2391. [Google Scholar]
- Huang, C.; Xu, N.J.G.I. Quantifying urban expansion from 1985 to 2018 in large cities worldwide. Geocarto Int. 2022, 37, 18356–18371. [Google Scholar] [CrossRef]
- Li, L.; Zhu, L.; Xu, N.; Liang, Y.; Zhang, Z.; Liu, J.; Li, X.J.L. Climate Change and Diurnal Warming: Impacts on the Growth of Different Vegetation Types in the North–South Transition Zone of China. Land 2022, 12, 13. [Google Scholar] [CrossRef]
- IPCC. Intergovernmental Panel on Climate Change Guidelines for National Greenhouse Gas Inventories; IGES Press: Tokyo, Japan, 2006; p. 367. [Google Scholar]
- Cole, M.B.; Augustin, M.A.; Robertson, M.J.; Manners, J.M. The science of food security. NPJ Sci. Food 2018, 2, 14. [Google Scholar] [CrossRef] [PubMed]
- Fujimori, S.; Wu, W.; Doelman, J.; Frank, S.; Hristov, J.; Kyle, P.; Sands, R.; Van Zeist, W.-J.; Havlik, P.; Domínguez, I.P. Land-based climate change mitigation measures can affect agricultural markets and food security. Nat. Food 2022, 3, 110–121. [Google Scholar] [CrossRef] [PubMed]
- Huang, X.; Yang, F.; Fahad, S. The impact of digital technology use on farmers’ low-carbon production behavior under the background of carbon emission peak and carbon neutrality goals. Front. Environ. Sci. 2022, 10, 1002181. [Google Scholar] [CrossRef]
- Zhou, S.; Hao, F.; Yin, Y.; Bing, L.; Wang, J.; Ma, M.; Zhang, W. Accounting and driving factors of carbon emission from cultivated land utilization in Northeast China. Chin. J. Appl. Ecol. 2021, 32, 3865–3871. [Google Scholar]
- Johnson, J.M.-F.; Franzluebbers, A.J.; Weyers, S.L.; Reicosky, D.C. Agricultural opportunities to mitigate greenhouse gas emissions. Environ. Pollut. 2007, 150, 107–124. [Google Scholar] [CrossRef] [PubMed]
- Koondhar, M.A.; Tan, Z.; Alam, G.M.; Khan, Z.A.; Wang, L.; Kong, R. Bioenergy consumption, carbon emissions, and agricultural bioeconomic growth: A systematic approach to carbon neutrality in China. J. Environ. Manag. 2021, 296, 113242. [Google Scholar] [CrossRef]
- Mantoam, E.J.; Angnes, G.; Mekonnen, M.M.; Romanelli, T.L. Energy, carbon and water footprints on agricultural machinery. Biosyst. Eng. 2020, 198, 304–322. [Google Scholar] [CrossRef]
- Cui, J.; Sui, P.; Wright, D.L.; Wang, D.; Sun, B.; Ran, M.; Shen, Y.; Li, C.; Chen, Y. Carbon emission of maize-based cropping systems in the North China Plain. J. Clean. Prod. 2019, 213, 300–308. [Google Scholar] [CrossRef]
- Cui, Y.; Khan, S.U.; Deng, Y.; Zhao, M. Regional difference decomposition and its spatiotemporal dynamic evolution of Chinese agricultural carbon emission: Considering carbon sink effect. Environ. Sci. Pollut. Res. 2021, 28, 38909–38928. [Google Scholar] [CrossRef] [PubMed]
- Yadav, D.; Wang, J. Modelling carbon dioxide emissions from agricultural soils in Canada. Environ. Pollut. 2017, 230, 1040–1049. [Google Scholar] [CrossRef] [PubMed]
- Gafarov, N.; Ibrahimov, E.; Huseynov, M. Analysis the capacity of grain export potential in Ukraine, possible reasons for the decrease and development trends. Sci. Horiz. 2023, 25, 102–112. [Google Scholar] [CrossRef]
- Xiao, Y.; Ma, D.; Zhang, F.; Zhao, N.; Wang, L.; Guo, Z.; Zhang, J.; An, B.; Xiao, Y. Spatiotemporal differentiation of carbon emission efficiency and influencing factors: From the perspective of 136 countries. Sci. Total Environ. 2023, 879, 163032. [Google Scholar] [CrossRef]
- Liu, Q.; Wu, T.Y.; Tu, W.; Pu, L. Analysis on the changes of fertilization intensity and efficiency in China’s grain production from 1980 to 2019. J. Sci. Food Agric. 2023, 103, 908–916. [Google Scholar] [CrossRef] [PubMed]
- Yang, J.; Chang, J.; Konar, M.; Wang, Y.; Yao, J. The grain Food-Energy-Water nexus in China: Benchmarking sustainability with generalized data envelopment analysis. Sci. Total Environ. 2023, 887, 164128. [Google Scholar] [CrossRef] [PubMed]
- Cai, J.; Ma, E.; Lin, J.; Liao, L.; Han, Y. Exploring global food security pattern from the perspective of spatio-temporal evolution. J. Geogr. Sci. 2020, 30, 179–196. [Google Scholar] [CrossRef]
- Wang, P.; Deng, X.; Jiang, S. Global warming, grain production and its efficiency: Case study of major grain production region. Ecol. Indic. 2019, 105, 563–570. [Google Scholar] [CrossRef]
- Zhang, D.; Wang, H.; Lou, S. Research on grain production efficiency in China’s main grain-producing areas from the perspective of grain subsidy. Environ. Technol. Innov. 2021, 22, 101530. [Google Scholar] [CrossRef]
- Chang, H.; Cao, Y.; Zhao, Y.; He, G.; Wang, Q.; Yao, J.; Ren, H.; Yang, H.; Hong, Z. Competitive and synergic evolution of the water-food-ecology system: A case study of the Beijing-Tianjin-Hebei region, China. Sci. Total Environ. 2024, 923, 171509. [Google Scholar] [CrossRef] [PubMed]
- Al-Saidi, M.; Elagib, N.A. Ecological modernization and responses for a low-carbon future in the Gulf Cooperation Council countries. Wiley Interdiscip. Rev. Clim. Change 2018, 9, e528. [Google Scholar] [CrossRef]
- Xu, S.; Wang, R.; Gasser, T.; Ciais, P.; Peñuelas, J.; Balkanski, Y.; Boucher, O.; Janssens, I.A.; Sardans, J.; Clark, J.H. Delayed use of bioenergy crops might threaten climate and food security. Nature 2022, 609, 299–306. [Google Scholar] [CrossRef] [PubMed]
- Mirón, I.J.; Linares, C.; Díaz, J. The influence of climate change on food production and food safety. Environ. Res. 2023, 216, 114674. [Google Scholar] [CrossRef]
- China, N.B.O.S.O. China Statistical Yearbook; China Statistics Press: Beijing, China, 2023. [Google Scholar]
- West, T.O.; Marland, G. A synthesis of carbon sequestration, carbon emissions, and net carbon flux in agriculture: Comparing tillage practices in the United States. Agric. Ecosyst. Environ. 2002, 91, 217–232. [Google Scholar] [CrossRef]
- Cui, P.; Zhu, X.; Li, W. Analysis on the dynamic evolution and influencing factors of agricultural carbon emissions in China. World Agric. 2018, 4, 127–134. [Google Scholar]
- Zhang, G.; Wang, S. China’s agricultural carbon emission: Structure, efficiency and its determination. Issues Agric. Econ. 2014, 35, 18–26+110. [Google Scholar]
- Hu, X.; Wang, J. Estimation of livestock emissions gases discharge in China. Trans. Chin. Soc. Agric. Eng. 2010, 26, 247–252. [Google Scholar]
- Tone, K. A slacks-based measure of efficiency in data envelopment analysis. Eur. J. Oper. Res. 2001, 130, 498–509. [Google Scholar] [CrossRef]
- Chung, Y.H.; Färe, R.; Grosskopf, S. Productivity and undesirable outputs: A directional distance function approach. J. Environ. Manag. 1997, 51, 229–240. [Google Scholar] [CrossRef]
- Malmquist, S. Index numbers and indifference surfaces. Trab. De Estadística 1953, 4, 209–242. [Google Scholar] [CrossRef]
- Mcdonald, J.F.; Moffitt, R.A. The uses of Tobit analysis. Rev. Econ. Stat. 1980, 62, 318–321. [Google Scholar] [CrossRef]
- Lv, X.; Zhao, J. Study on quantitative assessment of food security in Shaanxi Province. Agric. Res. Arid. Areas 2010, 28, 219–225. [Google Scholar]
- Yang, Q.; Zhao, R.; Zhao, T.; Hu, Y.; Zhang, Y.; Zhu, R. Elationship between agricultural carbon emission efficiency and food security at county scale. Chin. J. Agric. Resour. Reg. Plan. 2023, 44, 156–169. [Google Scholar]
- Wang, S.; Kong, W.; Ren, L.; Zhi, D.; Dai, B. Research on misuses and modification of coupling coordination degree model in China. J. Nat. Resour. 2021, 36, 793–810. [Google Scholar] [CrossRef]
- Zhang, X.; Zhang, J.; Yang, C.J.S. Spatio-temporal evolution of agricultural carbon emissions in China, 2000–2020. Sustainability 2023, 15, 3347. [Google Scholar] [CrossRef]
- Rehman, A.; Ulucak, R.; Murshed, M.; Ma, H.; Işık, C. Carbonization and atmospheric pollution in China: The asymmetric impacts of forests, livestock production, and economic progress on CO2 emissions. J. Environ. Manag. 2021, 294, 113059. [Google Scholar] [CrossRef] [PubMed]
- Scarlat, N.; Dallemand, J.-F.; Monforti-Ferrario, F.; Nita, V. The role of biomass and bioenergy in a future bioeconomy: Policies and facts. Environ. Dev. 2015, 15, 3–34. [Google Scholar] [CrossRef]
- Reisinger, A.; Clark, H. How much do direct livestock emissions actually contribute to global warming? Glob. Change Biol. 2018, 24, 1749–1761. [Google Scholar] [CrossRef]
- Magazzino, C.; Mele, M.; Santeramo, F.G. Using an artificial neural networks experiment to assess the links among financial development and growth in agriculture. Sustainability 2021, 13, 2828. [Google Scholar] [CrossRef]


| Index Types | Select Data | Sources |
|---|---|---|
| Carbon emissions from agricultural production | Agricultural fertilizers | Oak Ridge National Laboratory |
| Pesticide | ||
| Agricultural film | Institute of Resoure, Ecosystem and Environment of Agriculture | |
| Diesel oil | Intergovernmental Panel on Climate Change | |
| Tilling | Wset TO [27], Cui et al. [28]. | |
| Irrigation | College of Biological Sciences | |
| Carbon emissions from animal husbandry | Gastrointestinal fermentation and fecal management of pigs, cattle, and sheep | Intergovernmental Panel on Climate Change |
| The number of pigs, cattle, and sheep and their slaughter | Hebei Statistical Yearbook Hebei Rural Statistical Yearbook National Bureau of Statistics | |
| Input indicators of agricultural production activities | Primary industry practitioners | |
| Fertilizer application rate | ||
| Total power of agricultural machinery | ||
| Sown area of crops | ||
| Output indicators of agricultural production activities | Investment in fixed assets of agriculture, forestry, animal husbandry, and fishery | |
| Total output value of farming, forestry, stock raising, and fishery | ||
| Afforestation area | ||
| Other social indicators | The number of labor force participants at the end of the year | |
| Total population |
| Carbon Emissions Source | Carbon Emission Factor |
|---|---|
| Agricultural fertilizers | 0.8956 kg CE·kg−1 |
| Pesticide | 4.9341 kg CE·kg−1 |
| Agricultural film | 5.18 kg CE·kg−1 |
| Diesel oil | 0.5927 kg CE·kg−1 |
| Tilling | 266.48 kg CE·hm−1 |
| Irrigation | 312.6 kg CE·km−1 |
| Emission Factor | Pigs | Cattle | Sheep | |
|---|---|---|---|---|
| Gastrointestinal fermentation | CH4 | 1.00 | 0.50 | 2727 |
| Adjusted carbon emission coefficient after conversion (kg CE/head/a−1) | 6.82 | 370.53 | 68.2 | |
| Manure management | CH4 | 3.00 | 5.33 | 0.32 |
| N2O | 0.53 | 1.24 | 0.66 | |
| Adjusted carbon emission coefficient after conversion (kg CE/head/a−1) | 20.46 | 36.35 | 2.18 | |
| 3.61 | 8.46 | 4.5 | ||
| Type | Criterion Layer | Index of Selection |
|---|---|---|
| Input | Manpower | Primary industry practitioners/ten thousand people |
| Fertilizer application rate/million t | ||
| Material resources | Total power of agricultural machinery/10 MW | |
| Crop sown area/10 km2 | ||
| Financial resources | Investment in fixed assets of agriculture, forestry, animal husbandry, and fishery/CNY 10,000 | |
| Output | Desirable output | Gross output value of agriculture, forestry, animal husbandry, and fishery/CNY 100 million |
| Afforestation area/10 km2 | ||
| Undesirable output | Agricultural carbon emissions/million t |
| D Value | Coordination Level | Coupling Coordination Degree | f(x) > g(y) | f(x) < g(y) |
|---|---|---|---|---|
| (0, 0.1] | 1 | Extreme incoordination | Food security lags behind | Agricultural carbon emission efficiency lags behind |
| (0.1, 0.2] | 2 | Severe incoordination | ||
| (0.2, 0.3] | 3 | Moderate incoordination | ||
| (0.3, 0.4] | 4 | Mild incoordination | ||
| (0.4, 0.5] | 5 | Basic incoordination | ||
| (0.5, 0.6] | 6 | Barely coordination | ||
| (0.6, 0.7] | 7 | Primary coordination | ||
| (0.7, 0.8] | 8 | Intermediate coordination | ||
| (0.8, 0.9] | 9 | Quality coordination | ||
| (0.9, 1] | 10 | High coordination |
| Time | SJZ | TS | QHD | HD | XT | BD | ZJK | CD | CZ | LF | HS |
|---|---|---|---|---|---|---|---|---|---|---|---|
| 2000–2001 | 0.37 | 0.22 | 0.40 | 0.28 | 0.42 | 0.50 | 0.47 | 0.57 | 0.03 | 0.17 | 0.04 |
| 2001–2002 | 1.17 | 1.02 | 1.01 | 1.43 | 0.88 | 0.77 | 1.42 | 1.31 | 1.43 | 1.93 | 7.73 |
| 2002–2003 | 2.76 | 2.47 | 2.10 | 3.75 | 3.76 | 3.13 | 1.63 | 1.13 | 35.27 | 3.59 | 4.08 |
| 2003–2004 | 1.19 | 1.06 | 1.34 | 2.12 | 0.81 | 1.13 | 0.92 | 0.93 | 1.61 | 1.24 | 1.35 |
| 2004–2005 | 1.23 | 1.36 | 1.25 | 1.31 | 0.90 | 0.59 | 0.92 | 0.10 | 1.10 | 1.14 | 1.20 |
| 2005–2006 | 1.07 | 1.50 | 1.51 | 0.96 | 1.02 | 0.96 | 0.94 | 0.98 | 0.38 | 1.23 | 0.32 |
| 2006–2007 | 1.65 | 1.38 | 1.36 | 1.36 | 1.61 | 1.48 | 1.00 | 0.95 | 1.69 | 1.43 | 1.36 |
| 2007–2008 | 1.13 | 1.69 | 1.36 | 1.17 | 1.12 | 1.22 | 1.30 | 1.13 | 2.29 | 1.21 | 0.92 |
| 2008–2009 | 1.18 | 1.50 | 1.13 | 0.69 | 0.87 | 1.15 | 0.94 | 0.97 | 1.51 | 1.77 | 0.80 |
| 2009–2010 | 1.01 | 1.00 | 1.00 | 1.00 | 1.00 | 1.00 | 1.00 | 1.00 | 1.00 | 1.00 | 1.00 |
| 2010–2011 | 1.63 | 1.04 | 1.41 | 1.94 | 0.90 | 1.25 | 1.19 | 0.95 | 1.32 | 1.32 | 2.57 |
| 2011–2012 | 1.47 | 1.27 | 1.23 | 1.33 | 1.91 | 1.02 | 1.01 | 1.01 | 1.01 | 1.68 | 1.32 |
| 2012–2013 | 1.23 | 1.20 | 0.99 | 1.17 | 1.11 | 0.96 | 1.03 | 1.10 | 1.09 | 1.04 | 1.67 |
| 2013–2014 | 1.42 | 1.00 | 1.09 | 1.02 | 0.10 | 1.12 | 0.97 | 1.01 | 1.90 | 3.10 | 1.36 |
| 2014–2015 | 1.00 | 0.98 | 1.13 | 1.08 | 0.75 | 1.02 | 0.95 | 1.02 | 2.15 | 0.91 | 0.81 |
| 2015–2016 | 0.98 | 1.05 | 1.07 | 0.10 | 1.39 | 0.89 | 1.17 | 1.07 | 0.60 | 0.86 | 1.49 |
| 2016–2017 | 0.28 | 0.69 | 1.07 | 0.80 | 0.77 | 0.85 | 1.07 | 0.84 | 0.76 | 0.64 | 0.74 |
| 2017–2018 | 1.03 | 1.01 | 1.01 | 0.91 | 0.81 | 1.27 | 0.98 | 1.01 | 0.54 | 1.27 | 0.88 |
| 2018–2019 | 1.23 | 1.14 | 1.02 | 1.27 | 1.37 | 1.40 | 0.71 | 1.24 | 1.12 | 1.26 | 1.10 |
| 2019–2020 | 0.76 | 1.03 | 0.97 | 0.95 | 1.01 | 0.85 | 0.76 | 0.91 | 0.94 | 0.60 | 0.89 |
| Parameter | Coefficient | Std. Error | Test Value (T) | p > |T| |
|---|---|---|---|---|
| X1 | 0.0031224 ** | 0.0011750 | 2.66 | 0.019 |
| X2 | 1.0001544 *** | 0. 4640236 | 3.32 | 0.005 |
| X3 | −0.9258342 | 0.5070315 | −1.83 | 0.925 |
| X4 | 0.0225762 * | 0.2350907 | 0.10 | 0.089 |
| X5 | −0.0065838 | 0.0044284 | −1.49 | 0.159 |
| X6 | −0.0004024 | 0.0002714 | −1.48 | 0.160 |
| X7 | −3.4441160 ** | 1.7890170 | −1.93 | 0.075 |
| Measures | Percentage | Index I | Index II | Measures |
|---|---|---|---|---|
| Conservation tillage | 42.63% Framing |  | Accelerate technological innovation | |
| Returning crop straw to the field | ||||
| Promote energy-saving machinery | ||||
| Application of organic fertilizer | ||||
| Adjusting the nutritional structure of animal feed | 26.93% Animal husbandry | |||
| Establish a carbon emission compensation mechanism for food production | ||||
| Utilization of livestock and poultry manure resources | ||||
Disclaimer/Publisher’s Note: The statements, opinions and data contained in all publications are solely those of the individual author(s) and contributor(s) and not of MDPI and/or the editor(s). MDPI and/or the editor(s) disclaim responsibility for any injury to people or property resulting from any ideas, methods, instructions or products referred to in the content. |
© 2024 by the authors. Licensee MDPI, Basel, Switzerland. This article is an open access article distributed under the terms and conditions of the Creative Commons Attribution (CC BY) license (https://creativecommons.org/licenses/by/4.0/).
Share and Cite
Cao, Y.; Ji, X.; Yao, J.; Xu, N.; Chen, M.; Yang, X.; Liu, Z.; Li, Z.; Mo, F. Research on Coupling Coordination of Agricultural Carbon Emission Efficiency and Food Security in Hebei Province, China. Sustainability 2024, 16, 5306. https://doi.org/10.3390/su16135306
Cao Y, Ji X, Yao J, Xu N, Chen M, Yang X, Liu Z, Li Z, Mo F. Research on Coupling Coordination of Agricultural Carbon Emission Efficiency and Food Security in Hebei Province, China. Sustainability. 2024; 16(13):5306. https://doi.org/10.3390/su16135306
Chicago/Turabian StyleCao, Yongqiang, Xinhui Ji, Jiaqi Yao, Nan Xu, Min Chen, Xueting Yang, Zihua Liu, Zhonghong Li, and Fan Mo. 2024. "Research on Coupling Coordination of Agricultural Carbon Emission Efficiency and Food Security in Hebei Province, China" Sustainability 16, no. 13: 5306. https://doi.org/10.3390/su16135306
APA StyleCao, Y., Ji, X., Yao, J., Xu, N., Chen, M., Yang, X., Liu, Z., Li, Z., & Mo, F. (2024). Research on Coupling Coordination of Agricultural Carbon Emission Efficiency and Food Security in Hebei Province, China. Sustainability, 16(13), 5306. https://doi.org/10.3390/su16135306