Article

Study on Aerodynamic Performance and Wake Characteristics of a Floating Offshore Wind Turbine in Wind–Wave Coupling Field

1
College of Electrical Energy and Power Engineering, Yangzhou University, Yangzhou 225127, China
2
College of Water Conservancy and Hydropower Engineering, Hohai University, Nanjing 210024, China
*
Authors to whom correspondence should be addressed.
Sustainability 2024, 16(13), 5324; https://doi.org/10.3390/su16135324
Submission received: 19 May 2024 / Revised: 15 June 2024 / Accepted: 19 June 2024 / Published: 22 June 2024
(This article belongs to the Special Issue Current Advances in Offshore Wind Energy for Sustainability)

Abstract

:
Floating offshore wind turbines (FOWTs) exhibit complex motion with multiple degrees of freedom due to the interaction of wind and waves. The aerodynamic performance and wake characteristics of these turbines are highly intricate and challenging to accurately capture. In this study, dynamic fluid body interaction (DFBI) and overset grid technology are employed to investigate the dynamic motion of a 5 MW FOWT. We use the volume of fluid (VOF) method and improved delayed detached eddy simulation (IDDES) model to investigate the aerodynamic performance and wake evolution mechanism for various wave periods and heights. According to the findings, the magnitude of the pitch motion increases with the period and height of the waves, leading to a decrease in both the power output and thrust; the maximum power was reduced by nearly 6.8% compared to a wind turbine without motion. The value of power and thrust reduction varies for different wave periods and heights, and is influenced by the relative speed and pitch angle, which play a crucial role. Wind–wave coupling has a significant impact on the evolution of both wake and vortex structures for FOWT. The wake shape downstream is also dynamically influenced by the waves. In the presence of wind and wave coupling, the interaction between the wind turbine and the wake is heightened, leading to the merger of two unstable vortex rings into a single, larger vortex ring. The research unveils a comprehensive picture of the offshore wind energy dynamics and wake field, which holds immense significance for the design of floating wind turbines and the optimization of wind farm layout.

1. Introduction

With the increasing global demand for renewable energy as well as research and technological progress, the development and utilization of wind energy has grown exponentially in the past decade [1,2,3]. Offshore wind power has gradually become a research hotspot owing to its high wind speed and lack of complex terrain interference. However, offshore wind energy is only partially utilized because the dynamic impact of wind and waves on turbines and wakes is unclear.
In the case of offshore wind farms, it is urgent to understand how waves affect the wake profile of turbines, and whether wave–wake interactions have any effect on wake recovery, turbulent stress, and vortex evolution [4,5]. Therefore, the interaction between the wave and wake must be characterized to fully understand the wake dynamics used for design and optimization.
In recent years, the wakes and aerodynamic characteristics of floating offshore wind turbines (FOWT) have been investigated by simulations, wind tunnels, and full-scale experiments [6,7,8]. Martin [9] carried out a series of experiments on the motion response of various floating platforms under regular and irregular waves, and investigated the aerodynamic characteristics of a 5 MW scaled-down wind turbine. Myhr and Nygaard [10] carried out a 1/40th-scale tension leg platform model experiment at the French ocean development research institute to study the free attenuation and hydrodynamic response of the platform. However, the influence of the wind turbine operation was not considered in the experiment. To solve this difficulty, Azcona et al. [11] tested an adjustable duct fan model instead of a wind turbine model on a semi-submersible platform, compared it with the results of the FAST calculation, and found that they have good consistency. Sandner et al. [12] also adopted a similar method for the 1/60th-scale semi-submersible model test. Zhao et al. [13] proposed a new type of multi column tension leg platform and conducted experiments on a 1:50 model. They redesigned wind turbine blades based on thrust similarity to solve the mechanical performance differences caused by different Reynolds numbers and prototypes in the model and obtained the aerodynamic loads of the wind turbine and the motion response of the floating platform. To study the effects of two blade models designed based on geometric similarity and thrust similarity on a floating offshore wind turbine, Chen et al. [14] placed the two types of blades on a 1:50 scale offshore code comparison collaboration continuation (OC4) semi-submersible platform and conducted coupling experiments. They found that both model methods can reflect the basic dynamic characteristics and that there are some differences in the system characteristic frequency and response amplitude. Rockel et al. [15] used a particle velocimetry system to observe the wake field of a floating wind turbine model under pitch motion, and compared it with the wake field of an engineering semi-empirical wake model. It was found that the values were between the engineering semi-empirical model and on-site measurements. Fu et al. [16,17] used particle image velocimetry (PIV) and a hot wire anemometer system to study the effects of pitch and roll motion of a FOWT on the wake field, and measured the power output of the model. Farrugia et al. [18] conducted an experimental study on the aerodynamic characteristics of a wind turbine model and found that the relative speed change between the blade and the incident air flow is the main cause of the aerodynamic characteristics change. Khosravi [19] studied the wake characteristics of a wind turbine model under different motions and found that the pitch motion had the greatest influence on the development of the wind turbine wake.
In terms of numerical simulation, the fully coupled air–water–servo–elastodynamic method [20,21,22,23] and the simplified aero-hydrodynamic method [24] have been applied to the calculation of the motion response of floating wind turbines. Traditional blade element momentum (BEM) and free vortex method (FVM) methods cannot consider viscous effects, which are crucial for calculating aerodynamic loads on wind turbine blades, towers, and hubs as well as fluid loads on floating platforms [25]. To obtain accurate aerodynamic loads, the boundary element method requires model improvement, particularly for a floating wind turbine with a more complex interaction between blades and incoming flow due to platform motion [26]. In addition, due to the inability to capture the flow separation around the platform, the ability of models based on potential flow theory to accurately predict the flow mechanism and its nonlinear dynamic characteristics is limited [27]. The application of an additional damping coefficient and the Morison equation can predict the hydrodynamic load of floating platforms; however, it is based on the assumption of uniform flow acceleration and cannot adequately describe the force that changes over time [28,29]. The application of Computational Fluid Dynamics (CFD) can overcome these difficulties. The CFD technology can effectively simulate the complex flow around a blade and obtain rich flow-field information. Ren et al. [30] simulated the aerodynamic–hydraulic coupling motion of the tension leg floating offshore wind turbine. In the simulation, the freedom of the surge motion was released and compared with the experimental results to verify the validity of the coupling simulation. Zhou et al. [31,32] studied the influence of different wave types on the dynamic response of the floating platform and found that the dynamic response caused by irregular waves and reconstructed focused waves is similar, and the floating wind turbine system has nonlinear characteristics. Leble and Barakos [33] demonstrated a coupled approach for the analysis of floating wind turbines. The CFD solver HMB2 used for blade aerodynamic performance analysis was used to simulate a 10 MW floating wind turbine through the multi-body dynamics method and the smooth particle hydrodynamics tool SPH; each component was verified separately, which proves the effectiveness of the coupling method. The results showed that the floating wind turbine is a highly dynamic system. Tran and Kim [34,35] established a numerical model for coupled simulation of OC4 semi-submersible FOWT and visualized the near wake field; they found that the heave and pitch responses maintained good consistency. Based on the OpenFOAM platform, Wang et al. and Ye et al. [36,37] conducted a series of numerical simulations to explore the aerodynamic characteristics of wind turbines under yaw conditions and found that stall phenomena occurred on the wind turbine blades during the yaw transition process, which in turn affected the service life of the FOWT. Zhang and Kim [38] used STAR-CCM+ to conduct coupling simulations on semi-submersible floating wind turbines and found that compared with land-based wind turbines, the thrust of FOWT has increased. Lin et al. [39] simulated an offshore code comparison collaboration (OC3) spar platform floating wind turbine and explored the physical characteristics of the flow field and the aerodynamic characteristics of the wind turbine. Fu et al. [40] used numerical simulation to investigate the wake characteristics and aerodynamic performance of an FOWT under pitch motion. Liu et al. [41] used sliding grid technology to study the dynamic response of the three-degrees-of-freedom compound motion of the OC4 semi-submersible floating wind turbine, including surge, pitch, and heave, and found that the surge motion significantly increased mooring line tension. Cai et al. [42,43] investigated the aerodynamic performance of FOWT under single pitch motion and the combined action of surge and pitch motion. Zhang et al. [44] proposed a smart rotor control of fatigue loads on FOWT and found that this control reduced the combined influence of wind and waves on the blades. Wang et al. [45] systematically reviewed the aerodynamic and wake characteristics of FOWT and concluded that relative velocity should be considered when calculating the aerodynamic coefficient.
As mentioned above, most studies have focused on the dynamic response of floating platforms, aerodynamic performance of FOWT, and near-wake physical flow phenomenon analysis. Few studies have been conducted on the changes in aerodynamic characteristics, the evolution of the wake vortex structure, and the influence of waves on the wake evolution of FOWT under wind–wave coupling in real sea conditions. Therefore, it is necessary to conduct further research. In this study, based on STAR-CCM+, combined with overset grid technology and the volume of fluid (VOF) method, a numerical model of aerodynamic and hydrodynamic coupling simulation for FOWT was established. The effects of wave period and height on the aerodynamic performance and wake structure of FOWT were thoroughly studied using an improved delayed detached eddy simulation (IDDES) model. It provides a reference for offshore wind turbine operation, maintenance, and wind farm layout optimization.

2. Numerical Configurations

This section describes the numerical configurations involved in this study, including the FOWT model, three-dimensional computational domain, mesh topology, governing equations, grid independence, and numerical simulation validation. The key components and parameters are described in detail below.

2.1. Wind Turbine Geometry

The simulation model used in this study is the NREL-5MW wind turbine, and the floating platform is the Hywind-Spar platform, as shown in Figure 1. The Hywind-Spar platform is a slender cylindrical pontoon with a lower structure filled with a ballast. Three loose mooring lines are fixed on the seabed, providing the main force to suppress platform surging, pitching, and rolling movements. The angle between two adjacent mooring lines is 120 . More detailed parameters of the FOWT can be found in Bae et al. and Roald et al. [46,47].

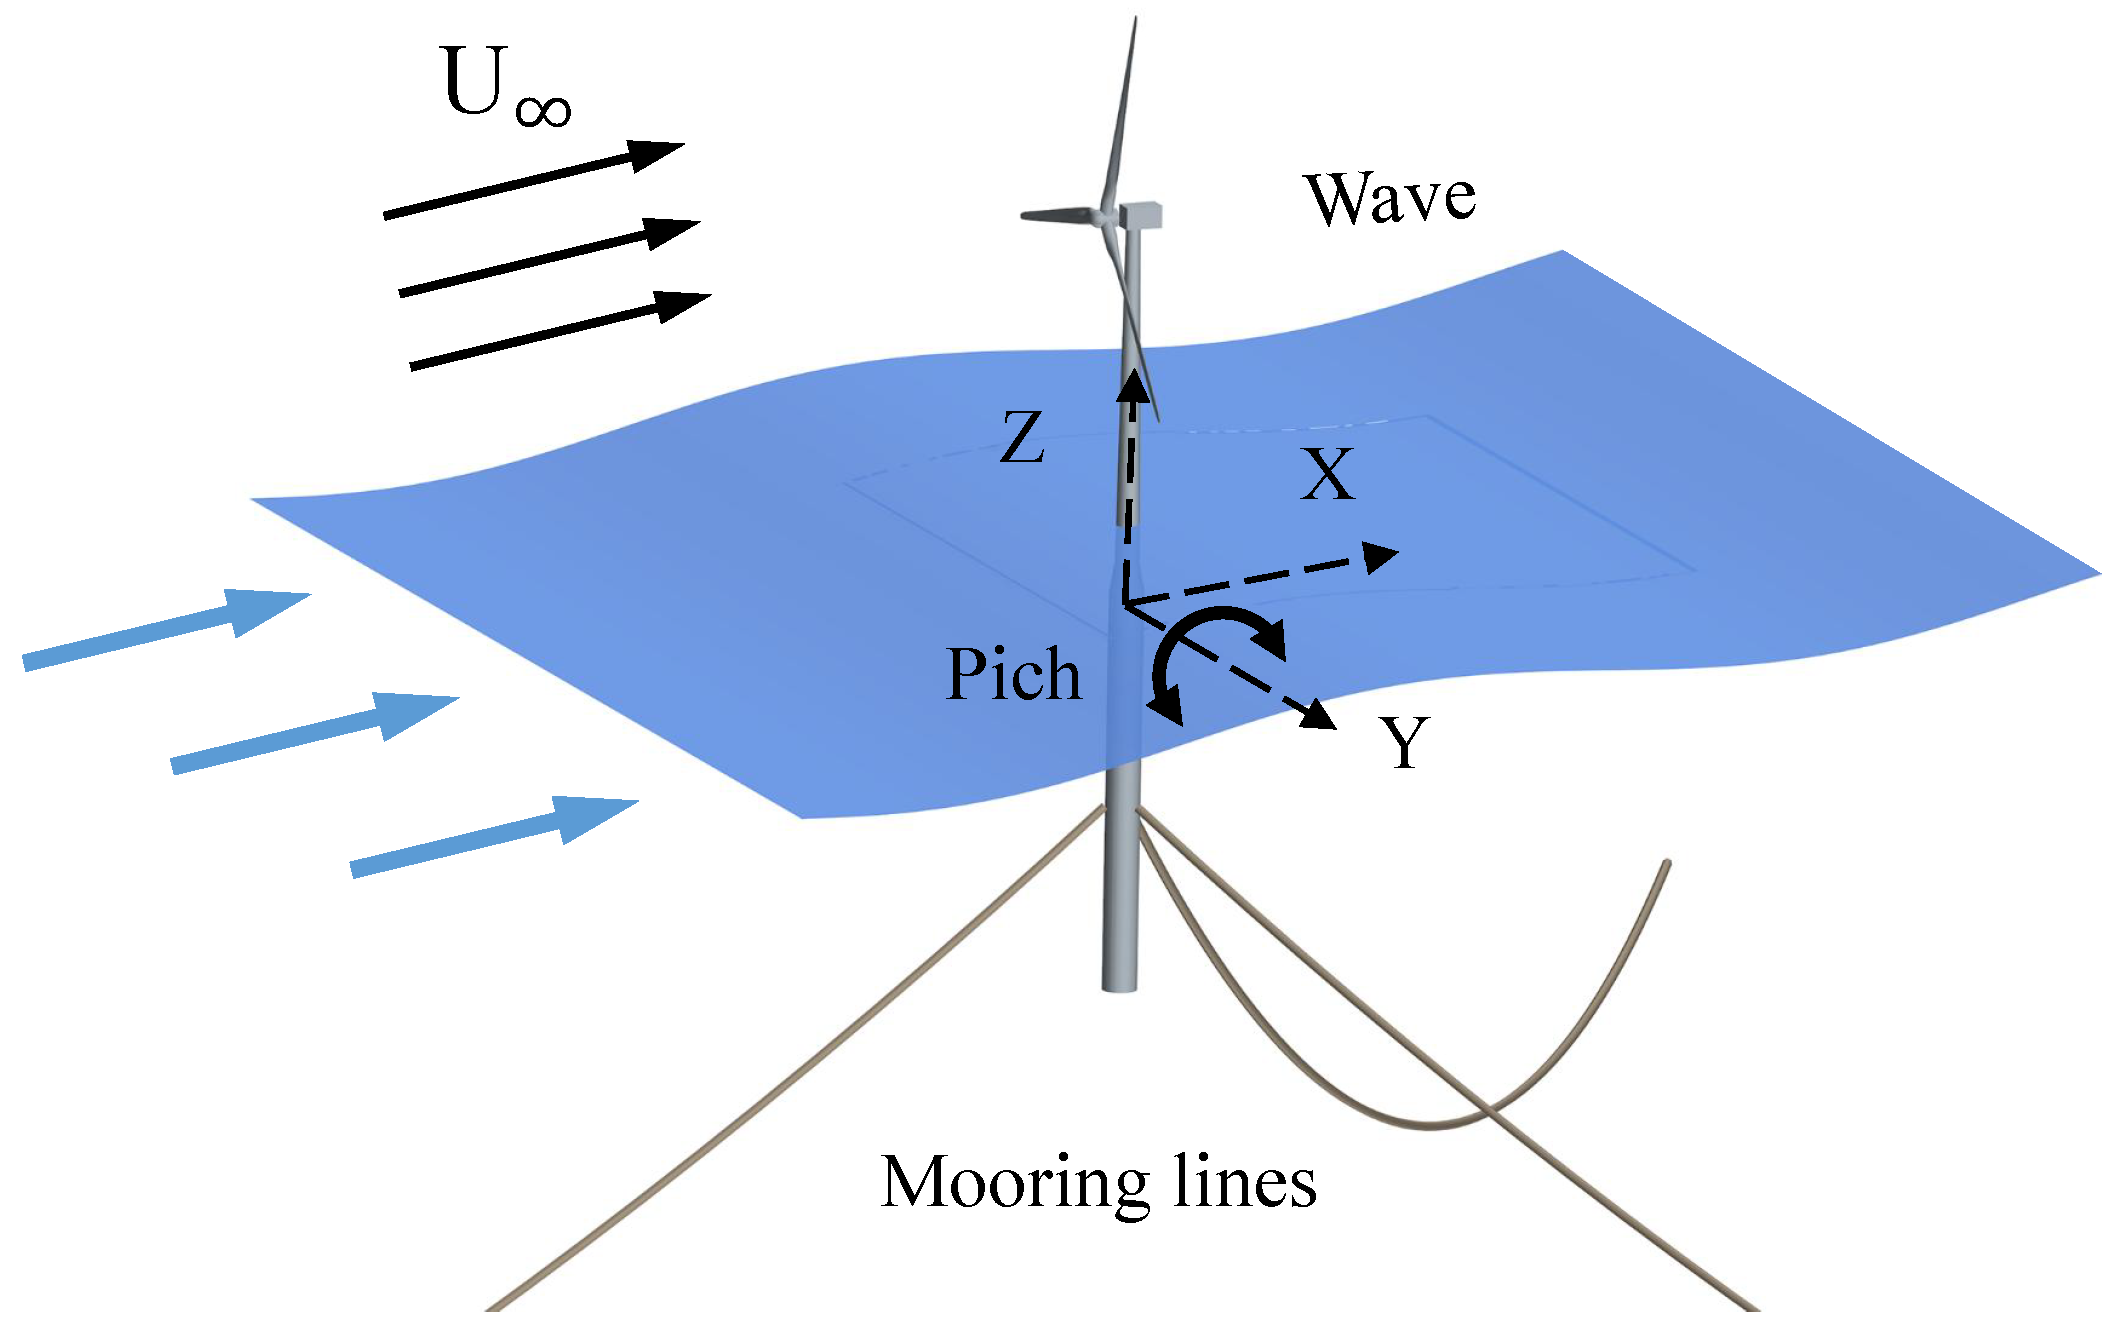
2.2. Governing Equations and Boundary Conditions

The Improved Delayed Detached Eddy Simulation (IDDES) used in this study is a hybrid model that uses the Large Eddy Simulation (LES) in the unsteady separation zone and the Reynolds-averaged Navier–Stokes (RANS) model in the near-wall zone. When simulating wake dynamics full of multiscale eddies at high Reynolds numbers, this model has the advantages of low computational complexity of the RANS model and high computational accuracy of the LES model. The turbulent kinetic energy transport equation of the IDDES is
ρ k t + ρ u j k x j = [ k x j ( μ + μ t σ ) ] x j ρ k 3 / 2 L h y b r i d + τ i j S i j
where τ i j , k, u j , μ , μ t , x j , and S i j are tensor of stress, turbulent kinetic energy, velocity, molecular viscosity, turbulence viscosity, displacement component, and mean strain rate, respectively. L h y b r i d is the length scale of the IDDES model [48]:
L h y b r i d = f d ˜ ( 1 + f e ) L R A N S + ( 1 f ˜ d ) C D E S Δ I D D E S
f ˜ d = m a x ( f b , ( 1 f d t ) )
f e = m a x ( 0 , ( f e 1 ) ) Ψ f e
L R A N S = k f β * β * ω
Δ I D D E S = m i n ( m a x ( 0.15 Δ , Δ m i n , 0.15 d ) , Δ )
where C D E S is the model coefficient in the Detached-Eddy Simulation DES model; f e , f b are the functions of the WMLES (wall-modeled LES) model; f β * is the free shear correction factor; β * is the model coefficient; ω is the unit dissipation rate; Δ m i n is the minimum distance between the center of the considered grid cell and the center of the adjacent grid cell; and Δ is the grid size.
In this study, STAR-CCM+ was used for the numerical simulation calculations and the turbulence model was applied to the IDDES model. All simulations adopted the Semi-Implicit Method for Pressure Linked Equations (SIMPLE) algorithm and achieved the relationship between momentum equation and continuity equation through the prediction correction method. The convection term adopts a second-order upwind scheme. In unsteady simulation, each time step corresponds to the blade rotation of 2 , time dispersion is discretized using a second-order central difference scheme, and the maximum number of iterations for spatial and temporal terms is set to 20 [49,50]. The physical model selects the volume of fluid (VOF) wave, multiphase flow, dynamic fluid interaction, fluid domain volume, gravity, and adaptive mesh. The inlet boundary of the whole computational domain is set as the velocity inlet u = 11.4 m/s, and the uniform incoming flow conditions and wave types are given according to the parameters of VOF. The outlet boundary is a pressure outlet. A wave damping zone is added at the outlet boundary to reduce the impact of wave reflection and shock on the boundary [51]. The far-field surface in the computational domain is set as symmetry. Dynamic fluid body interaction (DFBI) technology was used to simulate the motion response of the FOWT under wave action. The rotation of the wind turbine is superimposed onto the DFBI motion through the superimposed rotation technology to realize the composite motion of the blade rotation and the pitch motion of the floating platform. In addition, considering the influence of the mooring lines, the three catenaries of the floating platform are modeled using the catenary coupling function. The catenary coupling function simulates the elastic quasi-static catenary suspended between the two ends. The catenary bears its own weight caused by the gravity field, thereby providing a force to fix the floating platform.

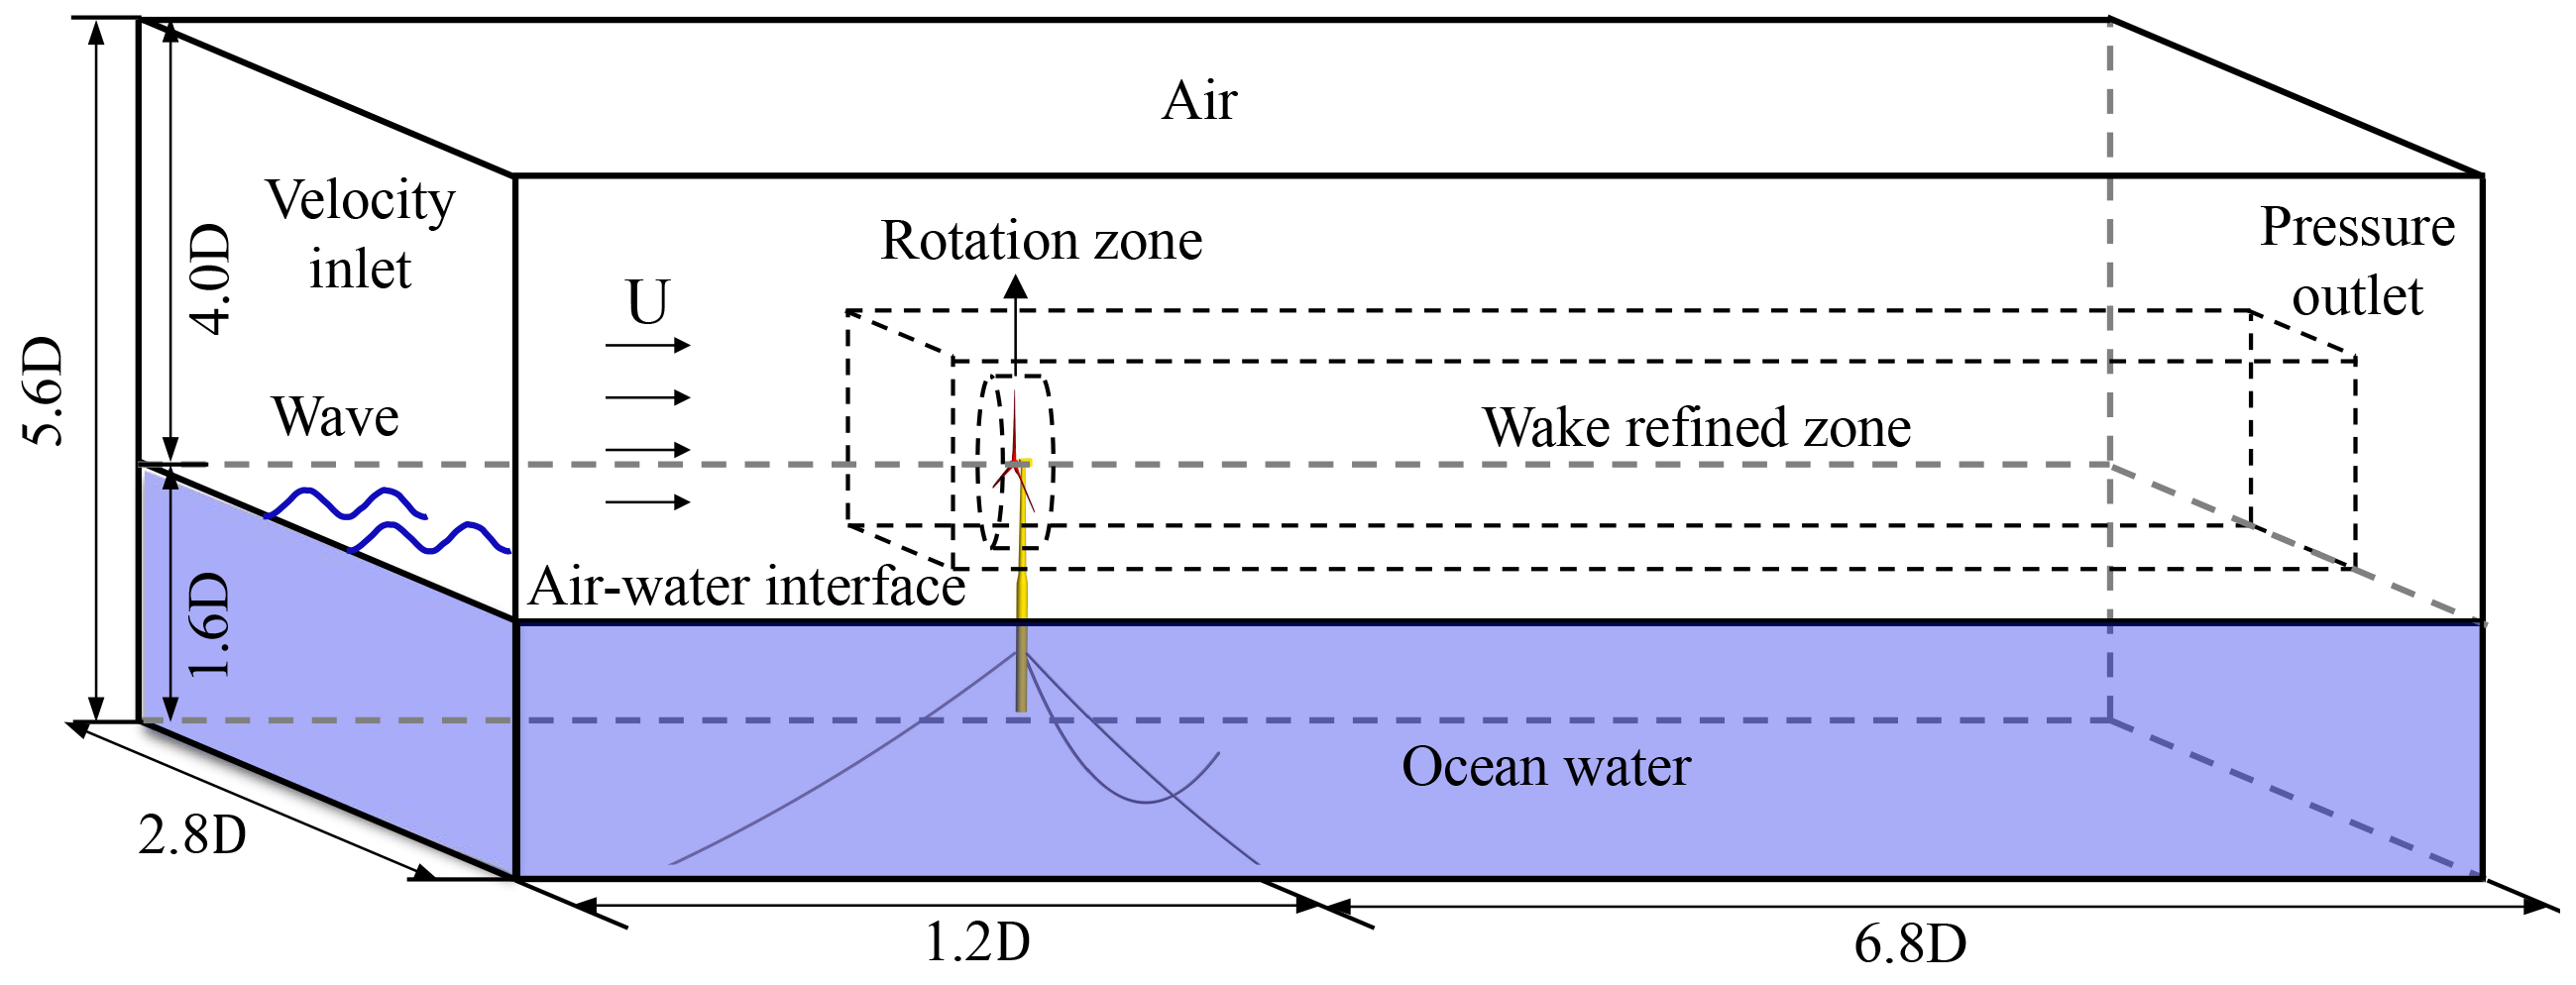
2.3. Computational Domain and Grid Topology

The entire computational domain is 8 D long, 2.8 D wide, and 5.6 D high, where D = 126 m is the diameter of the wind turbine rotor (Figure 2). Along the elevation direction, the calculation domain is mainly divided into two regions: the air field region and the ocean water region. In addition, the air flow field region is further subdivided into the rotation zone, wake-refined area, and other remaining zones.
A more detailed grid generation strategy for the computing domain is shown in Figure 3. The use of overset grid technology effectively solves the passive dynamic motion problem of FOWT under wind–wave coupling. Because the interpolation difference at the boundary of the overset grid and the external grid will affect the accuracy of the calculation results, the sizes of the overset grid and background grid should be consistent. In this study, Adaptive Mesh Refinement (AMR) technology is used to increase the interpolation accuracy at the boundary of the overset grid. To improve the interpolation efficiency and grid quality, the division of the entire flow field adopts cutting volume grids. To obtain sufficiently accurate aerodynamic characteristics of the blade, local refinement was performed on the grid of the leading edge, surface, and trailing edge of the blade. Twenty layers of mesh were divided on the surface boundary layer of the blade, with a first layer height of 0.02 mm and a mesh stretching rate of 1.2; the y-plus is less than 1, which meets the standard requirements of the IDDES turbulence model (Figure 3e). The maximum grid sizes of the stationary zone and pitching zone are 16 m and 4 m, and the basic size is 1 m for local refinement, as well as for the rotation zone (Figure 3a). The basic size of the wake densification zone is 2 m, and the grid near the free liquid surface is densified to simulate wave propagation accurately. More detailed grid information is presented in Table 1. Four grid division cases were selected to verify the grid independence. Considering the calculation cost and accuracy of the results, case 3—with a minimum grid size of 0.02 m and total number pf 17.61 million—was finally selected as the numerical simulation of this study.

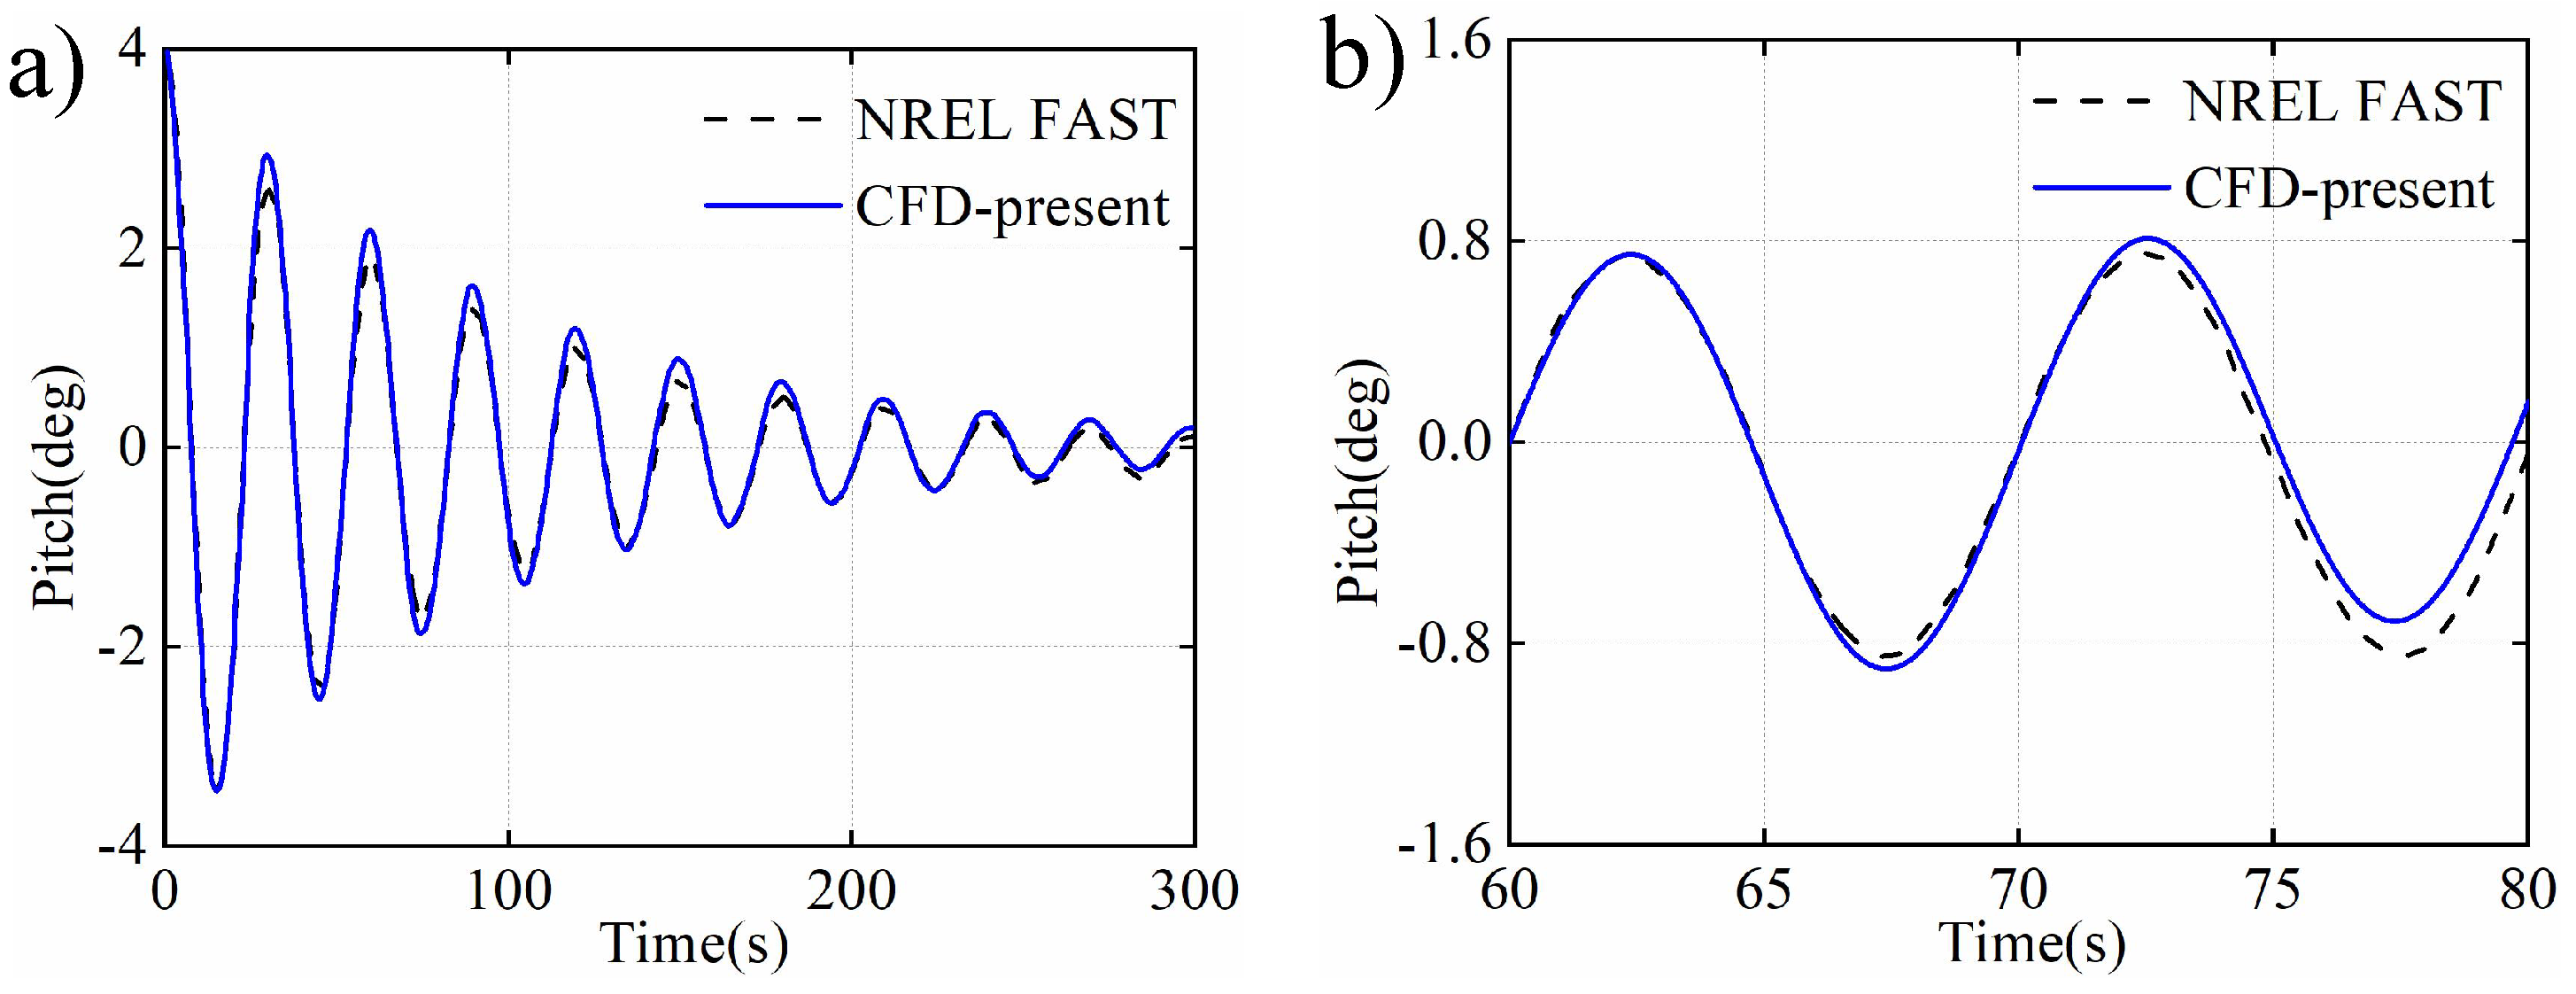
2.4. Numerical Validation

In this study, the aerodynamic performance and wake characteristics of floating wind turbines were considered; therefore, verifying the motion response of the floating platform under wind–wave coupling is essential. The independence of the grid has been verified [40]. Here, it will be further explored. The dynamic response of the floating platform was captured. The platform pitch displacement and velocity at various times are shown in Figure 4.
As discussed above, the hydrodynamic damping characteristics of the floating platform were verified using a free attenuation motion simulation. The computing object is only the floating platform, regardless of incoming wind and waves. After providing a certain initial angle, the floating platform was freely released. The results show that the pitch motion is in good agreement with the calculation results of FAST (Figure 5a). In addition, the motion response of the floating wind turbine under regular wave action was verified. The object was a floating platform with a tower. Let the wave be an Airy’s regular wave with wave height H = 6 m and period T = 10 s. It was found that the simulation data have the same periodic fluctuation and amplitude as the FAST calculation results [52,53], which verifies the feasibility of the wind–wave coupling simulation method adopted in this study (Figure 5b).

3. Results and Discussion

Variations in the wave period and height significantly affect the motion response of the floating platform. Therefore, in this section, we discuss the change laws of the aerodynamic performance and wake characteristics of floating wind turbines under pitch motion caused by waves of different periods and heights.

3.1. Aerodynamic Performance

Generally, a common wave height in the far sea ranges from 0.5 m to 8 m, and it can reach 20 m or even higher under typhoons. In this study, wave heights of 4 m, 7 m, and 10 m were selected for the comparative analysis. Figure 6a shows the variation in the pitching amplitude of the FOWT under different wave periods with the same wind speed u = 11.4 m/s and the same wave height H = 10 m. It is found that the amplitude of pitch motion increases with the increase in wave period, such as T 1 = 10 s, amplitude A 1 ( 7 . 9 5 . 0 ) ; T 2 = 12.5 s, amplitude A 2 ( 7 . 9 3 . 5 ) ; and T 3 = 15 s, amplitude A 3 ( 7 . 9 3 . 0 ) . The floating wind turbine pitches back at the same maximum angle, about 7 . 9 , shown by the green line in Figure 6a, and the pitching balance position moves forward with the wave period increasing. Due to the influence of wave load, the pitch motion period of wind turbine is consistent with that of wave. In addition, the dynamic responses of the floating wind turbines with different wave heights are shown in Figure 6b. For the same wave period T = 10 s, three different wave heights are set to H 1 = 4 m, H 2 = 7 m, and H 3 = 10 m. From the calculation results, it is evident that the pitching period of the FOWT is exactly the same as that of the ocean wave. Waves with a smaller wave height have less effect on the dynamics of the platform, such as H 1 = 4 m, resulting in an amplitude A ( 5 . 6 4 . 5 ) . As the wave height increases, the pitching amplitude increases: H 2 = 7 m, A ( 6 . 8 4 . 5 ) and H 3 = 10 m, A ( 7 . 9 4 . 5 ) . The higher the wave height, the larger the energy carried and the greater the load and energy transferred to the floating wind turbine. However, it is interesting to note that the change in wave height has no effect on the maximum upwind amplitude of the floating wind turbine. The green line in Figure 6b indicates this result. The pitching balance position of the FOWT moves backward as the wave height increases.
The changes in wind turbine power and thrust over time under different wave periods are shown in Figure 7. Compared to those under non-pitching motion, the power and thrust increase and decrease regularly, which is the same as the pitching response of the floating platform. At the same time, due to the tower shadow effect, the power and thrust of the FOWT exhibit a periodic fluctuation of 0.33 HZ, which is consistent with the frequency of a single blade passing through the tower, as shown by the rectangular dotted box in Figure 7. The average power output of the wind turbine is 4.88 MW, 4.75 MW, and 4.89 MW at 10 s, 12.5 s, and 15 s wave cycles, respectively, while the average power output is 5.10 MW without pitching motion (Figure 7a). The results show that pitch motion significantly reduces the average power output, with a maximum reduction of 6.8%. As the floating wind turbine tilts at a certain angle along the incoming flow direction under the action of wind–wave coupling, the windward area of the wind turbine is reduced. In addition, it was found that with an increase in the wave period, the output work first decreased and then increased, showing an irregular change. This is because the main factors affecting the power output of floating wind turbines are the relative speed and tilt angle. The wave period is short, the frequency is high, and the relative speed between the blade and incoming flow increases, resulting in an increase in the power output. However, this also leads to an increase in the tilt angle of the FOWT and a decrease in the windward area, which in turn reduces the power of the wind turbine. Therefore, whether the power output increases depends on which of the two factors dominates or not. Under wind and wave coupling, the average thrust of the FOWT under pitching motion is smaller than that without motion, see Figure 7b.
Figure 8 shows the power and thrust changes of the floating wind turbine under different wave heights. The results show that the change period of power and thrust is consistent with that of wind wave. With an increase in wave height, the maximum power and thrust of the wind turbine increase, while the minimum power and thrust decrease. In addition, it can be seen from Figure 8a that the wave load and pitch angle velocity of the platform show an increasing trend with increasing wave height. At wave heights of 4 m, 7 m, and 10 m, the average power output of the wind turbine are 4.71 MW, 4.72 MW, and 4.88 MW, respectively, which are much smaller than the average power output of 5.1 MW without pitching motion. In the range of wave height from 4 m to 10 m, the average power output of wind turbines shows an overall increasing trend as the wave height increases.
Figure 9 shows the pressure distribution of the same section r / R = 0.9 of the blade in a pitch period under different wave periods. It is found that when the FOWT is pitched against the wind to the equilibrium position, t = 0 T, the pressure difference between the pressure surface and the suction surface is the largest, and the flow separation occurs at the position near the trailing edge of the suction surface, see the rectangle dotted box in Figure 9a. When the FOWT is pitched along the wind direction to the vertical equilibrium position, t = 1 / 2 T, with an increase in the wave period, the pressure difference between the upper and lower surfaces of the blade continues to decrease and reaches the minimum value under the condition of the maximum wave period, as shown in Figure 9c. This is because the blade is affected by the additional velocity caused by the pitching motion during rotation. When the wind turbine is set to its maximum pitch, the blade experiences minimal impact from the added velocity resulting from the pitching motion. Consequently, there is little variation in the pressure distribution across the blade surface for different wave periods, as illustrated in Figure 9b,d. In addition, it can also be found from Figure 9a that dynamic stall is more likely to occur under conditions with a longer wave period. The pitching motion causes the blade to continuously experience a dynamic stall, resulting in unstable vibration and requiring the blade to bear more loads.
The pressure distribution of the blade section (r/R = 0.9) in the pitch period at different wave heights is shown in Figure 10. With the increase in wave height, the pressure difference between the pressure surface and suction surface continues to increase, reaching the maximum value under the condition of maximum wave height H = 10 m, see Figure 10a. When the wind turbine pitch reaches the maximum amplitude position (t = 1/4 T, 3/4 T), the additional speed generated by the pitch motion is zero, and the interaction between the blade and wake is weakened. Therefore, the pressure distribution of the blade section under different wave heights is essentially the same, as shown in Figure 10b,d. Different from the effect of wave period, when the wind turbine moving to the balance position (t = 2/4 T), the pressure on the suction surface changes significantly; with the increase in wave height, the pressure on the suction surface increases, see Figure 10c. However, from 4 m to 10 m wave height, the average difference between the pressure surface and the suction surface in a pitching period of the FOWT increases with the increase in wave height, resulting in a larger power output. This indicates that a larger wave height can increase the variation range of the aerodynamic load on the periodically changing blade surface and increase the complexity of the fatigue load acting on the blade.
To study the influence of the wind–wave coupling motion on blade aerodynamics in more detail, the pressure distribution of different sections of the same blade in the entire pitch period under the condition of wave height H = 10 m and wave period T = 10 s is given, as shown in Figure 11. The pressure difference between the pressure surface and suction surface in the section near the tip was larger than that in the middle section of the blade. In the pitch period [2/4 T, 3/4 T], the difference is particularly obvious, as indicated by the arrows in Figure 11b–d, because the additional speed caused by the pitch motion varies linearly along the blade span.

3.2. Wake Characteristics

Figure 12a1–c1 show the streamwise velocity distribution at t = 0 T when the wave periods are 10 s, 12.5 s, and 15 s, respectively. The wake profile reveals an area of reduced momentum behind the FOWT, which slowly recovers downstream. In all three images, regions of high velocity are also visible near the waves. However, in Figure 12a1, the region extends a shorter lateral distance than those in Figure 12b1,c1. Refer to the dotted rectangular box in the figure. This difference is due to the fact that the short-period ( T 1 = 10 s), high-frequency waves in Figure 12a1 damage the inflow more than the long-period low-frequency waves in Figure 12b1 ( T 2 = 12.5 s) and Figure 12c1 ( T 3 = 15 s). It is worth noting that the shorter the wave period, the shorter the high-speed region extension.
Figure 12a2 shows short wavelengths ( T 1 = 10 s), followed by Figure 12b2. Figure 12c2 shows long wavelengths ( T 3 = 15 s), where t = 1 / 4 T. In the case of the shorter wavelength in Figure 12a2, multiple peaks and troughs can be observed. Most of the high-speed regions shown are distributed on both sides of the wave crest. Crests and troughs act as moving obstacles to incoming airflow, causing high and low speeds in these areas. Note that the high-speed region near the wave position is significantly greater than the fluid velocity above the floating wind turbine hub, as shown in the ovals in Figure 12a2,b2. The wave periodic velocity profiles are shown in Figure 12c1–c4. As the wave moves, the wake deficit continues to be affected by pumping characteristics. When the crest is near the turbine, it displaces the water flow upward, causing the speed near the crest to increase and the strength of the wake to decrease. This speed follows that of the wave as it moves downstream. However, it has also been observed that the downstream wake shape is dynamically modulated by waves, and this pumping behavior leads to faster wake recovery.
The wave and wake velocities at different time instants and wave heights are shown in Figure 13. Figure 13a1–c1 show the wake field velocities of the FOWT with wave heights of H 1 = 4 m, H 2 = 7 m, and H 3 = 10 m, and it was found that in the near-wave region, waves have a significant influence on the velocity of the wake field. When the amplitude is low ( H 1 = 4 m) and in the region near the lower blade tip, the wind is affected by waves into a band and flows downstream, as shown in Figure 13a1; however, when the amplitude is high ( H 3 = 10 m), the band is destroyed. Due to the greater height of a wave, it transfers more energy, which subsequently causes the wind speed near the surface to fluctuate and move downstream as the wave progresses.
The velocity distribution is the performance of the dynamic wake vortex structure after time averaging. To investigate the cause of the velocity distribution, it is necessary to analyze the wake vorticity of the wind turbines in detail. Figure 14 shows the instantaneous vorticity of the FOWT under uniform wind–wave coupling. These instantaneous diagrams clearly show the existence of a strong interaction between the blades and wake. It can be observed that there is a complex wake at the blade root, hub, and tower. At the same time, due to the existence of the tower, there is a strong unsteady flow interaction between the tip vortex generated under the hub and the downstream tower. Compared with Figure 14a1–c1, it can be seen that the motion mode of the tip vortex is affected by the wave period, and the change in the wave period affects the space-time distribution of the vorticity. Under a small wave period ( T 1 = 10 s), the stable tip vortex ring can be maintained at a distance of 4.6 D downstream of the FOWT. With an increase in the wave period, the stability of the tip vortex ring gradually decreases. When T 3 = 15 s, a stable tip vortex ring could only be maintained at a distance of 3.2 D downstream. This is because, under a smaller wave period, the interaction between the wind turbine and the wake is higher and stronger, and the two unstable vortex rings merge into a large vortex ring. The appearance of this phenomenon intensifies the wake change, and the final mixing process of the wake region and free flow are delayed.
As the wave moves downstream, the lower tip vortex in the wake region follows the wave and is dynamically squeezed by the wave, and the lower tip vortex deviates towards the hub center in the process of moving downstream with the wave. In addition, the downstream wake vortex shape is dynamically modulated by waves. Compared to Figure 14c1 (wave period T 3 = 15 s), Figure 14a1 (wave period T 1 = 10 s) shows that the envelope line of the vortex band near the wave is closer to the hub height of the wake field. The results reveal that the shorter the wave period, the greater the dynamic disturbance in the wake region.
Figure 15 shows the wake vorticity at different times for various wave heights. It can be seen that the blade tip vortex above the hub is stable, because it is not interfered with by the ocean wave boundary layer. The tip vortices below the hub must dissipate at a longer distance owing to their proximity to waves. The pitch motion caused by the wave has a significant influence on the development of the vortex. During the upwind pitch period t ∈ (0 T 1/4 T), the gap distance between the first and second circles of the tip vortices increased from 0.17 D to 0.18 D, as shown in Figure 15c1,c2. During the downwind pitch period t ∈ (1/4 T 3/4 T), the gap between the blade tip vortices decreased continuously and reached the minimum value of 0.14 D in the pitch period when the turbine reached the maximum amplitude position, as shown in Figure 15c4. Compared with Figure 15a4–c4, it can be seen that with the increase in wave height, the pitch angle increases at the same time, so the distance between the first and second circles of the blade tip vortex is reduced from 0.15 D to 0.13 D. As previously discussed, the larger the wave height, the larger the wave energy, and the impact of the wave momentum interference on the wake region is evident. See the wake area envelope in Figure 15a1–c1.
To study the evolution characteristics of the wake vortex zone of the floating wind turbine, the streamwise wake velocity contour with the isosurface of Q-criterion (Q = 0.01) showing hub and tip vortices at different instantaneous times and different wave periods is given. This is illustrated in Figure 16. The wake of a wind turbine is mainly composed of three intertwined root vortices and three spirally developing tip vortices. Figure 16a1 shows that the wake zone of the FOWT can be divided into three zones: the near-wake stable zone (0–0.5 D), middle transition zone (0.5D–4.6 D), and far-wake dissipation zone (after 4.6 D). The near-wake zone (0–0.5 D) was dominated by stable tip and root vortices. The tip vortex had a smooth cylindrical structure. At x = 0.5 D, due to the pitch motion caused by waves, the strong interaction between the blade and the wake reduces the distance between the vortices and causes the smooth cylindrical tip vortices to merge with each other. In the intermediate transition zone (0.5 D–4.6 D), the enhanced secondary tip vortex structure moves steadily downstream with the wind. In the far-wake region (after 4.6 D), the tip and hub vortices eventually evolve into unstable vortices and dissipate gradually. By comparing Figure 16a1–c1, it is found that the increase in the wave period shortens the wake length in the near-wake region and the transition region, and accelerates the development of the vortex structure in the far-wake region. In addition, the position where the wake tip vortex structure begins to merge in the pitching process is not invariable and ranges from 0.5 D to 1.1 D in one wave period, as shown in Figure 16a1–a4.
As discussed previously, variations in the wave height change the pitch amplitude of the floating wind turbine. Figure 17 shows the side view angle of the isosurface at different instantaneous times and different wave heights (Q Criterion = 0.01). Compared with Figure 17a1–c1, it can be observed that with the increase in wave height, the wave further interferes with the lower blade tip vortex (see the dashed box in the figure), the interaction between the blade and wake is also enhanced; see the rectangular dotted box, and the large-scale vortices in the wake transition region are more robust and powerful in the movement of higher wave heights. Large-scale vortices play a major role in momentum transfer and turbulent energy transfer; therefore, the change in wave height affects the recovery of wake velocity and the distribution of turbulent kinetic energy. In addition, further observations show that the formation process of the vortex structure is also different in pitch motion with different wave heights. At a small wave height H 1 = 4 m, the interaction between the blade and wake is weak, and the vortex structure loses stability in the transition region and forms a new wake structure after development. At higher wave heights of H 2 = 7 m and H 3 = 10 m, the interaction between the blade and the wake causes the adjacent tip vortices to merge and wind into large-scale vortices. This stronger vortex structure can be retained in the transition region (Figure 17a2–c2).

4. Remarks and Conclusions

The motion of sea waves causes the floating platform to experience complex multi-freedom motions, which alter the conditions of the interaction between the blades and the incoming flow, and make the aerodynamic performance and wake structure of the floating wind turbine more intricate. Additionally, it is challenging to capture the dynamic characteristics, wake characteristics, and vortex structure evolution of FOWT under wind and wave coupling. Therefore, in this study, the dynamic fluid body interaction (DFBI) method and volume of fluid (VOF) technology were employed to simulate the passive motion of a real-size 5 MW floating wind turbine under wind–wave coupling, and the IDDES model was utilized to capture the wake vortex structure. The variation law of the aerodynamic performance and the evolution mechanism of the wake structure of FOWT with different wave periods and wave heights were investigated. The results were in good agreement with the expectations. The primary findings of the study are as follows:
(1)
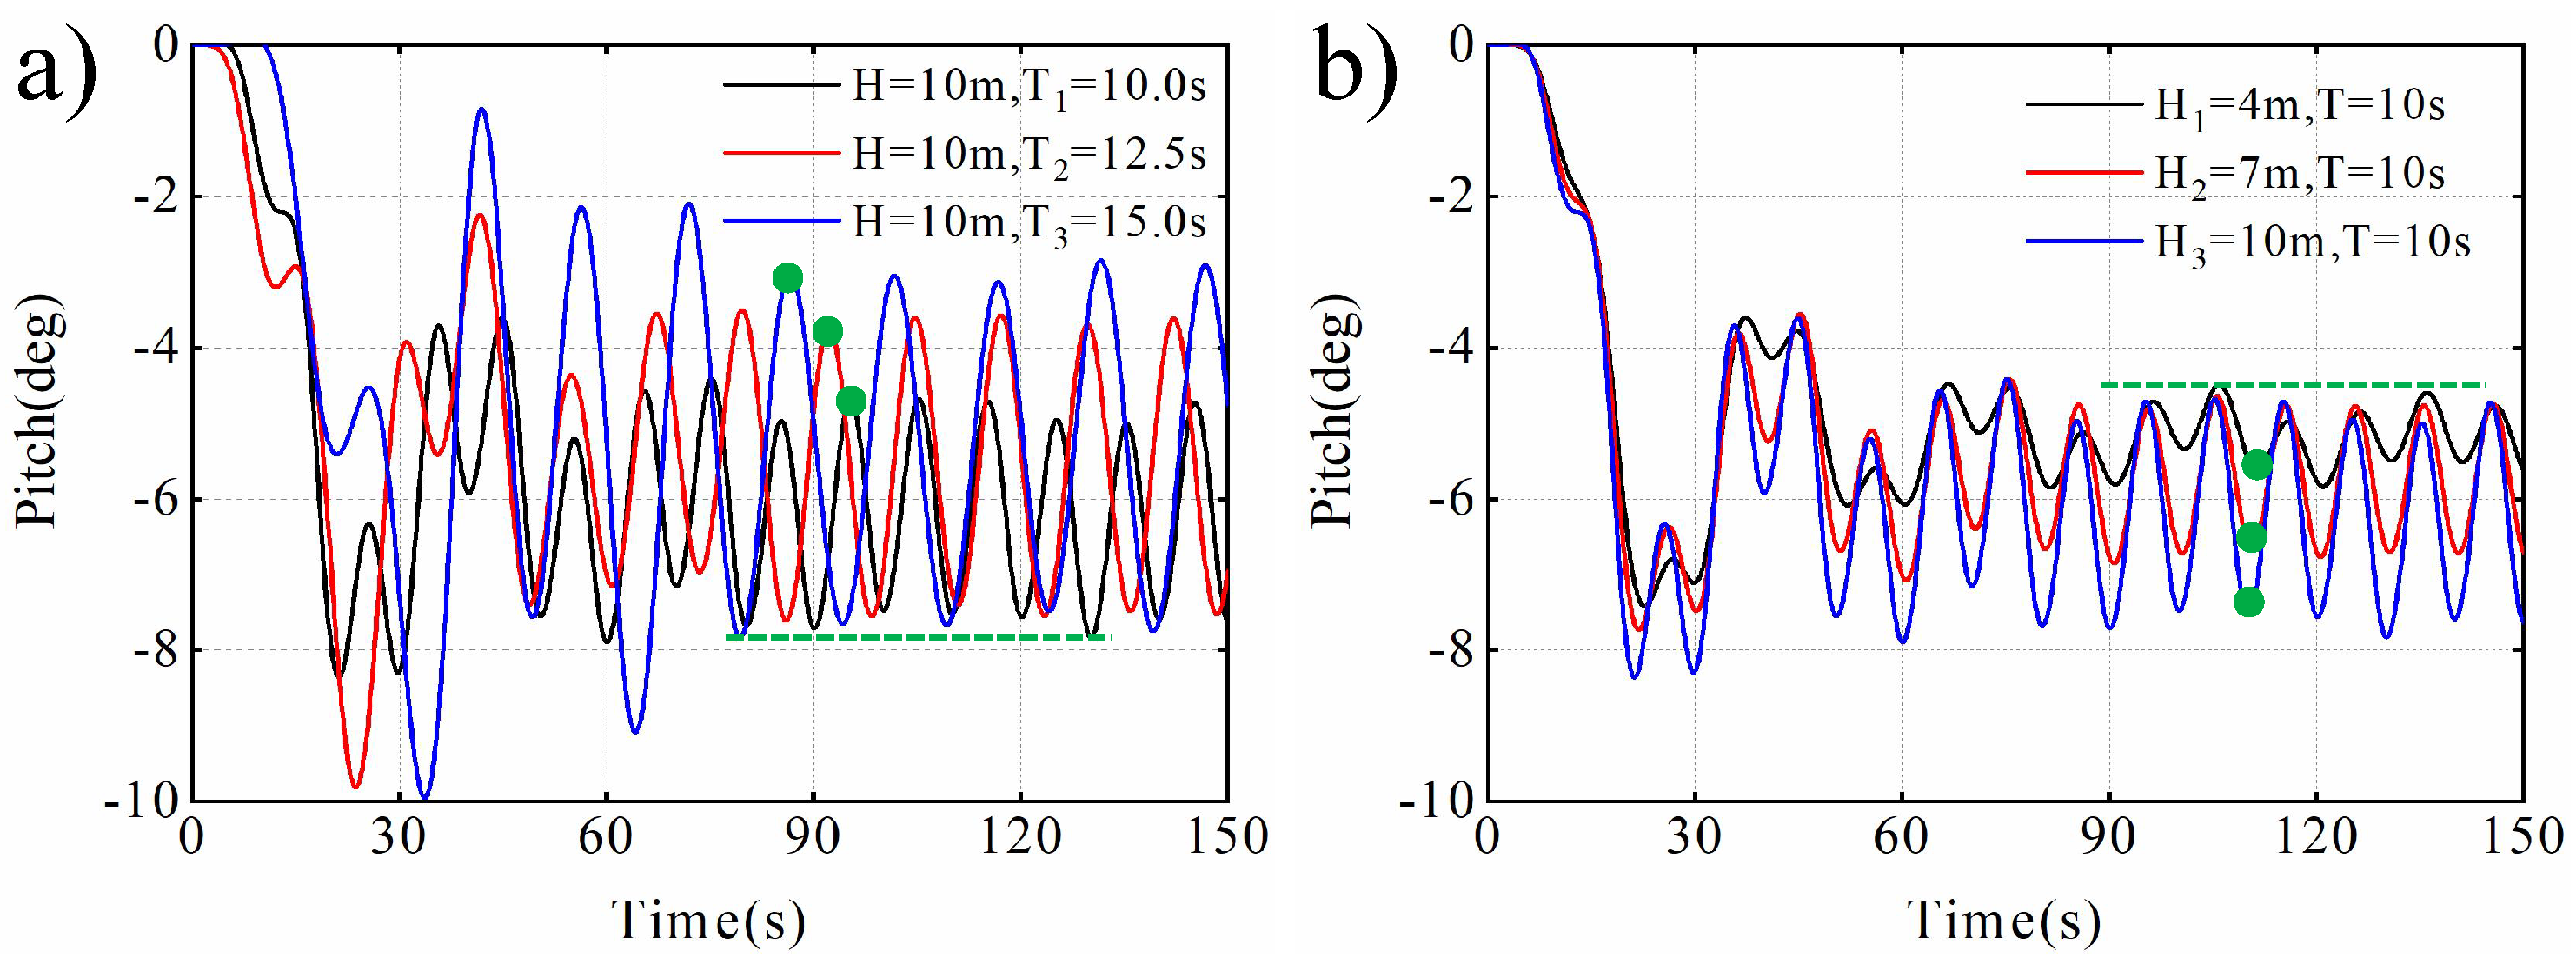
The effect of wave period on the amplitude and period of pitch motion of a floating platform was substantial, although it did not impact the maximum angle of pitch motion at the same wave height. On the other hand, changes in wave height had a considerable impact on both the amplitude and maximum angle of pitch motion at the same wave period.
(2)
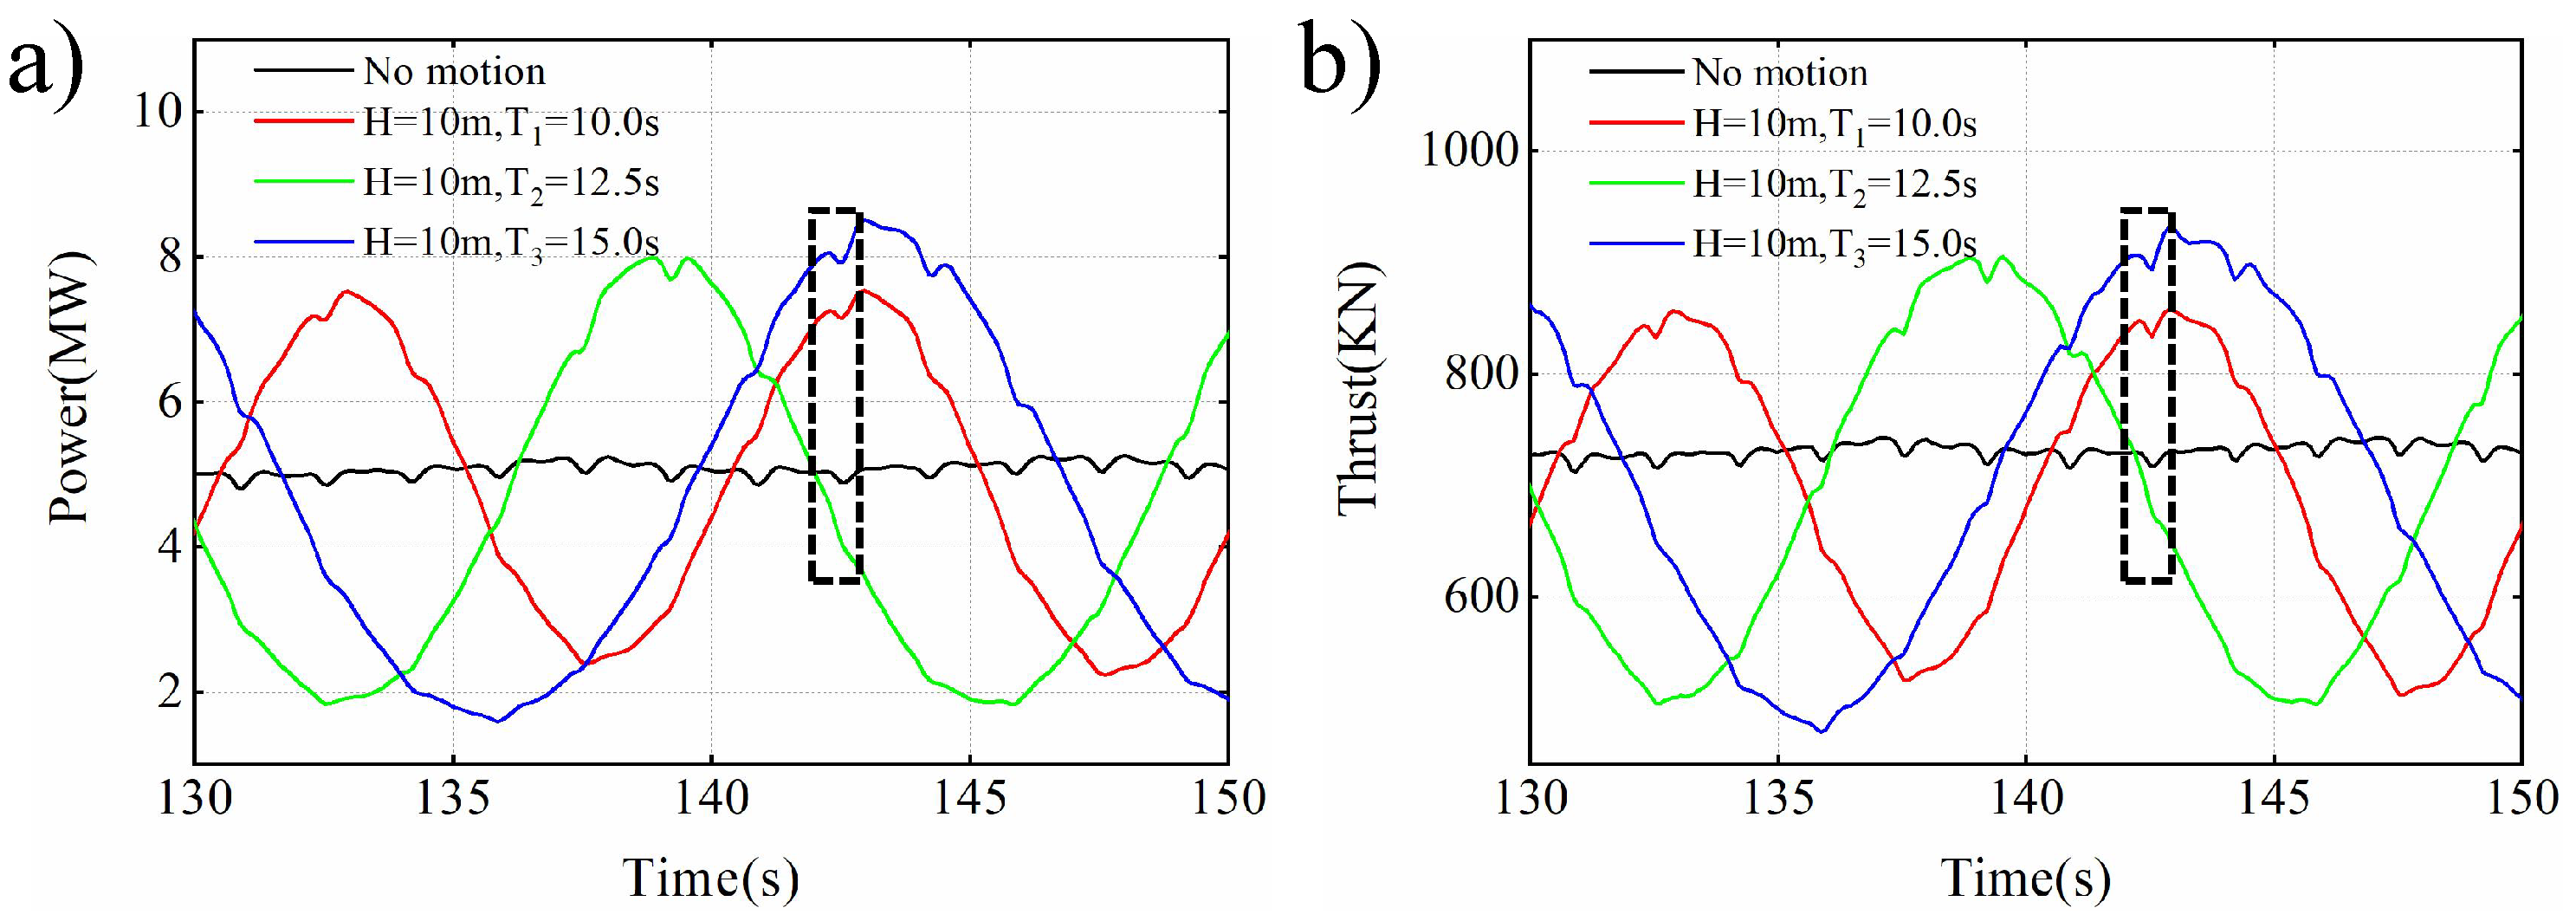
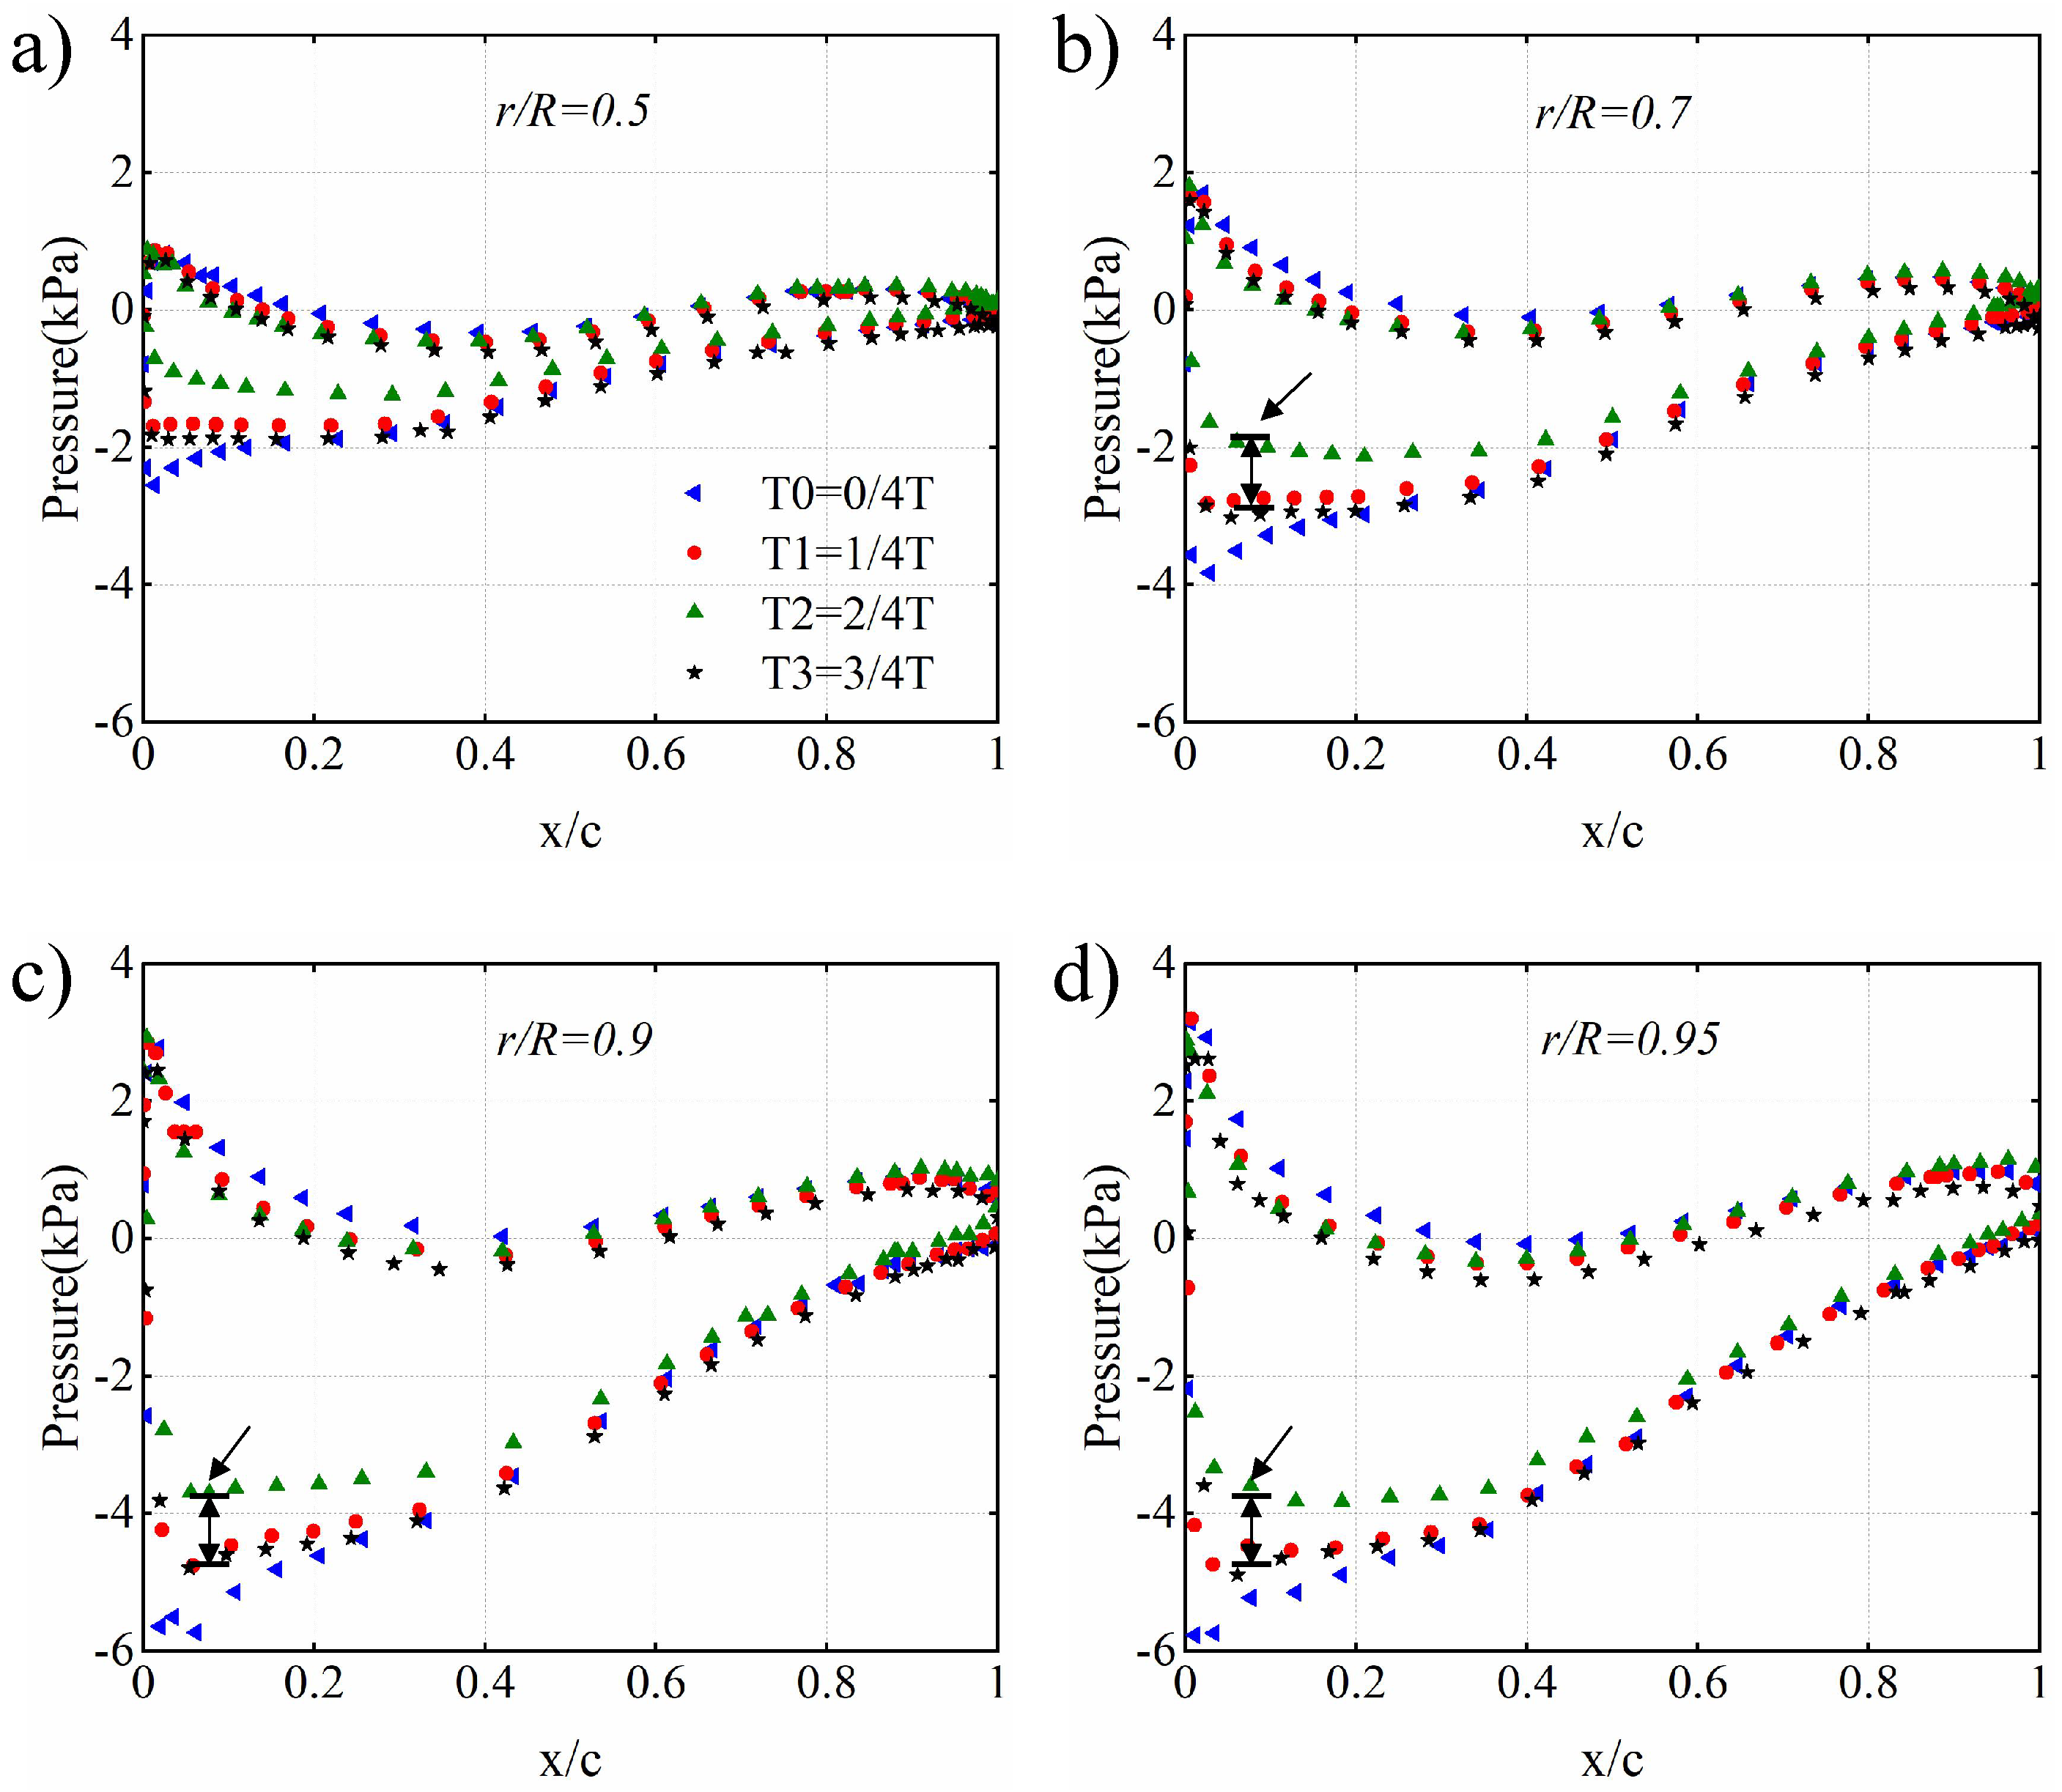
As the wave period grows longer, the wind turbine’s added speed diminishes, as does the pitch speed of the blade, and the weakening of unsteady flow separation on the blade surface enhances aerodynamic performance. However, due to wind and wave coupling, the floating wind turbine tilts at a specific angle relative to the incoming flow direction, resulting in wave-induced pitch motion that reduces the turbine’s power output to some extent. Typically, as wave height rises, the wind turbine’s average power output tends to increase.
(3)
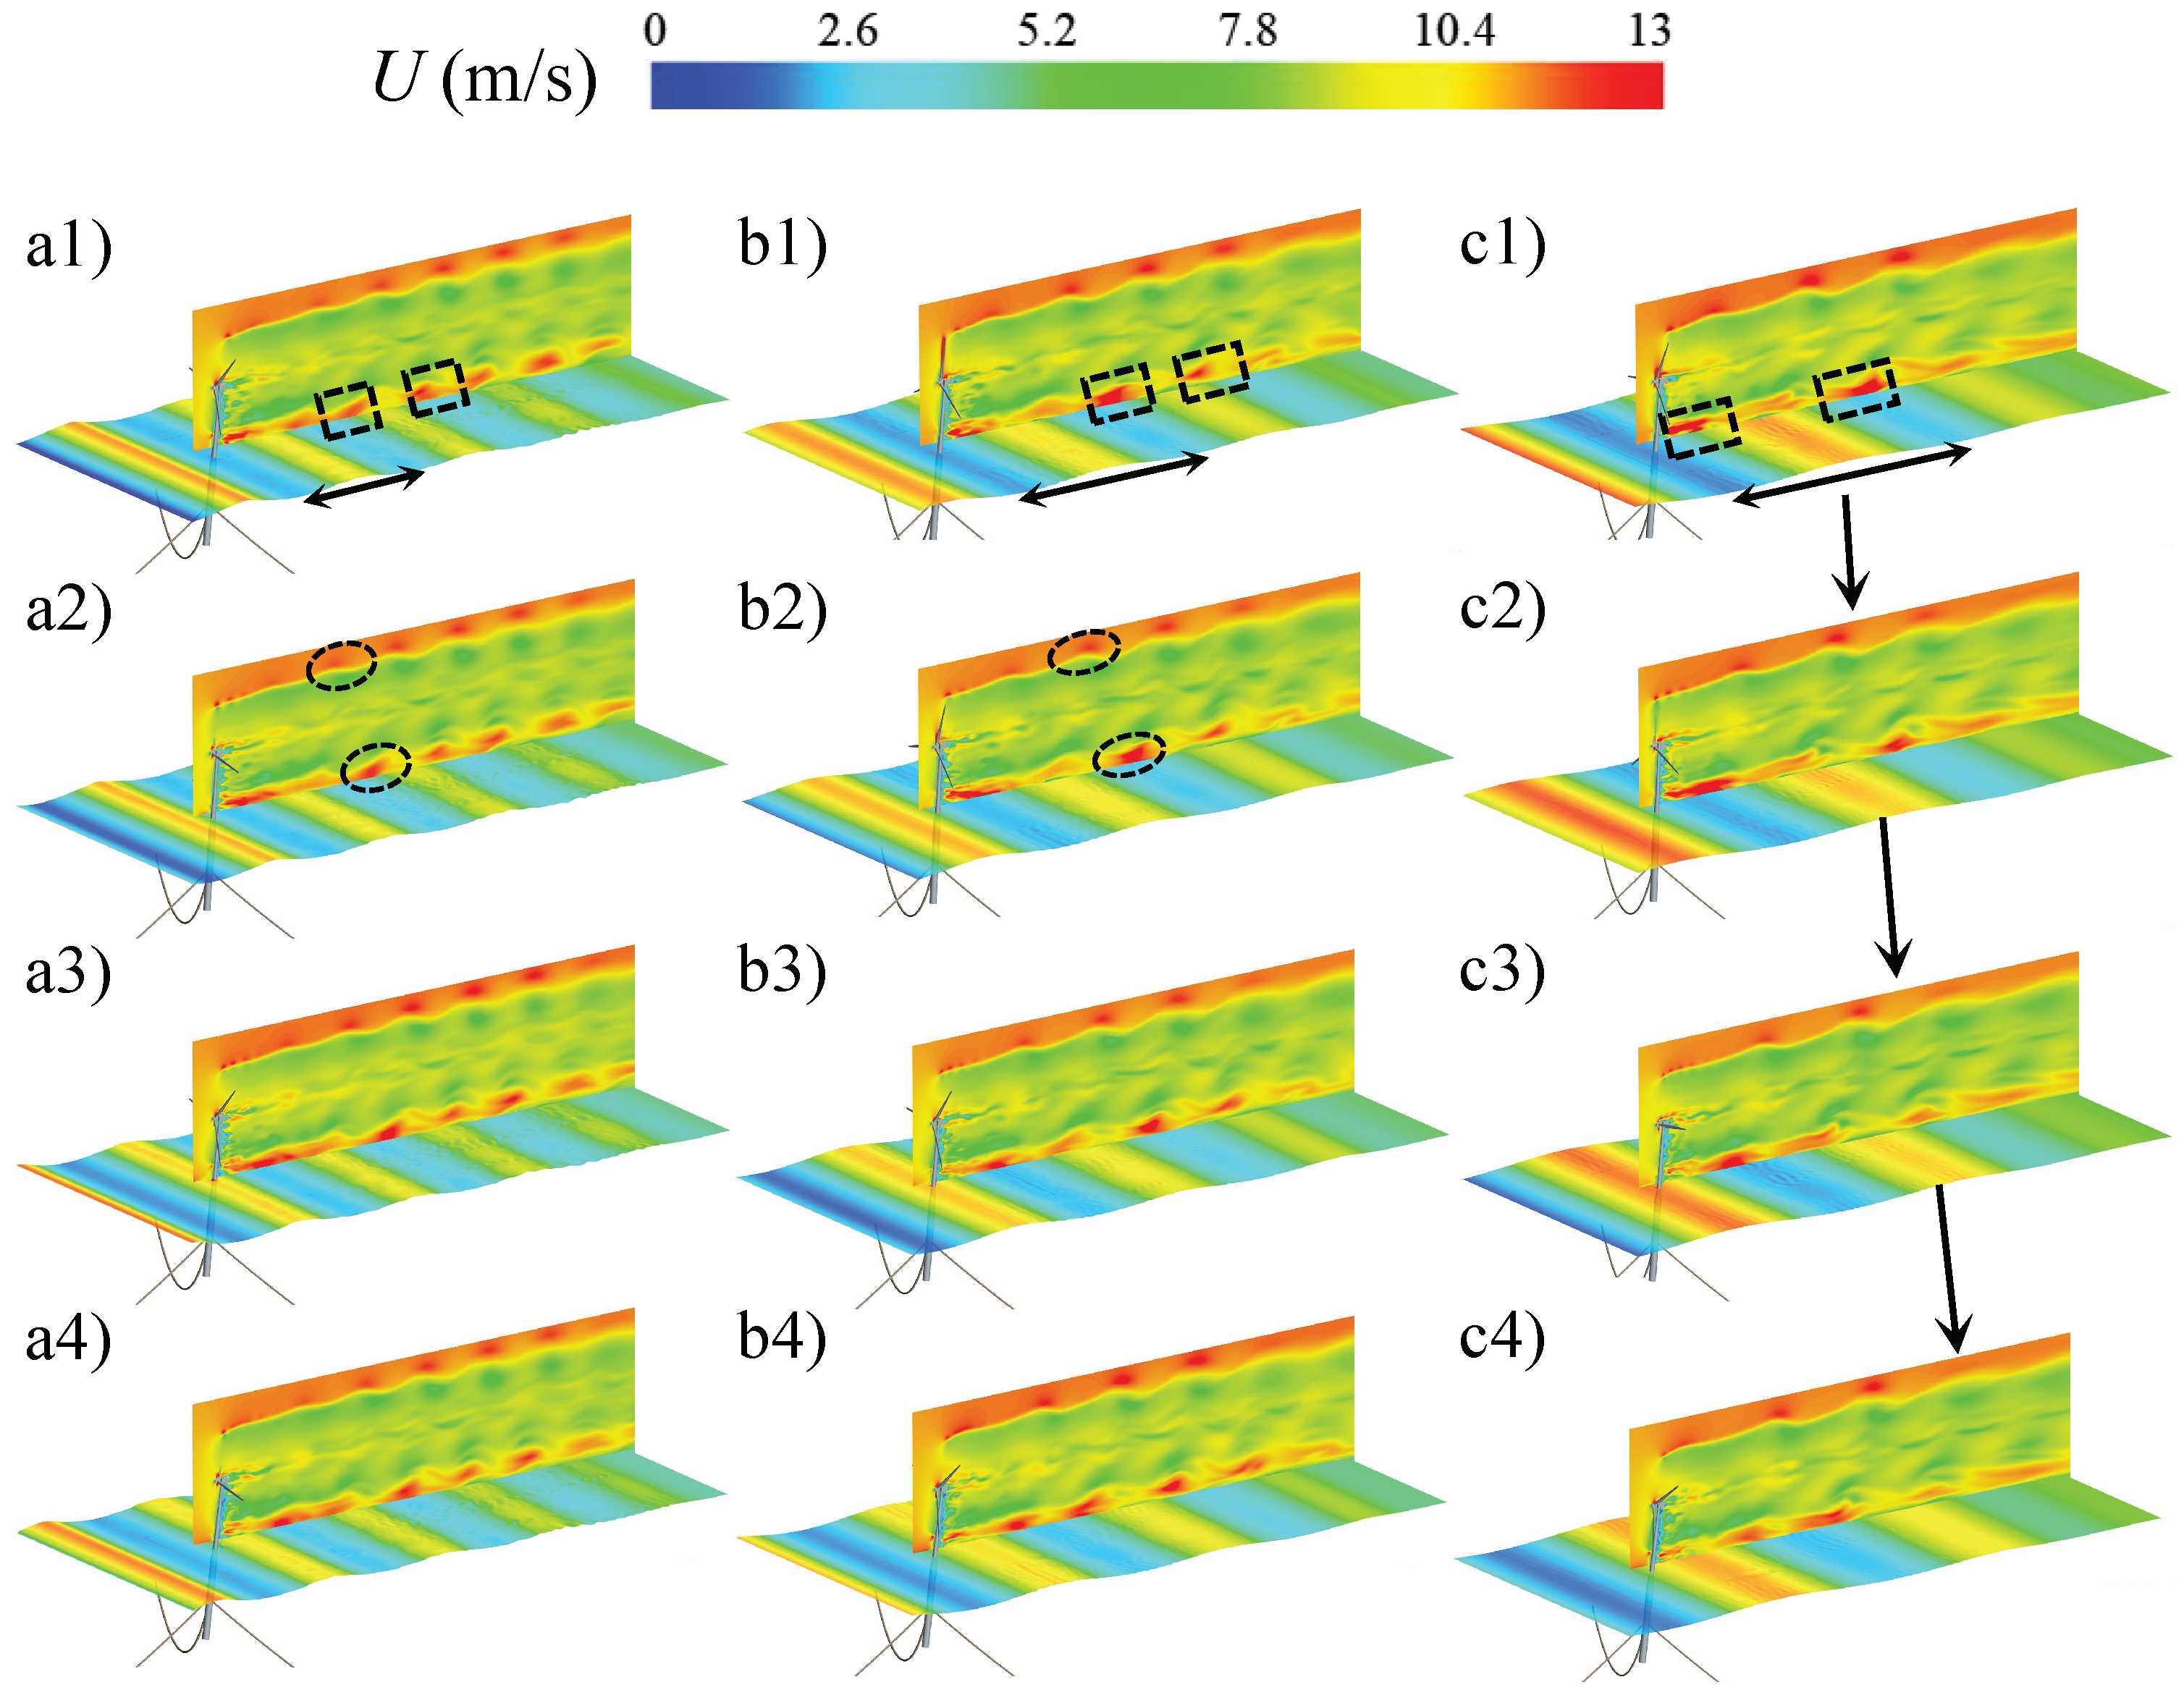
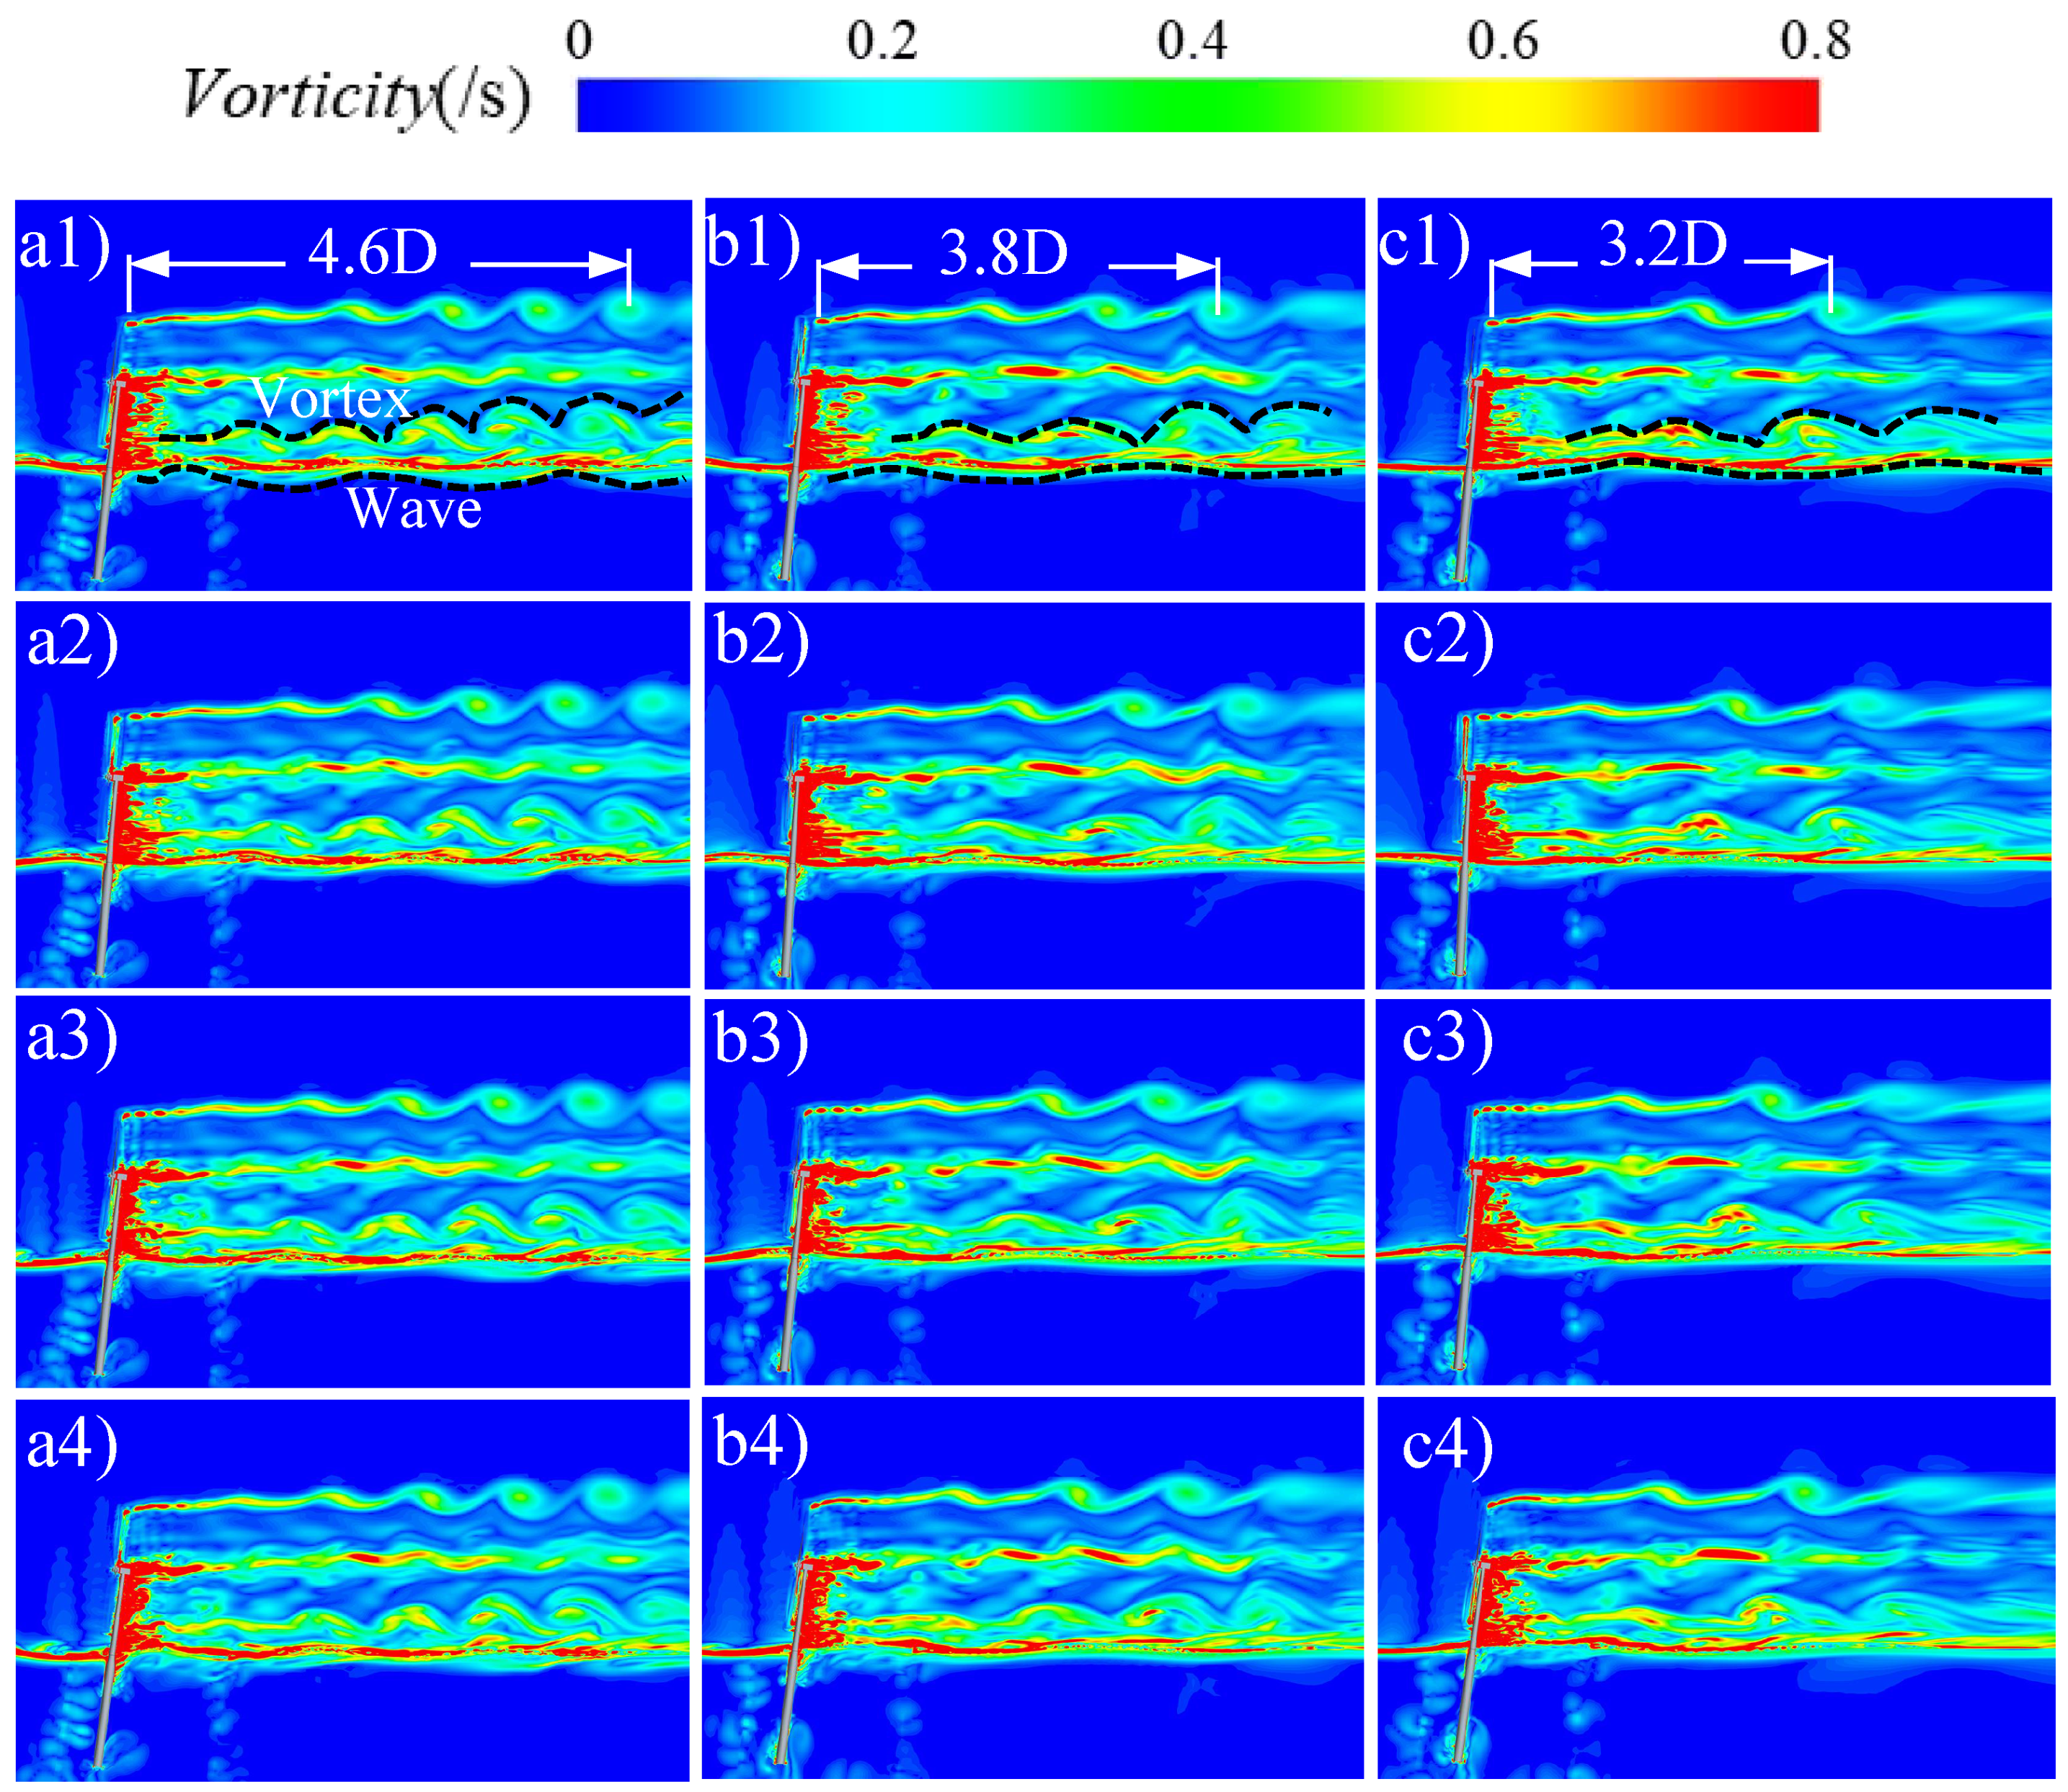
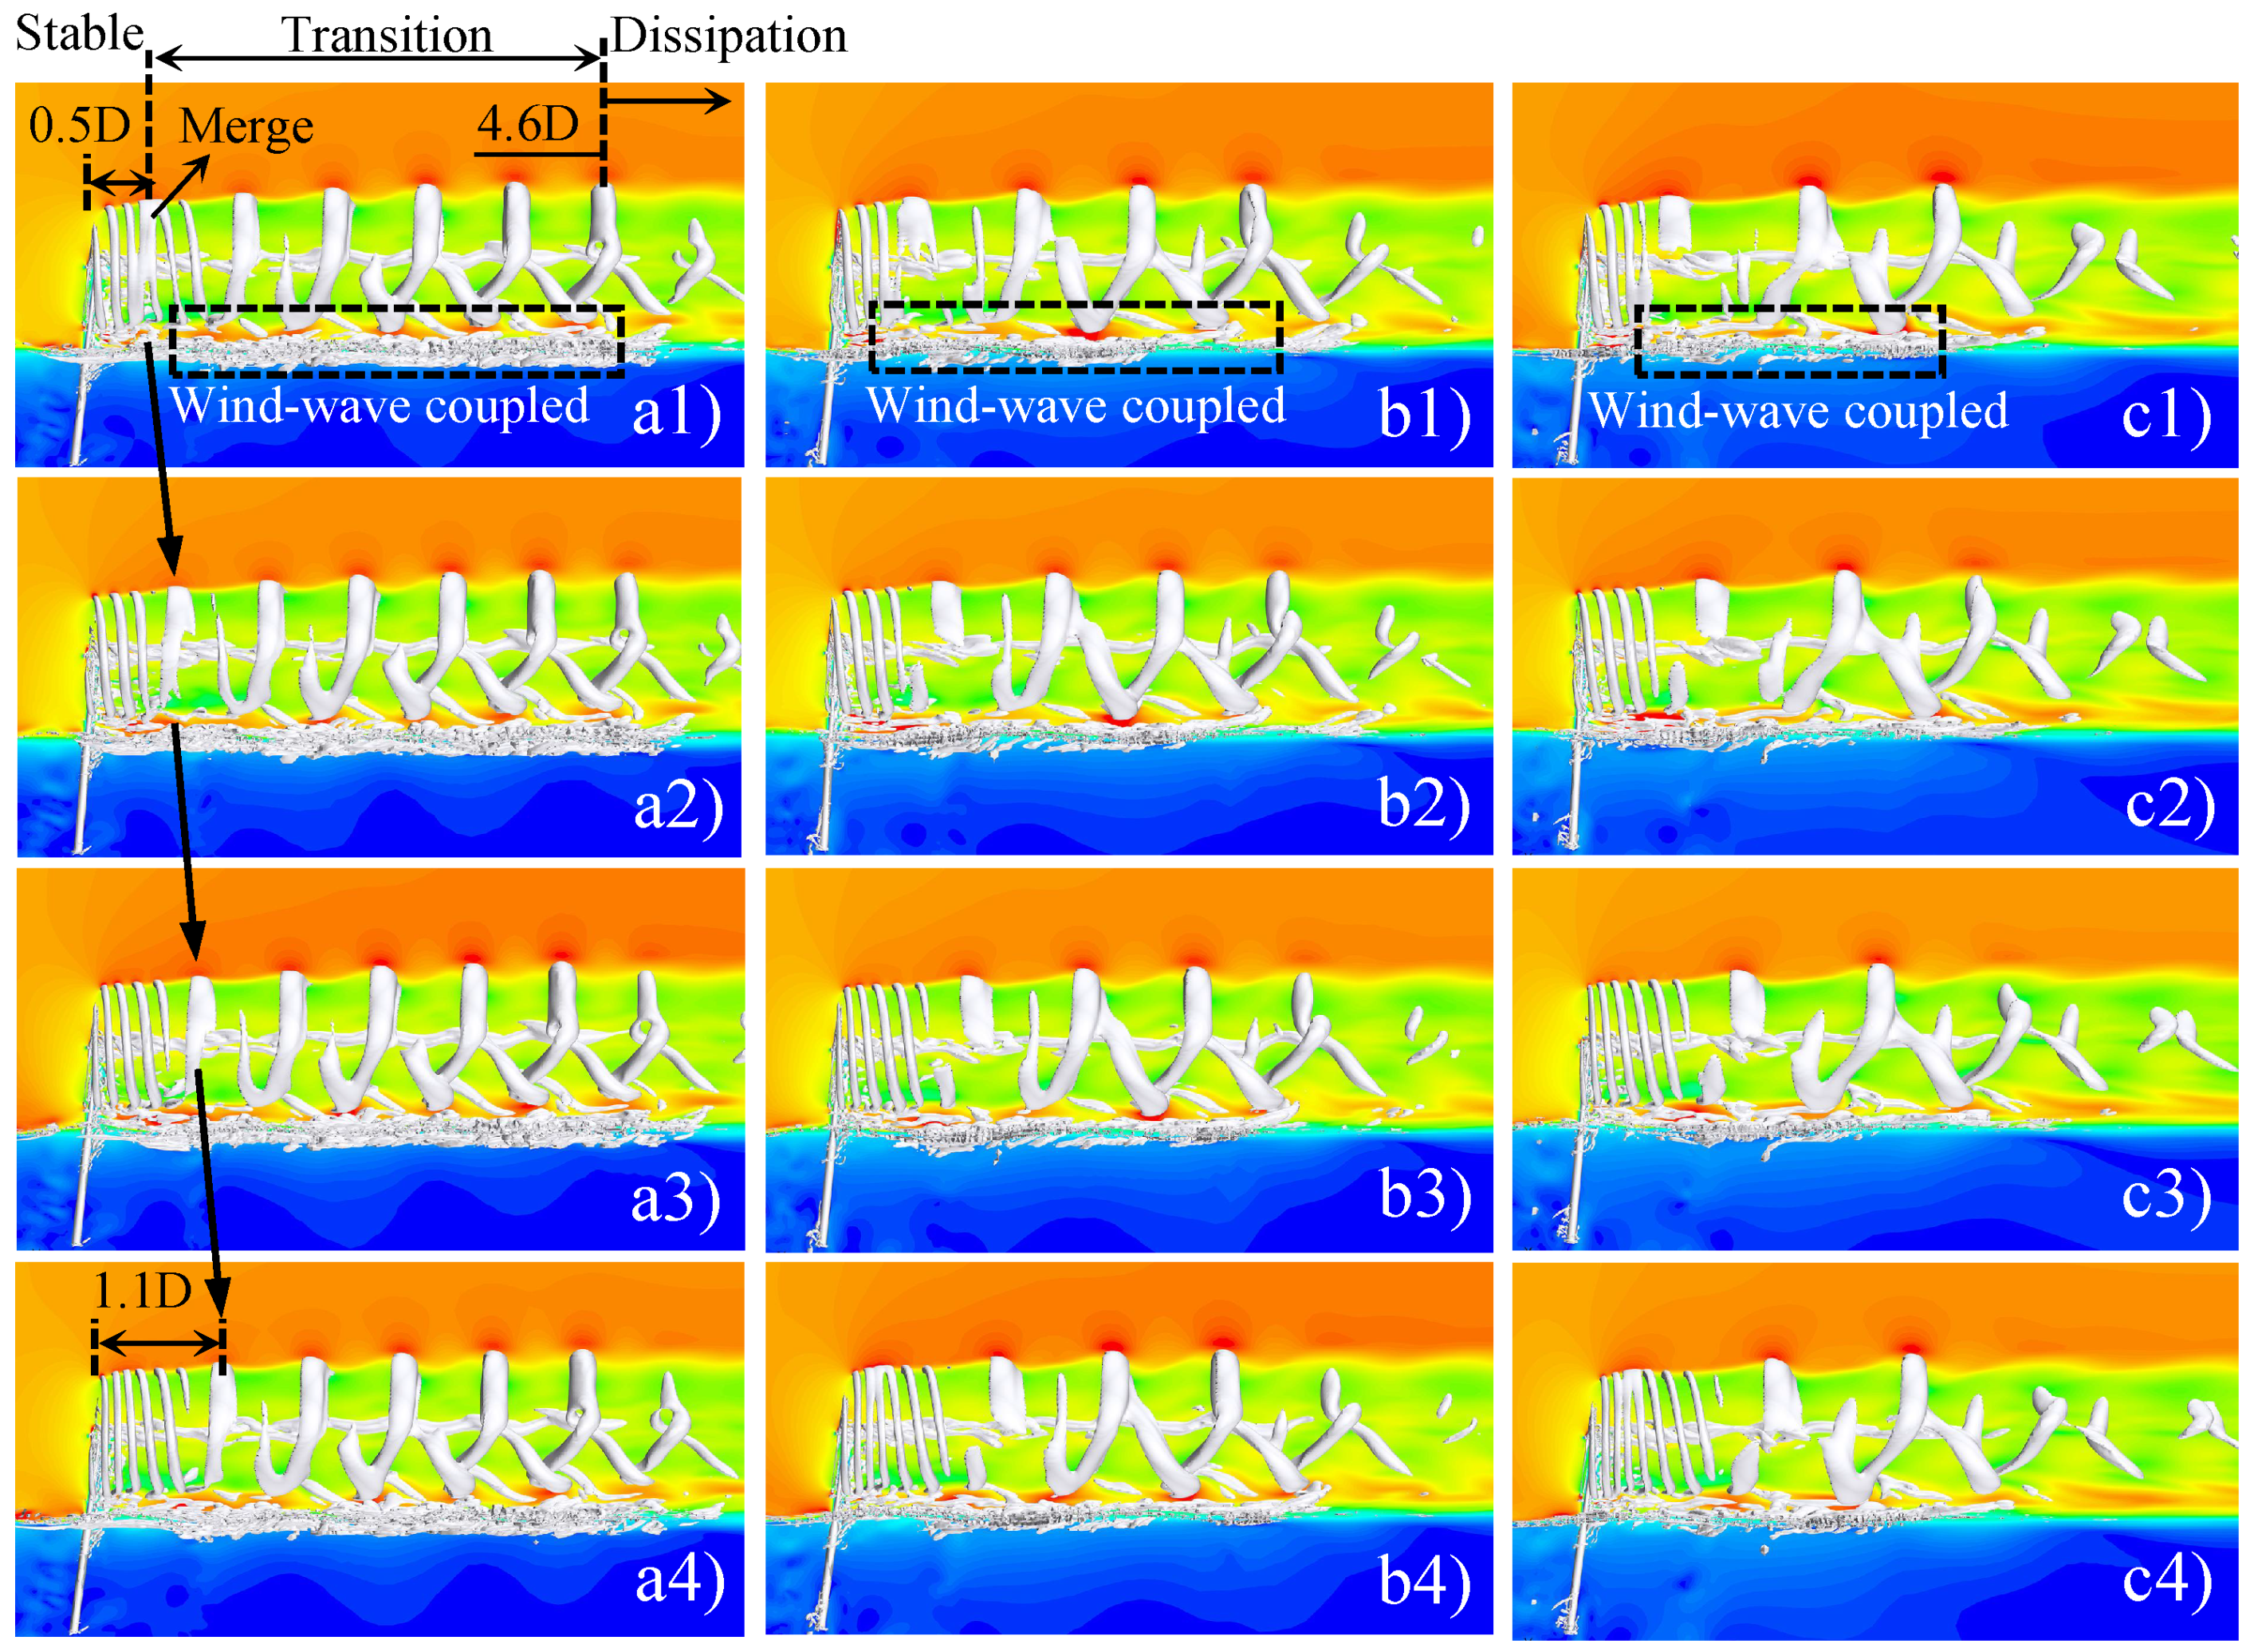
In a smaller wave period, the interaction frequency between the wind turbine and the wake is heightened and intensified. The wake experiences more acute changes and the process of mixing the final wake zone and incoming flow is delayed. As the wave period increases, a larger pitch angle facilitates the more significant mixing of the external high-velocity region and internal low-velocity region, accelerating the wake velocity recovery process. Concurrently, the near-wake region and transition region’s length is shortened, the development process of the vortex structure in the far-wake region is expedited, the symmetry of the far wake deteriorates, and the meandering phenomenon of the wake can be clearly observed.
(4)
The wake’s velocity distribution is influenced by wave height, which in turn affects the pitch amplitude of the floating wind turbine, leading to a stronger blade–wake interaction and a significant impact on the formation and destruction of the wake vortex structure, altering the evolution law of the wake structure.
The platform’s motion, as influenced by wind and waves, has a substantial impact on the aerodynamic characteristics, wake characteristics, and evolution of vortex structures of floating wind turbines, particularly under conditions of large wave periods and heights. Numerical simulations currently provide greater accuracy and the ability to handle complex motions, making this method more suitable for practical offshore wind energy applications. The study of more complex floating wind turbine platform movements in the future will bring scientific research closer to practical applications. These more complex movements may involve factors such as waves and gusty winds. Because the output power fluctuation of the FOWT caused by wind–wave coupling increases the difficulty of the grid-connected power supply, it is necessary to design a control system to reduce its influence. Additionally, wind turbine designers can carefully examine the complex unsteady flow field, aerodynamic performance, and dynamic instability of floating wind turbines in actual operating environments to enhance the reliability of floating wind turbines in real-world conditions.

Author Contributions

Conceptualization, X.L.; methodology, Z.L.; software, X.L. and Z.L.; validation, S.F. and W.Z.; formal analysis, X.H.; investigation, T.P. and Z.S.; resources, H.Y.; data curation, W.S.; writing—original draft preparation, X.L. and Z.L.; writing—review and editing, S.F. and W.Z.; visualization, S.F.; supervision, S.F.; project administration, S.F.; funding acquisition, S.F. All authors have read and agreed to the published version of the manuscript.

Funding

This research was funded by the Natural Science Foundation of Jiangsu Province, China (Grant No. BK20210822); China Postdoctoral Science Foundation, (Grant No. 2022M722695); the Fundamental Research Funds for the Central Universities, (Grant No. B210201018); and the National Natural Science Foundation of China, (Grant No. 52106238).

Institutional Review Board Statement

Not applicable.

Informed Consent Statement

Not applicable.

Data Availability Statement

The authors confirm that the data supporting the findings of this study are available within the article.

Acknowledgments

The authors are very grateful to Natural Science Foundation for colleges and universities in Jiangsu Province (Grant No. 21KJB570005), for funding part of this research.

Conflicts of Interest

The authors declare no conflicts of interest.

Abbreviations

The following abbreviations are used in this manuscript:
FOWTFloating offshore wind turbine
VOFVolume of fluid
IDDESImproved delayed detached eddy simulation
DFBIDynamic fluid–body interaction
PIVParticle image velocimetry
BEMBlade element momentum
FVMFree vortex method
CFDComputational fluid dynamics
OC4Code comparison collaboration continuation
OC3Code comparison collaboration
LESLarge eddy simulation
RANSReynolds average Navier–Stokes
DESDetached eddy simulation
SIMPLESemi-implicit pressure linked equation
AMRAdaptive mesh refinement

References

  1. Antonutti, R.; Peyrard, C.; Johanning, L.; Incecik, A.; Ingram, D. The effects of wind-induced inclination on the dynamics of semi-submersible floating wind turbines in the time domain. Renew. Energy 2016, 88, 83–94. [Google Scholar] [CrossRef]
  2. Snyder, B.; Kaiser, M.J. A comparison of offshore wind power development in Europe and the US: Patterns and drivers of development. Appl. Energy 2009, 86, 1845–1856. [Google Scholar] [CrossRef]
  3. Fang, Y.; Duan, L.; Han, Z.; Zhao, Y.; Yang, H. Numerical analysis of aerodynamic performance of a floating offshore wind turbine under pitch motion. Energy 2020, 192, 116621. [Google Scholar] [CrossRef]
  4. Ferčák, O.; Bossuyt, J.; Ali, N.; Cal, R.B. Decoupling wind–wave–wake interactions in a fixed-bottom offshore wind turbine. Appl. Energy 2022, 309, 118358. [Google Scholar] [CrossRef]
  5. Chen, G.; Liang, X.F.; Li, X.B. Modelling of wake dynamics and instabilities of a floating horizontal-axis wind turbine under surge motion. Energy 2022, 239, 122110. [Google Scholar] [CrossRef]
  6. Wen, B.; Dong, X.; Tian, X.; Peng, Z.; Zhang, W.; Wei, K. The power performance of an offshore floating wind turbine in platform pitching motion. Energy 2018, 154, 508–521. [Google Scholar] [CrossRef]
  7. Bayati, I.; Belloli, M.; Bernini, L.; Zasso, A. Wind tunnel validation of AeroDyn within LIFES50+ project: Imposed Surge and Pitch tests. J. Phys. Conf. Ser. 2016, 753, 092001. [Google Scholar] [CrossRef]
  8. Miao, W.; Li, C.; Yang, J.; Xie, X. Numerical investigation of the yawed wake and its effects on the downstream wind turbine. J. Renew. Sustain. Energy 2016, 8, 033303. [Google Scholar] [CrossRef]
  9. Martin, H. Development of a Scale Model Wind Turbine for Testing of Offshore Floating Wind Turbine Systems. Master’s Thesis, Univeristy of Maine, Orono, ME, USA, 2011. [Google Scholar]
  10. Myhr, A.; Nygaard, T.A. Experimental results for tension-leg-buoy offshore wind turbine platforms. J. Ocean Wind Energy ISOPE 2014, 1, 217–224. [Google Scholar]
  11. Azcona, J.; Bouchotrouch, F.; González, M.; Garciandía, J.; Munduate, X.; Kelberlau, F.; Nygaard, T.A. Aerodynamic thrust modelling in wave tank tests of offshore floating wind turbines using a ducted fan. J. Phys. Conf. Ser. 2014, 524, 012089. [Google Scholar] [CrossRef]
  12. Sandner, F.; Amann, F.; Azcona, J.; Munduate, X.; Bottasso, C.L.; Campagnolo, F.; Robertson, A. Model building and scaled testing of 5MW and 10MW semi-submersible floating wind turbines. In Proceedings of the 12th Deep Sea Offshore Wind R&D Conference, EERA DeepWind’2015, Trondheim, Norway, 4–6 February 2015. [Google Scholar]
  13. Zhao, Y.; Yang, J.; He, Y.; Gu, M. Coupled dynamic response analysis of a multi-column tension-leg-type floating wind turbine. China Ocean Eng. 2016, 30, 505–520. [Google Scholar] [CrossRef]
  14. Chen, J.; Hu, Z.; Wan, D.; Xiao, Q. Comparisons of the dynamical characteristics of a semi-submersible floating offshore wind turbine based on two different blade concepts. Ocean Eng. 2018, 153, 305–318. [Google Scholar] [CrossRef]
  15. Rockel, S.; Camp, E.; Schmidt, J.; Peinke, J.; Cal, R.B.; Hölling, M. Experimental study on influence of pitch motion on the wake of a floating wind turbine model. Energies 2014, 7, 1954–1985. [Google Scholar] [CrossRef]
  16. Fu, S.; Jin, Y.; Zheng, Y.; Chamorro, L.P. Wake and power fluctuations of a model wind turbine subjected to pitch and roll oscillations. Appl. Energy 2019, 253, 113605. [Google Scholar] [CrossRef]
  17. Fu, S.; Zhang, B.; Zheng, Y.; Chamorro, L.P. In-phase and out-of-phase pitch and roll oscillations of model wind turbines within uniform arrays. Appl. Energy 2020, 269, 114921. [Google Scholar] [CrossRef]
  18. Farrugia, R.; Sant, T.; Micallef, D. Investigating the aerodynamic performance of a model offshore floating wind turbine. Renew. Energy 2014, 70, 24–30. [Google Scholar] [CrossRef]
  19. Khosravi, M. An Experimental Study on the Near Wake Characteristics of a Wind Turbine Model Subjected to Surge, Pitch, and Heave Motions. Master’s Thesis, Iowa State University, Ames, IA, USA, 2015. [Google Scholar]
  20. Jonkman, J.M. Dynamics of offshore floating wind turbines—Model development and verification. Wind Energy 2009, 12, 459–492. [Google Scholar] [CrossRef]
  21. Cordle, A.; Jonkman, J. State-of-the-art in design tools for floating offshore wind turbines. Deliv. D4 2010, 3. [Google Scholar]
  22. Li, L.; Hu, Z.; Wang, J.; Ma, Y. Development and validation of an aero-hydro simulation code for offshore floating wind turbine. J. Ocean Wind Energy 2015, 2, 1–11. [Google Scholar]
  23. Crozier, A. Design and Dynamic Modeling of the Support Structure for a 10 MW oOffshore Wind Turbine. Master’s Thesis, Institutt for Energi-og Prosessteknikk, Trondheim, Norway, 2011. [Google Scholar]
  24. Karimirad, M.; Moan, T. A simplified method for coupled analysis of floating offshore wind turbines. Mar. Struct. 2012, 27, 45–63. [Google Scholar] [CrossRef]
  25. Sebastian, T.; Lackner, M. Characterization of the unsteady aerodynamics of offshore floating wind turbines. Wind Energy 2013, 16, 339–352. [Google Scholar] [CrossRef]
  26. Madsen, H.A.; Bak, C.; Døssing, M.; Mikkelsen, R.; Øye, S. Validation and modification of the blade element momentum theory based on comparisons with actuator disc simulations. Wind Energy 2010, 13, 373–389. [Google Scholar] [CrossRef]
  27. Oguz, E.; Clelland, D.; Day, A.H.; Incecik, A.; López, J.A.; Sánchez, G.; Almeria, G.G. Experimental and numerical analysis of a TLP floating offshore wind turbine. Ocean Eng. 2018, 147, 591–605. [Google Scholar] [CrossRef]
  28. Coulling, A.J.; Goupee, A.J.; Robertson, A.N.; Jonkman, J.M.; Dagher, H.J. Validation of a FAST semi-submersible floating wind turbine numerical model with DeepCwind test data. J. Renew. Sustain. Energy 2013, 5, 023116. [Google Scholar] [CrossRef]
  29. Masciola, M.; Robertson, A.; Jonkman, J.; Coulling, A.; Goupee, A. Assessment of the importance of mooring dynamics on the global response of the DeepCwind floating semisubmersible offshore wind turbine. In Proceedings of the ISOPE International Ocean and Polar Engineering Conference (ISOPE2013), Anchorage, AK, USA, 30 June–5 July 2013; p. ISOPE-I-13-129. [Google Scholar]
  30. Ren, N.; Li, Y.; Ou, J. Coupled wind-wave time domain analysis of floating offshore wind turbine based on Computational Fluid Dynamics method. J. Renew. Sustain. Energy 2014, 6. [Google Scholar] [CrossRef]
  31. Zhou, Y.; Xiao, Q.; Peyrard, C.; Pan, G. Assessing focused wave applicability on a coupled aero-hydro-mooring FOWT system using CFD approach. Ocean Eng. 2021, 240, 109987. [Google Scholar] [CrossRef]
  32. Zhou, Y.; Xiao, Q.; Liu, Y.; Incecik, A.; Peyrard, C.; Li, S.; Pan, G. Numerical modelling of dynamic responses of a floating offshore wind turbine subject to focused waves. Energies 2019, 12, 3482. [Google Scholar] [CrossRef]
  33. Leble, V.; Barakos, G. Demonstration of a coupled floating offshore wind turbine analysis with high-fidelity methods. J. Fluids Struct. 2016, 62, 272–293. [Google Scholar] [CrossRef]
  34. Tran, T.T.; Kim, D. Fully coupled aero-hydrodynamic analysis of a semi-submersible FOWT using a dynamic fluid body interaction approach. Renew. Energy 2016, 92, 244–261. [Google Scholar] [CrossRef]
  35. Tran, T.T.; Kim, D.H. A CFD study of coupled aerodynamic-hydrodynamic loads on a semisubmersible floating offshore wind turbine. Wind Energy 2018, 21, 70–85. [Google Scholar] [CrossRef]
  36. Wang, X.; Ye, Z.; Kang, S.; Hu, H. Investigations on the unsteady aerodynamic characteristics of a horizontal-axis wind turbine during dynamic yaw processes. Energies 2019, 12, 3124. [Google Scholar] [CrossRef]
  37. Ye, Z.; Wang, X.; Chen, Z.; Wang, L. Unsteady aerodynamic characteristics of a horizontal wind turbine under yaw and dynamic yawing. Acta Mech. Sin. 2020, 36, 320–338. [Google Scholar] [CrossRef]
  38. Zhang, Y.; Kim, B. A fully coupled computational fluid dynamics method for analysis of semi-submersible floating offshore wind turbines under wind-wave excitation conditions based on OC5 data. Appl. Sci. 2018, 8, 2314. [Google Scholar] [CrossRef]
  39. Lin, L.; Vassalos, D.; Dai, S. CFD simulation of aerodynamic performance of floating offshore wind turbine compared with BEM method. In Proceedings of the 25th International Ocean and Polar Engineering Conference (OnePetro, 2015), Kona, HI, USA, 21–26 June 2015. [Google Scholar]
  40. Fu, S.; Li, Z.; Zhu, W.; Han, X.; Liang, X.; Yang, H.; Shen, W. Study on aerodynamic performance and wake characteristics of a floating offshore wind turbine under pitch motion. Renew. Energy 2023, 205, 317–325. [Google Scholar] [CrossRef]
  41. Liu, Y.; Xiao, Q.; Incecik, A.; Peyrard, C.; Wan, D. Establishing a fully coupled CFD analysis tool for floating offshore wind turbines. Renew. Energy 2017, 112, 280–301. [Google Scholar] [CrossRef]
  42. Cai, Y.; Li, X.; Leng, S.; Zhao, H.; Zhou, Y. Effect of combined surge and pitch motion on the aerodynamic performance of floating offshore wind turbine. Ocean Eng. 2024, 306, 118061. [Google Scholar] [CrossRef]
  43. Cai, Y.; Zhao, H.; Li, X.; Liu, Y. Aerodynamic analysis for different operating states of floating offshore wind turbine induced by pitching movement. Energy 2023, 285, 129538. [Google Scholar] [CrossRef]
  44. Zhang, M.; Li, X.; Xu, J. Smart control of fatigue loads on a floating wind turbine with a tension-leg-platform. Renew. Energy 2019, 134, 745–756. [Google Scholar] [CrossRef]
  45. Wang, X.; Cai, C.; Cai, S.; Wang, T.; Wang, Z.; Song, J.; Rong, X.; Li, Q. A review of aerodynamic and wake characteristics of floating offshore wind turbines. Renew. Sustain. Energy Rev. 2023, 175, 113144. [Google Scholar] [CrossRef]
  46. Bae, Y.; Kim, M.; Kim, H. Performance changes of a floating offshore wind turbine with broken mooring line. Renew. Energy 2017, 101, 364–375. [Google Scholar] [CrossRef]
  47. Roald, L.; Jonkman, J.; Robertson, A.; Chokani, N. The effect of second-order hydrodynamics on floating offshore wind turbines. Energy Proc. 2013, 35, 253–264. [Google Scholar] [CrossRef]
  48. Chen, G.; Li, X.; Liang, X. IDDES simulation of the performance and wake dynamics of the wind turbines under different turbulent inflow conditions. Energy 2022, 238, 121772. [Google Scholar] [CrossRef]
  49. Lei, H.; Zhou, D.; Lu, J.; Chen, C.; Han, Z.; Bao, Y. The impact of pitch motion of a platform on the aerodynamic performance of a floating vertical axis wind turbine. Energy 2017, 119, 369–383. [Google Scholar] [CrossRef]
  50. Lei, H.; Zhou, D.; Bao, Y.; Chen, C.; Ma, N.; Han, Z. Numerical simulations of the unsteady aerodynamics of a floating vertical axis wind turbine in surge motion. Energy 2017, 127, 1–17. [Google Scholar] [CrossRef]
  51. Choi, J.; Yoon, S. Numerical simulations using momentum source wave-maker applied to RANS equation model. Coast. Eng. 2009, 56, 1043–1060. [Google Scholar] [CrossRef]
  52. Tran, T.; Kim, D.; Song, J. Computational fluid dynamic analysis of a floating offshore wind turbine experiencing platform pitching motion. Energies 2014, 7, 5011–5026. [Google Scholar] [CrossRef]
  53. Shen, X.; Hu, P.; Chen, J.; Zhu, X.; Du, Z. The unsteady aerodynamics of floating wind turbine under platform pitch motion. Proc. Inst. Mech. Eng. A J. Power Energy 2018, 232, 1019–1036. [Google Scholar] [CrossRef]
Figure 1. The floating offshore wind turbine model.
Sustainability 16 05324 g001
Figure 2. Basic schematic of the computational domain setup.
Sustainability 16 05324 g002
Figure 3. Grid topology. (a) computational domain grid; (b) overset grid around FOWT; (c) runner grid; (d) side view of the grid in the entire computation domain; (e) boundary layer grid positioned on the blade; (f) spar grid.
Sustainability 16 05324 g003
Figure 4. Platform pitch angle and velocity profile.
Sustainability 16 05324 g004
Figure 5. Hydrodynamic response of floating platform. (a) free decay; (b) regular wave motion response.
Sustainability 16 05324 g005
Figure 6. Pitch response of floating platform (a) under different wave periods, T 1 = 10.0 s, T 2 = 12.5 s, T 3 = 15.0 s, and same wave height H = 10 m; (b) under different wave heights, H 1 = 4 m, H 2 = 7 m, H 3 = 10 m, and same wave period T = 10 s.
Sustainability 16 05324 g006
Figure 7. Power and thrust performance of floating offshore wind turbine under different wave periods, T 1 = 10.0 s, T 2 = 12.5 s, T 3 = 15.0 s, and same wave height H = 10 m. (a) power; (b) thrust.
Sustainability 16 05324 g007
Figure 8. Power and thrust performance of floating offshore wind turbine under different wave heights, H 1 = 4 m, H 2 = 7 m, H 3 = 10 m, and same wave period T = 10 s. (a) power; (b) thrust.
Sustainability 16 05324 g008
Figure 9. Pressure distribution at a selected blade section r / R = 0.9 under different wave periods T 1 = 10.0 s, T 2 = 12.5 s, and T 3 = 15.0 s during the entire period of the pitch motion. (a) t = 0 T, (b) t = 1 / 4 T, (c) t = 1 / 2 T, and (d) t = 3 / 4 T.
Sustainability 16 05324 g009
Figure 10. Pressure distribution at a selected blade section r / R = 0.9 under different wave heights H 1 = 4 m, H 2 = 7 m, and H 3 = 10 m during the entire period of the pitch motion. (a) t = 0 T, (b) t = 1 / 4 T, (c) t = 1 / 2 T, and (d) t = 3 / 4 T.
Sustainability 16 05324 g010
Figure 11. Pressure distribution at different blade section under the same wave height H = 10 m and wave period T = 10 s during the entire period of the pitch motion. (a) r / R = 0.5 , (b) r / R = 0.7 , (c) r / R = 0.9 , and (d) r / R = 0.95 .
Sustainability 16 05324 g011
Figure 12. The wave and wake velocities at different instantaneous times and different wave periods for 11.4 m/s inflow. (a1c1): wave periods T 1 = 10 s, T 2 = 12.5 s, and T 3 = 15 s at t = 0 T; (a2c2): T 1 , T 2 , and T 3 at t = 1 / 4 T; (a3c3): T 1 , T 2 , and T 3 at t = 1 / 2 T; (a4c4): T 1 , T 2 , and T 3 at t = 3 / 4 T, wave height H = 10 m.
Sustainability 16 05324 g012
Figure 13. The wave and wake velocities at different instantaneous times and different wave heights for 11.4 m/s inflow. (a1c1): H 1 = 4 m, H 2 = 7 m, and H 3 = 10 m at t = 0 T; (a2c2): H 1 , H 2 , and H 3 at t = 1 / 4 T; (a3c3): H 1 , H 2 , and H 3 at t = 1 / 2 T; (a4c4): H 1 , H 2 , and H 3 at t = 3 / 4 T, wave period T = 10 s.
Sustainability 16 05324 g013
Figure 14. The wake vorticity at different instantaneous times and different wave periods for 11.4 m/s inflow. (a1c1): wave periods T 1 = 10 s, T 2 = 12.5 s, and T 3 = 15 s at t = 0 T; (a2c2): T 1 , T 2 , and T 3 at t = 1 / 4 T; (a3c3): T 1 , T 2 , and T 3 at t = 1 / 2 T; (a4c4): T 1 , T 2 , and T 3 at t = 3 / 4 T, wave height H = 10 m.
Sustainability 16 05324 g014
Figure 15. The wake vorticity at different instantaneous times and different wave heights for 11.4 m/s inflow. (a1c1): H 1 = 4 m, H 2 = 7 m, and H 3 = 10 m at t = 0 T; (a2c2): H 1 , H 2 , and H 3 at t = 1 / 4 T; (a3c3): H 1 , H 2 , and H 3 at t = 1 / 2 T; (a4c4): H 1 , H 2 , and H 3 at t = 3 / 4 T, wave period T = 10 s.
Sustainability 16 05324 g015
Figure 16. The streamwise wake velocity contour with isosurface of Q-criterion (Q = 0.01) showing hub and tip vortices at different instantaneous times and different wave periods. (a1c1): wave periods T 1 = 10 s, T 2 = 12.5 s, and T 3 = 15 s at t = 0 T; (a2c2): T 1 , T 2 , and T 3 at t = 1 / 4 T; (a3c3): T 1 , T 2 , and T 3 at t = 1 / 2 T; (a4c4): T 1 , T 2 , and T 3 at t = 3 / 4 T, wave height H = 10 m.
Sustainability 16 05324 g016
Figure 17. The streamwise wake velocity contour with isosurface of Q-criterion (Q = 0.01) showing hub and tip vortices at different instantaneous times and different wave heights. (a1c1): H 1 = 4 m, H 2 = 7 m, and H 3 = 10 m at t = 0 T; (a2c2): H 1 , H 2 , and H 3 at t = 1 / 4 T; (a3c3): H 1 , H 2 , and H 3 at t = 1 / 2 T; (a4c4): H 1 , H 2 , and H 3 at t = 3 / 4 T, wave period T = 10 s.
Sustainability 16 05324 g017
Table 1. Detailed information of grid size.
CaseMinimum Grid (m)Total Grid NumberRelative Difference
PowerThrust
case10.0510.56 ×   10 6 6.52%7.40%
case10.0413.20 ×   10 6 3.70%4.56%
case30.0217.61 ×   10 6 1.80%2.48%
case40.0220.18 ×   10 6 1.55%2.06%
Disclaimer/Publisher’s Note: The statements, opinions and data contained in all publications are solely those of the individual author(s) and contributor(s) and not of MDPI and/or the editor(s). MDPI and/or the editor(s) disclaim responsibility for any injury to people or property resulting from any ideas, methods, instructions or products referred to in the content.

