Article

Alternative Cover Crops and Soil Management Practices Modified the Macronutrients, Enzymes Activities, and Soil Microbial Diversity of Rainfed Olive Orchards (cv. Chetoui) under Mediterranean Conditions in Tunisia

by
Fadoua Elhaddad
1,2,3,*,
Julio Antonio Calero González
4,
Sofiane Abdelhamid
1,
Roberto Garcia-Ruiz
3 and
Hechmi Chehab
1,*
1
Laboratory of Sustainability of Olive and Arboriculture in Arid and Semi-Arid Environments, Institut de l’Olivier, University of Sfax, Airport Road, Km 0.5 BP 1169, Sfax 3029, Tunisia
2
Higher Institute of Biotechnology of Monastir, University of Monastir, Street Taher Haddad, Monastir 5000, Tunisia
3
Research Institute on Olive Groves and Olive Oils, Campus Las Lagunillas s/n, University of Jaén, 23071 Jaén, Spain
4
Department of Geology, Campus Las Lagunillas s/n, University of Jaén, 23071 Jaén, Spain
*
Authors to whom correspondence should be addressed.
Sustainability 2024, 16(13), 5329; https://doi.org/10.3390/su16135329
Submission received: 14 April 2024 / Revised: 17 June 2024 / Accepted: 18 June 2024 / Published: 22 June 2024
(This article belongs to the Section Sustainable Agriculture)

Abstract

:
In Tunisia, the olive is the most cultivated fruit crop in the northern region, where annual rainfall exceeds 400 mm. This olive-growing area is characterized by a wide coverage of marginal soil with a high slope gradient. Therefore, the inclusion of cover crops in olive orchards is a sustainable solution to enhance ecosystem productivity, improve soil fertility, and increase oil yields. This study aimed to investigate the short-term (two cropping seasons in 2021 and 2022) effects of different seeded cover crops and soil management practices on soil characteristics, as well as soil health by measuring soil enzyme activities and microbial diversity. Six cover crop types consisting of wheat, vetch, oat, fenugreek, a vetch–oat mixture, and spontaneous vegetation were tested in association with rainfed olive trees (cv. Chetoui) in the north of Tunisia and compared to a control (which was tilled periodically three times per year without intercropping). During the first cropping season, cover crops were cut as animal feed, and only residues were incorporated into the soil. However, during the second year, all cover crop biomass was incorporated into the soil. The results indicated that the dry biomass production and carbon uptake were significantly higher in grass species (wheat and oat). All of the cover crops, including the spontaneous vegetation, significantly increased soil organic matter (SOM) and macronutrient levels, mainly, available phosphorus. On the other hand, the highest level of soil nitrogen was found in the fenugreek cover crop. The soil enzyme activities in the cover crops of wheat, oat, and the vetch–oat mix were higher than those in the control. Together with the increase in soil organic matter (SOM), this demonstrates a significant improvement in soil health with cover crops. Furthermore, this study proves that the utilization of carbon sources was dominated by amides, amines, and amino acids in the fenugreek plot, while it was dominated by polymers and carboxylic acids in the case of the wheat and oat. Overall, this study demonstrates that seeding cover crops is a sustainable management practice not only to integrate livestock but also to improve soil health in semiarid olive orchards.

1. Introduction

In Tunisia, the olive oil industry holds significant economic, environmental, and social importance. Olive trees cover 36% of the total agricultural land and make up 79% of the area committed to tree farming. Notably, 95% of Tunisian olive farming is traditional, relying on dry land cultivation and minimal chemical fertilizer input. Consequently, Tunisia is recognized as one of the leading global producers and exporters of organic olive oil. The country produces the fourth-largest amount of olive oil in the world, and the olive industry supports 65 percent of all agricultural operators and more than one million people directly or indirectly [1,2]. A yearly average of 196,000 tonnes of olive oil was produced between 2015 and 2019; 165,000 of those tonnes were exported, accounting for 84% of the total amount. The volume of oil exported by Tunisia during 2022–2023 represents 20% of worldwide olive oil exports. Both in terms of quantity and value in USD, the export of olive oil is greater than all other agricultural and food exports from Tunisia and accounts for more than half of those exports’ overall value [3,4]. However, despite the success of the olive oil industry, there are also challenges facing olive growers in Tunisia. During the 2022–2023 campaign, the national production of olive oil experienced drop of 25% compared to the past campaign, reaching 180 thousand tons. Olive oil production is below the national average recorded over the last decade, which is estimated at 211,000 tonnes [5]. One of the most significant challenges is the threat of climate change as well as the low soil organic matter content and acceleration of degradation factors [6,7]. This has led to a decrease in olive yields, as well as an increase in pests and diseases, affecting the sustainability of the olive production system and environmental security. Tunisian olive production systems exhibit north–south variation driven by climatic factors, primarily rainfall. In the north, olive groves represent the third most common agricultural practice and are cultivated as monocultures. However, these northern groves are often relegated to marginal lands with poor soil quality and steep slopes, resulting in lower olive yields. Meanwhile, olive oil produced from the Chetoui cultivar has very good chemical and sensory quality attributes [8,9]. More recently, the Ministry of Agriculture has planned to expand the number of olive trees in Northern Tunisia by around 10 million trees between 2020 and 2030. To improve olive oil production within the framework of organic farming, increase the productivity of the olive ecosystem (the production of animal feed, industrial crops, and food for human consumption), and protect the environment, intercropping carried out with different cover crops (grasses and legumes) is the most ecologically sustainable technical solution, as an alternative to synthetic fertilizer [10,11]. Several studies have indicated that cover crops improve agricultural productivity, with many focusing on cover crops’ biomass production, as well as soil physical, chemical, and biological properties. Cover crop root growth may provide soil benefits, such as increasing soil organic carbon content and accessible nutrients [12]. Annual crops’ association with perennial trees plays a significant role in soil-based ecosystem services because of above and belowground organic inputs that supply the nutrients and carbon substrates required by soil organisms engaged in carbon transformations and nutrient cycling [7]. If organic matter breaks down, decomposer organisms work together to fragment organic fractions, resulting in C transformations (e.g., termites, millipedes, mites, and earthworms). C transformations and nutrient cycling occur through the coordinated interaction of decomposers and nutrient transformers and are treated here as a functional continuum [11,12]. This transformation in turn facilitates the enzymatic action by fungi and bacteria that results in the release of nutrients to the soil matrix, the loss of C to the atmosphere, primarily as CO2, and the synthesis of soil organic matter [13]. The use of cover crops in agriculture is an effective method for mitigating soil erosion and nutrient loss. Various studies have demonstrated the ability of cover crops to significantly reduce rill erosion and sediment transport and to enhance surface roughness, water infiltration, and soil nutrient status [14]. Additional physical characteristics that can be improved by the use of cover crops are aggregate stability and hydraulic properties by protecting the soil surface from raindrop impact and increasing macro-porosity and pore connectivity [15,16]. The use of cover crops can alter soil properties by increasing organic matter in mixtures with a high C:N ratio, thereby increasing soil nutrients available for subsequent or associated crops. Because CCs (cover crops) increase soil C and N content, they help reduce the harmful effects of global warming by increasing the sequestration of atmospheric CO2 and N2O [17]. Combined with conservation tillage, CCs contribute to a system that improves soil quality [18]. Several studies have found the importance of using legume species as cover crops in olive orchards. Under Mediterranean conditions, seeding annual legumes have been suggested as the most desirable species for intercropping in olive orchards [7,16,19]. The use of legumes as cover crops can reduce the problems every olive grower has, mainly the limitation in the use of N agrochemical fertilizers and high soil N losses recorded in olive groves planted on sandy soil and steeper slopes [20,21]. Additionally, it has been reported that the use of cover crops in olive groves has beneficial effects on soil chemical and biological qualities [7]. However, these effects depend largely on the cover crop species and the primary dry matter production [16,17]. Meanwhile, grass species produced a higher amount of dry biomass than legumes and contributed more efficiently to carbon uptake and organic matter in soil [22]. The use of mixed sowing based on two cover crop species together, usually legume and grass species, can provide more benefits, such as a lower C/N ratio, improving the P availability and N uptake [23,24]. A vetch and oat combination has been considered as one of the most promising cover crops used for biomass and nutrient availabilities [25].
For instance, cover crops increased soil bacterial and fungal diversity in the olive rhizosphere. These changes in microbial diversity were positively related to an increase in soil organic matter content and the decomposition of complex polymers in olive orchards [26,27]. Soil enzyme activities are fundamental regulators of litter decomposition and may significantly influence the fractions of labile organic carbon in soil [28], the biological nitrogen fixation, and the immobilization of nutrients. Cover crop incorporation in soil stimulates a significant increase in soil enzymatic activities [29]. Annual cover crops increase the activities of most soil enzymes and are correlated with microbial biomass [30,31]. Among the most studied soil enzymes, β-glucosidase, phosphatase, and dehydrogenase intervene in the C, N, and P cycles [32]. The metabolic activity of microorganisms can be evaluated using different techniques such as cell cultures, microbial biomass, enzyme activity, and recently, community-level physiological profiling (CLPP), a method that is based on carbon source utilization [33]. Actually, in the north of Tunisia, the olive-growing area is increasing, mainly areas with degraded slope soils. However, the selection of the type of crop to use as an intercrop is essential to avoid soil erosion and water competition with olive trees, improve soil fertility, enhance carbon storage, and increase farmer income through the secondary crop. Therefore, this research is novel because it aimed to boost olive production by the evaluation of different cover crop species (spontaneous vegetation, a grass species, a legume species, and a mixture of these). In this study, the impacts of cover crops on primary production, carbon fixation, nutrient uptake, and various biological indicators of soil quality can be observed over the short term during two consecutive cropping seasons (2021 and 2022). Indeed, the activities of most soil enzymes (β-glucosidase, phosphatase, dehydrogenase, and arylsulfatase) representative of the C, N, P, and S cycles were estimated. The soil microbial diversity was also estimated using Biolog EcoPlates during the second cropping season of matured olive orchards (cv. Chetoui) under rainfed conditions in Northern Tunisia.

2. Materials and Methods

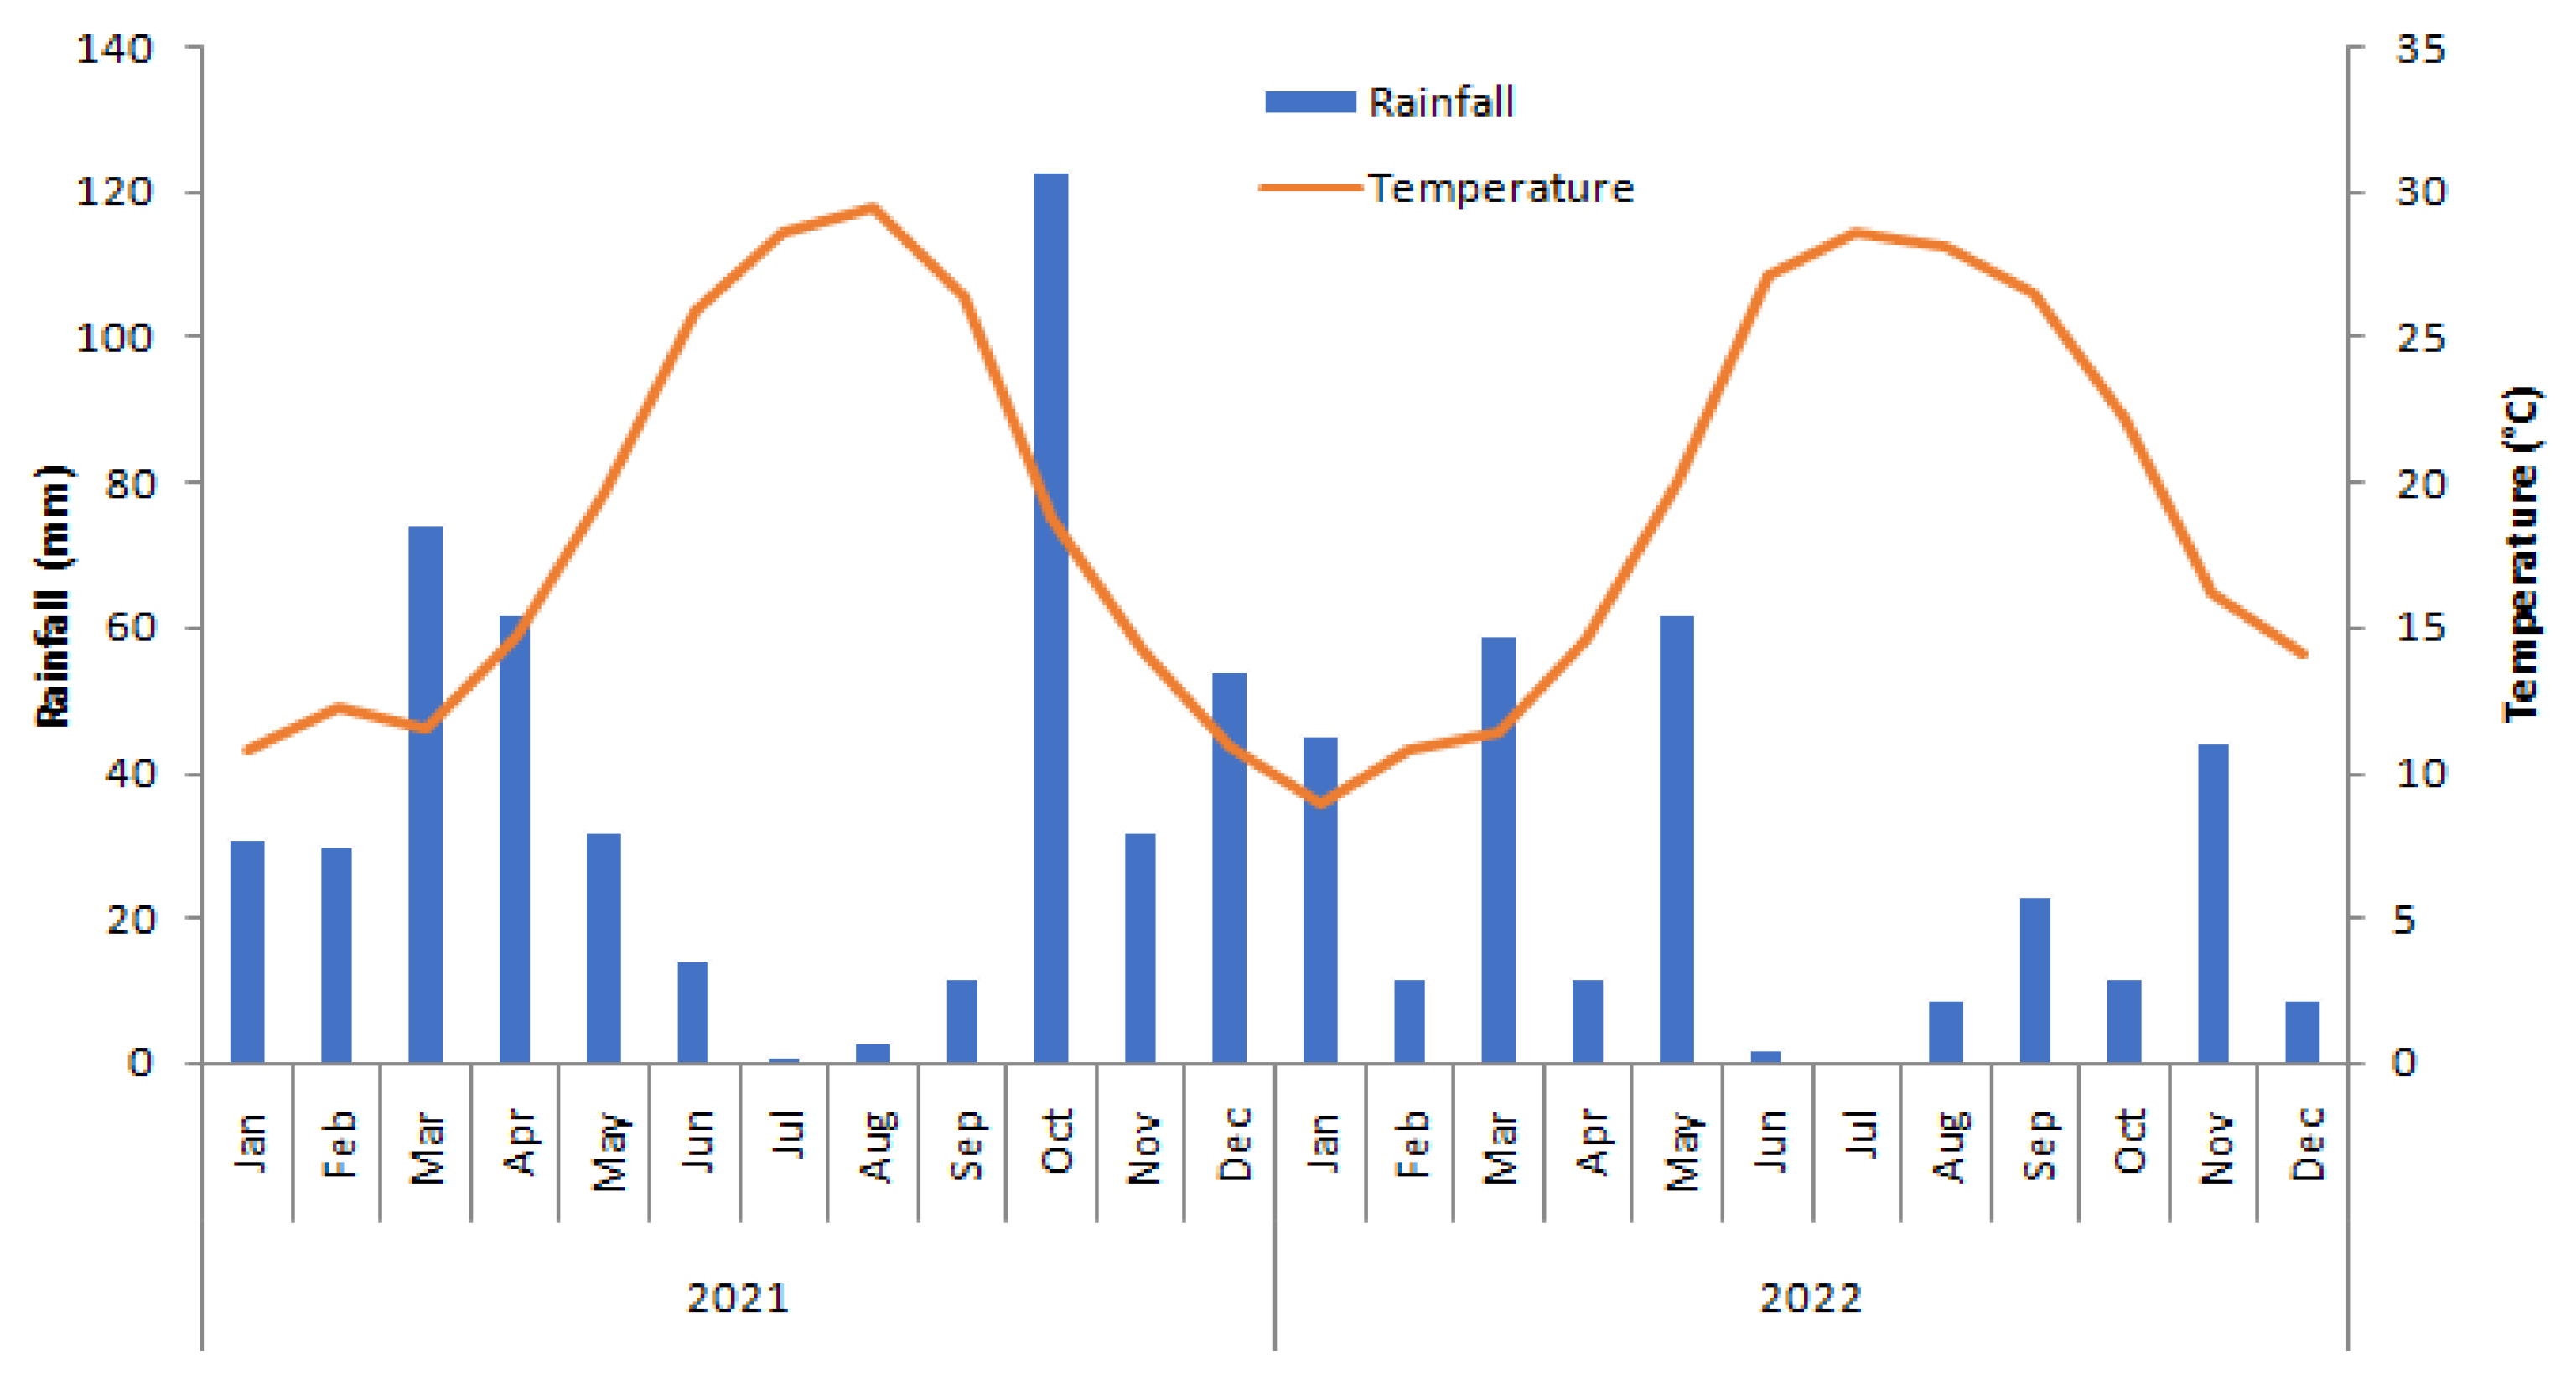
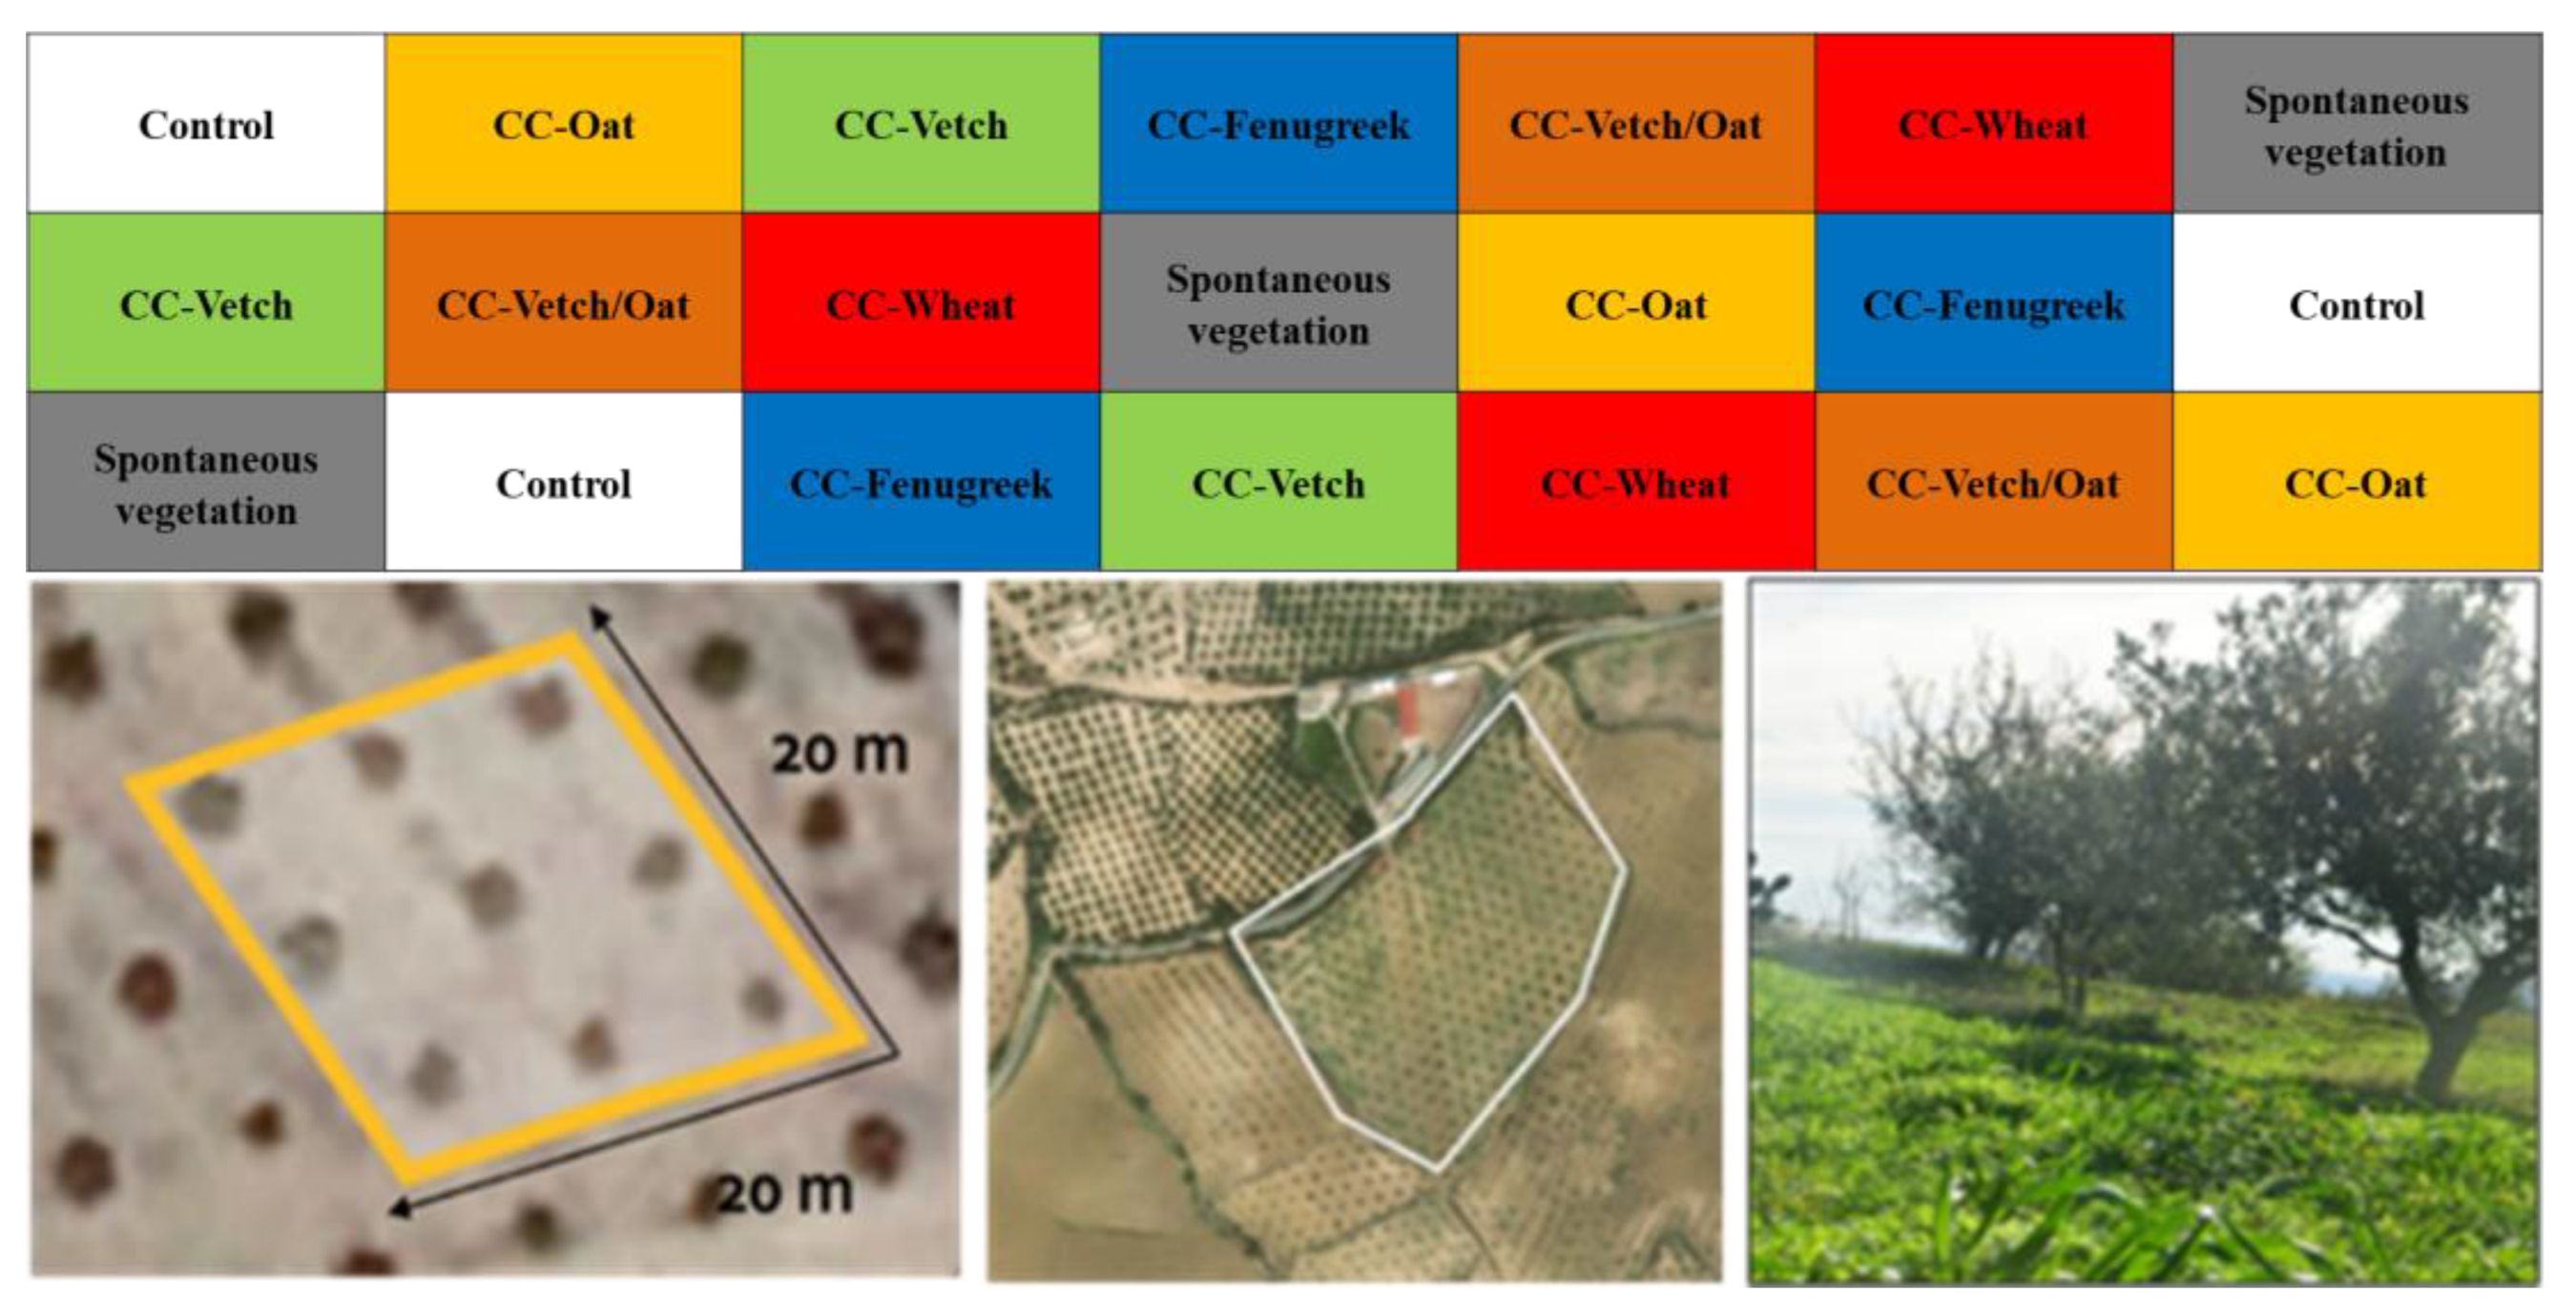
2.1. Description of the Study Area and Experimental Design

The field experiment was carried out on the Ben Ismail Olive Farm in Toukaber, located in Beja province in the Medjerda Valley in Northwest Tunisia (36°42′34.0″ N, 9°30′33.9″ E), which is 400 m.a.s. and has a Mediterranean climate. The average annual temperature and rainfall are 18.5 °C and 500 mm, and rainfall is mostly between October and April. Weather data recorded during the experimental period are presented in Figure 1. Rainfalls registered were 460 mm and 300 mm during the 2021 and 2022 cropping seasons, respectively. The mean temperatures were about 18.7 °C.
The soil texture throughout the olive orchard is clay (47%), loam (20%), and sand (23%) with a pH of 8.2, EC of 1523 µs m−1, and bulk density (Da) of 1.5 g cm−3. The farm has a surface area of 30 ha with a slope between 5 and 18%. The olive trees of the Chetoui cultivar were approximately 45 years old and were a part of organic farming production, with tree density of 100 trees ha−1 (10 m × 10 m). The height and width of the olive tree canopy were 3 m and 4 m, respectively. Olive trees were fertilized with 10 tonnes per ha of organic manure, applied every two years between tree rows. Total nitrogen, phosphorus, and potassium of the manure averaged 2% N, 0.67% P, and 2.9% K, respectively.

2.2. Experimental Design

The experimental design was randomized complete blocks that were perpendicular to the main slope, with three replications. Every experimental plot occupied 20 m × 20 m, which corresponded to a surface of 400 m2, including 9 trees with uniform olive tree canopy size (Figure 2).
During the 2021 and 2022 cropping seasons, 6 treatments were tested and compared to the control (farm management: tillage 3 times by chisel ploughing soil at 20 cm depth in March, June, and October). The treatments applied in olive orchards were as follows: (1) Spontaneous vegetation, (2) Oat (Avena sativa), (3) Wheat (Triticum aestivum), (4) Fenugreek (Trigonella foenum-graecum), (5) Vetch (Vicia sativa), and (6) A mixture of vetch–oat (50/50%). Seeding rates were 75 kgha−1,125 kgha−1 for oat, wheat, and fenugreek, respectively, and 100 kgha−1 (vetch) and 100 kgha−1 (oat) for the vetch–oat treatment. The seeding method was manual broadcasting, in which the seeds were scattered by hand evenly across the experimental blocks. Seeds were buried longitudinally and transversely at 15 cm soil depth by a cultivator. During the first season (2021), cover crops were cut in April and were served as animal feed, and only residues were incorporated into the soil one week after harvest by chisel ploughing at a 20 cm soil depth. Meanwhile, during the second season (2022), all cover crops were mowed and incorporated into the soil in April by chisel ploughing at 20 cm soil depth.

2.3. Cover Crop Sampling and Analysis

Aboveground and belowground biomass of the cover crops was randomly sampled in each block during spring, using five squares of 50 × 50 cm (0.25 m2). The plants were removed with a shovel and transported to the laboratory in plastic bags during collection process. Once in the lab, the aerial parts were separated from the roots. Soil particles attached to the roots were gently separated by immersing the roots in a plastic tray with distilled water. The aerial and root biomass was dried (70 °C for 7 days) and weighed. Net aboveground and belowground biomass production was calculated based on the dry biomass in the 0.25 m2 squares and extrapolated to one hectare considering the area covered.
Aliquots of the aerial and root biomass were powdered by an electrical mill and sieved with 1 mm mesh. Total carbon (C), nitrogen (N), phosphorus (P), and potassium (K) were determined in aliquots of the powdered biomass. C and N were measured in a CHN elemental analyser (Leco TruSpect Micro, St. Joseph, MI, USA) and P and K in an ICP-MS mass spectrophotometer (Agilent 7900, Santa Clara, CA, USA) after digestion with perchloric-nitric (3:5 v/v).
Carbon, nitrogen, phosphorus, and potassium in the cover crops (kg element ha−1 y−1) were calculated from the net primary production of biomass in the sampling square (kg DM in 0.25 m2).

2.4. Soil Sampling

Soil samples were collected for 3 to 5 weeks after incorporating/cutting the cover crops during the two studied seasons. The top 30 cm of soil samples were taken from the inter-row area, stored in a plastic bag, and transported to the lab. Then, the samples were air dried for a week and sieved at 2 mm before analyses (total nitrogen, POlsen, total potassium, and soil organic carbon). Other samples in the top 10 cm were taken and kept at 4 °C to test soil functional quality (via enzymatic activity and Biolog® EcoPlates™).

2.5. Soil Properties

Soil total nitrogen was measured by CHN elemental analyser (Leco TruSpect Micro), and total potassium was measured by IPC-MS mass spectrometer (Agilent 7900) after digestion with perchloric-nitric acid. The determination of soil organic carbon was based on oxidation with potassium dichromate in an acid (Nelson and Sommers, 1982). Soil available phosphorus POlsen was determined by following the method outlined by Olsen as described by Chehab et al. [7].

2.6. Soil Functional Quality

2.6.1. Enzymatic Activity

Soil enzyme activities were used as proxies for soil health and functional quality. The activity of the phosphatase was determined following the methodologies of [34]. The substrate, p-nitrophenyl phosphate, was added to the soil sample and incubated for 1 h in a water bath. Then, the reaction was finished by adding sodium hydroxide and filtered. The amount of p-nitrophenol (PNP) released was measured by colorimetry at 420 nm. The β-glucosidase activity was estimated with the method of [34], which is based on phosphatase: a colorimetric estimate of the p-nitrophenol released by the enzyme from the incubation of the soil with its specific substrate (p-nitrophenyl-β-D-glycoside). The arylsulfatase activity was determined following the method of Tabatabai [35], based on the release of p-nitrophenol after incubating soil with potassium p-nitrophenyl sulfate. Dehydrogenase activity is indicative of microbial biomass since it is an intracellular enzyme directly related to functional microorganisms. The dehydrogenase assay was carried out according to the method using triphenyl-tetrazolium chloride as a substrate, incubating it for 16 h at 25 °C, and measuring the triphenyl-formazan formed by colorimetry at 546 nm. The geometric mean of soil enzyme activities was also calculated as an aggregated measure of these soil biological indicators.

2.6.2. BiologTM Ecoplate and Soil Microbial Community Catabolic Profiling

The Biolog® EcoPlate™ method cited by Grzadiel [35] was used to evaluate the catabolic potential of a variety of organic carbon sources by soil microorganisms. Every plate includes 96 wells containing 31 different carbon sources, plus a blank well, with three replications. The substrates in the wells can be subdivided into five groups: carbohydrates (n = 10), carboxylic acids (n = 9), amines and amides (n = 2), amino acids (n = 6), and polymers (n = 4). Freshly collected samples of soil were taken (10 g) and suspended in 0.85% NaCl solution followed by shaking for 30 min. The suspension was then left to settle, and the supernatant was filtered through a filter to avoid transmission of the remaining plant and soil particles, which could affect further reads. Inoculation was accomplished by pipetting 120 μL of each sample into each well of the EcoPlate™. Plates were incubated at 28 °C for 120 h, and the absorbance at 590 nm was measured to compute average well colour development (AWCD), Shannon diversity index (H′), Shannon evenness index (E), substrate richness (S), and carbon source profiling. Each of the measurements was performed in triplicate.

2.7. Statistical Analysis

The effects of the different cover crops on the variables analysed were tested using ANOVA (IBM-SPSS 27 for Windows). Data were tested for normality using Shapiro–Wilk test to verify the model assumptions, and differences were considered statistically significant at p < 0.05.

3. Results

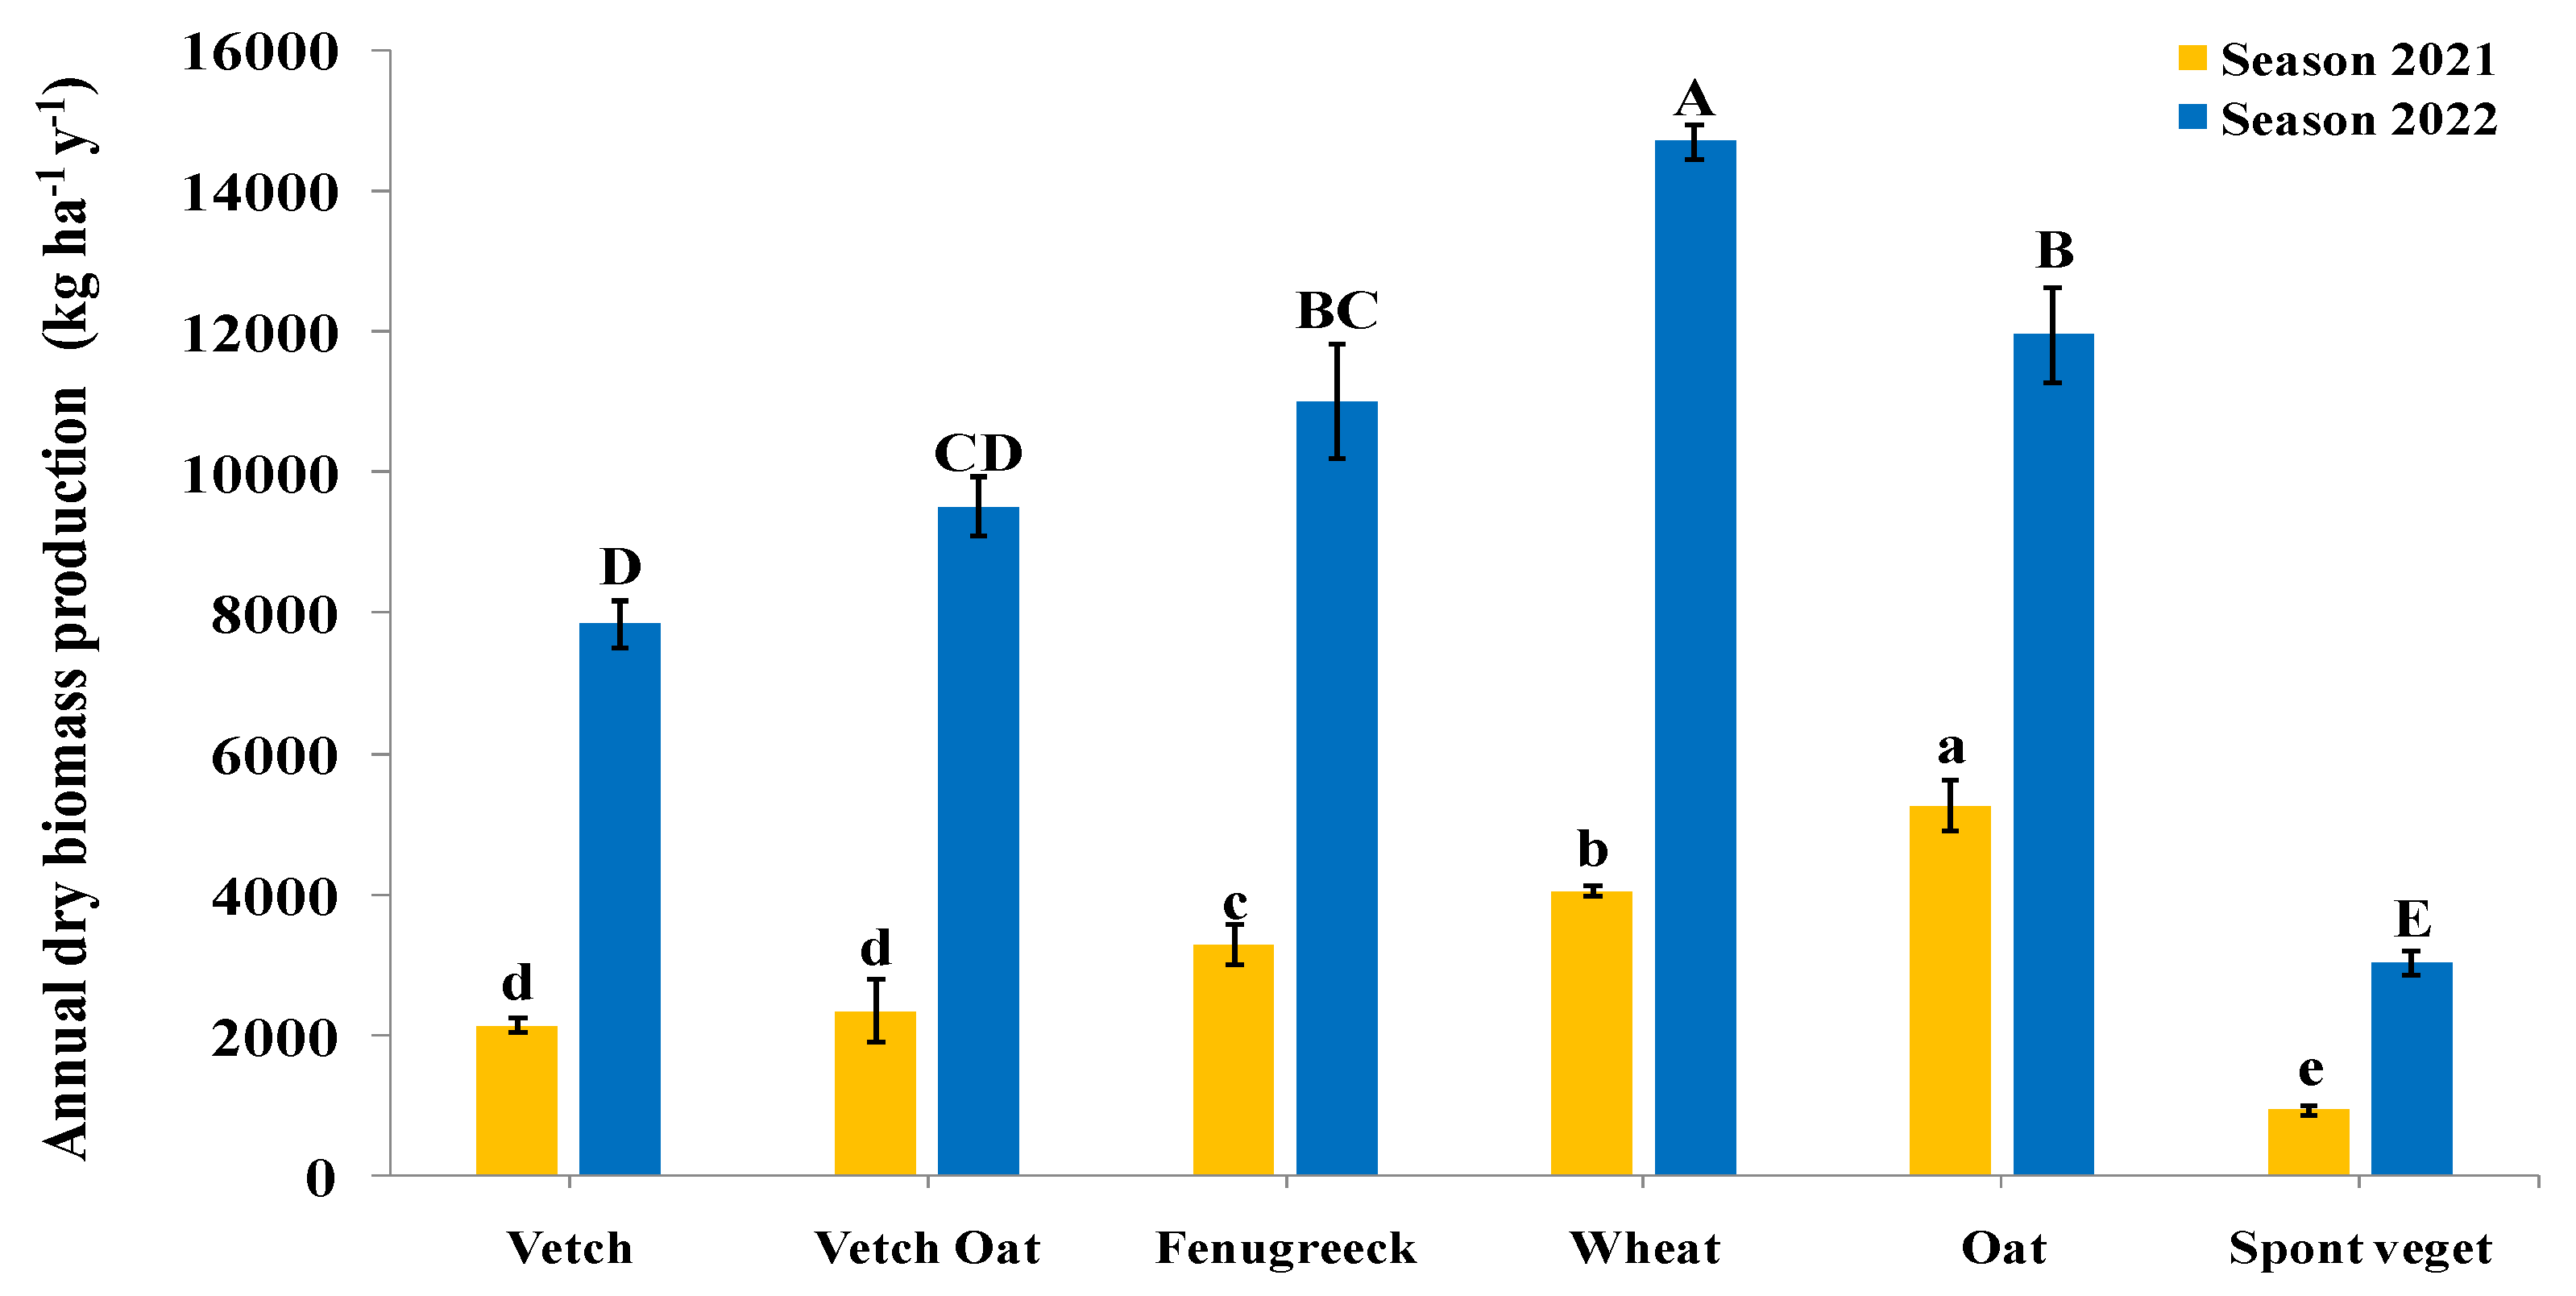
3.1. Dry Biomass of Cover Crops and Residues Incorporated into the Soil

The total dry biomass produced showed significant differences between the two cropping seasons of 2021 and 2022 (Figure 3). During the 2021 cropping season, the cover crops were cut for animal feed, and only the residues were incorporated into the soil. Meanwhile, in 2022, all the cover crops were returned to the soil as organic fertilizer. Highly significant differences were observed in the dry matter content of the seeded cover crops and spontaneous vegetation. During the first season (2021), higher dry biomass values of the residues were recorded in the wheat and oat plots of 4061 kg ha−1y−1 and 5275 kg ha−1y−1, respectively. In 2022, the wheat plots had the most dry biomass (14,714 kg ha−1y−1), while the plots of spontaneous vegetation had the least dry biomass (3046 kg ha−1y−1) (Figure 3).

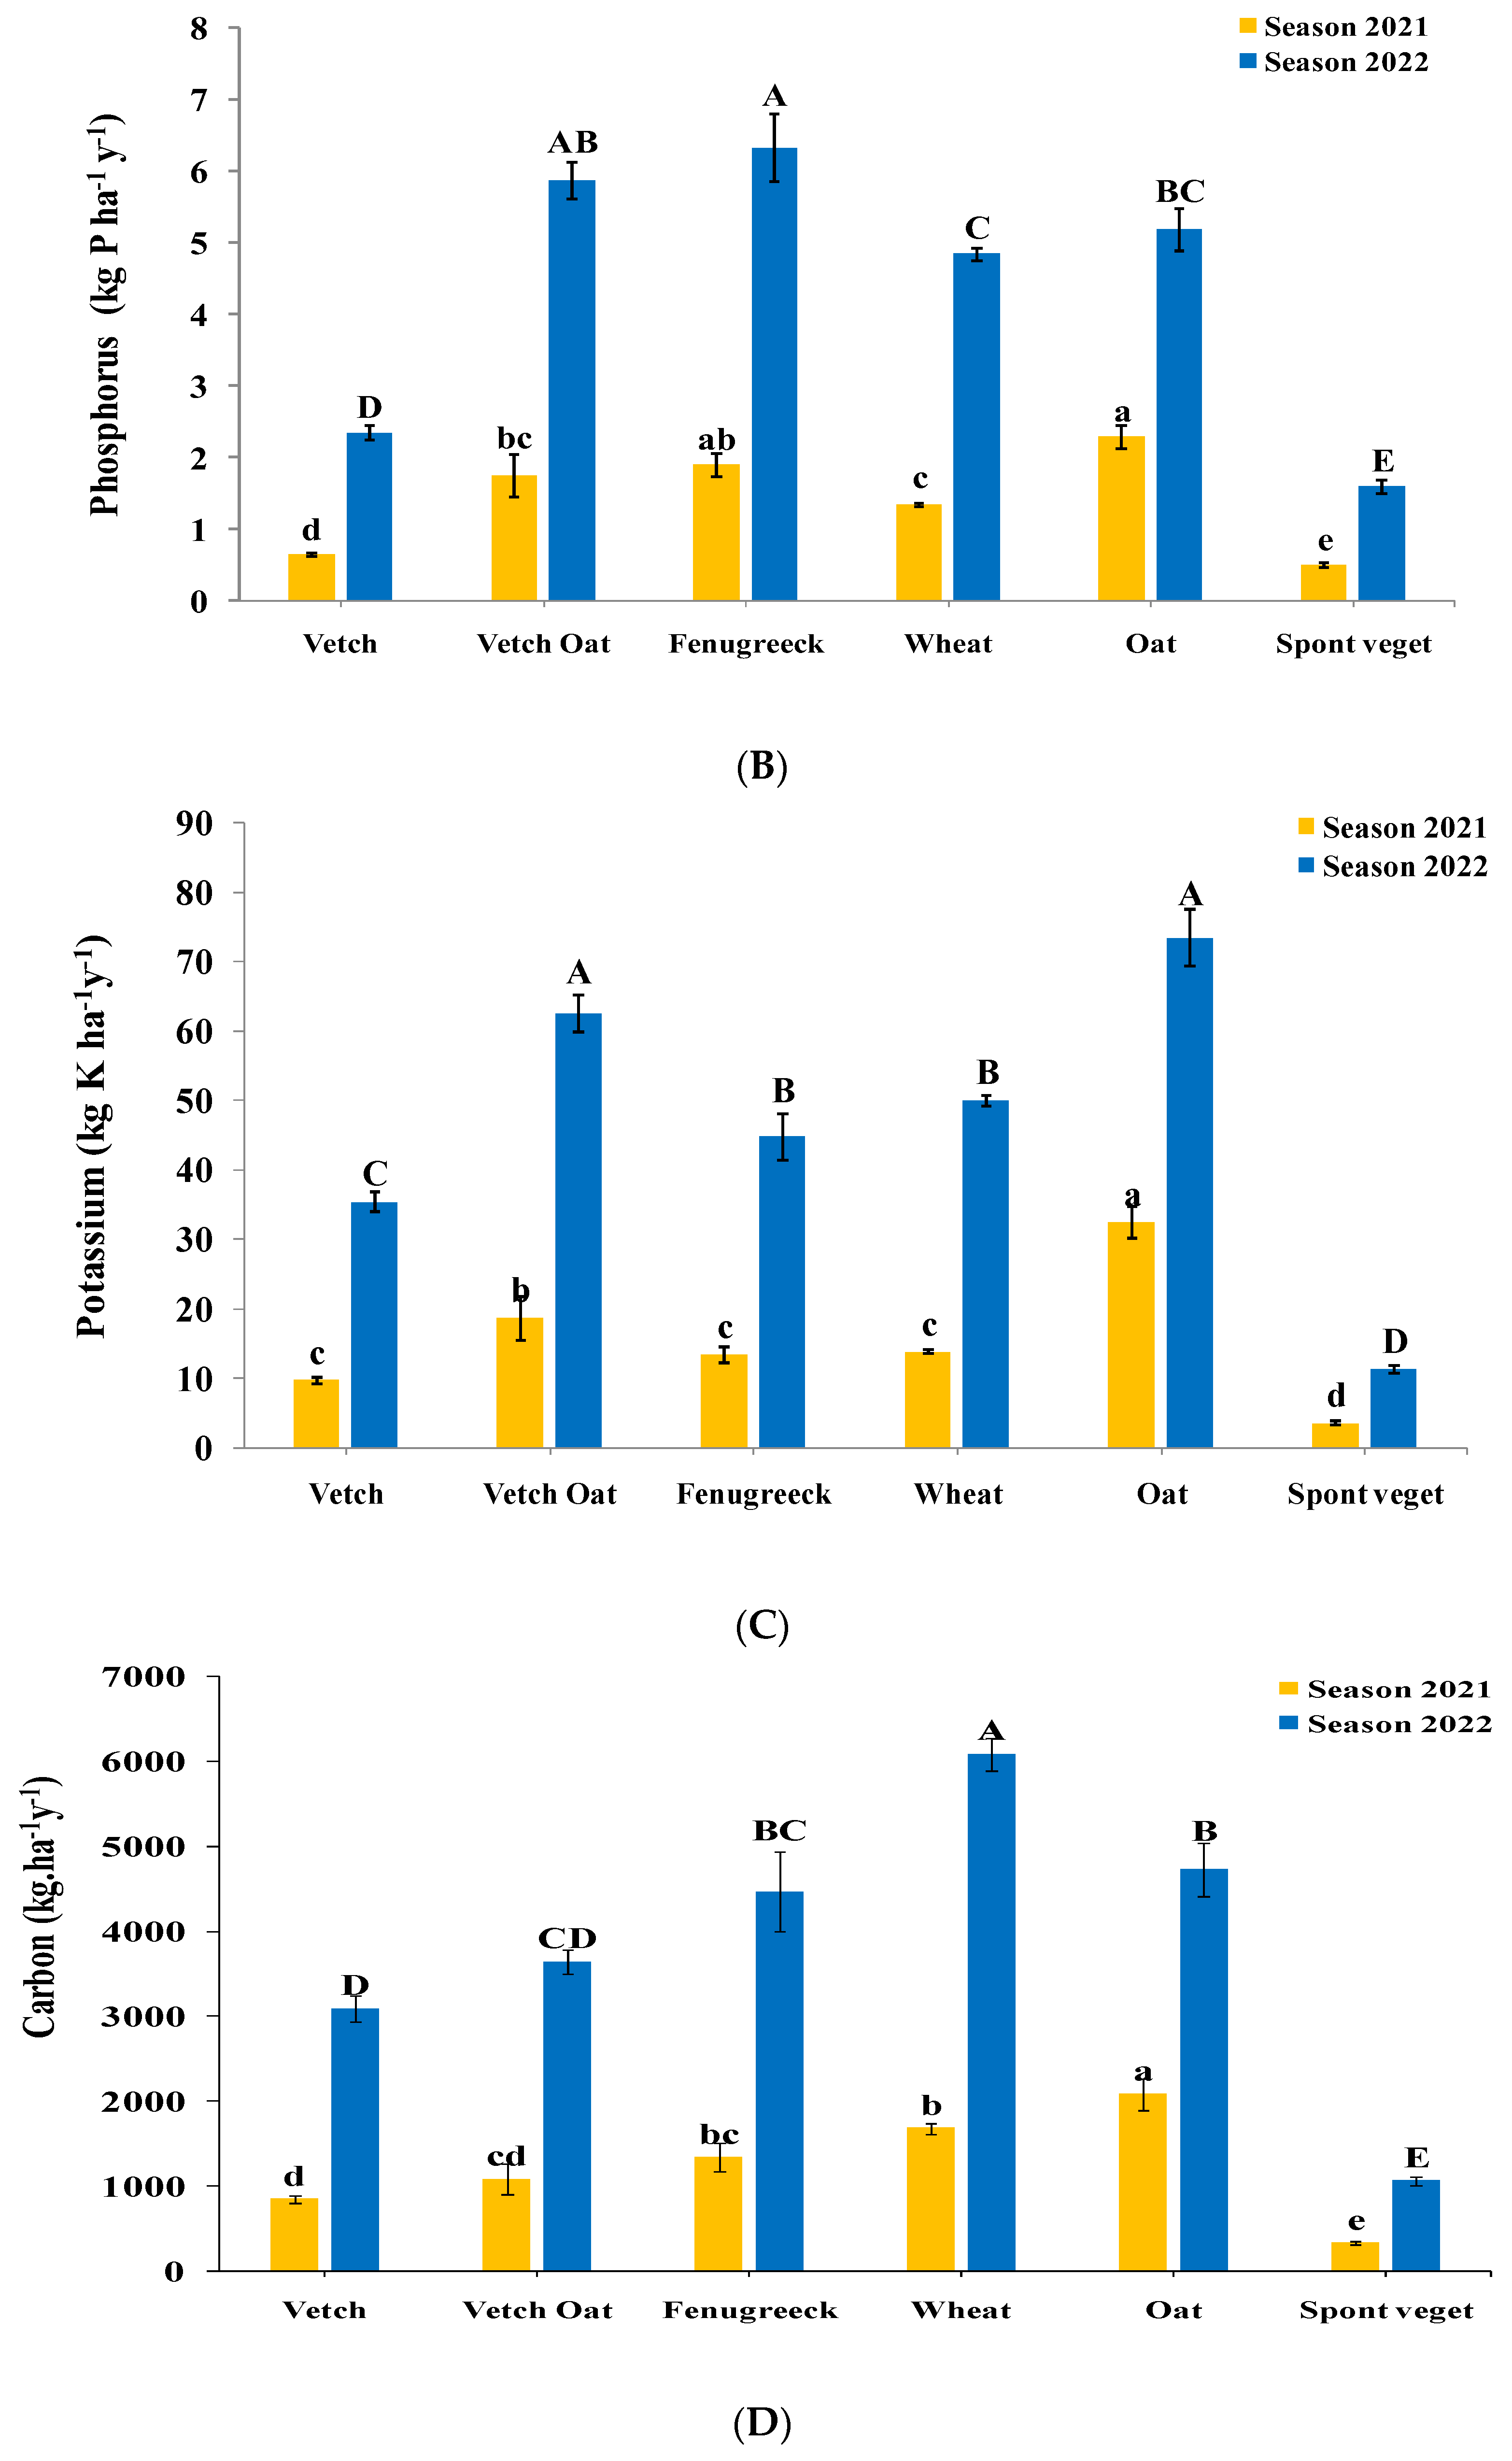
3.2. Nutrient and Carbon Retention by Cover Crops and Residues Incorporated in the Soil

The nutrients retained and carbon fixed by the cover crop residues during 2021 and 2022 are shown in Figure 4. The nitrogen uptake and the residues’ and cover crops’ incorporation into the soil during the 2021 and 2022 cropping seasons are depicted in Figure 4A. Higher significant N values were found in the fenugreek cover crop, which were 136 kg N ha−1 and 455 kg N ha−1y−1 in 2021 and 2022, respectively. The vetch and the vetch–oat mix had 60 kg N ha−1y−1 and 64 kg N ha−1y−1 in 2021, which increased in 2022 by 3 and 2.45 times, respectively. The spontaneous vegetation had the lowest N production levels.
The P accumulation in the residues incorporated into the soil during the 2021 cropping season showed a higher significant level in the oat (2.29 kg P ha−1y−1) and fenugreek (1.90 kg P ha−1y−1). During 2022, high significant values were reported in the fenugreek, wheat, and oat plots and ranged between 6.3 and 18 kg P ha−1y−1.
In the case of K retention (Figure 4C), oat had the highest production of 32.3 kg K ha−1y−1 in 2021, which increased to 45 kg K ha−1y−1 in 2022. In 2021, the K values in the wheat, vetch–oat, fenugreek, and oat plots were recorded to be 13.8, 18.6, 13.4, and 32.38 kg K ha−1y−1, respectively. But, in 2022, the vetch–oat and wheat plots’ K values increased to reach 62.5 kg K ha−1y−1 and 49.9 kg K ha−1y−1, respectively. Finally, the spontaneous vegetation had the lowest K rates during the two cropping seasons of 2021 and 2022.
In 2021, the wheat and oat crops fixed the highest amounts of atmospheric CO2 (1680 kg C ha−1y−1 and 2086 kg C ha−1y−1, respectively). The lowest value of 330 kg C ha−1y−1 was recorded in the plots with the spontaneous vegetation. Similarly, during the second season (2022), the wheat annual dry biomass incorporated into the soil had the highest significant value of fixed carbon (6087 kg C ha−1y−1) as compared to that of the other plots (Figure 4D).

3.3. Soil Organic Matter and Macronutrient Availabilities after the Incorporation of Residues and Cover Crops

Table 1 shows the soil organic matter (OM) and soil macronutrient contents (N, P, and K) of different olive plots measured after the incorporation of the residues and cover crops into the soil during the 2021 and 2022 growing seasons. In 2021, the lowest value of OM was recorded in the control. There was no significant difference between the seeded plots and the spontaneous vegetation. During the second cropping season (2022), the maximum increased rates of OM were registered in the wheat and oat plots, whose OM contents were 3.72% and 4.23%, respectively. The soil nitrogen contents were the lowest in the control plot in 2021 (0.088%) and 2022 (0.1%). In 2021, all the cover crops including the spontaneous vegetation had significantly increased levels of soil N, except for the oat crop. In the vetch–oat plots, the soil N values recorded reached their maximum levels of 0.16% and 0.17% in 2021 and 2022, respectively (Table 1). For the soil available phosphorus, the soil with the cover crops showed significantly higher values than the control plot. In fact, the soil available P values of the wheat reached 4.12 µg g−1 in 2021 and 5.88 µg g−1 in 2022. However, during the second season (2022), the soil available P in the oat, vetch–oat, and vetch crops increased significantly to reach 4.55 µg g−1, 4.70 µg g−1, and 4.80 µg g−1, respectively. High values of soil available potassium (K) were recorded after the incorporation of the residues into the soil in the vetch–oat plots (4.82 mg g−1) in 2021. During the second season (2022), the soil K values decreased for all the treatments and the control, except those of the vetch plots (Table 1).

3.4. Soil Functional Quality

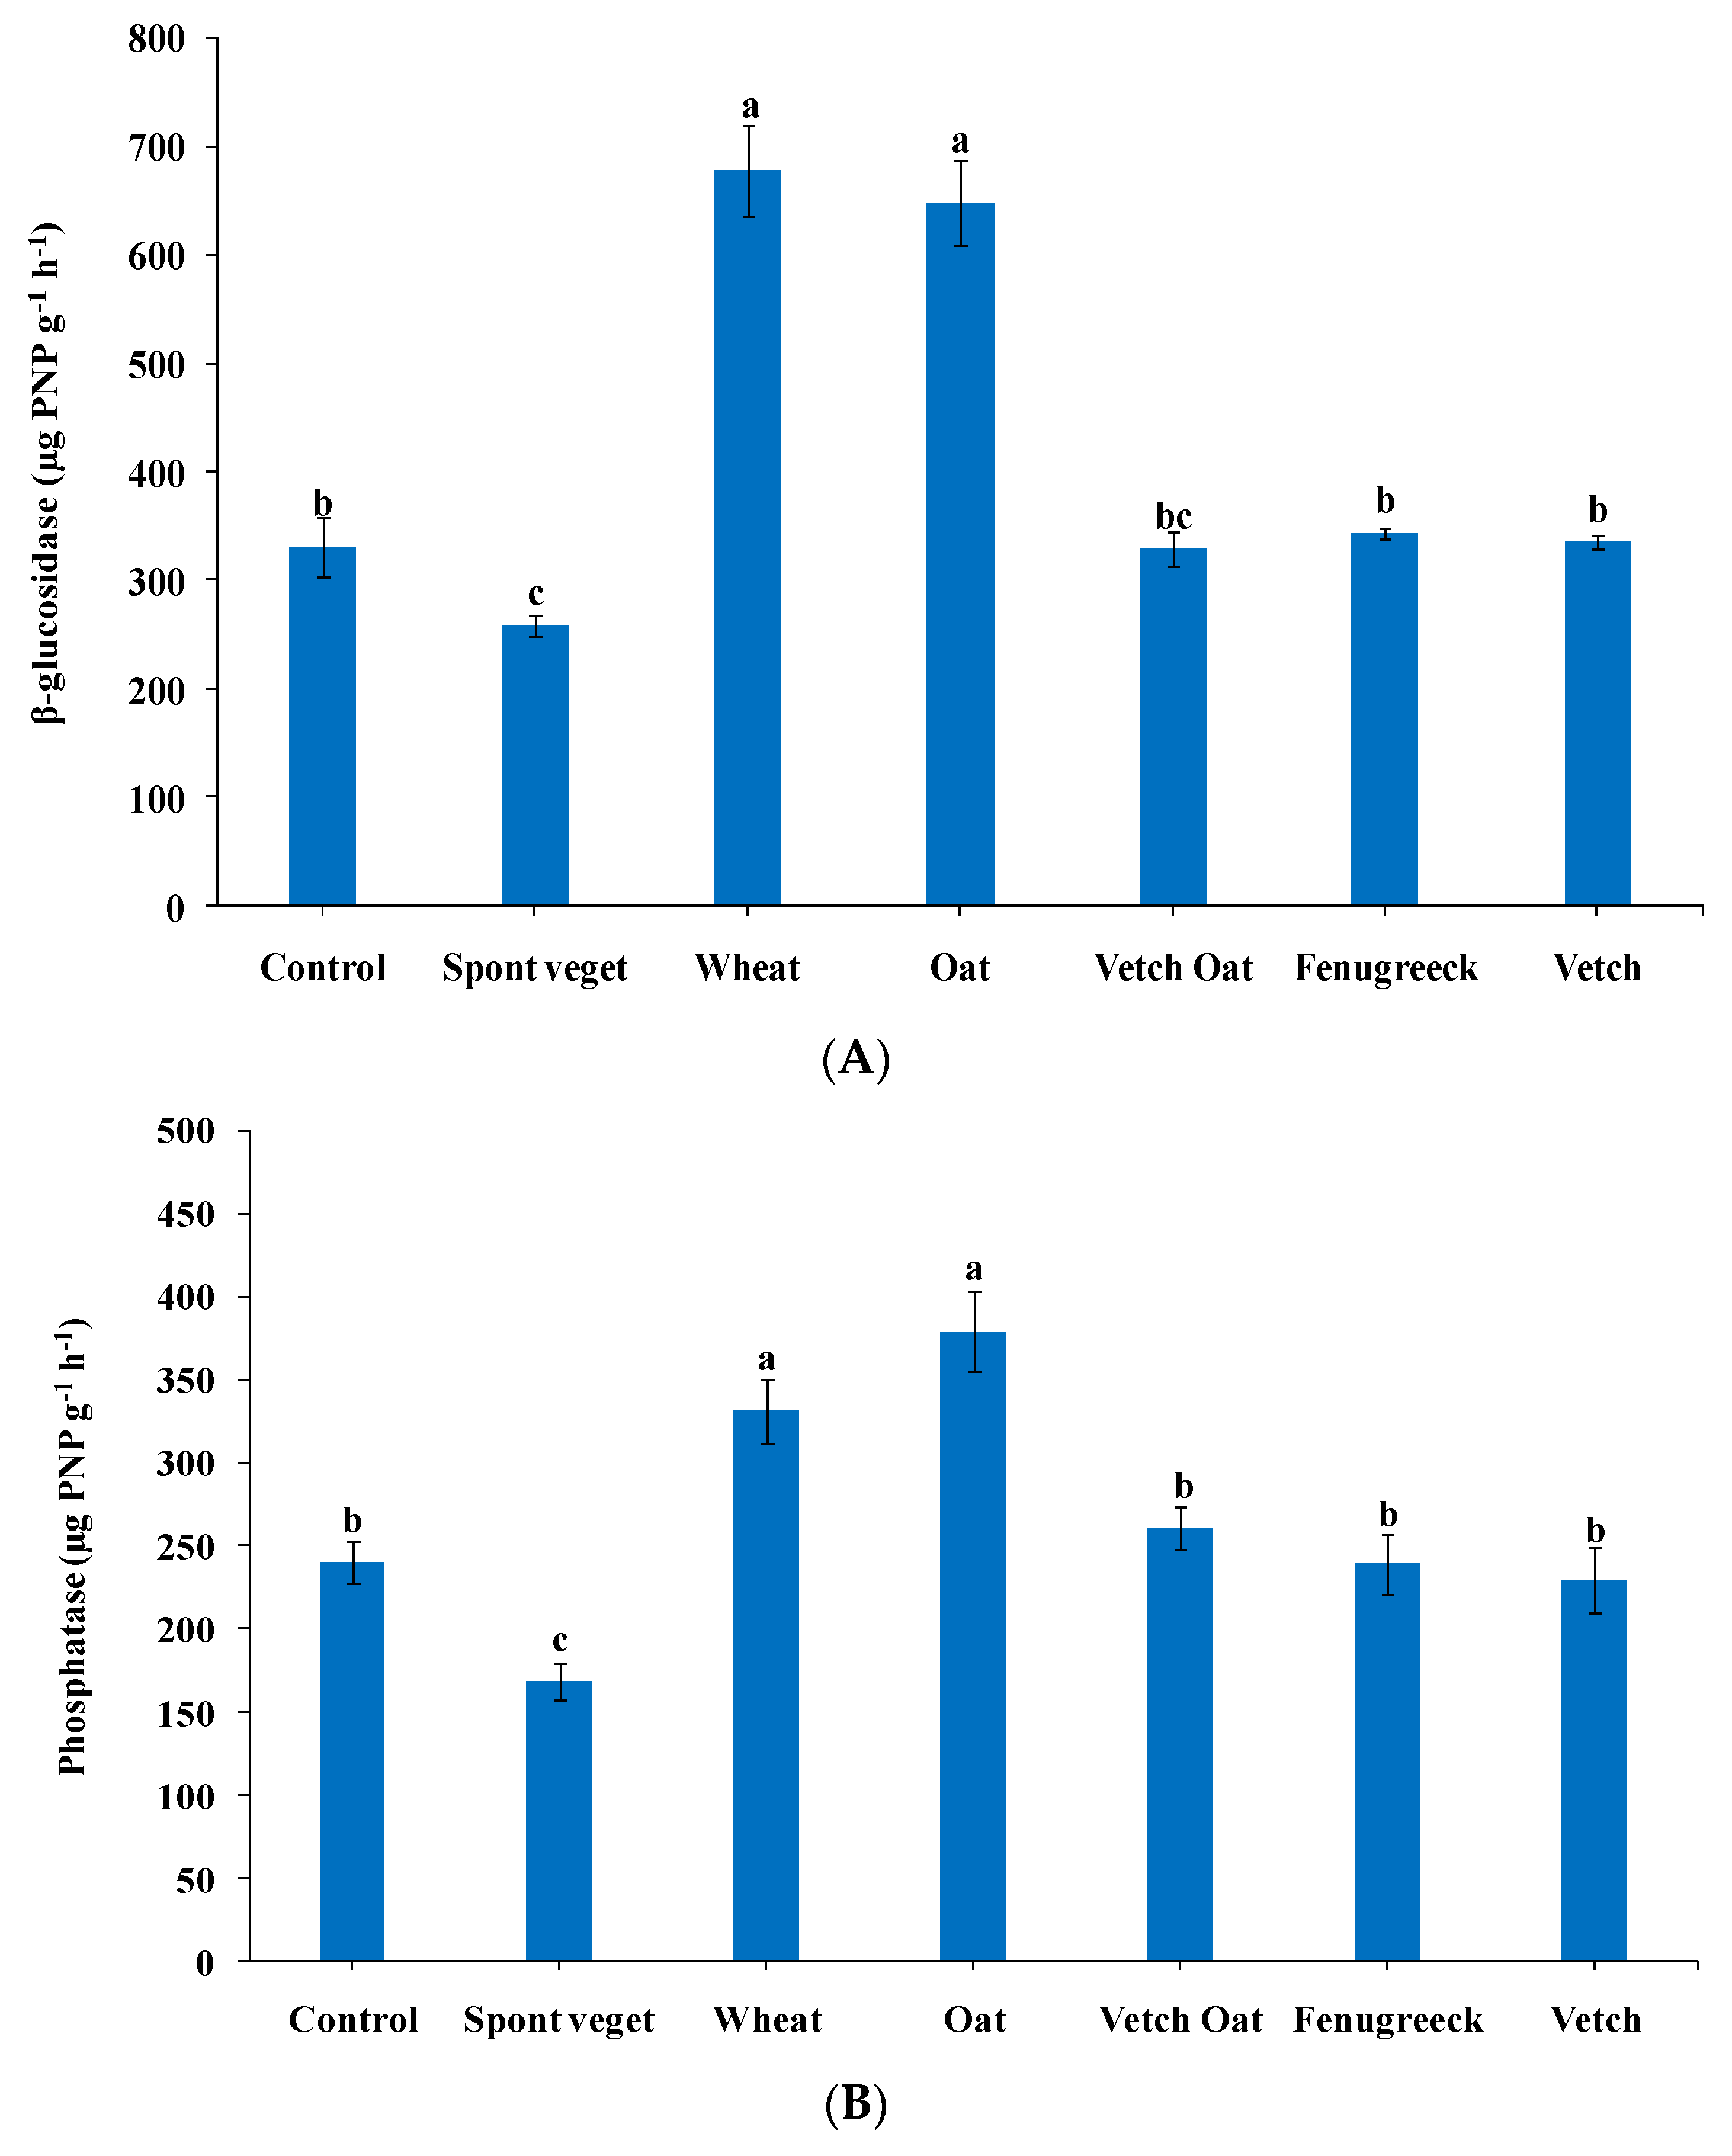
3.4.1. Soil Enzyme Activities

Figure 5 shows the soil enzyme activities and the geometric mean of each treatment and the control. The soil β-glucosidase content was higher in the wheat and oat cover crops than that in the other treatments, with significant differences. The values of β-Glucosidase reached 678 µg PNP g−1h−1 and 648.59 µg PNP g−1h−1 in the wheat and oat crops, respectively. The lowest activity was found in the soils under the spontaneous vegetation cover crops. Similarly, the wheat and oat plots achieved the highest levels of phosphatase activity with values of 378.6 µg PNP g−1h−1 and 331 µg PNP g−1h−1, respectively. For the dehydrogenase activity, the highest levels were recorded in the wheat and oat seeded plots (Figure 5C). Higher activities of this enzyme were found in the vetch–oat and wheat plots with levels of 645.8 µg PNP g−1h−1 and 600 µg PNP g−1h−1, respectively (Figure 5D). Overall, the soil health, assessed using the geometric mean of the soil enzyme activities as a proxy, was higher in the treatments with the seeded cover crops compared to the control. The values for the treatment with the spontaneous vegetation cover crops were similar to those of the control (Figure 5E).

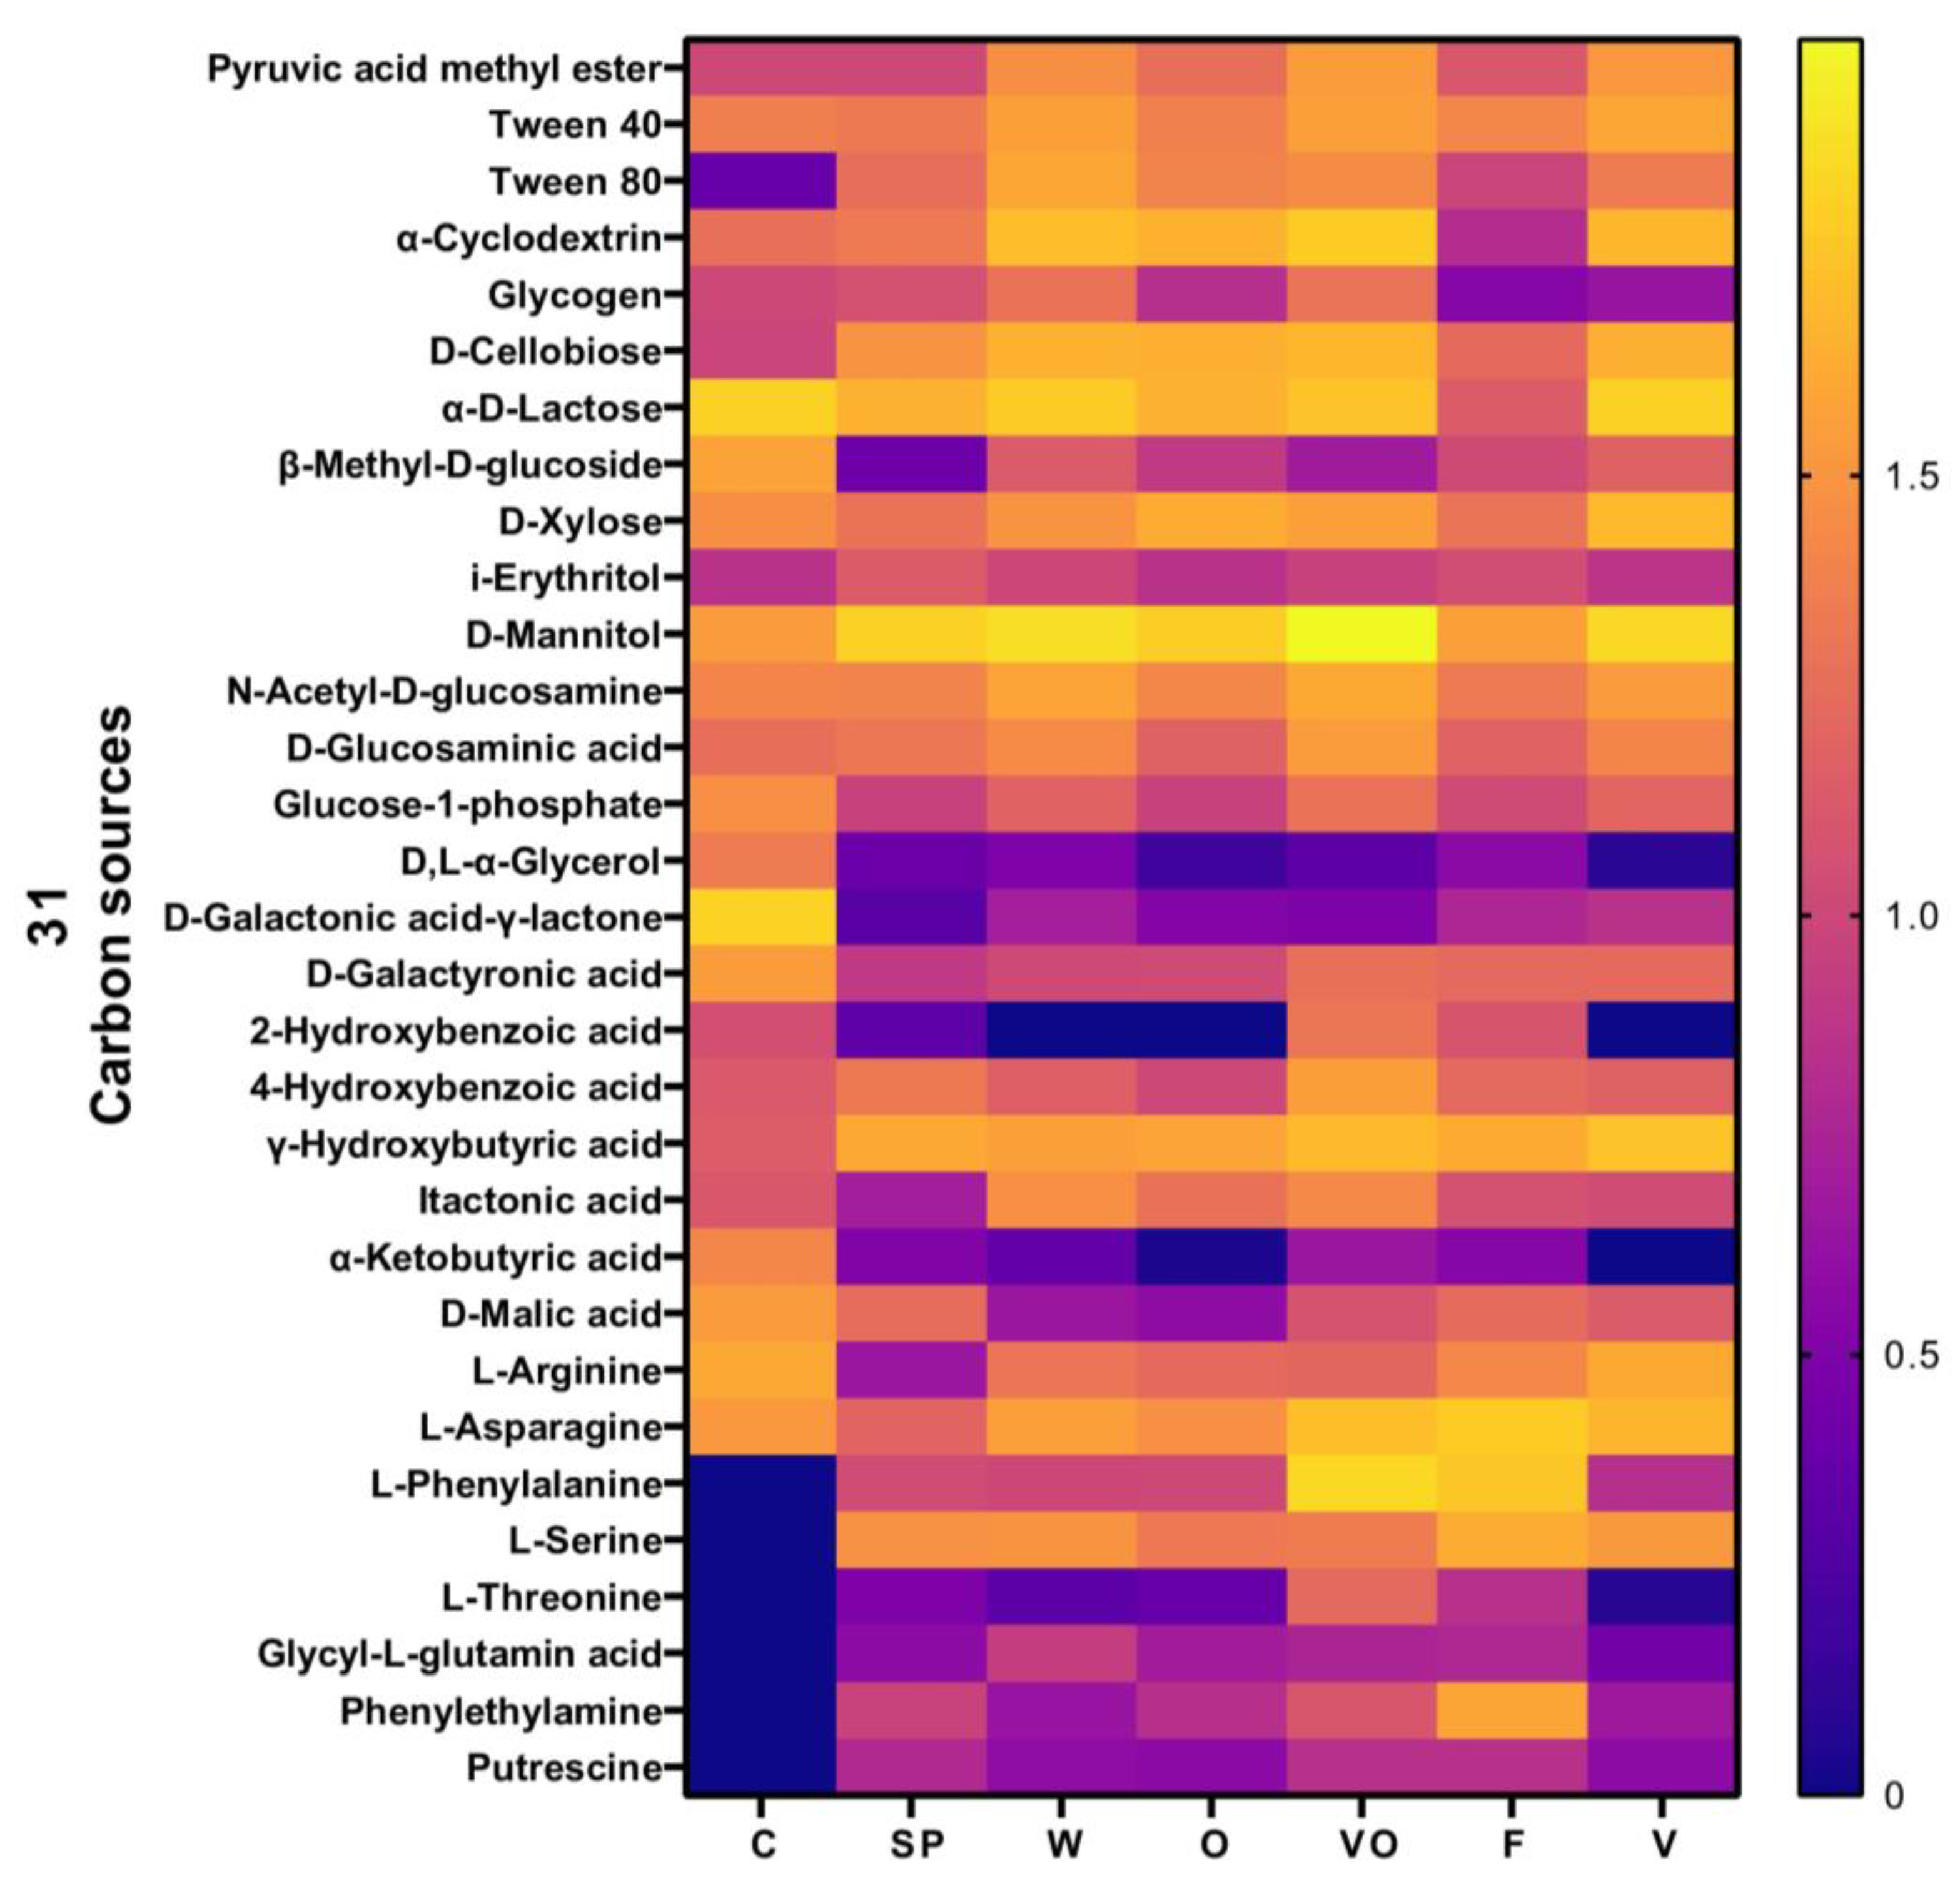
3.4.2. Carbon Utilization Sources

The microbial catabolic diversity indexes showed no significant difference among the treatments (Table 2). The average of the AWCD index for all soil samples was the highest after 120 h of incubation in the vetch–oat plots (1.31) followed by the fenugreek (1.23) and wheat plots (1.16) with no significant differences between them. The Shannon diversity index H’ obtained from the samples showed a higher reaction in the vetch–oat plots (4.84) followed by the wheat (4.77) and oat (4.71) plots. The lowest values were recorded for the spontaneous vegetation plots, the control, and the vetch plots. The substrate richness index was the highest for the fenugreek and vetch–oat seeded plots with no significant difference between the plots. The Shannon evenness index rates ranged from 1.38 to 1.42.
The SOC utilization sources were mainly dominated by carbohydrates and polymers, and the lowest results in general were for the control and spontaneous vegetation plots. Overall, carbohydrates and polymers dominated the plots’ carbon groups, particularly in the control, spontaneous vegetation, wheat, and oat plots. The vetch–oat and fenugreek plots were dominated by amino acids, amines, amide, and carboxylic acids (Figure 6). A detailed substrate consumption analysis within carbon source groups showed the impact of the seeded cover crops. In fact, the vetch–oat showed the most highlighted carbon sources (>1.5 OD) compared to the other treatments, and it was predominantly by carbohydrates (pyruvic acid methyl ester, d-cellobiose, α-d-lactose, d-xylose, d-mannitol, and n-acetyl-d-glucosamine), polymers (Tween 40 and α-cyclodextrin), carboxylic acids (d-glucosaminic acid, 4-hydroxybenzoic acid, and γ-hydroxybutyric acid), and amino acids (l-asparagine and l-phenylalanine). The wheat and oat profiles are approximately similar with an inhibition of 2-hydroxybenzoic acid cells. Amino acids, amines, and amide cells were more activated in the legumes (fenugreek and vetch) but were inhibited in the control plot cells (Figure 7)

4. Discussion

Conservation systems that reduce tillage and increase cropping intensity, diversity, and crop residue inputs have the potential to improve soil health, as well as agro-ecosystem productivity and resilience. Further, soil health depends on complex biophysical and biochemical interactions in time and space. This emphasizes that soil is a living, dynamic system that provides multiple ecosystem services. In Tunisia, numerous studies have underscored the significance of cover crops in olive groves, while dry biomass production has garnered insufficient attention. In our study, the cover crop and residue biomass incorporated into the soil depended on the crop species tested during the two consecutive cropping seasons of 2021 and 2022. The grass cover crops, mainly wheat, yielded a significantly higher amount of biomass compared to the legume cover crops and their mixtures. Intercropped cover crops in olive orchards have shown varying levels of biomass production depending on species, rainfall, soil fertility, and seeding rate. In fact, our results agree with those of previous studies of Moroccan olive-based agro-forestry systems, which found that cereals produced significantly more aboveground biomass than legumes, with barley having the highest biomass production of 1290 kgha1 followed by durum wheat (970 kgha1), chickpea (310 kgha1), and faba bean (320 kgha1) [36]. This statement is supported by the authors of [37,38], who found a higher biomass production in grass species (barley, durum wheat, and soft wheat) compared to legumes (faba bean and lentil). In Spain, the annual net primary production of spontaneous vegetation reached 2000 kgha1, which is lower than that reported in our study [39]. The high levels of biomass production in our study could be related to the rainfall that occurred in 2021 and 2022, cover crop types, and the species characterizing the natural vegetation. In contrast, ref [40] mentioned a study reported that a mixture of early maturing and self-reseeding annual legumes resulted in higher ground cover percentages and biomass production, compared to those of natural vegetation [41]. In the same way, the authors of [42] reported that the highest level of areal biomass was recorded in mixtures of Bromus-, Medicago-, and Anthemis-seeded cover crops in olive orchards. According to our study, soil quality and the use of manure as a soil fertilizer by farmers seems to have influenced the high cover crop biomass production. These results agree with those of [43], who found that cover crops, including natural vegetation, under sustainable management systems had higher biomass production and carbon contents, indicating enhanced carbon storage and a potential increase in soil organic matter.
Usually in olive orchards, the cover crop biomass is incorporated into the soil as a fertilizer and soil protector [7,16,17]. In addition, the biomass produced by the different cover crop species tested can be cut and used as feed for animal production, increasing the olive ecosystem’s profitability and services, as well as the incomes of farmers. In this case, only residues are incorporated into the soil and serve as bio-fertilizers [44,45]. The carbon rate fixed by the cover crops was closely related to the respective dry biomass produced. Indeed, during the two consecutive cropping seasons (2021 and 2022), the wheat fixed the high carbon levels, followed by the oat and fenugreek. The C content of the cover crops from our study has a similar pattern to that obtained for some intercropped Mediterranean olive groves [43].
For the macronutrient content, our results agree with [46], who indicated the role of legumes in fixing N, compared to grass species. The nitrogen content of aboveground biomass reached values close to 90, 40, and 10 kg N ha−1y−1 in legumes, fertilized natural vegetation, and non-fertilized natural vegetation, respectively [41]. Additionally, the authors of [47] found that faba bean and oat–vetch were able to fix about 105 and 89 kg N ha−1y−1, respectively. In our study, the biomass of the legume species and the legume mix had a much higher N content, mainly for the fenugreek, for which the N uptake reached 100 and 400 kg N ha−1y−1 in 2021 and 2022, respectively. These results could be due to the initial soil fertility and the seeding rate adopted in our experiment. The high levels of N in legume crops (fenugreek and vetch) and grass–legume mixtures (vetch–oat) can be explained by the fact that the main characteristic of legumes is that they are nitrogen-fixing plants that are economically and environmentally beneficial to soil [48]. In the 2022 crop season, the amount of nitrogen in the biomass of the spontaneous vegetation was close to 48.kg N ha−1y−1, a figure similar to the 52 kg N ha−1y−1 reported for natural vegetation in other olive groves [43].
The soil available phosphorus (P) level accumulated by the spontaneous vegetation was about 1.6 kg P ha−1 y−1. Many other studies have reported a higher value, close to 2.5 kg P ha−1, for the biomass of spontaneous vegetation grown in olive orchards under Mediterranean conditions [39]. However, another recent study in olive groves found levels in natural vegetation as high as 6 kg P ha−1y−1 [43]. These differences are probably attributed to the vegetation species of the spontaneous cover crops. The highest values of P accumulated by the cover crops, exceeding 5 kg P ha−1y−1, were observed in the oat, vetch–oat, wheat, and fenugreek crops. These findings could be due to the root density extension and the exudates produced, which make soil phosphorus more available to the principal crops. Recently, [49] reported that root exudates appeared to enhance P-solubilizing activity and overall P availability. The existence of rhizobium in legumes and mycorrhiza in grass roots [50] might also be involved in the phosphorus bioavailability in the soil [51]. The authors of [52] reported that rhizobium could act as a phosphate solubilizer, hormone producer, and to some extent, an N-fixer. The highest levels of K retention in the biomass were recorded in the grass species (wheat and oat) and the grass–legume mix (vetch–oat) in the dry biomass produced [53,54]. These findings were attributed to their larger root surface area, longer root length including the finest roots, and greater affinity of transporters to maximize K uptake in grass plants [55]. In our research, we discovered that the fenugreek outperformed vetch and the other cover crops in terms of nitrogen accumulation. We also observed significant amounts of phosphorus accumulation in both the fenugreek and the vetch–oat mixture, along with the grass crops. In addition, an interesting finding was that the vetch–oat biomass accumulated significant amounts of phosphorus and potassium.
The increase in the SOM in the treatments with the cover crops was mainly due to the incorporation of cover crop residues in the soil, as well as their cumulative effects during the second cropping season (2022) and the application of manure. In Tunisia, the use of legumes as a cover crop in olive orchards has been reported to increase the soil organic matter up to 1.5%, three times higher than a control [7]. More recently, the authors of [56] tested intercropping olive trees with vetch and a barley–vetch mixture, which resulted in a higher soil organic matter content. Moreover, grass cover crops, when used between olive trees, can act as a sponge to conserve water, prevent flash floods, and increase soil organic matter content, contributing to soil health and potentially mitigating climate change [57]. In our study, the SOM in all of the cover crop treatments and spontaneous vegetation was higher than 2.5%, due not only to the dry biomass incorporated into the soil (the cover crops and residues), but also to the amount of manure applied (10 tonnes ha−1). The desirable organic matter content in soil is between 2 and 3% depending on the texture of the soil, and this can reach up to 6% in most agricultural soil [58]. In summary, our results suggest that grass cover crops can have a positive impact on soil organic matter, potentially contributing to soil nutrient status and functional quality in olive farms. However, the effectiveness of cover crops in increasing soil carbon stocks may depend on various factors, including soil depth, cover crop use, duration, and co-management strategy.
The dry biomass and the SOM generated by the cover crop plays an important role in soil characteristics and nutrient dynamics [39,43]. The availabilities of soil macronutrients in the top soil layer were the result of organic matter decomposition. During the 2021 and 2022 cropping seasons, the soil N with cover crops increased compared to that of a control [16,44] with no significant differences between species or the dry biomass incorporated into the soil. The values were still in the range of soil N limits. Moreover, the authors of [7] reported that the use of legumes as cover crops increased the soil N by about 25% as compared to a control plot. Vetch improved the soil nitrate content by over 35% for barley at a 0–20 cm soil depth throughout the studied period [39]. The N content in the surface soil layer can be influenced by the sampling date, the decomposition process, and the dry biomass incorporated into the soil [16]. Whether N is mineralized or immobilized greatly depends on the C:N ratio of the organic residues being decomposed [21].
The soil phosphorus level seems to be influenced not only by the dry biomass produced but also by the cover crop species. High values were reported in the soils of the plots seeded with the grass species compared to those seeded with the legumes. In contrast, the P content exported by the biomass cover crops was high, suggesting a low SOM content in the decomposition process and a short sampling period (the second year). The decomposition pattern of the organic matter was accelerated when the rainfall was recorded, and the mild temperatures favoured the activity of microorganisms. Long-term cover crops have been attributed to improving soil P bioavailability and increasing the content of total phosphorus (TP), microbial phosphorus, organic phosphorus, and certain forms of inorganic phosphorus in surface soil [59]. Cover crops have been shown to significantly impact soil phosphorus (P) dynamics. Residues decomposition can help to the P nutrition of subsequent crops, with the extent of their contribution depending on their quality and the soil’s P status [52]. Studies in Tunisia have reported that vetch cover crop significantly increased the soil P availability [56,59].
Cover crops and spontaneous vegetation significantly increased the soil potassium levels as compared to those of a control and were correlated with the dry biomass incorporated into the soil. The decreased soil K levels during the second season (2022) can be explained by low amount of dry matter decomposition process and the K fraction exported by olive trees. Indeed, some studies have revealed that olive trees export high levels of potassium during their vegetative and fruiting life cycle [54].
The annual dry biomass incorporated into the soil during the two seasons (2021 and 2022) and their nutritional contents had a significant impact on soil functional health indicators, such as soil enzyme activities. In fact, intercropping in olive farms has been found to significantly increase soil enzyme activities, indicating improved soil quality and biological activity [60,61]. In our study, significantly higher activities of β-glucosidase, phosphatase, and arylsulfatase were recorded under the cover crop treatments, mainly in the wheat and oat treatments, which produced the highest amounts of residues and carbon applied to the soil. Similarly, [62,63] reported that soil enzyme activities, mainly dehydrogenase and phosphatase, were on average 20% higher in plots under cover crops in comparison to a control treatment. A more developed cover crop helps in improving soil glycosidase and phosphatase activities [64,65]. Indeed, intercropping with grass species increased soil phosphatase activity in a short time after the incorporation of the dry biomass produced [66]. The use of oats as a cover crop increased both phosphatase and β-glucosidase activities [17]. In concordance with our results, legume used as cover crops in rainfed olive groves led to a significantly increased soil dehydrogenase activity [31,67]. Similarly, legume and grass mixtures increased soil arylsulfatase activity threefold in the short term compared to a control [65,68]. The higher geometric mean of soil enzyme activities in the seeded cover crops in this study, coupled with the increased levels of soil organic matter (SOM), clearly indicates improved soil health, which is attributed to the organic matter inputs, primarily from the residues of the cover crops. Indeed, typically, soil enzyme activity is proportional to microbial respiration activity, and it is considered a suitable indicator of soil quality and microbial activity [31,63]. Microorganisms are usually higher under sustainable soil management in general and particularly when using cover crops [10,17]. In our case, the Biolog EcoPlate™ indicators showed no significant difference between our treatments. This can be explained by the short-term effect of the biomass, while a great difference was clear in specific carbon groups. The highest values of the AWCD, a proxy of the amount of soil bacteria capable of degrading a specific source of organic carbon, were reported in the soils in the vetch–oat, wheat, and fenugreek plots, reflecting their higher microbial metabolic activity because of the greater input of carbon and nitrogen compounds in these plots [69]. In agreement with our results, cover crops were shown to significantly promote AWCD and other indicators as well as the utilization of different carbon source types [59]. The relative consumption pattern of the carbon sources in this study showed differences in the community composition of microorganisms related to the cover crop types. In fact, polymers and carbohydrates are the substrates that are the most used by microorganisms in the soil plots of the control, vetch, vetch–oat, and wheat plots, which can be interpreted as meaning microorganisms prefer carbon sources with a high energy input. However, the substrates consumed by microorganisms in the fenugreek soil plots are amino acids, amines, and amides. These findings can be attributed to the fact that the consumption of amines and amides contributes to the need for nitrogen sources by rhizobium [70]. Additionally, ref [22] showed that the presence of a cover crop, mainly grass species, had some influence on soil ecology and led to soils utilizing more carbon sources than soils without cover crops. Our results suggest the synergistic effect of legumes and grass biomass decomposition on soil microbiota diversity, which is a key factor in improving soil health and fertility. The increased diversity of microorganisms, driven by the diverse carbon sources of various cover crops, contributes to a more robust and resilient soil ecosystem. In fact, a microbial community can provide a broad range of functions during physical and chemical disturbances. Moreover, cover crops, such as oat, cereal rye, and wheat, can increase arbuscular mycorrhizal fungi (AM fungi) in agricultural soil [71]. Moreover, AM fungi enhance crop production by protecting host plants from pathogens, improving nutrient uptake and plant health by increasing host plant tolerance to environmental stresses, such as drought [72]. More recently, many studies have demonstrated that olive plantlets inoculated with AM fungi (Glomus intraradices) were more resistant to water stress than non-inoculated plantlets [73]. The different consumption patterns of carbon sources revealed in our study indicate the potential of strategic cover crop selection to manipulate soil microbial communities and functions. Future research should focus on elucidating the specific mechanisms underlying these interactions and their impacts on plant productivity and environmental sustainability.

5. Conclusions

Cover crops have the potential to provide many benefits to soil health in diverse cropsystems and climates, mainly in semi-arid regions. The results of this study revealed that the biomass produced by wheat and oat was much greater than that of a control and spontaneous vegetation. The grain and straw of these cover crops were used as fodder for animal nutrition, and their residues were applied to the soil, increasing the farmer’s income and enhancing other soil ecosystem services. The incorporation of cover crops, either for spontaneous vegetation or after mowing, increases the soil’s chemical quality, mainly soil organic matter, soil nitrogen, and soil available phosphorus content. The increase in soil organic matter had great effects on the soil’s health, here measured as the soil enzyme activities and their geometric mean. Indeed, dehydrogenase, phosphatase, and β-glucosidase increased in the cover crop treatments, mainly the wheat, oat, and vetch–oat mixture plots. On the other hand, carbohydrates, carboxylic acids, amides, and amino acids were the most utilized carbon sources by soil microorganisms. However, the organic carbon utilization profile by soil microorganisms was not as sensitive as the soil enzyme activities, and the ACWD, H’, S, and E were not significantly affected by the cover crops. The results from this study also suggest that the system based on the seeded mixtures (vetch–oat) seemed to be the best cover crop in terms of improving soil quality (with a higher geometric mean of soil enzyme activities) with equilibrium nutrient status. Our results suggest the need to advise farmers to regularly monitor the soil organic matter content and select the best methods of soil management and seeded cover crop species to improve soil functionality and agronomic productivity. Still, further investigations are necessary and should be focused on the effects of long-term cover crops on soil health indicators, olive ecosystem productivity, and olive oil yield and quality.

Author Contributions

Conceptualization, F.E. and H.C.; methodology, F.E. and J.A.C.G.; software, F.E., S.A., H.C., R.G.-R. and J.A.C.G.; formal analysis, F.E. and J.A.C.G.; writing—original draft preparation, F.E. and H.C.; writing—review and editing, F.E., S.A., H.C., R.G.-R. and J.A.C.G.; project administration, R.G.-R. and J.A.C.G.; funding acquisition, R.G.-R. All authors have read and agreed to the published version of the manuscript.

Funding

This research was funded by PRIMA-EU (grant nº 1811) “Novel approaches to promote the Sustainability of OLIVE cultivation in the Mediterranean”.

Institutional Review Board Statement

Not Applicable.

Informed Consent Statement

Not Applicable.

Data Availability Statement

The data presented in this study are available on request from the corresponding author.

Acknowledgments

This study was supported by the Ministry of Agricultural and Water Resources in Tunisia and by the Project “Novel approaches to promote the SUSTAInability of OLIVE cultivation in the Mediterranean” (SUSTAINOLIVE; sustainolive.eu) funded through PRIMA-EU (grant nº 1811). We express our sincere thanks to the members of the Olive Tree Institution, especially to Zoubeir Mahjoub.

Conflicts of Interest

The authors declare no conflicts of interest. The funders had no role in the design of the study; in the collection, analyses, or interpretation of data; in the writing of the manuscript; or in the decision to publish the results.

References

  1. OLIVAE. Official Journal of the International Olive Council. 2017. Available online: www.internationaloliveoil.org (accessed on 13 April 2024).
  2. Ben Abdallah, S.; Elfkih, S.; Suárez-Rey, E.M.; Parra-López, C.; Romero-Gámez, M. Evaluation of the environmental sustainability in the olive growing systems in Tunisia. J. Clean. Prod. 2021, 282, 124526. [Google Scholar] [CrossRef]
  3. Elfkih, S.; Hadiji, O.; Ben Abdallah, S.; Boussadia, O. Water Accounting for Food Security: Virtual Water and Water Productivity in the Case of Tunisian Olive Oil Value Chain. Agriculture 2023, 13, 1205. [Google Scholar] [CrossRef]
  4. DGPA. Document de la Direction Générale de la Production Agricole en Tunisie; DGPA: Tunis, Tunisia, 2021. [Google Scholar]
  5. ONH. Rapport de l’Office National de l’Huile en Tunisie; ONH: Tunis, Tunisia, 2023. [Google Scholar]
  6. Gargouri, K.; Mhiri, A. Relalionship between soil fertility, phosphorus and potassium nutrition on the olive in Tunisia. Opt. Mediterr. 2003, 50, 199–204. [Google Scholar]
  7. Chehab, H.; Tekaya, M.; Ouhibi, M.; Gouiaa, M.; Zakhama, H.; Mahjoub, Z.; Laamari, S.; Sfina, H.; Chihaoui, B.; Boujnah, D.; et al. Effects of compost, olive mill wastewater and legume cover cropson soil characteristics, tree performance and oil quality of olive trees cv. Chemlali grown under organic farming system. Sci. Hortic. 2019, 253, 163–171. [Google Scholar] [CrossRef]
  8. Issaoui, M.; Flamini, G.; Brahmi, F.; Dabbou, S.; Ben Hassine, K.; Taamali, A.; Chehab, H.; Ellouz, M.; Zarrouk, M.; Hammami, M. Effect of the growing area conditions on differentiation between Chemlali and Chétoui olive oils. Food Chem. 2010, 119, 220–225. [Google Scholar] [CrossRef]
  9. Ben Youssef, N.; Zarrouk, W.; Carrasco-Pancorbo, A.; Zarrouk, M. Effect of olive ripeness on chemical properties and phenolic composition of Chétoui virgin olive oil. J. Sci. Food Agric. 2010, 90, 199–204. [Google Scholar] [CrossRef]
  10. Li, T.; Wang, Y.; Kamran, M.; Chen, X.; Tan, H.; Long, M. Effects of Grass Inter-Planting on Soil Nutrients, Enzyme Activity, and Bacterial Community Diversity in an Apple Orchard. Front. Plant Sci. 2022, 13, 901143. [Google Scholar] [CrossRef] [PubMed]
  11. Koch, F.; Patterson, J. How can science policy help to deliver the global goals. Guard. Sci. Policy Blog. 2015, 10, 17–25. [Google Scholar]
  12. Koudahe, K.; Allen, S.C.; Djaman, K. Critical review of the impact of cover crops on soil properties. Int. Soil Water Conserv. Res. 2022, 10, 343–354. [Google Scholar] [CrossRef]
  13. Piccolo, A. The Nature of Soil Organic Matter and Innovative Soil Managements to Fight Global Changes and Maintain Agricultural Productivity. In Carbon Sequestration in Agricultural Soils A Multidisciplinary Approach to Innovative Methods; Springer: Berlin/Heidelberg, Germany, 2012; pp. 1–19. [Google Scholar]
  14. Blanco-Canqui, H.; Mikha, M.M.; Presley, D.R.; Claassen, M.M. Addition of Cover Crops Enhances No-Till Potential for Improving Soil Physical Properties. Soil Sci. Soc. Am. J. 2011, 75, 1471–1482. [Google Scholar] [CrossRef]
  15. Beniaich, A.; Guimarães, V.D.; Avanzi, J.C.; Silva, B.M.; Salvador, F.A.G.; Santos, W.P.; Silva, M.L.N. Spontaneous vegetation as an alternative to cover crops in olive orchards reduces water erosion and improves soil physical properties under tropical conditions. Agric. Water Manag. 2023, 279, 108186. [Google Scholar] [CrossRef]
  16. Ordóñez-Fernández, R.; de Torres, M.A.R.R.; Márquez-García, J.; Moreno-García, M.; Carbonell-Bojollo, R.M. Legumes used as cover crops to reduce fertilization problems improving soil nitrate in an organic orchard. Eur. J. Agron. 2018, 95, 1–13. [Google Scholar] [CrossRef]
  17. Huertas, A.J.; Cuartero, J.; Ros, M.; Pascual, J.A.; Parras-Alcántara, L.; González-Rosado, M.; Özbolat, O.; Zornoza, R.; Egea-Cortines, M.; Hurtado-Navarro, M.; et al. How binomial (traditional rainfed olive grove-Crocus sativus) crops impact the soil bacterial community and enhance microbial capacities. J. Environ. Manag. 2023, 3023, 345. [Google Scholar]
  18. Adetunji, A.T.; Ncube, B.; Mulidzi, R.; Lewu, F.B. Management impact and benefit of cover crops on soil quality: A review. Soil Tillage Res. 2020, 204, 104717. [Google Scholar] [CrossRef]
  19. Chehab, H.; Tekaya, M.; Gouiaa, M.; Mahjoub, Z.; Laamari, S.; Sfina, H.; Chihaoui, B.; Boujnah, D.; Mechri, B. The use of legume and grass cover crops induced changes in ion accumulation, growth and physiological performance of young olive trees irrigated with high-salinity water. Sci. Hortic. 2018, 232, 170–174. [Google Scholar] [CrossRef]
  20. Ovalle, C.; Del Pozo, A.; Peoples, M.B.; Lavín, A. Estimating the contribution of nitrogen from legume cover crops to the nitrogen nutrition of grapevines using a 15 N dilution technique. Plant Soil 2010, 334, 247–259. [Google Scholar] [CrossRef]
  21. Rodrigues, M.Â.; Correia, C.M.; Claro, A.M.; Ferreira, I.Q.; Barbosa, J.C.; Moutinho-Pereira, J.M.; Bacelar, E.A.; Fernandes-Silva, A.A.; Arrobas, M. Soil nitrogen availability in olive orchards after mulching legume cover crop residues. Sci. Hortic. 2013, 158, 45–51. [Google Scholar] [CrossRef]
  22. Murray, J.D.; Liu, C.W.; Chen, Y.; Miller, A.J. Nitrogen sensing in legumes. J. Exp. Bot. 2017, 68, 1919–1926. [Google Scholar] [CrossRef]
  23. Sofo, A.; Palese, A.; Maria, C.; Teresa, C.; Giuseppe, R.P.; Curci, M.; Crecchio, C.; Xiloyannis, C. Genetic, Functional, and Metabolic Responses of Soil Microbiota in a Sustainable Olive Orchard. Soil Sci. 2010, 175, 81–88. [Google Scholar] [CrossRef]
  24. Sofo, A.; Ciarfaglia, A.; Scopa, A.; Camele, I.; Curci, M.; Crecchio, C.; Xiloyannis, C.; Palese, A.M. Soil microbial diversity and activity in a Mediterranean olive orchard using sustainable agricultural practices. Soil Use Manag. 2014, 30, 160–167. [Google Scholar] [CrossRef]
  25. Montes-Borrego, M.; Metsis, M.; Blanca, B.; Landa, B.B. Arbuscular Mycorhizal Fungi Associated with the Olive Crop across the Andalusian Landscape: Factors Driving Community Differentiation. PLoS ONE 2014, 9, e96397. [Google Scholar] [CrossRef] [PubMed]
  26. Zhang, C.; Xue, W.; Xue, J.; Zhang, J.; Qiu, L.; Chen, X.; Hu, F.; Kardol, P.; Liu, M. Leveraging functional traits of cover crops to coordinate crop productivity and soil health. J. Appl. Ecol. 2022, 59, 2627–2641. [Google Scholar] [CrossRef]
  27. Bernnan, B.E.; Veronica, A.M. Soil microbial biomass and enzyme data after six years of cover crop and compost treatments in organic vegetable production. Soil Sci. Soc. Am. J. 2019, 83, 624–637. [Google Scholar] [CrossRef]
  28. Herencia, J.F. Enzymatic activities under different cover crop management in a Mediterranean olive orchard. Biol. Agric. Hortic. 2015, 31, 45–52. [Google Scholar] [CrossRef]
  29. Henriquez, C.; Uribe, L.; Valenciano, A.; Nogales, R. Soil enzyme activity-dehidrogenase, ß-glucosidase, Phosphatase and urease-under different crops. Agron. Costarric. 2014, 38, 43–54. [Google Scholar]
  30. Weber, K.; Legge, R. One-dimensional metric for tracking bacterial community divergence using sole carbon source utilization patterns. J. Microbiol. Methods 2009, 79, 55–61. [Google Scholar] [CrossRef]
  31. Tabatabai, M.A. Soil enzymes. In Methods of Soil Analysis: Microbiological and Biochemical Properties: Part 2; SSSA Book Ser; Soil Science Society of America, Inc.: Madison, WI, USA, 1994; pp. 775–833. [Google Scholar]
  32. Grzadiel, J.; Furtak, K.; Galazka, A. Community-Level physiological profiles of microorganism from different types of soil that are characteristic to Poland-a long-term microplot experiment. Sustainability 2019, 11, 56. [Google Scholar] [CrossRef]
  33. Ben Zineb, A.; Barkaoui, K.; Karray, F.; Mhiri, N.; Sayadi, S.; Mliki, A.; Gargouri, M. Olive agroforestry shapes rhizosphere microbiome networks associated with annual crops and impacts the biomass production under low-rainfed conditions. Front. Microbiol. 2022, 13, 977797. [Google Scholar] [CrossRef]
  34. Amassaghrou, A.; Barkaoui, K.; Bouaziz, A.; Alaoui, S.B.; Fatemi, Z.E.A.; Daoui, K. Yield and related traits of three legume crops grown in olive-based agroforestry under an intense drought in the South Mediterranean. Saudi J. Biol. Sci. 2023, 30, 103597. [Google Scholar] [CrossRef]
  35. Temani, F.; Bouaziz, A.; Daoui, K.; Wery, J.; Barkaoui, K. Olive agroforestry can improve land productivity even under low water availability in the South Mediterranean. Agric. Ecosyst. Environ. 2021, 307, 107234. [Google Scholar] [CrossRef]
  36. Torrús-Castillo, M.; Domouso, P.; Herrera-Rodríguez, J.M.; Calero, J.; García-Ruiz, R. Aboveground Carbon Fixation and Nutrient Retention in Temporary Spontaneous Cover Crops in Olive Groves of Andalusia. Front. Environ. Sci. 2022, 10, 868410. [Google Scholar] [CrossRef]
  37. Arruda, B. Manipulation of the soil microbiome regulates the colonization of plants by arbuscular mycorrhizal fungi. Mycorrhiza 2021, 31, 545–558. [Google Scholar] [CrossRef] [PubMed]
  38. Rodrigues, M.Â.; Dimande, P.; Pereira, E.L.; Ferreira, I.Q.; Freitas, S.; Correia, C.M.; Moutinho-Pereira, J.; Arrobas, M. Early-maturing annual legumes: An option for cover cropping in rainfed olive orchards. Nutr. Cycl. Agroecosyst. 2015, 103, 153–166. [Google Scholar] [CrossRef]
  39. Soriano, M.; Cabezas, J.M.; Gomez, A.J. Field evaluation of selected autochthonous herbaceous species for cover crops in Mediterranean woody crops. Eur. J. Agron. 2023, 143, 126723. [Google Scholar] [CrossRef]
  40. Tul, S.; Manolikaki, I.; Digalaki, N.; Psarras, G.; Koufakis, I.; Kalaitzaki, A.; Sergentani, C.; Koubouris, G. Contribution of a Seeded Cover Crop Mixture on Biomass Production and Nutrition Status Compared to Natural Vegetation in a Mediterranean Olive Grove. Int. J. Plant Biol. 2022, 13, 235–244. [Google Scholar] [CrossRef]
  41. Gomez, A.J. Sustainability using cover crops in Mediterranean trees crops, olives and vines-challenges and current knowledge. Hung. Geogr. Bull. 2017, 66, 13–28. [Google Scholar]
  42. Ferreira, I.Q.; Rodrigues, M.Â.; Claro, A.M.; Arrobas, M. Management of Nitrogen-Rich Legume Cover Crops as Mulch in Traditional Olive Orchards. Commun. Soil Sci. Plant Anal. 2015, 46, 1881–1894. [Google Scholar] [CrossRef]
  43. Stein, S.; Hartung, J.; Perkons, U.; Möller, K.; Zikeli, S. Plant and soil N of different winter cover crops as green manure for subsequent organic white cabbage. Nutr. Cycl. Agroecosyst. 2023, 127, 10306–10309. [Google Scholar] [CrossRef]
  44. Lee, A.; Neuberger, P.; Omokanye, A.; Hernandez-Ramirez, G.; Kim, K.; Gorzelak, A. Arbuscular mycorrhizal fungi in oat-pea intercropping. Sci. Rep. 2023, 13, 390. [Google Scholar] [CrossRef]
  45. Afzal, A.; Bano, A. Rhizobium and phosphate solubilizing bacteria improve the yield and phosphorus uptake in wheat (Ttiticum aestivum). Int. J. Agric. Biol. 2010, 1814, 9596. [Google Scholar]
  46. Rodrigues, M.; Withers, P.J.A.; Soltangheisi, A.; Vargas, V.; Holzschuh, M.; Pavinato, P.S. Tillage systems and cover crops affecting soil phosphorus bioavailability in Brazilian Cerrado Oxisols. Soil Tillage Res. 2021, 205, 104770. [Google Scholar] [CrossRef]
  47. De Torres, M.A.R.R.; Carbonell, B.R.; Alcantara, B.C.; Rodriguez, L.A.; Ordonèz, F.R. Carbon sequestration potential of residues of different types of cover crops in olive groves under Mediterranean climate. Span. J. Argic. Res. 2012, 10, 649–661. [Google Scholar] [CrossRef]
  48. Fernandes, G.; Marques, A.; César, R.; Ribeiro, B.R.; Cardoso Paula, S. Potassium Uptake Kinetics in Native Forage Grass Species From Pampa Biome. Soil Sci. Cienc. Rural 2022, 52, 8478cr2020. [Google Scholar] [CrossRef]
  49. Guesmi, H.; Aichi, H.; Bendhafer, G.; Fouad, Y.; Menasseri, S.; Chaar, H. Assessment of radial variation of soil properties in an olive tree-barley/common vetch agroforestry system under low-input conditions in a Tunisian semi-arid climate after three cropping seasons. J. Res. Environ. Earth Sci. 2022, 11, 330–339. [Google Scholar]
  50. Porwollik, V.; Rolinski, S.; Heinke, J.; Von Bloh, W.; Schaphoff, S.; Müller, C. The role of cover crops for cropland soil carbon, nitrogen leaching, and agricultural yields -A global simulation study with LPJmL (V. 5.0-tillage-cc). Biogeosciences 2022, 19, 957–977. [Google Scholar] [CrossRef]
  51. Rattan, L. Regenerative agriculture for food and climate. J. Soil Water Conserv. 2020, 75, 123A. [Google Scholar]
  52. Wang, Y.; Huang, Q.; Gao, H.; Zhang, R.; Yang, L.; Guo, Y.; Li, H.; Awasthi, M.K.; Li, G. Long-term cover crops improved soil phosphorus availability in a rain-fed apple orchard. Chemosphere 2021, 275, 130093. [Google Scholar] [CrossRef] [PubMed]
  53. Hansen, V.; Müller-Stöver, D.; Gómez-Muñoz, B.; Oberson, A.; Magid, J. Differences in cover crop contributions to phosphorus uptake by ryegrass in two soils with low and moderate P status. Geoderma 2022, 426, 116075. [Google Scholar] [CrossRef]
  54. Ferreira, M.A.; Jose’, M.P.; Carlos, C.; Angelo, R.M. Olive response to potassium applications under different water regimes and cultivars Isabel Q. Nutr. Cycl. Agroecosyst. 2018, 112, 387–401. [Google Scholar] [CrossRef]
  55. Chavarría, D.N.; Verdenelli, R.A.; Serri, D.L.; Restovich, S.B.; Andriulo, A.E.; Meriles, J.M.; Vargas-Gil, S. Effect of cover crops on microbial community structure and related enzyme activities and macronutrient availability. Eur. J. Soil Biol. 2016, 76, 74–82. [Google Scholar] [CrossRef]
  56. Martín, M.P.R.; Fernández-Ondoño, E.; Ortiz-Bernad, I.; Abreu, M.M. Influence of Intensive and Super-Intensive Olive Grove Management on Soil Quality—Nutrients Content and Enzyme Activities. Plants 2023, 12, 2779. [Google Scholar] [CrossRef] [PubMed]
  57. Feng, H.; Sekaran, U.; Wang, T.; Kumar, S. On-farm assessment of cover cropping effects on soil C and N pools, enzyme activities, and microbial community structure. J. Agric. Sci. 2021, 159, 216–226. [Google Scholar] [CrossRef]
  58. Stegarescu, G.; Reintam, E.; Tõnutare, T. Cover crop residues effect on soil structural stability and phosphatase activity. Acta Agric. Scand. Sect. B Soil Plant Sci. 2021, 71, 992–1005. [Google Scholar] [CrossRef]
  59. Peregrina, F.; Pérez-Álvarez, E.P.; García-Escudero, E. The short-term influence of aboveground biomass cover crops on C sequestration and β-glucosidase in a vineyard ground under semiarid conditions. Span. J. Agric. Res. 2014, 12, 1000–1007. [Google Scholar] [CrossRef]
  60. Navas, M.; Benito, M.; Rodríguez, I.; Masaguer, A. Effect of five forage legume covers on soil quality at the Eastern plains of Venezuela. Appl. Soil Ecol. 2011, 49, 242–249. [Google Scholar] [CrossRef]
  61. Roper, M.M.; Ophel-Keller, K.M. Soil microflora as bio-indicators of soil health. In Biological Indicators of Soil Health; Pankhurst, C.E., Doube, B.M., Gupta, V.V.S.R., Eds.; CAB International: New York, NY, USA, 1997. [Google Scholar]
  62. Marais, A.; Labuschagne, J.; Booyse, M. Influence of oats cover crop preceding dryland lucerne establishment on some aspects of soil microbial ecology. S. Afr. J. Plant Soil 2020, 37, 87–89. [Google Scholar] [CrossRef]
  63. Gomez, M.B.; Pittroff, S.M.; De Neergaard, A.; Jensen, L.S.; Nicolaisen, M.H.; Magid, J. Penicillium bilaii effects on maize growth and P uptake from soil and localized sewage sludge in a rhizobox experiment. Biol. Fertil. Soils 2017, 53, 23–35. [Google Scholar] [CrossRef]
  64. Lucas, M.M. The Symbiosome: Legume and Rhizobia Co-evolution toward a Nitrogen-Fixing Organelle. Front. Plant Sci. 2018, 22, 2229. [Google Scholar]
  65. Chinthalapudi, D.P.M.; Pokhrel, S.; Kingery, W.L.; Shankle, M.W.; Ganapathi Shanmugam, S. Exploring the Synergistic Impacts of Cover Crops and Fertilization on Soil Microbial Metabolic Diversity in Dryland Soybean Production Systems Using Biolog EcoPlates. Appl. Biosci. 2023, 2, 328–346. [Google Scholar] [CrossRef]
  66. Siczek, A.; Lipiec, J. Impact of faba bean-seed rhizobial inoculation on microbial activity in the rhizosphere soil during growing season. Int. J. Mol. Sci. 2016, 17, 784. [Google Scholar] [CrossRef]
  67. Aguilera-Huertas, J.; Parras-Alcántara, L.; González-Rosado, M.; Lozano-García, B. Intercropping in rainfed Mediterranean olive groves contributes to improving soil quality and soil organic carbon storage. Agric. Ecosyst. Environ. 2024, 361, 108826. [Google Scholar] [CrossRef]
  68. Pantigoso, H.A.; Manter, D.K.; Fonte, S.J.; Vivanco, J.M. Root exudate-derived compounds stimulate the phosphorus solubilizing ability of bacteria. Sci. Rep. 2023, 13, 4050. [Google Scholar] [CrossRef]
  69. Samuel, I.; Haruna, N.N. Influence of Cover Crop, Tillage, and Crop Rotation Management on Soil Nutrients. Soil Biol. Biochem. 2020, 25, 142–149. [Google Scholar]
  70. Michael, F.D. Key roles of microsymbiont amino acid metabolism in rhizobia-legume interactions. Crit. Rev. Microbiol. 2015, 44, 411–451. [Google Scholar]
  71. Doud, D.D.; Naghahashi, G.; Pfeffer, P.F.; Kayser, W.M.; Reider, C. On farm production and utilization of arbuscular mycorrhizal fungi inoculums. Can. J. Plant Sci. 2005, 85, 15–21. [Google Scholar]
  72. Lehman, R.M.; Taheri, W.I.; Osborne, S.L.; Buer, J.S.; Doud, D.D. Fall cover cropping can increase arbuscular mycorrhizae in soils supporting intensive agricultural production. Appl. Soil Ecol. 2012, 61, 300–304. [Google Scholar] [CrossRef]
  73. Tekaya, M.; Dabbaghi, O.; Guesmi, A.; Attia, F.; Chehab, H.; Khezami, L.; Algathami, F.; Ben Hamadi, N.; Hammami, M.; Prinsen, E.; et al. Arbuscular mycorrhizas modulate carbohydrate, phenolic compounds and hormonal metabolism to enhance water deficit tolerance of olive trees (Olea europaea). Agric. Water Manag. 2022, 274, 107947. [Google Scholar]
Figure 1. Seasonal rainfall and temperature pattern during 2021 and 2022 cropping seasons at the Beja experiment site.
Sustainability 16 05329 g001
Figure 2. Experimental site in Beja and seeding scheme.
Sustainability 16 05329 g002
Figure 3. Annual dry biomass production of cover crops incorporated into the soil during the 2021 and 2022 cropping seasons. Values with different letters (Aa, Bb, Cc, Dd, Ee) indicate significant differences between treatments (p ≤ 0.05, Tukey tests).
Sustainability 16 05329 g003
Figure 4. Nitrogen (A), phosphorus (B), potassium (C), and carbon (D) contents of residues and cover crops incorporated into the soil during 2021 and 2022 cropping seasons. Values with different letters (Aa, Bb, Cc, Dd, Ee) indicate significant differences between treatments (p ≤ 0.05, Tukey tests).
Sustainability 16 05329 g004aSustainability 16 05329 g004b
Figure 5. Effects of cover crops on β-glucosidase (A), phosphatase (B), dehydrogenase (C), and arylsulfatase (D) activities and the geometric mean of the soil enzyme activities (E). Each value is the average of three replicates. Values with different letters (a, b, c and d) indicate significant differences (p ≤ 0.05, Tukey tests).
Sustainability 16 05329 g005aSustainability 16 05329 g005b
Figure 6. Development-specific substrate groupings. Values with different letters indicate significant differences (p ≤ 0.05, Tukey tests).
Sustainability 16 05329 g006
Figure 7. Biolog® EcoPlate™ substrate utilization (absorbance at 590 nm) after 120 h of incubation. The lack of utilization is represented by a dark blue colour. The absorbance from 0.5 to the maximum value, considered positive, is represented by the gradient from dark blue to light yellow. Treatment plots are represented by abbreviations: C—Control, SP—Spontaneous vegetation, W—Wheat, O—Oat, VO—Vetch–oat, V—Vetch, F—Fenugreek.
Sustainability 16 05329 g007
Table 1. Soil organic matter (OM), nitrogen (N), phosphorus (P), and potassium (K) contents during 2021 and 2022 cropping seasons for control soils and those with spontaneous vegetation, wheat, oat, vetch–oat, fenugreek, and vetch cover crops. Values with different letters (a, b, c, d and e) indicate significant differences between treatments (p ≤ 0.05, Tukey).
Treatments SOM (%)Total N (%)Available P (µg g−1)Available K (mg g−1)
Season20212022202120222021202220212022
Control1.62 ± 0.03 b2.59 ± 0.04 e0.088 ± 0.00 b0.1 ± 0.02 b2.68 ± 0.05 c2.62 ± 0.04 d2.85 ± 0.03 c2.48 ± 0.07 d
Spont.3.03 ± 0.03 a3.08 bc0.157 ± 0.039 a0.154 ± 0.02 a3.82 ± 0.02 ab4.08 ± 0.09 c3.41 ± 0.03 bc3.01 ± 0.03 c
Wheat2.84 ± 0.05 a3.72 ± 0.043 b0.143 ± 0.02 a0.163 ± 0.06 a4.12 ± 0.12 a5.88 ± 0.07 a3.95 ± 0.09 abc2.87 ± 0.07 c
Oat2.5 ± 0.02 a4.23 ± 0.02 a0.1 ± 0.02 b0.168 ± 0.02 a3.34 ± 0.06 b4.55 ± 0.04 bc4.50 ± 0.09 ab2.80 ± 0.04 c
Vetch–oat3.24 ± 0.05 a 3.51 ± 0.04 bc0.157 ± 0.03 a0.168 ± 0.03 a3.38 ± 0.09 b4.70 ± 0.06 b4.82 ± 0.07 a3.39 ±0.03 ab
Fenugreek3.04 ± 0.05 a3.42 ± 0.03 c0.143 ± 0.04 a0.133 ± 0.02 a3.48 ± 0.11 b4.13 ± 0.09 c3.06 ± 0.087 c3.54 ± 0.05 a
Vetch3.07 ± 0.01 a3.17 ± 0.03 d0.150 ± 0.017 a0.143 ± 0.04 a3.81 ± 0.05 ab4.80 ± 0.07 b2.91 ± 0.073 c3.07 ±0.05 bc
Table 2. Microbial catabolic diversity indexes calculated for the data obtained from the EcoPlate. AWCD—average well colour development, H′—Shannon diversity index, S—substrate richness index, E—Shannon evenness index. Values with same letters (a) indicate no significant differences (p ≤ 0.05, Tukey tests).
ACWDH’SE
Control1.21 ± 0.12 a4.70 ± 0.09 a30.0 ± 1.00 a1.38 ± 0.03 a
Non-tilled1.03 ± 0.37 a4.70 ± 0.25 a28.0 ± 4.36 a1.41 ± 0.01 a
Wheat1.16 ± 0.12 a4.77 ± 0.02 a29.3 ± 0.58 a1.41 ± 0.01 a
Oat1.04 ± 0.11 a4.71 ± 0.07 a28.3 ± 2.08 a1.41 ± 0.01 a
Vetch–oat1.31 ± 0.11 a4.84 ± 0.09 a30.3 ± 1.15 a1.42 ± 0.01 a
Fenugreek1.23 ± 0.65 a4.80 ± 0.18 a29.0 ± 9.85 a1.42 ± 0.01 a
Vetch1.11 ± 0.02 a4.68 ± 0.05 a27.6 ± 1.15 a1.41 ± 0.01 a
Disclaimer/Publisher’s Note: The statements, opinions and data contained in all publications are solely those of the individual author(s) and contributor(s) and not of MDPI and/or the editor(s). MDPI and/or the editor(s) disclaim responsibility for any injury to people or property resulting from any ideas, methods, instructions or products referred to in the content.

