Abstract
Faced with the dual challenges of environmental pollution and climate change, it is of great significance to study the impact of relevant environmental regulations on the synergistic effect of pollution reduction and carbon emission reduction and their influence mechanisms. Based on a theoretical analysis using the panel data of 30 provinces in China, a spatial econometric model and an intermediary effect model are used to investigate the impact of environmental regulations on the synergistic effect of pollution reduction and carbon reduction and the transmission mechanisms potentially responsible for these effects. The empirical results show the following: (1) The three kinds of environmental regulation effectively facilitate the synergistic effect of pollution reduction and carbon reduction, taking the following order when ranked according to the intensity of their effects: command-type environmental regulation (ER1) > market-based environmental regulation (ER2) > voluntary environmental regulation (ER3). (2) Environmental regulation effectively promotes the synergistic effect of pollution and carbon reduction through the three transmission mechanisms of stimulating technological innovation (TI), industrial structure upgrading (ISU), and restricting foreign direct investment (FDI), which take the following effectiveness order: TI > FDI > ISU. Based on the results of the study, policy suggestions to facilitate pollution reduction and carbon synergies are proposed to help China’s green and low-carbon development.
1. Introduction
In recent years, problems such as glacier melting, air pollution, and extreme weather have become increasingly severe and have exerted significant adverse effects on human production and life. All countries in the world have taken sustainable development as the primary goal of economic and social development [1,2]. The large amount of energy consumption promotes the rapid development of the economy, but the consumption of energy is also one of the key factors contributing to global climate change and atmospheric pollution. Aydin’s projections of carbon emissions for a region that includes the OECD Americas, OECD Asia–Oceania, Africa, Asia, China, and the non-OECD Americas show that as carbon dioxide (CO2) emissions increase from 2010 to 2035, coal-related CO2 emissions will grow at an annual rate of 2.78% until 2035, reaching 20,182 million tons [3]. Therefore, the issue of synergy between air pollution control and greenhouse gas emission reduction has received great attention from international research institutions and experts in various fields.
China has made significant progress in building an ecological society and protecting the environment since the 18th CPC National Congress; the ecological environment’s quality has kept getting better, and the intensity of carbon emissions has been significantly reduced [4]. However, due to climate change, energy consumption patterns, and its industrial layout, China faces a more challenging situation regarding air pollution prevention and control. In particular, the presence of regional composite air pollution characterized by PM2.5 and ozone poses additional challenges to air pollution management [5]. Meanwhile, total carbon emissions continue to rise, accounting for 28% of global emissions [6]. Therefore, China is under pressure to control air pollution and reduce carbon emissions [7], while its economic development model is at a critical stage of transitioning to green practices. At this stage, China needs to further strengthen the management of prominent ecological and environmental problems and strictly control the emission of pollutants and carbon. In June 2022, the Ministry of Ecology and Environment, along with seven other departments, jointly issued the Implementation Plan for Coordinated Pollution and Carbon Reduction. The plan states that by 2035, China should form a work pattern to comprehensively promote synergies for reducing pollution and carbon. Considering that the main air pollutants and carbon emissions share common sources and pathways [8], the plan asserts the feasibility of concurrently achieving the dual environmental objectives of pollution reduction and carbon mitigation. Consequently, the synchronized advancement of pollution and carbon reduction has emerged as an indispensable choice for China’s new development phase.
In this context, it is particularly important for the government to develop a rational environmental regulation strategy that can inform the further development of a green transition path. So, can China’s environmental regulation achieve the goal of a synergistic reduction of pollution and carbon emissions? And, if so, through what channels? Answering these questions is of great theoretical and practical significance for the development of more efficient and rational environmental policies globally and in China to promote green economic growth.
The paper analyzes the direct effects of three types of environmental regulation (command and control, market incentives, and public voluntary regulation) on the synergistic effects of pollution reduction and carbon reduction and verifies the potential indirect effects of comprehensive environmental regulation on pollution reduction and carbon reduction with the following objectives: (1) to make up for the deficiencies in the existing research on the synergistic effects of pollution reduction and carbon reduction and thus provide new insights into the impacts of environmental regulation on the synergistic effects of pollution reduction and carbon reduction and (2) to clarify the mechanism of environmental regulation for the synergistic effect of pollution reduction and carbon reduction in China and put forward targeted recommendations based on the results with a view to providing a scientific basis for the formulation of environmental policies, encouraging the government to rationally formulate and actively implement environmental regulation policies, and helping the synergistic effect of pollution reduction and carbon reduction to achieve certain results.
In other countries, research on synergies between pollution reduction and carbon reduction (PRCR) started earlier and the techniques and methods used are more mature [9,10,11]. For instance, Shrestha and Pradhan used the MARKAL model to simulate the synergistic effects (SEs) of different CR scenarios in developed countries and found that the power sector would reduce GHG emissions by 60% to 80% under synergistic emission reduction [12]. In recent years, China’s heightened focus on carbon peaking and carbon neutrality has ushered the nation’s ecological and environmental protection efforts into a new stage characterized by the coordinated governance of PRCR. Subsequently, a substantial number of scholars have studied the SE of PRCR. Relevant scholars used the LMDI decomposition method combined with the scenario simulation method, the econometric analysis method, etc., to study the interaction between air pollutant and carbon dioxide emissions and their driving factors. The study found that the main drivers of air pollutant emission reduction are the non-electric power industry’s pollutant management and the synergistic emission reduction effect between carbon dioxide and PM2.5 [13,14,15]. Other studies on pollution and carbon reduction have also been conducted by scholars. One study discovered that a transition to low-sulfur fuels could achieve the dual objectives of improving air quality standards and reducing CO2 emissions at the lowest possible cost [16]. Under various peak carbon scenarios, the synergistic effect of reducing CO2 emissions on improving air quality in Guangzhou was examined, and it was pointed out that the promotion of CO2 emission peaking is important for the enhancement of the city’s public health and air quality [17]. This paper analyzed the cooperative effect of CO2 reduction on SO2 and PM2.5 by using Kaya’s formula for constants and a panel fixed-effects model and found that the SE on SO2 is more significant than that on PM2.5 and that the SE has regional variability [18].
Environmental regulation (ER) is a complex discipline, and, at present, there is no single definition of ER [19,20,21]. With the development of ER and the increasing awareness of researchers, ER is defined as a government’s policy initiatives to protect the ecological environment and interfere with undesirable economic activities [22,23,24]. ER is often separated into three categories: command-type, market-based, and voluntary regulation. Command-type ER includes orders, controls, specifications, and other measures and imposes certain mandatory and hard constraints. Market-based ER is implemented by market means following market signals and mechanisms, mainly including measures such as emission taxes, emission permits, and environmental subsidies [25]. Voluntary ER includes what the public does voluntarily for environmental protection and environmental management certification [26,27]. As an instrumental variable, ER plays a crucial role in the preservation and stewardship of the ecological environment.
The effect of ER on reducing carbon emissions and controlling environmental pollution has been extensively studied in recent years by both domestic and international researchers. As for the impact of ER on pollutant discharge, foreign research in related directions started earlier than that in China. Porter found through his research that strict ERs can promote enterprises’ ISU and TI and finally reach a win–win situation in which ecological environmental conservation and economic growth are assured by indirectly increasing enterprises’ production efficiency and market competitiveness [28]. According to research findings on the relationship between ERs and air and water pollution in the American paper industry, increasing pollution control spending would result in a reduction in pollutant emissions [29]. Market-oriented ER is an effective way to control polluting industries [30]. China’s current sewage rights system can significantly reduce pollutant emissions, and moderately strengthening the intensity of sewage rights can force enterprises to change their production structure and production methods, thus promoting the decoupling of economic growth and environmental pollution in production-oriented enterprises and achieving the desired effect of pollution reduction [31,32,33,34]. By studying the spatial correlation of China’s ERs, it has been found that regulations in a certain area not only affect the emissions of local environmental pollutants but also have spillover effects on the emissions of environmental pollutants in neighboring areas [35]. With regard to the impact of environmental regulation on carbon emissions, scholars have made the following studies: One group examined how ERs affected carbon dioxide emissions using the dynamic panel model and the systematic generalized moment method (GMM) and discovered that there is an inverse U-shaped relationship between ERs and CO2 [36]. When the ERs of a place are relatively strict, the industrial structure of the place will continue to upgrade; meanwhile, they will also lead to the transfer of polluting estates, forcing enterprises to undergo low-carbon transformation to a certain extent [37,38]. Another paper that analyzed ER concluded that it has a significant impact in terms of promoting CR [39]. Numerous researchers have examined the influence of environmental policies on the synergistic effects of PRCR with reference to a singular aspect. The DID method was studied, and it was found that the Environmental Protection Law played a major part in enhancing the SE of PRCR [40]. Applying a bidirectional stationary model, this study investigated the effects of ER on the integrated management of PRCR, exploring its mechanisms. The results revealed an inverted U-shaped trend for the influence of ER on both air pollutants and CO2 levels in the Yellow River Basin [41].
Previous researchers who evaluated the synergistic effect of pollution reduction and carbon reduction, as well as the effect of environmental regulation on the impact of pollutant management and carbon emission reduction laid a good foundation; however, there are still some deficiencies:
- (1)
- Most of the existing research is on the effects of pollution and carbon reduction, the impact of the synergistic effect of pollution and carbon reduction, and the lack of a comprehensive indicator to quantify the synergistic effect of pollution and carbon reduction. To address this issue, this paper will apply the coefficient of synergy effect to quantify the synergy of pollution reduction and carbon reduction, and it will be used as a cited variable in the study.
- (2)
- Current research necessitates the refinement of environmental regulation indicators. Typically, these indicators are overly simplistic, failing to precisely capture the effects of ER on pollution and carbon reduction. This study employs the entropy method to assign weights to multiple indicators, enhancing their comprehensiveness and scientific rigor.
- (3)
- Prior research has predominantly emphasized the individual effects of environmental regulation on carbon emissions or environmental pollution, neglecting its influence on the synergistic impact of PRCR. Moreover, there is a notable dearth of research on the underlying impact mechanisms. This paper addresses this deficiency by investigating the influence of ER on the synergistic effects of PRCR and analyzing its potential impact mechanisms.
With these aims, the study utilizes panel data from 30 Chinese provinces spanning 2001 to 2020, constructs a reasonable indicator system for PRCR and ER, and quantifies it by using the synergy effect elasticity coefficient method and the entropy value method; the study also analyzes the synergistic effect of PRCR and ER by using a spatial econometric model and examines ER’s potential mechanism of influence on the synergistic effect of PRCR by reference to intermediary mechanisms. The purpose of this paper is to provide an effective reference for China to adjust and optimize its ER tools and promote the synergistic effect of PRCR in China.
2. Theoretical Mechanisms
2.1. Synergistic Effects of Environmental Regulation on Pollution and Carbon Reduction
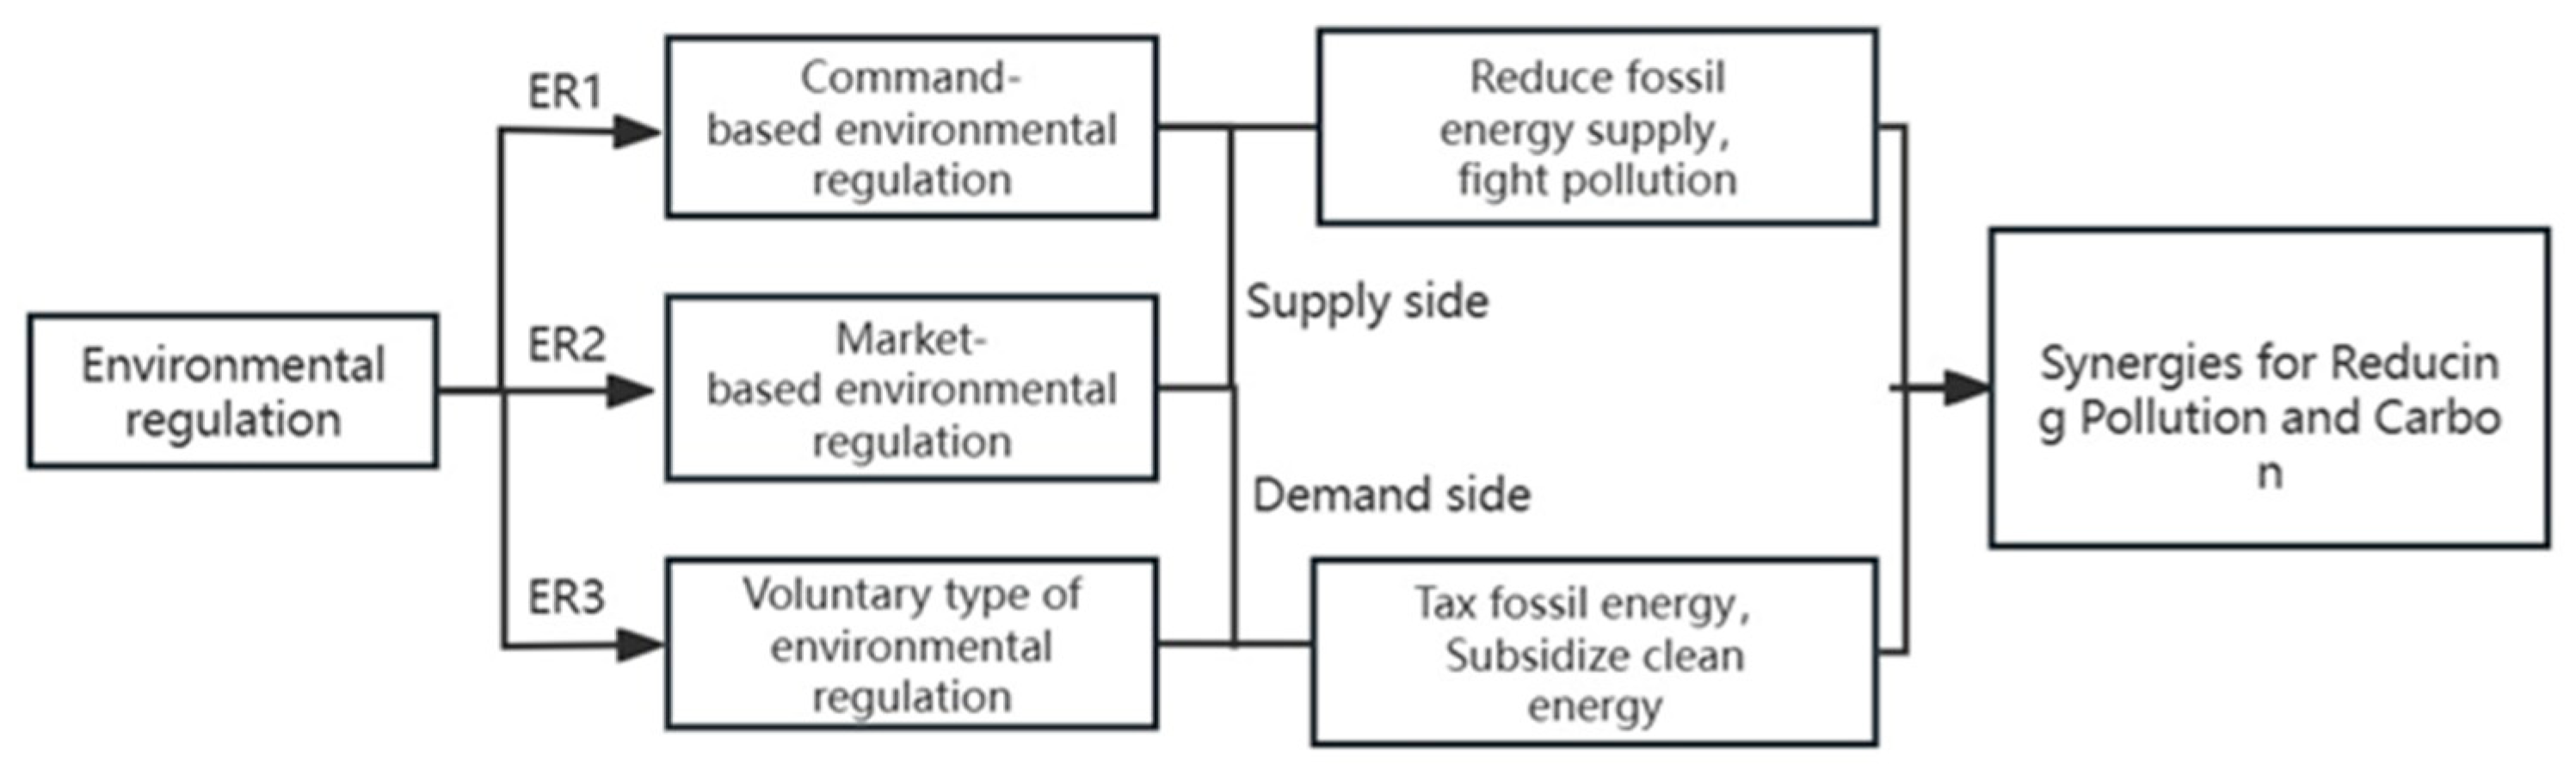
Environmental regulation (ER) is the sum of the binding influence of the policies and measures implemented by governments to enhance environmental quality and prevent and manage pollution in the environment, along with the efforts of social organizations and the public to manage the pollutant discharge behaviors of pollution discharge subjects [42]. Based on the level of enforcement, ER in the literature can be categorized into three groups: government compulsion (standards and command-and-control strategies), market regulation (taxes, tradable emission permits, etc.), and “soft” instruments (public scrutiny, environmental employment, etc.) [43]. Generally speaking, the ERs proposed by governments are designed to protect the environment, and the root cause of air pollutant and carbon emission is the same [8], so the expected direct effect of ER on air pollutant and carbon emissions is active remission. Governments utilize three types of environmental regulatory measures to reduce the use of fossil energy and increase the intensity of clean energy use from both the demand and supply sides through the imposition of environmental taxes and other environmental measures so as to synergize the reduction of pollution and carbon emissions, and the mechanism of action is shown in Figure 1. Specifically, a government’s command-type environmental regulation enforcement, through the imposition of sewage charges or energy taxes on producers and users of fossil energy, increases these agents’ production and environmental costs, thereby reducing energy supply and facilitating synergies between pollution and carbon reduction. In addition, the government’s strengthening of market-based environmental regulation uses market mechanisms and signals to guide and incentivize firms to reduce pollution and carbon emissions, and these policy tools include pollution taxes, subsidies, and tradeable pollution permits. At the same time, in order to improve the quality of the ecological environment, the government encourages the public to report environmental violations by enterprises and increases employment opportunities in the environmental protection industry so as to achieve the synergy of pollution reduction and carbon reduction at the level of the public’s environmental concern.
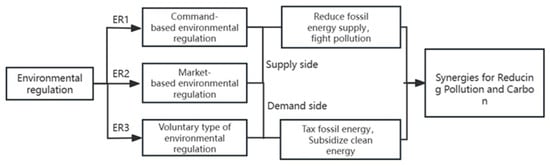
Figure 1.
Direct influence of environmental regulation on the synergistic effect of reducing pollution and carbon.
Hypothesis 1.
All three types of environmental regulation, namely, command-type, market-based, and public voluntary regulation, can promote the synergistic effect of pollution reduction and carbon reduction.
2.2. The Mechanism of the Synergistic Effect of Environmental Regulation
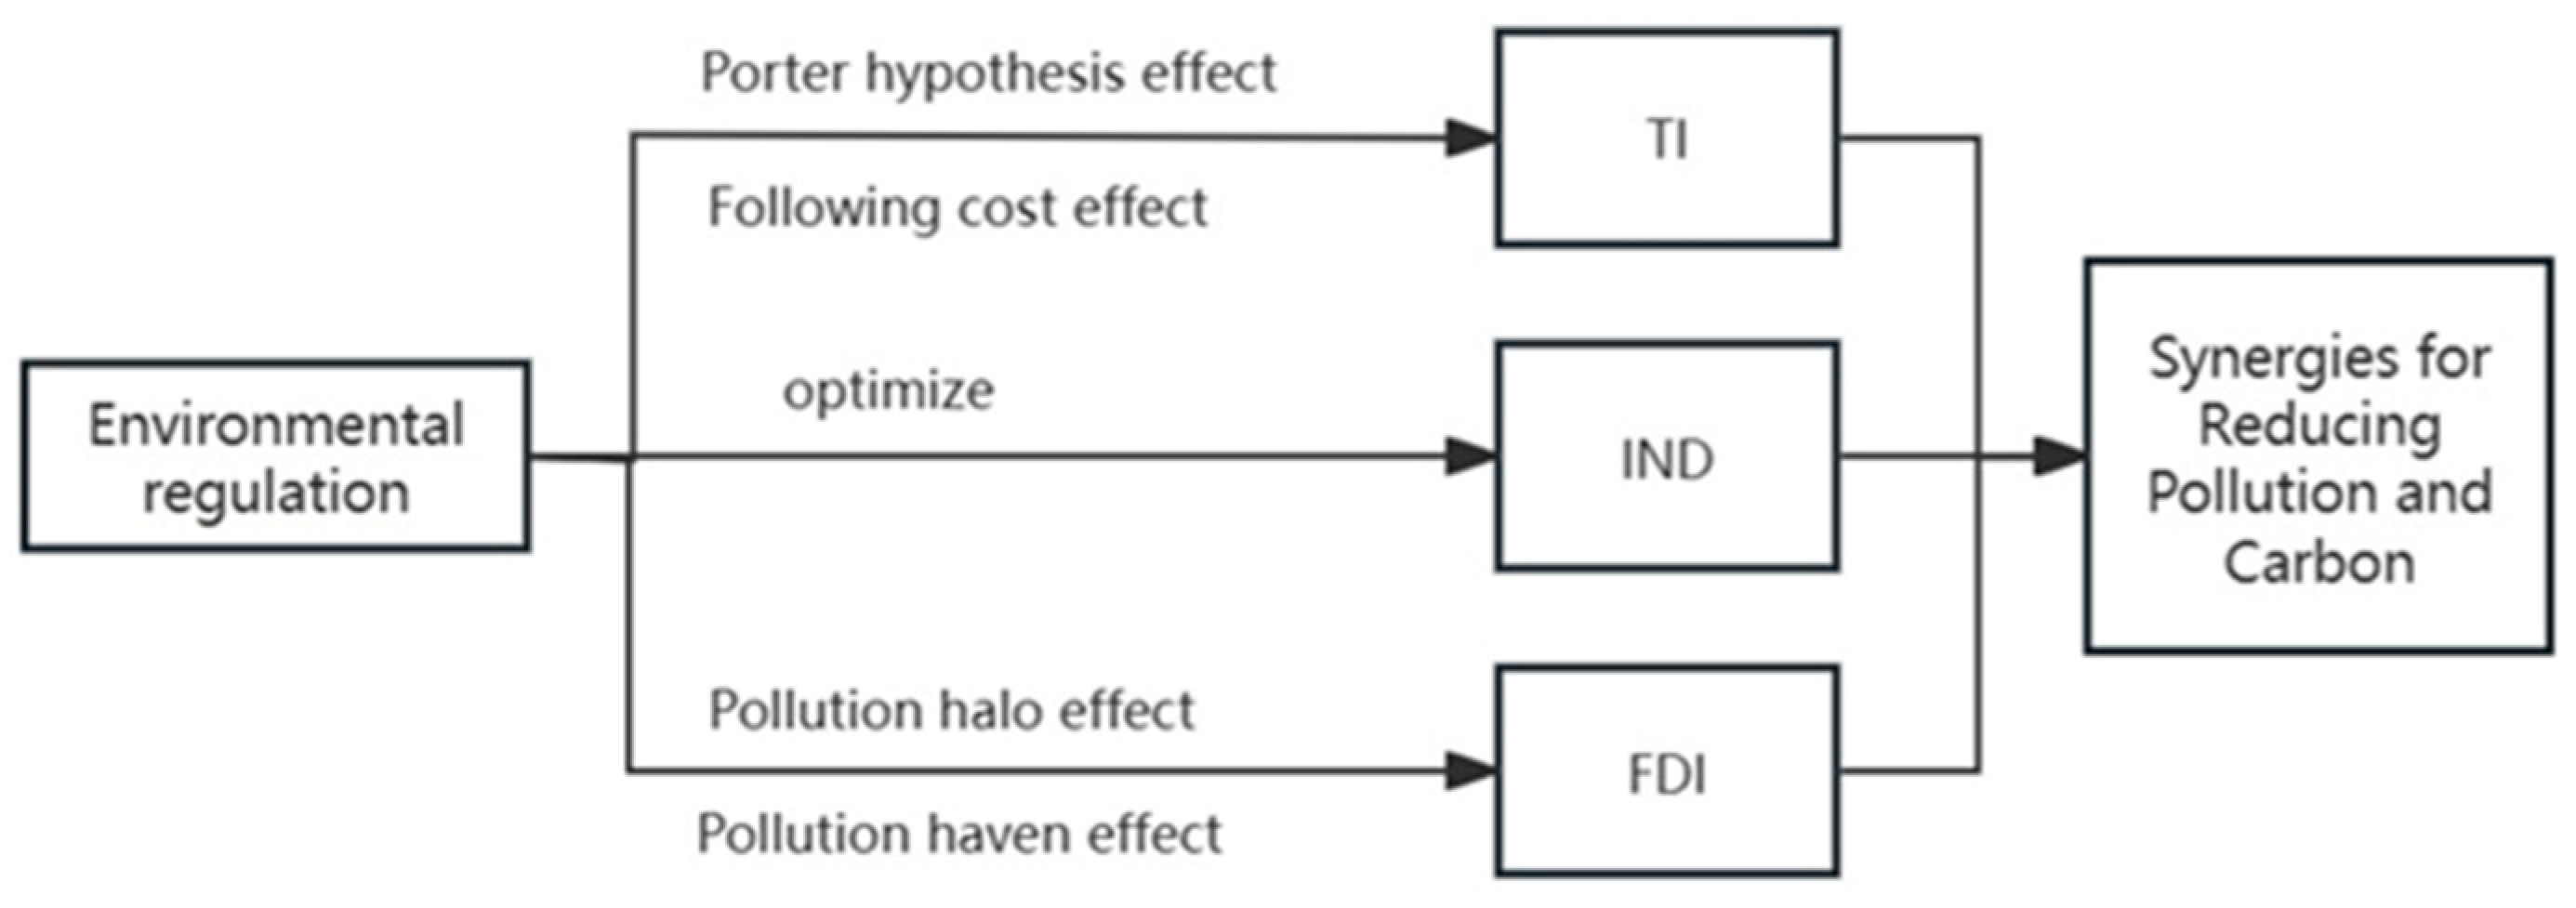
By encouraging polluting companies to reduce emissions and limiting the demand for fossil fuels, ER not only directly affects the synergies in PRCR [44], it also indirectly affects them through three transmission channels: technological innovation (TI), industrial structure upgrading (ISU), and foreign direct investment (FDI). The indirect benefits of environmental laws for carbon reduction synergies are depicted in Figure 2. Specific analyses are presented below:
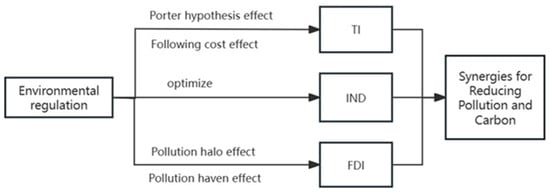
Figure 2.
Mechanisms of environmental regulation responsible for the synergistic effects of pollution and carbon emission reduction.
First of all, TI is impacted by ER in both good and bad ways. This has an indirect impact on the synergistic effect of PRCR. Appropriate environmental legislation can advance environmental protection and production technologies, increase firm productivity and competitiveness, and reduce high “compliance costs”—a phenomenon known as positive compensation or the “Porter hypothesis” impact. In order to coordinate PRCR, this has a specific reference value. The “cost of compliance” effect [45], meanwhile, refers to the negative offsetting effect of ER, which increases the cost of pollution control for businesses. As a result, production costs rise, which squeezes R&D investment and lowers productivity. This effect hinders the advancement of TI and environmental protection, and it also inhibits PRCR synergies.
Second, strict ER will greatly hinder the expansion of pollution-intensive enterprises and encourage the development of the service industry and the ISU to reduce pollution and carbon emissions. Tight ERs have been shown to be successful in keeping money out of highly polluting companies [46], while their impact on less polluting ones is negligible. This is because more stringent ERs raise the “environmental compliance costs” for polluting businesses, which hinders their ability to expand and drives them to relocate to areas with laxer ERs. In contrast, less polluting industries (like the service sector) have much lower environmental costs, and consumers’ preference for eco-friendly products has also encouraged the sector to grow and evolve. Therefore, to a certain extent, the synergistic effect of PRCR can be improved.
Finally, ER will influence the synergistic effect of PRCR through the technological spillover effect, the absorptive capacity effect, and the capital accumulation effect of FDI. ER in particular can make it more expensive for foreign businesses to produce goods, restrict their capacity to engage in R&D, and impede the diffusion of innovative technologies [43]. Furthermore, environmental rules increase the cost of pollution for local firms, which makes it harder for them to absorb new technologies. This is because technological spillovers are based on the assumption that domestic firms have great learning and absorption skills. Strict ERs have an impact on FDI decision-making processes as well. By discouraging FDI and lowering host nations’ capital stocks as a result, they undermine initiatives to cut pollution and carbon emissions. In contrast, FDI might have a “pollution haven” or “pollution halo” effect on pollutant and carbon emission reduction. The “pollution halo” effect occurs when foreign corporations possessing advanced technology have the ability to lower air pollution in their host nations by adopting more environmentally friendly manufacturing processes and raising production standards. The “pollution paradise” effect, on the other hand, occurs when businesses operating in industrialized nations with stringent ERs need to make greater investments in pollution management and environmental protection. Because of their limited enforcement systems and lax environmental policies, developing countries have a comparative advantage. As a result, environmental degradation and carbon emissions in the host countries are made worse by the movement of polluting businesses from developed to developing nations.
Hypothesis 2.
Environmental regulation promotes pollution reduction and carbon synergies by stimulating technological innovation.
Hypothesis 3.
Environmental regulations promote pollution reduction and carbon synergies by incentivizing industrial structural upgrading.
Hypothesis 4.
Environmental regulations promote pollution reduction and carbon synergies by constraining foreign direct investment.
3. Methods and Data
3.1. Methods
3.1.1. Spatial Autocorrelation Test
In this study, a thorough assessment of the spatial autocorrelation of the co-benefits of PRCR at the national level was performed using the global Moran’s index I, but this index only indicates the average degree of spatial variation between units and the surrounding area; in the whole research area, some negative and some positive spatial correlations may coexist, in which case local spatial autocorrelation statistics need to be used to reveal possible spatial variability [47,48].
The study of spatial correlation between distinct regions is known as local spatial autocorrelation, and the local Moran’s index I is used to represent the degree of spatial agglomeration of attribute variables in a local region. The following is the calculation formula:
In Equation (1), 1/2, is the mean value, indicates the number of areas, is the measured value for region , is the similarity between area and region , and is the space weight matrix.
The 0-1 adjacency weight matrix defines adjacency as 1 and non-adjacency as 0. It is a weight matrix based on adjacency relationships. It is usually used for spatial analysis with common land borders and similar geographical areas. If the areas of different administrative blocks are quite different and some regions have no actual adjacency relationship (such as Hainan and Taiwan), then the analysis based on adjacency relationships will be biased. Therefore, the distance-based weight matrix is relatively suitable for China’s geographical characteristics.
Moran’s index I takes values in the range of [−1, +1], where I > 1 indicates positive spatial correlation, I < 1 indicates negative correlation, and I = 0 indicates non-correlation. This paper used GeoDa1.20 software to test the spatial autocorrelation of the PRCR synergies in 30 provinces (municipalities) and regions in China. To generate the adjacency weight matrix, 0-1 adjacency was selected, followed by the latitude and longitude data for each province and city, which were processed to generate the geographic distance weight matrix.
3.1.2. Construction of a Spatial Metrology Model
First, a common panel model was established without considering spatial factors. In addition, natural logarithms were used for each variable in the former to avoid the effect of individual extreme values.
In the above Formulas (2)–(4), is the PRCR synergy; , , and respectively represent the ER intensity of command-type, market-based, and voluntary regulation; is the control variable determined in the paper; is the province; is the year; and stands for the error phrase at random.
Due to the diffusivity of gas, spatial factors had to be taken into consideration in the construction of the model. In research from a geographic and econometric perspective, the emission of air pollutants in a certain area is not only affected by the quality of economic development, the composition of energy use, the urbanization development level, the population size, and other factors, it is also affected by air pollution and CO2 emissions in similar areas. Based on the characteristics of atmospheric mobility, the application of spatial econometric models can provide more accurate analyses and predictions of emissions, thus helping decision makers implement more effective measures to mitigate environmental impacts. Therefore, the spatial econometric model was chosen in this paper, that is, the spatial lag model (SLM) and the spatial error model (SEM).
The SLM can be used to investigate whether the PRCR synergies in a certain area are affected by the spillover or diffusion of gas emissions in neighboring regions. The detailed formulas are as follows:
In the above Formulas (5)–(7), is the spatial regression coefficient. If is greater than 0, this expresses that the geographical spillover effect of the PRCR synergies is positive; if is less than 0, this expresses that the geographical spillover effect of the PRCR synergies is negative. represents the spatial lag variable, which in this study represents the impact of neighboring regions on regional PRCR synergies. is a spatial weight matrix. Two spatial weight matrices of Rook 0-1 proximity and geographical distance were used in this paper to make the empirical analysis results more persuasive. represents the error phrase at random.
The SEM shows the degree of the effect of the spatial error ignored by the neighboring region on the PRCR synergies in the area. The detailed formulas for the setup are as follows:
In the above Formulas (8)–(10), represents the spatial error coefficient and indicates the random error. The meanings of the other parameters are the same as in the formulas for the spatial lag model.
It is possible to determine whether there is sequence correlation in the model residual sequence by performing the LM test, referred to as the Lagrange multiplier test. The specific steps of LM inspection are as follows: First, the residual is obtained through the common benchmark panel regression model. Secondly, LM is used to test the residual error. Finally, the more reasonable model is identified based on the test results. The universal benchmark panel regression model is employed for empirical study if the LM-Error and LM-Lag have p-values that are both greater than 0.1. It is recommended to utilize the spatial error model for empirical analysis when the p-value of the LM-Error is less than 0.1. It is best to utilize the spatial lag model for empirical analysis when the p-value for the LM-Lag is less than 0.1. A robust LM test is utilized for judgment and choice if both the LM-error and LM-LAG are remarkable. Similar to the judgment criteria for the LM test, the space error model is chosen because the results of RLM-Error are significant, while the space lag model is chosen because the results of RLM-Lag are significant.
The phrase “Hausman test” refers to a class of tests that determine if two estimates of the same parameter differ significantly from one another [49]. Consistency and validity are trade-offs in the Hausmann test [50].
3.1.3. Construction of a Mediating-Effects Model
Carbon dioxide and air pollution emissions cannot usually be attributed to a single factor. Instead, they are the result of the interaction of multiple factors. Mediating-effects models help analyze these complex causal relationships by revealing how independent variables affect dependent variables through mediating variables [51]. Therefore, this paper adopted the traditional stepwise regression method to test the potential transmission mechanism of the impact of environmental regulation on the synergistic effect of pollution and carbon reduction. According to the research method described in “Digital Economy, TI and the Green Economy in Cities: An Empirical Analysis Using a Spatial Measurement Model and the Intermediary Effect” [52,53], a mediating-effects model, shown below, was constructed.
In the above Formulas (11)–(13), M is the intermediary variable and stands for industrial structure upgrading (ISU), technical innovation (TI), and foreign direct investment (FDI) in that order; , , and are constant terms; , , and are the parameters to be estimated; is the random error term; and the rest of the variables are the same as in the spatial measurement model.
3.2. Variable Measures and Data Sources
3.2.1. Explained Variables
Carbon emissions
Ninety percent of China’s current CO2 emissions are attributable to energy, according to data from the China Carbon Accounting Database (CEADs) for 2017. Regarding energy emissions, carbon emissions from coal, oil, and natural gas accounted for 68%, 13%, and 12% of emissions, respectively, and the remaining 7% came from energy escape emissions. Therefore, this study calculated CO2 emissions using the IPCC carbon inventory method from energy consumption in 30 provinces (municipalities) during 2001–2020. The detailed formula is as follows:
In Formula (14), is the CO2 emission element of fuel kind k, is the volume of consumption of fuel kind k, and m is the type of fuel. The coal discount factor and the carbon emission factor for each type of energy source are shown in Table 1.

Table 1.
Carbon emission calculation parameters of various forms of fossil fuel energy.
Air pollution emission equivalents
The definition of air pollution equivalent came from the People’s Republic of China’s Environmental Protection Tax Law. In this paper, the following formula was used to calculate air pollution equivalents:
In Formula (15), is the equivalent of atmospheric pollution, ; is the SO2 emissions, ; is the NOX emissions, ; is the PM10 emissions, ; is the CO emissions, ; , , , and are the equivalent coefficients of SO2, NOX, PM10, and CO, respectively, with no dimension. The specific values of the equivalent coefficients are shown in Table 2, below.
Table 2.
Air pollutants converted into air pollution equivalent coefficients.
Synergistic effect coefficient of pollution reduction and carbon reduction
The co-benefits coefficient of decreasing carbon and decreasing pollution can quantitatively describe the SE of PRCR. The coefficient that is frequently utilized is the emission-reduction elasticity coefficient. The detailed formula is as follows:
In Formula (16), is the co-benefits coefficient, without dimension; is the equivalent emission reduction of greenhouse gases such as CO2, ; is the equivalent emissions of greenhouse gases such as CO2, ; is the equivalent emission reduction of air pollution, ; and is the equivalent emissions of air pollutants, . The division of synergies between pollution reduction and carbon reduction is shown in Table 3.
Table 3.
Distribution interval and definition of the co-benefits coefficient of decreasing carbon and decreasing pollution.
3.2.2. Core Explanatory Variables
Selection of ER indicators
In order to comprehensively measure China’s current ER, this study categorized ER into three types: command-type, market-based, and voluntary regulation, based on existing studies and considering the comprehensiveness and quantification of the indicator system. The specific indicators are shown in Table 4.
Table 4.
ER intensity index system.
Measurement of ER
In this study, the strength of various ERs in 30 Chinese provinces (municipalities and autonomous areas) from 2001 to 2020 was measured using the entropy approach [54], and the quantitative basis was the ER index system established in Table 4 of this paper. Because the data for different indicators were very different, it was necessary to carry out standardization processing before calculating the weights to homogenize the heterogeneous indicators of varying sizes and weights. First, the absolute value method was used to convert the absolute values of the data into relative values. Formula (17) was used for the standardization of positive indicators, and Formula (18) was used for the standardization of negative indicators.
The data were processed without dimensions by the specific gravity method.
The entropy of the th index, , was calculated using the following formula:
where is the entropy of the index, is the dimensionless value, is the number of evaluated objects, where .
The difference coefficient, , of the index was calculated as follows:
The weight, , of item was calculated as follows:
The comprehensive evaluation score, , was calculated by multiplying standardized data and weights as follows:
Through the calculations of the above steps, the ER intensities of command-type, market-based, and voluntary regulations of 30 provinces in China from 2001 to 2020 were obtained, and the three were added together to obtain the comprehensive ER intensity. The larger the calculated ER composite score, the greater the overall ER intensity in a given region.
3.2.3. Other Variables
Mediating variables
Technological innovation (TI): This was expressed as the ratio of the number of patents granted in the three categories at the end of the year to the total population; this reflects the fact that technological innovation is the result of a combination of technological R&D inputs and innovation outputs.
Industrial structure upgrading (ISU): The upgrading of industrial structure was expressed by multiplying the proportion of the primary industry by 1 + the proportion of the secondary industry by the ratio of 2 + the tertiary industry by 3, and the larger the value, the better the optimization and upgrading effect of the industrial structure.
Foreign direct investment (FDI): Foreign direct investment was expressed as a proportion of the value of foreign investment in GDP.
Control variables
Economic growth level, degree of urbanization, allowing access to the outside world, and energy consumption structure were the four control variables used in this study, PGDP, UR, OP, and ERS, respectively. GDP per capita served as a gauge of economic development. The percentage of permanent urban residents among the region’s total resident population at year-end was used to determine the level of urbanization. The ratio of local goods import and export volumes to GDP was used to explain the opening level of the region. The proportion of coal use of the total local usage of energy in each province served as an expression of the ERS, and the demand for various fuels was multiplied by the corresponding standard coal conversion coefficient and added to obtain the total level of usage of energy.
3.2.4. Data Sources
This study’s sample period spanned from 2001 to 2020. The China Environmental Statistical Yearbook, the China Statistical Yearbook, the China Energy Statistical Yearbook, the Provincial Statistical Yearbook, and the National Bureau of Statistics were the sources of data for each variable. The research was carried out on 30 provinces, excluding Tibet, Hong Kong, Macao, and Taiwan, due to the scarcity of data for these regions. The GDP series was adjusted to 2001 constant prices in order to remove the impact on overall price fluctuations. Individual absent data were complemented by linear interpolation and the heterodyne method using Stata16 software and other related tools to ensure the adequacy of the scientific research.
4. Empirical Analysis
4.1. An Empirical Test of the Synergistic Effect of Environmental Regulation on Pollution Reduction and Carbon Reduction
4.1.1. Spatial Autocorrelation Test
Global Spatial Autocorrelation Test
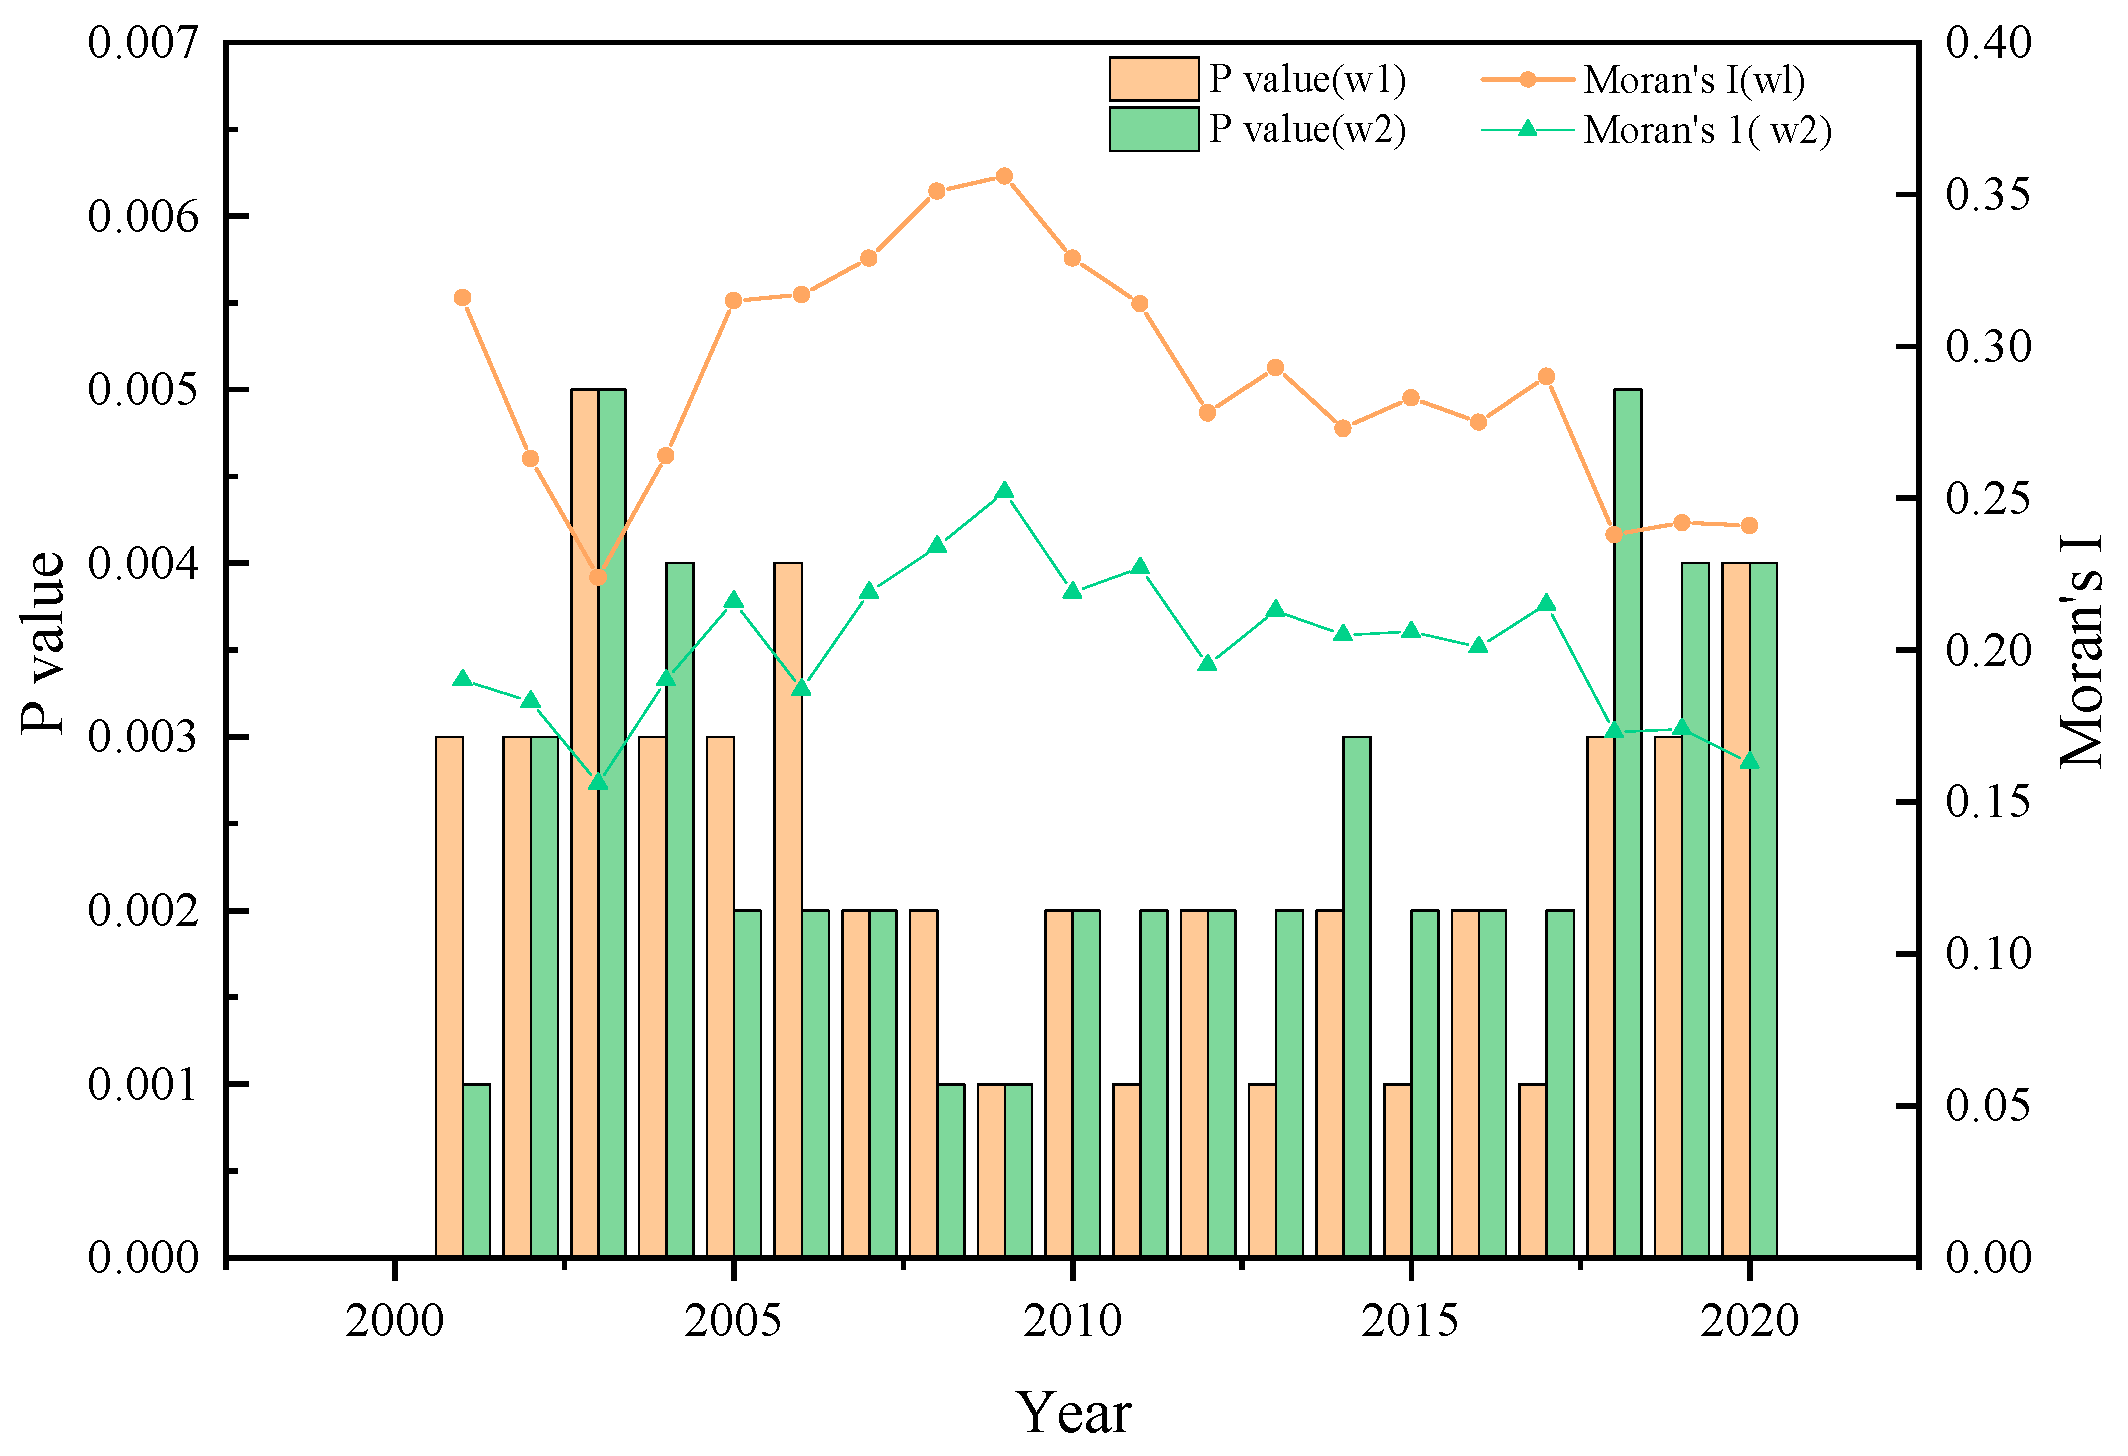
In this study, based on the mean value of the synergy coefficients for reducing pollution and carbon emissions in 30 Chinese provinces (cities) between 2001 and 2020, the global Moran index of the co-benefits of China’s PRCR was investigated to test for spatial correlation by utilizing the Stata15.2 software with the Rook 0–1 adjacency weight matrix (w1) and the latitude/longitude geographic distance matrix (w2). The worldwide Moran’s index of the co-benefits of PRCR in China between 2001 and 2020 was more than 0, as can be seen from Figure 3, regardless of the geographical weight matrix employed, and the p-value was not as high as 0.05. This shows that China’s PRCR synergies showed significant positive correlation or spatial dependence in geographic space. As a result, the spatial econometric model was appropriate for this paper’s empirical investigation.

Figure 3.
The trends of global Moran’s I indices in Chinese provinces.
Local Spatial Autocorrelation Test
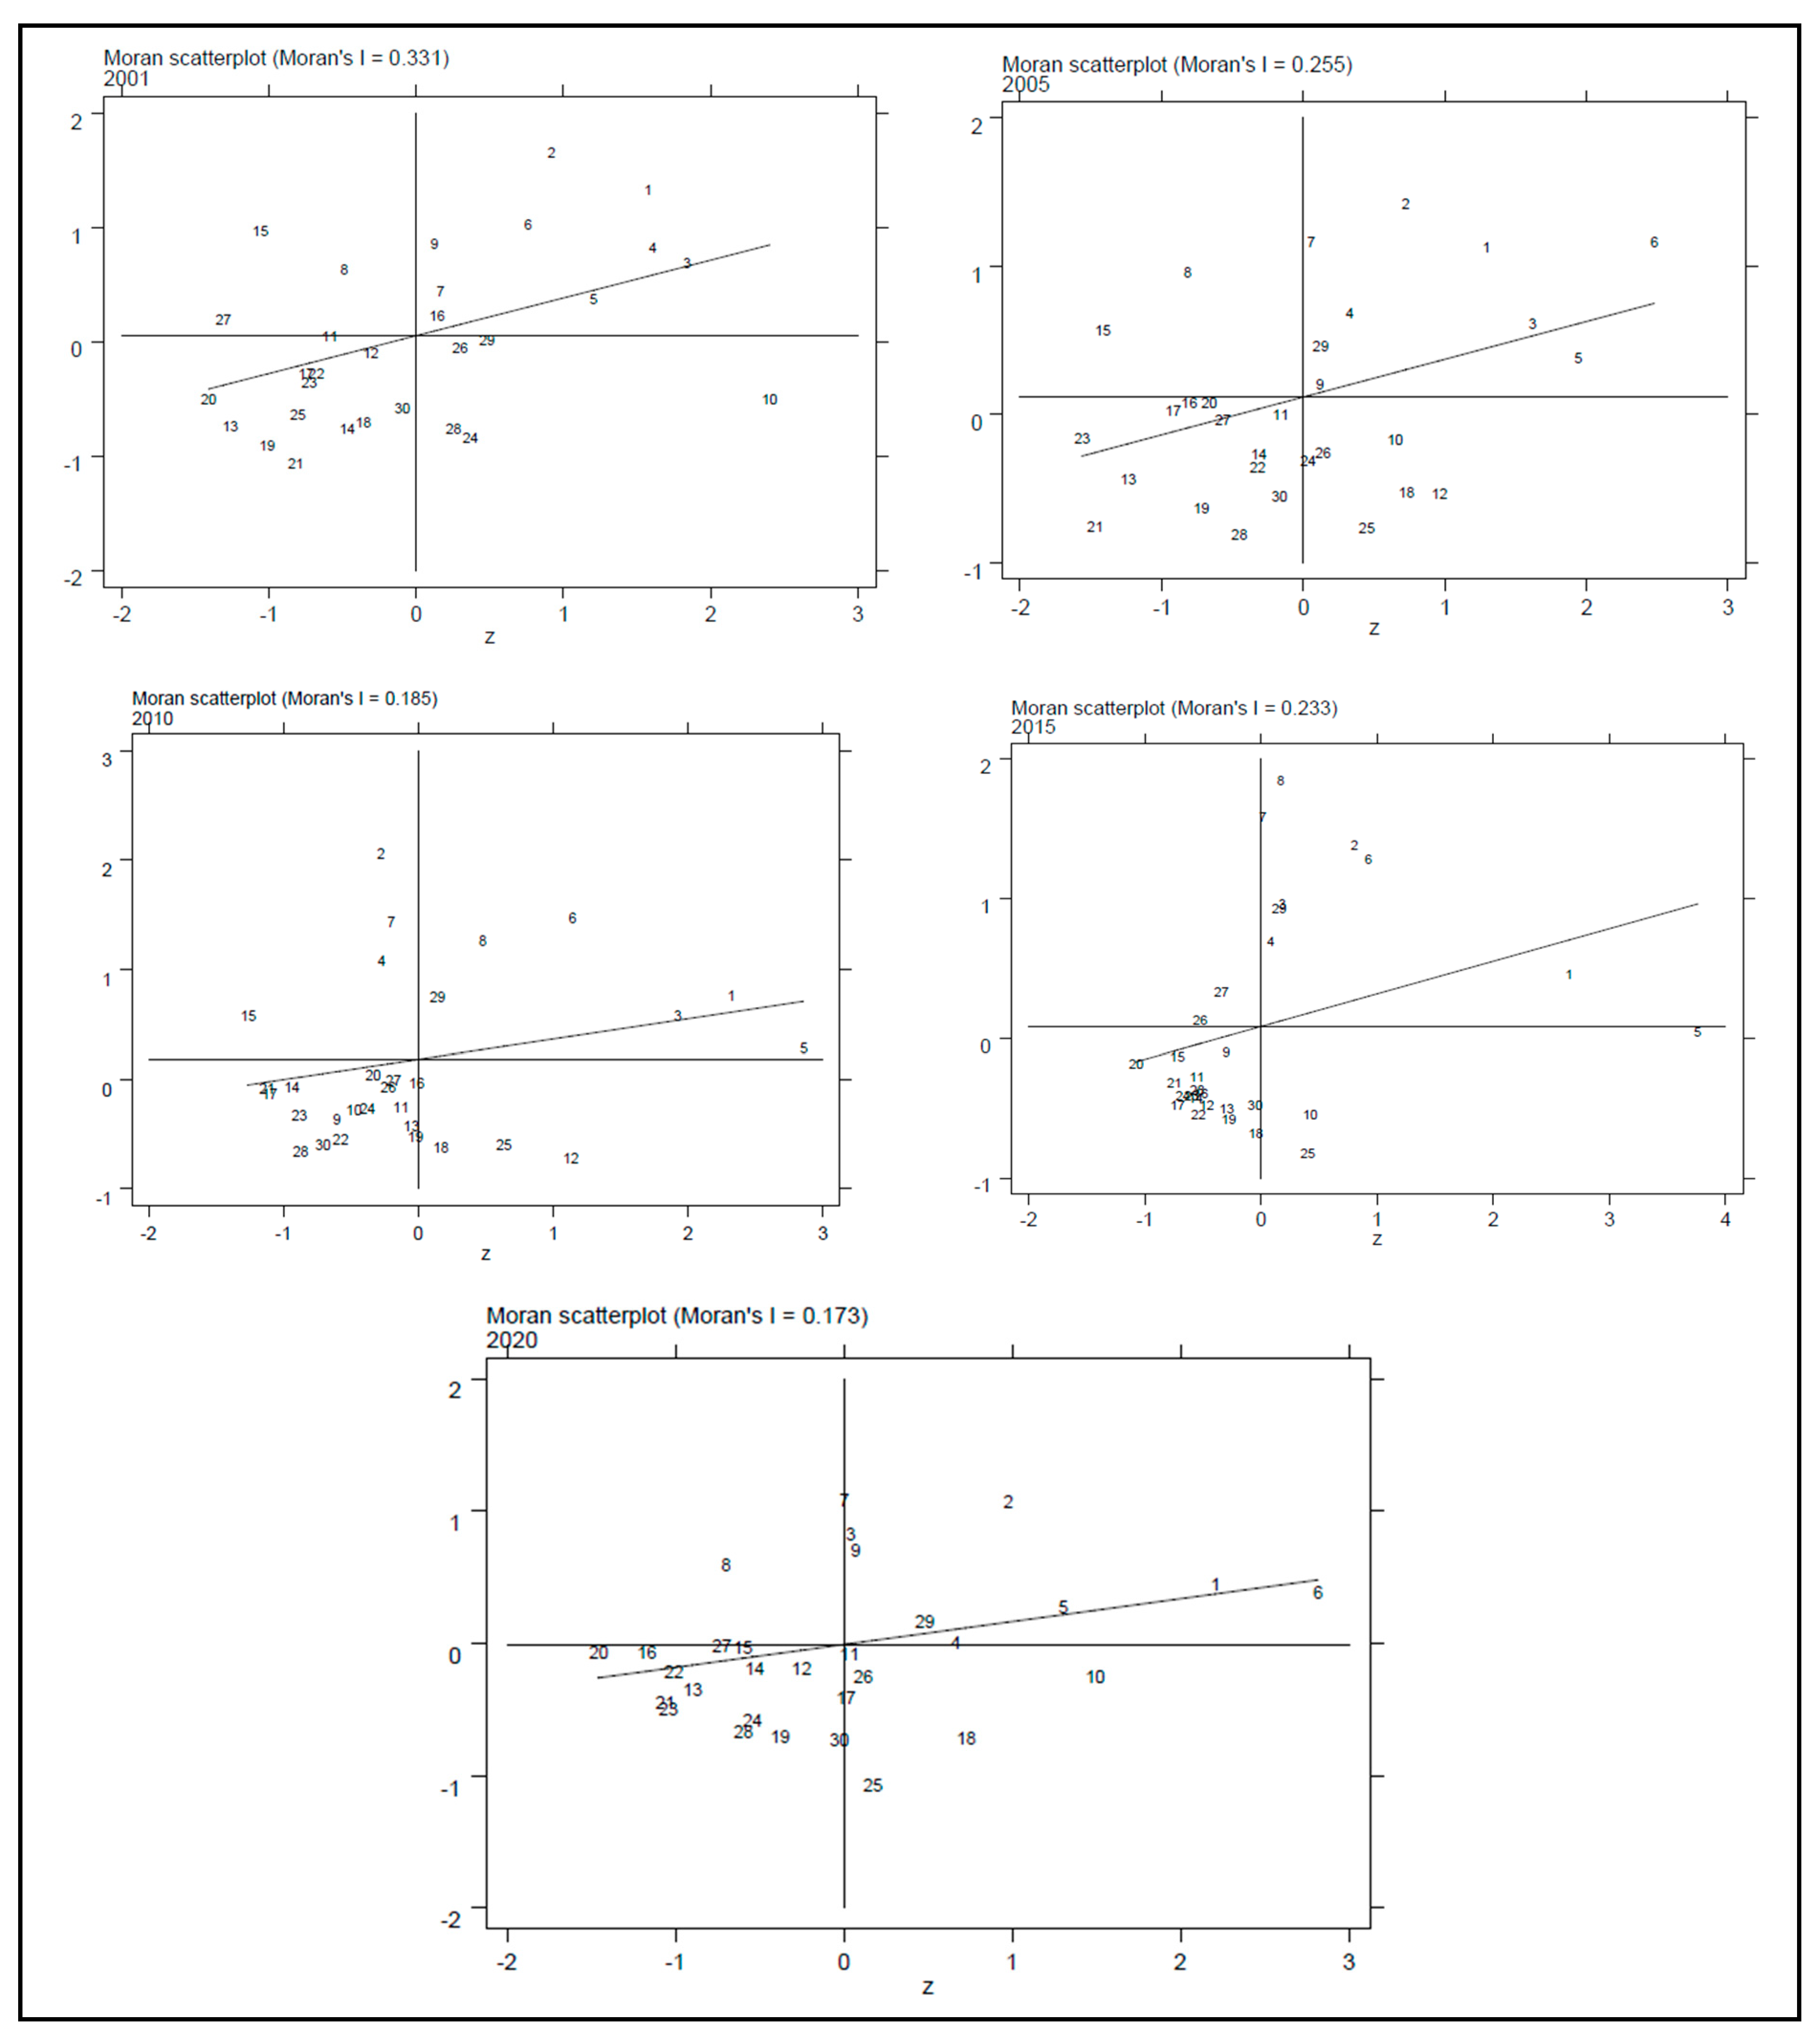
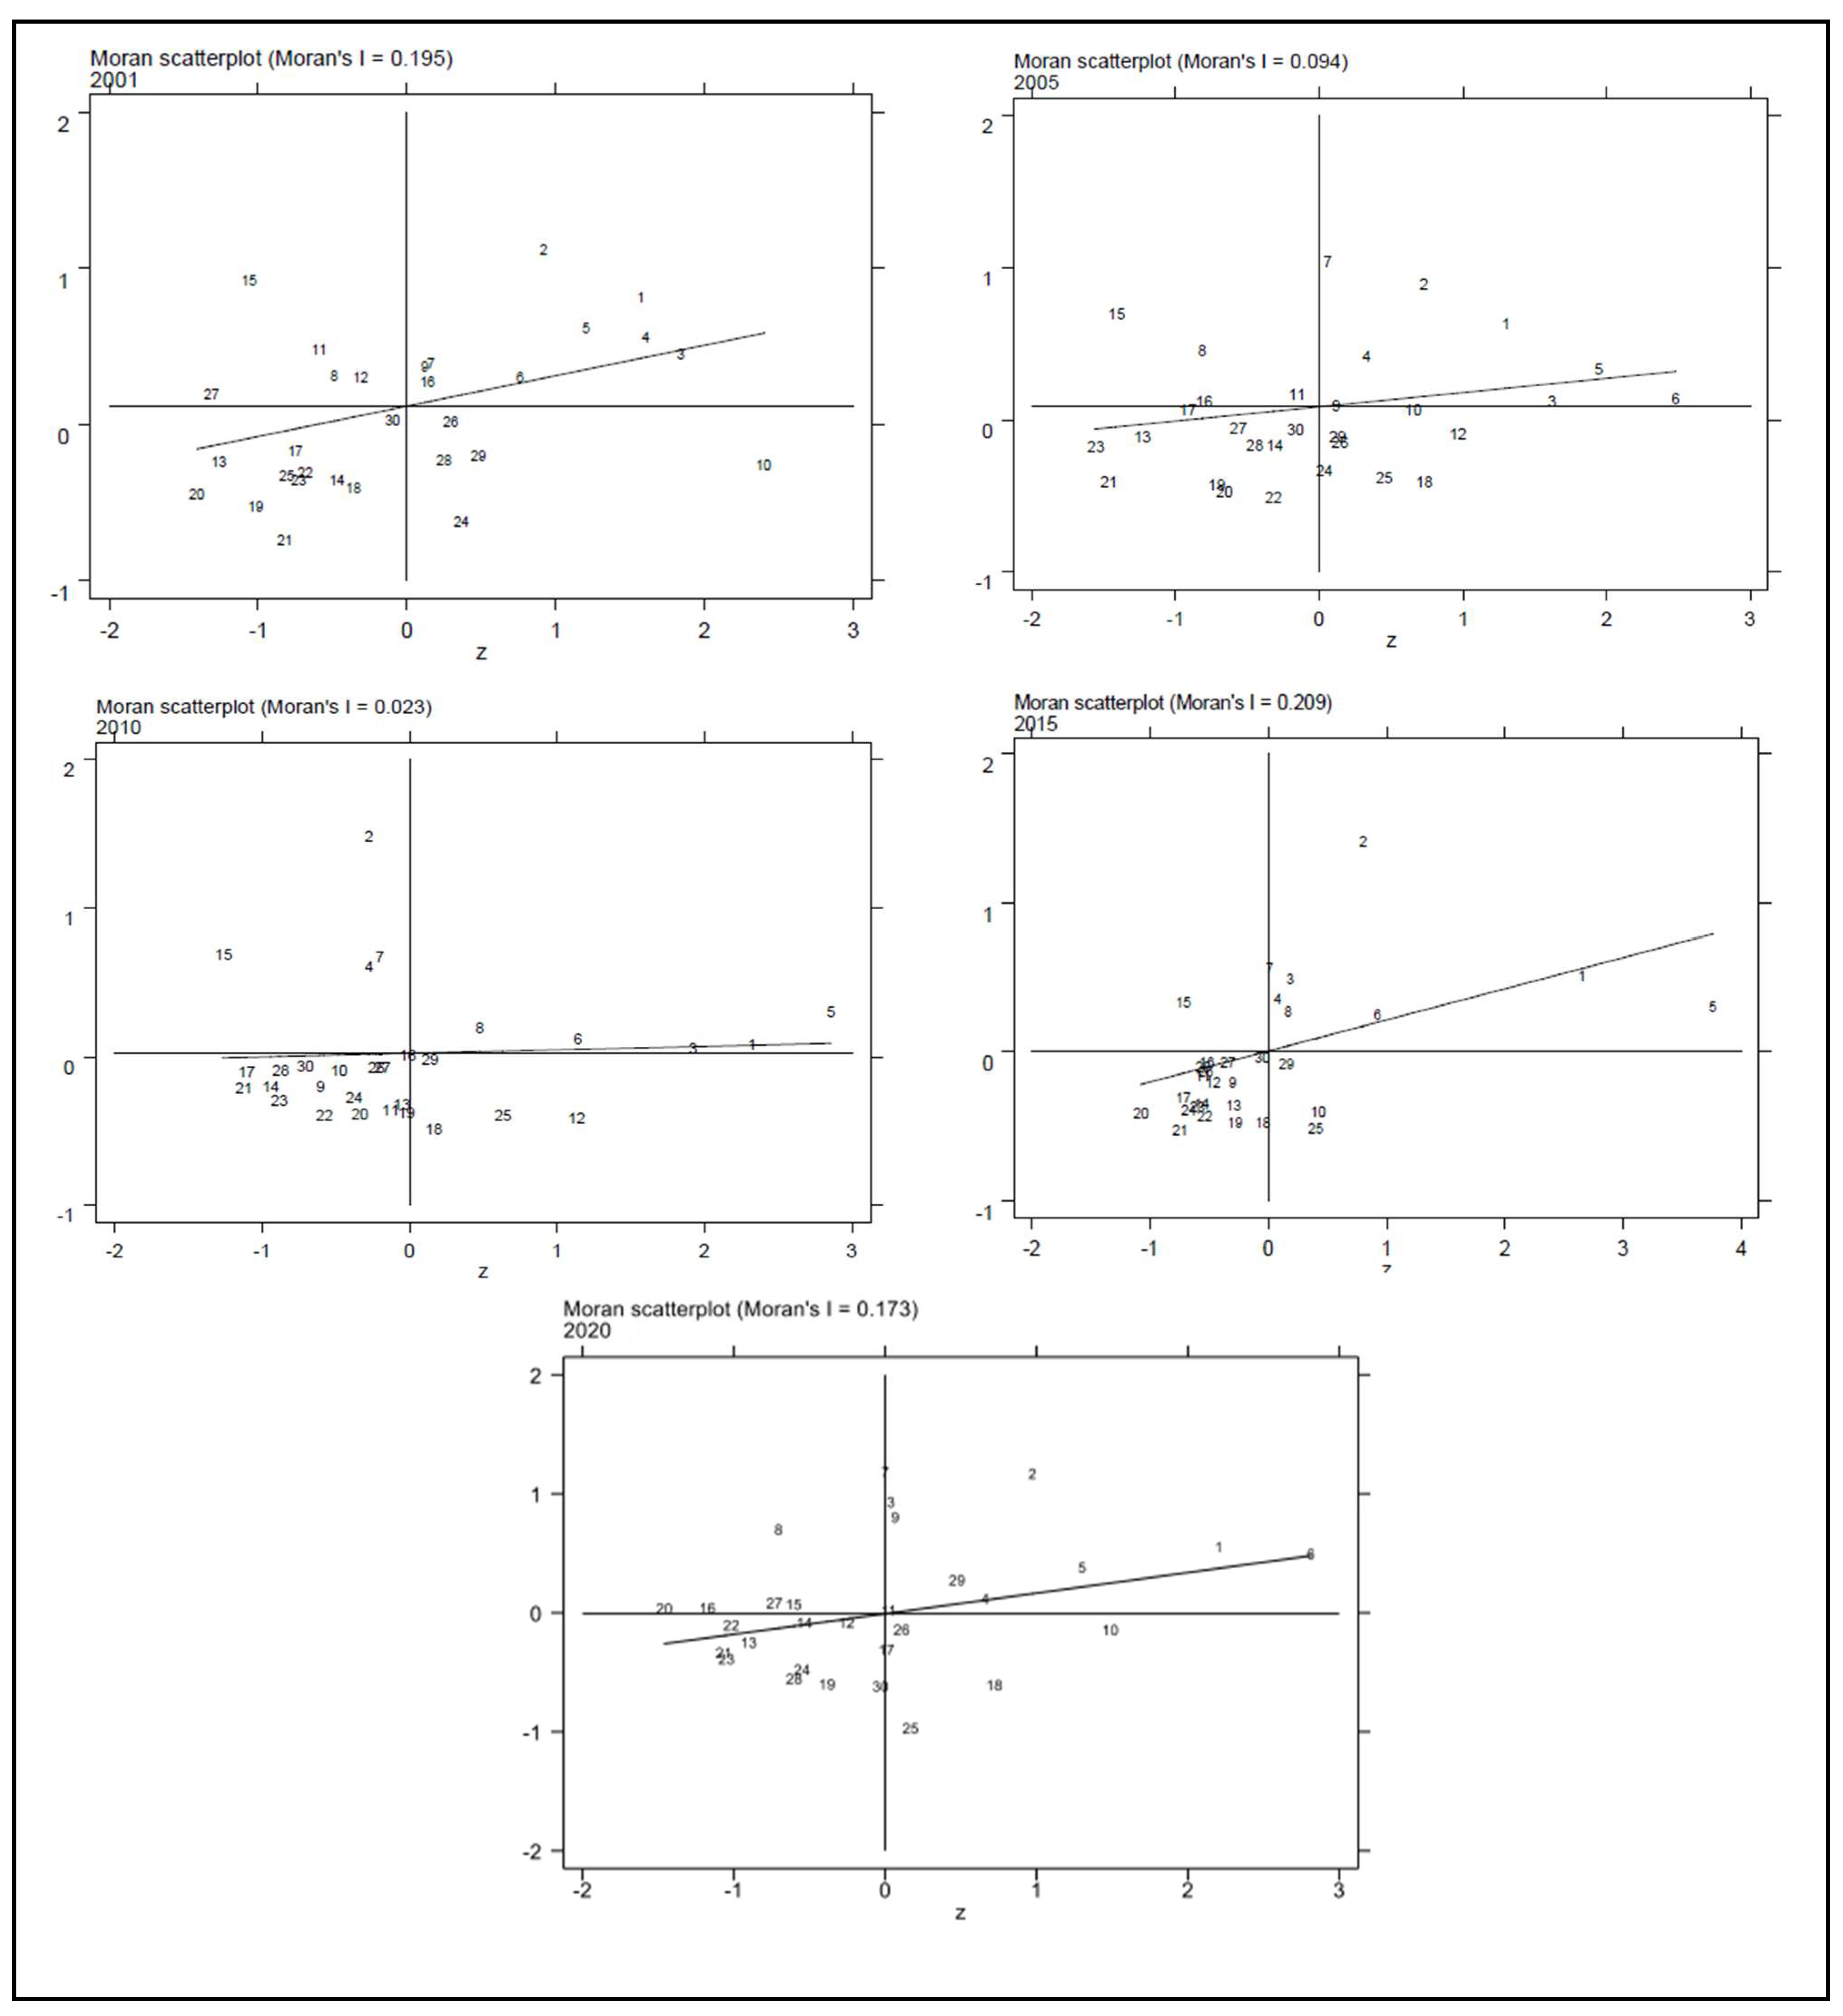
In addition, Figure 4 and Figure 5 show the Moran index scatter plots for the synergies of PRCR in Chinese provinces in 2000, 2005, 2010, 2015, and 2020 under the weight matrix for adjacency and the weight matrix for geographical distance, respectively. It is evident from the figures that the first and third quadrants contain the majority of provinces, demonstrating a clear local spatial characteristic in terms of the synergistic effect of PRCR.
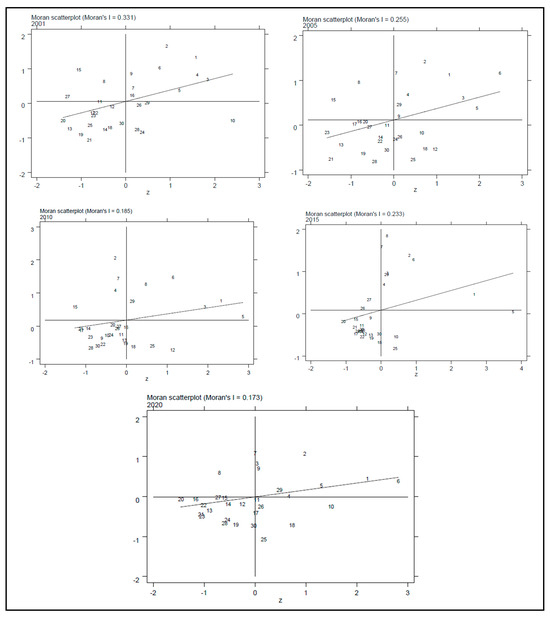
Figure 4.
Scatterplot of Moran’s index for synergistic effects of pollution reduction and carbon reduction under neighboring weight matrices.
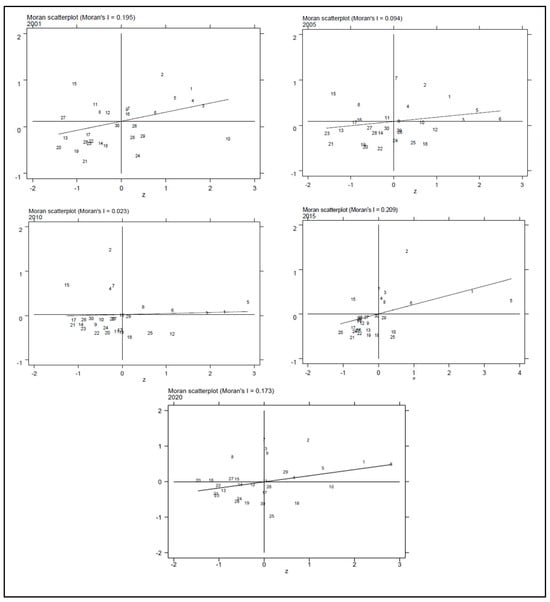
Figure 5.
Scatterplot of Moran’s index for the synergistic effect of pollution reduction and carbon reduction under the geographic distance weighting matrix.
4.1.2. Model Test
Lagrange Multiplier Test (LM Test)
In order to choose a more suitable spatial model, this paper also required a series of tests. Table 5 displays the Lagrange multiplier test results. According to the above introduction to LM test methods and judgment criteria, the p-values of the LM-Lag and LM-Error tests reached a significance degree of 10% under both the Rook 0-1 weight matrix and the geographic distance weight matrix, so the use of the spatial measurement model in this paper was correct. It can be seen from the above test results that only the spatial lag panel model passed the significance test; hence, the SLM was employed in this research.
Table 5.
LM test results.
Hausman Test
When using the SLM, the best effect model is chosen in accordance with the Hausman test evaluation standards. The fixed effect is chosen when the p-value for the Hausman test is less than 0.1. Random effects are chosen when the Hausman test’s p-value is higher than 0.1. The p-values for ER1, ER2, and ER3 were all less than 0.1 according to the Hausman test results shown in Table 6, so the fixed-effects model is chosen.
Table 6.
Hausman test results.
4.1.3. Baseline Results Analysis
After the above analysis, this paper used stata15.2 software to study the influence of ERs on the pollution reduction and carbon reduction (PRCR) synergies by using the spatial lag model. Table 7 shows the test results under the Rook 0-1 neighbor weight matrix. As shown by the test results, the values of the spatial autoregressive coefficients, ρ, are all positive and smaller than 1, so they passed the significance test, demonstrating a positive spatial dependence of the PRCR synergies.
Table 7.
Study on the impact of ER on the PRCR synergies under the adjacency matrix.
The coefficient of the synergistic effect of command-and-control environmental regulation (ER1) on PRCR was 0.163, which passed the significance test, indicating that the state forces companies to carry out carbon emission control and pollution treatment through compulsory means such as strengthening government legislation, law enforcement, and administrative punishment, thus promoting the synergistic effect of PRCR in China. The coefficient of the synergistic effect of market incentive environmental regulation (ER2) on PRCR was 0.074 and passed the significance test, demonstrating that measures such as raising environmental protection tax, pollutant discharge tax, and environmental protection investment increase the production expenses and environmental cost of enterprises so they cut back on the usage of fossil fuels and can effectively reduce air pollutant emissions and CO2 emissions. To some extent, the synergistic effect of PRCR was improved, but the promotion effect was not as good as that of ER1. The coefficient of public participatory environmental regulation (ER3) on the synergistic effect of PRCR was 0.002, which was significant at the 1% level, demonstrating that the degree of public environmental concern has a small but significant impact on the synergistic effect of PRCR. This may be because the public’s awareness of and attention to environmental protection are strong, though it has not received enough attention from the government. Or it could be that the public is very concerned about the environment but rarely participates in the supervision of the ecological environment.
The empirical findings presented above demonstrate that the three types of ER have different impacts on the synergistic effect of PRCR, and they take the following order when ranked according to the intensities of their effects: command type (0.163) > market type (0.074) > voluntary type (0.002); they all exhibited positive values and passed the significance test, demonstrating that the three types of ER have different degrees of promoting effects on the synergistic effect of PRCR.
Among the control variables, the coefficient value of PGDP was positive, demonstrating that PGDP has a promoting effect on the PRCR synergies. The other control variables had negative coefficients, indicating that they have an inhibitory effect on the PRCR synergies, among which was a noticeably negative coefficient for the level of opening up, which verifies that FDI raises the amount of CO2 emissions, which reflects that the investment intention of developed countries in developing countries is mainly to transfer high-energy-consuming and high-emission industries. This will result in a rise in the percentage of secondary industries in the country, a double pressure on local environmental degradation and carbon emissions, and an inability to successfully adopt advanced foreign emission reduction technologies. For this reason, it is essential to maintain a reasonable range regarding the intensity of ER1 and ER2 to guide foreign investors to change their investment directions and increase the introduction of green industries. China is highly dependent on coal resources, and, despite the continuous enhancement of air pollution control technology, carbon emission control is still insufficient and the energy consumption structure strongly inhibits the co-benefits of PRCR, indicating that China still has enormous potential for carbon reduction.
4.1.4. Robustness Test
The validity of the above findings was examined through a robustness test using a geographical distance matrix, as shown in Table 8. The three types of ER all have significant promoting effects on the synergies of pollution reduction and carbon reduction (PRCR), and the impact of ER1 on the synergies of PRCR is greater than that of ER2, while the impact of ER2 on the synergies of PRCR is greater than that of ER3 with public participation. Regarding the control variables, the coefficient for economic development level is statistically significant and positive, whereas the coefficients for the other control variables are statistically significant and negative, consistent with the previous test findings. Consequently, the empirical findings presented in this study demonstrate robustness, indicating that the three types of ER promote the synergistic effect of PRCR, and Hypothesis 1 is verified.
Table 8.
Study on the influence of ER on the PRCR synergies under the geographical distance matrix.
The effect of command-type environmental regulation on the synergistic effect of pollution reduction and carbon reduction is greater than that of the other two types of environmental regulation, which may be due to the facts that command-type environmental regulation is mandatory by the government, enterprises must implement the required measures, and the strength of the regulation is greater than that of the other two. Market-based environmental regulation is reflected in the market’s role in regulating the synergistic effects of pollution reduction and carbon reduction, which may be dependent on the government’s environmental standards and regulations, such as emission standards and emission taxes, and enterprises dealing with the pressure of the government by applying for emission permits. In order to improve the quality of the ecological environment, the government encourages the public to report environmental violations by enterprises and increase employment opportunities in the environmental protection industry so as to achieve the synergistic effect of pollution reduction and carbon reduction at the level of the public’s environmental concern. However, this depends on the voluntary behavior of the public, which may or may not implement reduction measures, and the public may not pay enough attention to reporting and complaining, so it has the least influence on the synergistic effect of pollution reduction and carbon reduction.
4.2. Mechanism Analysis
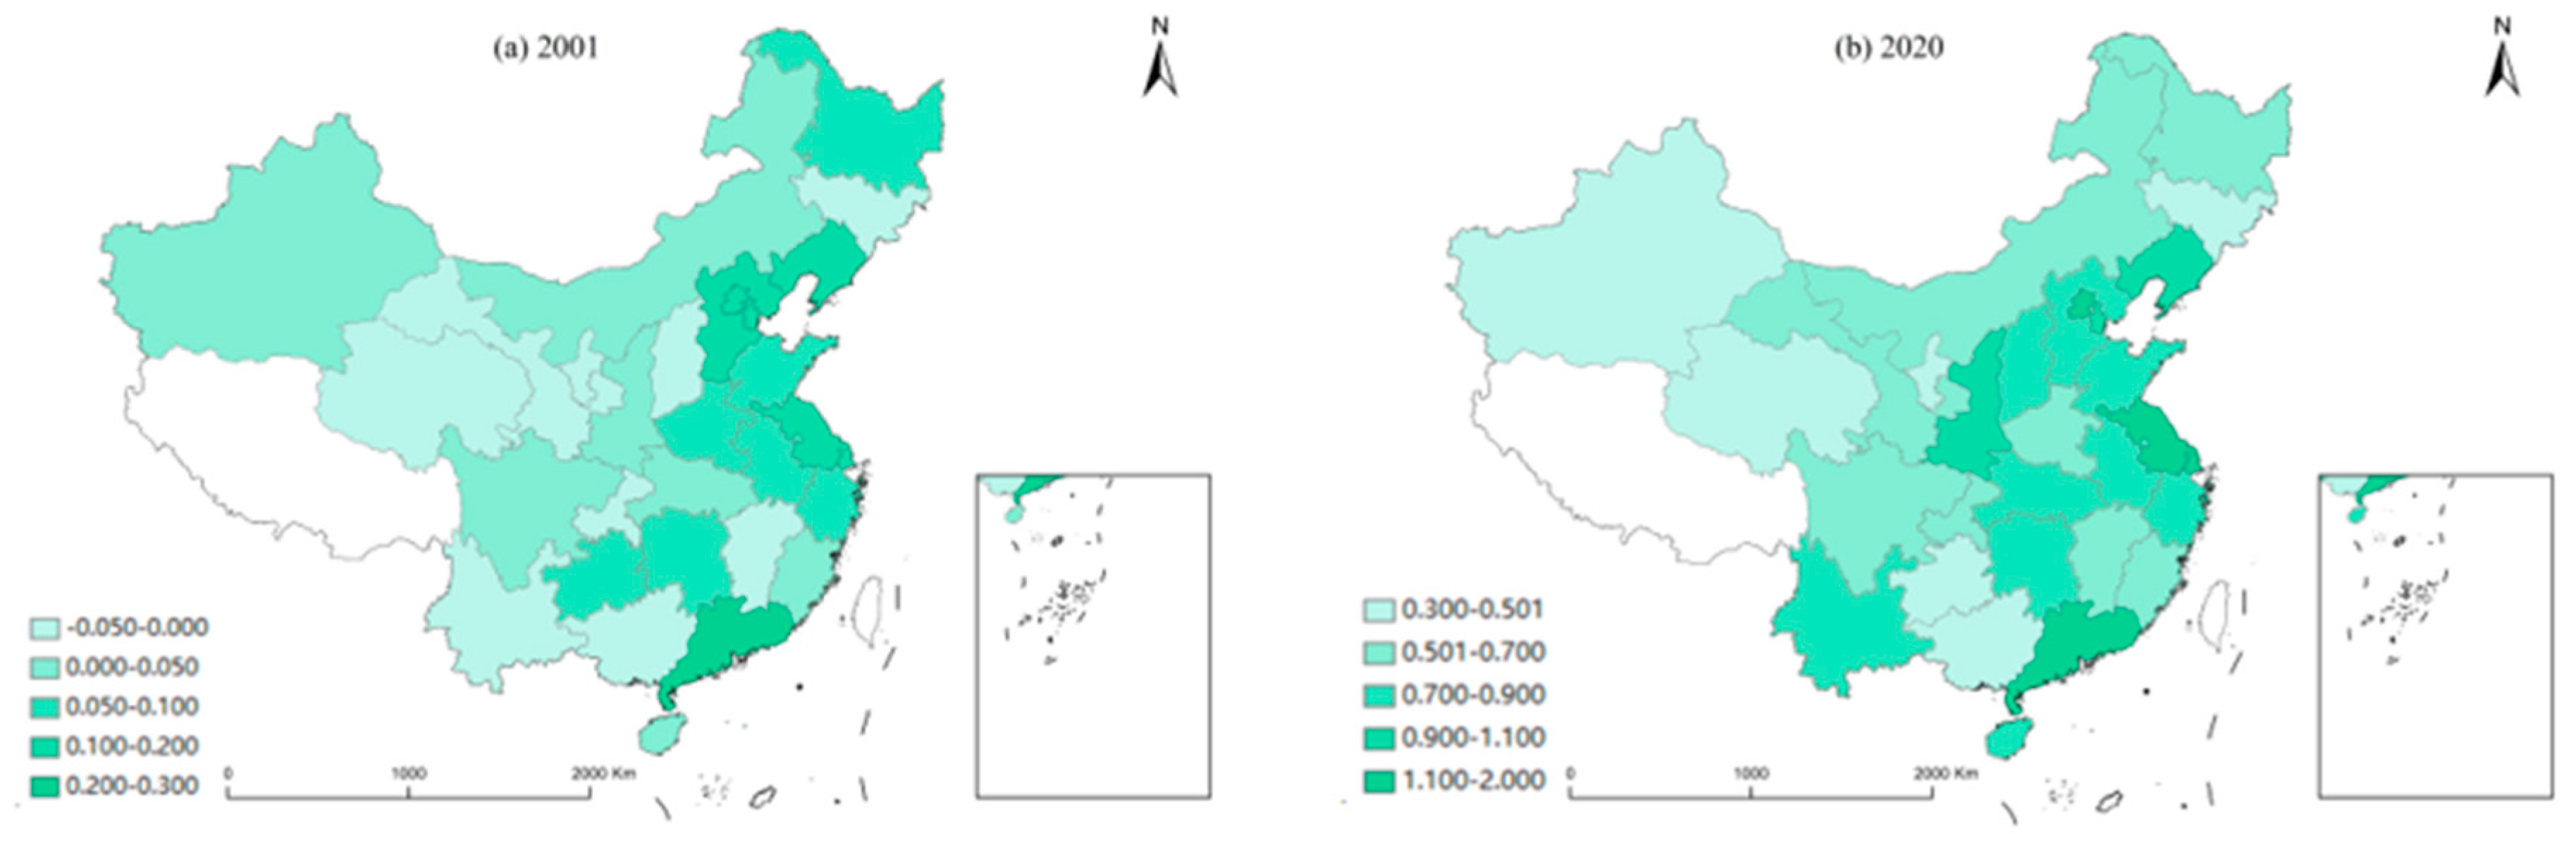
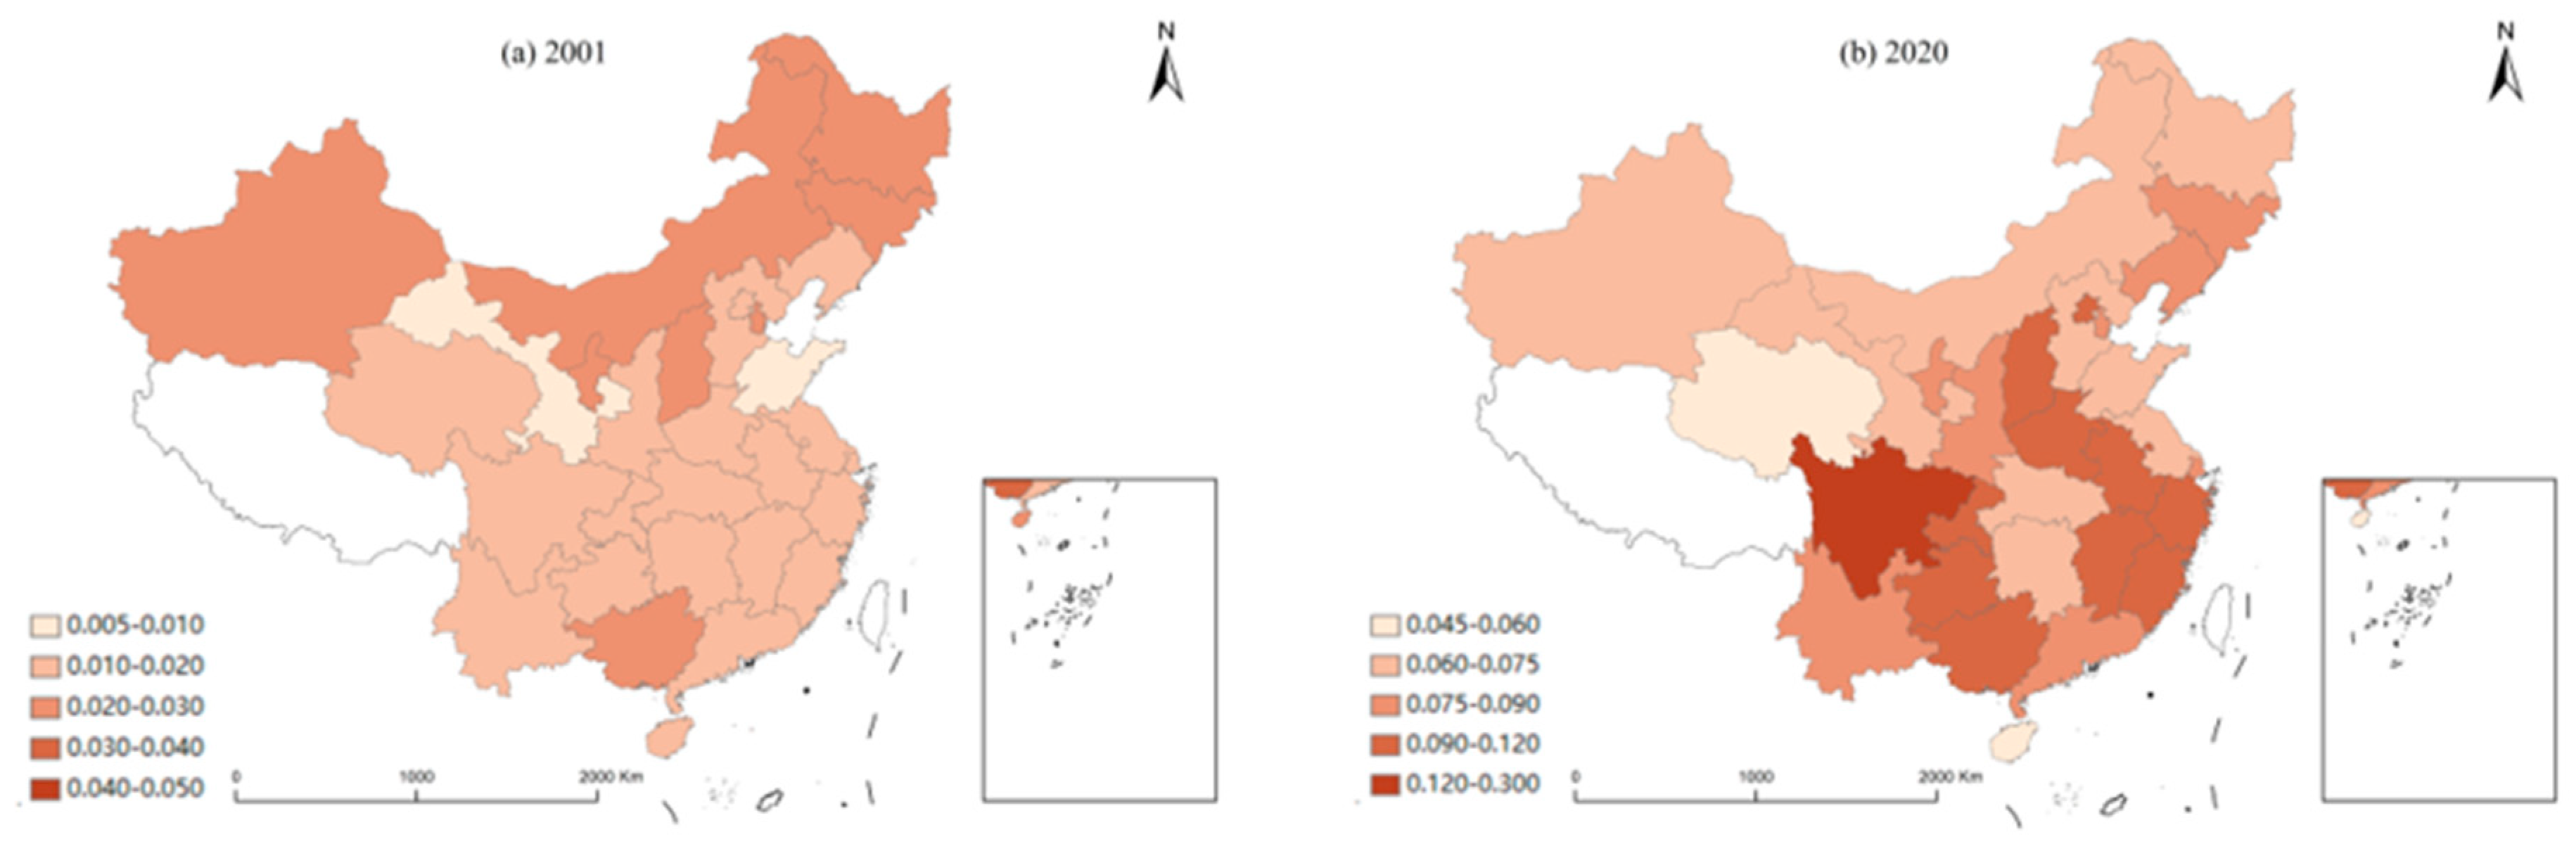
The premise of the intermediary effect model is that the independent variable affects the dependent variable at the significance level. In the previous empirical analysis, the three types of environmental regulations had a significant promoting effect on the synergistic effect of pollution reduction and carbon reduction, and it can be seen from Figure 6 and Figure 7 that the synergistic effect of pollution reduction and carbon reduction and the intensity of comprehensive environmental regulations changed significantly. From 2001 to 2020, the synergistic effect coefficient of pollution reduction and carbon reduction and the intensity of comprehensive environmental regulations increased significantly in 30 provinces (municipalities) in China, indicating that comprehensive environmental regulations can significantly promote the synergistic effect of pollution reduction and carbon reduction.
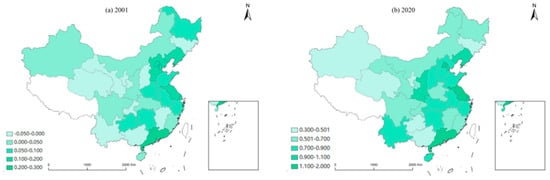
Figure 6.
Spatial and temporal distribution of synergistic effects of pollution reduction and carbon reduction in China in 2001 and 2020.

Figure 7.
Spatial and temporal distribution of environmental regulatory intensity in China in 2001 and 2020.
To delve deeper into the impact of ER on the synergies of PRCR, a classic three-step mediation model was employed. In this paper, the fixed-effects model was used to analyze the impact of comprehensive ER on intermediate variables, while the spatial factor was incorporated in examining the impact of these intermediate variables on the synergistic PRCR effect, which was analyzed using the spatial lag model (SLM) under the Rook 0-1 adjacency matrix.
4.2.1. Technological Innovation Mechanism Test
The regression outcomes are presented in Table 9, below. The first-step results indicate that ER promoted the growth of the synergistic effect of pollution reduction and carbon reduction (PRCR) to a certain extent. The second-step regression results demonstrate that an improvement in ER level promotes TI. Furthermore, both ER and TI have significantly positive regression coefficients on the synergistic effect of PRCR. Under the mechanism of TI, ER has a more obvious promoting effect on this synergistic effect, indicating that TI serves as an intermediary variable affecting the synergistic effect of ER on pollution reduction and carbon reduction.
Table 9.
Test results for intermediate mechanisms of technological innovation.
Environmental regulation has a positive impact on the synergistic effect of pollution reduction and carbon reduction through technological innovation, which indicates that appropriate environmental regulation can promote the progress of environmental protection and production technology, and the promotion of green technology can promote the greening of the production process, which is conducive to the comprehensive conservation and efficient use of energy resources, reduces the energy intensity of economic development, and reduces the emission of pollutants and greenhouse gases at source, which offsets the high “cost of compliance” and promotes the synergistic effect of pollution reduction and carbon reduction, which confirms “Porter’s hypothesis”. In addition, environmental regulation will strengthen the research and development and application of digital technology, enhance the monitoring of environmental pollution and carbon emission data by enterprises, facilitate the timely detection of environmental violations such as theft and leakage, and force enterprises to carry out synergistic management of pollution reduction and carbon reduction. Accordingly, Hypothesis 2 is validated.
4.2.2. Industrial Structure Upgrading Mechanism Test
Table 10 shows the results for the impact mechanism of comprehensive environmental regulation (ER) in relation to pollution reduction and carbon reduction (PRCR) through industrial structural upgrades (ISUs). According to the first-step results, ER significantly promotes the growth of China’s PRCR synergies. The second-step analysis results indicate that the degree of ER has a positive effect on promoting the upgrading of China’s industrial structure. Thirdly, the regression analysis shows that the coefficient of ER on the synergistic effect of PRCR is statistically significant and positive, and the coefficient of ISU on the synergistic effect of PRCR is significant under 10%, indicating that the intermediary effect of ISUs is relatively strong. The analysis indicates that ISUs have a positive influence on the synergistic effect of PRCR.
Table 10.
Inspection results for the intermediate mechanism of industrial structure upgrading.
On the one hand, stringent environmental regulations have made it difficult for pollution-intensive industries to survive due to high “environmental compliance costs”. In contrast, the impact of environmental regulations on technology-intensive and labor-intensive firms in the service sector is almost negligible, and these firms may even benefit from favorable environmental regulations. In short, environmental regulations inhibit the development of highly polluting and energy-intensive heavy industries, encourage the development of cleaner industry-based services, and promote the upgrading of the industrial structure, thereby reducing energy consumption. On the other hand, some local polluting enterprises may respond to the environmental protection oversight of government agencies by curtailing production or temporarily suspending operations, while others may proactively pursue TI and achieve cleaner production through production technology upgrades and product structure reforms. In this scenario, enterprises that comply with environmental protection requirements gradually gain increased market share and establish a competitive advantage. The decline of polluting enterprises and the optimization of production structures have facilitated transformation and ISUs. In short, environmental regulation stimulates industrial structure upgrading and brings a “structural dividend”, which is conducive to the synergistic effect of pollution reduction and carbon reduction, and Hypothesis 3 is verified.
4.2.3. Foreign Direct Investment Mechanism Test
Table 11 shows the impact mechanism of ER for pollution reduction and carbon reduction (PRCR) through FDI. In the first-step test results, ER promotes the synergistic effect of PRCR. In the results of the second step, ER has an inhibitory effect on FDI. Furthermore, the results align with those from the analysis on the degree of openness to the external world among the aforementioned control variables. The results of the third-step regression show that FDI has an inhibitory effect on the synergies of PRCR, and the promoting effect of ER on the synergies of PRCR is significantly increased when FDI is restricted, indicating that the FDI mechanism exists as an intermediary effect.
Table 11.
Test results for the intermediate mechanism of foreign direct investment.
Environmental regulations have a positive impact on pollution and carbon synergies by constraining foreign direct investment. China’s environmental regulations have prevented the entry of foreign energy-intensive industries and prevented China from becoming a “pollution haven” for developed countries. In addition, under China’s strict environmental regulations, many existing highly polluting foreign firms have decided to leave the country due to high environmental costs, which also contributes to the promotion of pollution reduction and carbon synergies. Overall, environmental regulations promote the synergies of pollution reduction and carbon reduction by constraining the environmental spillover effect and the capital accumulation effect of FDI, and Hypothesis 4 is verified.
The above empirical results show that environmental regulation effectively promotes the synergistic effect of pollution reduction and carbon reduction by stimulating the technological innovation of enterprises, optimizing the industrial structure, and rationally regulating foreign direct investment in three ways; the effects are in the following order: the mechanism of technological innovation (0.176) > the mechanism of foreign direct investment (0.144) > the mechanism of upgrading the industrial structure (0.121), and this kind of result will provide policy makers with certain ideas, suggesting that, in future policy, the relevant personnel should pay more attention to the technological innovation tilt and the foreign direct investment tilt. Technological innovation is subject to the constraints of a variety of factors, such as the development of auxiliary infrastructure and the output of innovation results. In the short term, seeing the rapid effect is challenging, so the government also needs to develop a long-term effective policy orientation and a solid guaranteed mechanism. With regard to foreign direct investment, the “pollution halo” effect, whereby foreign firms with cutting-edge technologies are likely to introduce more environmentally friendly and cleaner manufacturing technologies, will provide the government with an incentive to encourage firms to acquire advanced environmentally friendly production concepts and manufacturing technologies.
5. Conclusions and Policy Implications
5.1. Conclusions
Leveraging panel data spanning 30 Chinese provinces and cities from 2001 to 2020, this study employs a spatial econometric model to analyze the synergistic impacts of three ER mechanisms on carbon emission reduction and pollution mitigation. Additionally, the research examines the transmission mechanisms underlying the synergistic effect of comprehensive ER on pollution and carbon reduction through mediation analysis. The key findings can be summarized as follows:
- (1)
- The empirical examination of environmental regulation’s synergistic impact on pollution mitigation and carbon reduction in China reveals that three different types of ER have promoted the synergistic effect of pollution reduction and carbon reduction in China to varying degrees, and this empirical result is valid given that it passed the robustness test, with the regulation types taking the following order when ranked according to their effect intensities: ER1 > ER2 > ER3.
- (2)
- China’s ER mainly promotes the synergistic effect of pollution reduction and carbon reduction via three mechanisms: stimulating technological innovation, upgrading industrial structures, and restricting foreign direct investment. The effects of the three intermediary variables are in the following order: the technological innovation mechanism > the foreign direct investment mechanism > the industrial structure upgrading mechanism.
5.2. Policy Recommendations
Based on the above findings and practical implications, the following policy recommendations are proposed:
- (1)
- Command-type environmental regulation still has a major role to play. It should be combined with market-type environmental regulation that subsidizes environmental costs, and command-based emergency responses and related policy formulations should be appropriately strengthened; stricter environmental laws and regulations in the areas of front-end control, medium-term supervision, and offline governance should be formulated, and penalties for environmental violations should be increased. Enterprises should be urged to take the initiative to assume social and environmental responsibility.
- (2)
- The impact of ER3 on the synergistic effect of pollution and carbon emission reduction is weak but significant. Therefore, publicizing and educating enterprises and the public, cultivating a good environmental-protection consciousness and atmosphere, constructing more open reporting channels, and expanding diversified reporting methods should be priorities, and reasonable incentives should be offered and put into practice to encourage the public to actively participate in the supervision of environmental protection and management. At the same time, central and local governments should take public complaints about environmental protection seriously and respond to them in a timely manner.
- (3)
- ER promotes the synergistic effect of reducing pollution and carbon emissions by encouraging enterprises’ TI and ISU and restricting FDI. Therefore, enterprises should be encouraged to strengthen technological innovation and technological transformation through the necessary financial subsidies, and a sustainable energy system should be constructed with new and renewable sources of energy as the main supply, gradually eliminating dependence on coal resources. In addition, enterprises should be encouraged to learn and disseminate advanced cleaner production technologies and environmental management methods from abroad so as to promote the cleaner development of Chinese enterprises. The government should refrain from adopting lax environmental policies to attract highly polluting and high-emission foreign-funded enterprises, and it should avoid creating a “pollution paradise” for developed countries.
Due to the limited availability of data, it is still difficult to use the indicator system presented in this study to comprehensively portray all the implications of the three types of environmental regulation, so the construction of a more comprehensive and reasonable indicator system deserves further exploration. In addition, due to the limited availability of data at the municipal level, this study could only focus on the provincial level. Future studies could expand the scope of the study to include more comprehensive municipal data and analysis.
Author Contributions
Conceptualization, G.Z., R.P. and L.Z.; Data curation, W.S. and W.W.; Formal analysis, W.S. and W.W.; Methodology, G.Z., R.P., W.T. and L.Z.; Project administration, G.Z., R.P. and L.Z.; Supervision, G.Z., R.P. and L.Z.; Writing—original draft, W.S. and W.W.; Writing—review and editing, W.T. and F.Q. All authors have read and agreed to the published version of the manuscript.
Funding
This research was funded by the Ministry of Education of Humanities and Social Science project (grant no. 23YJA630080) and the Gansu Provincial Natural Science Foundation (grant no. 22JR5RA155).
Institutional Review Board Statement
Not applicable.
Informed Consent Statement
Not applicable.
Data Availability Statement
The data are available from the corresponding author upon reasonable request.
Conflicts of Interest
The authors declare no conflicts of interest.
Nomenclature
| PRCR | Pollution reduction and carbon reduction |
| ER | Environmental regulation |
| TI | Technical innovation |
| ISU | Industrial structure upgrading |
| FDI | Foreign direct investment |
References
- Deveci, M. Rough sets based Ordinal Priority Approach to evaluate sustainable development goals (SDGs) for sustainable mining. Resour. Policy 2022, 79, 103049. [Google Scholar] [CrossRef]
- Zhang, D.; Guo, Z.; Niu, X.; Gao, Y.; Wang, C.; Xu, H. Comprehensive evaluation on sustainable development based on planetary pressures and ecological well-being performance: A case study on the belt and road regions. J. Clean. Prod. 2022, 376, 134211. [Google Scholar] [CrossRef]
- Aydin, G. The Modeling of Coal-related CO2 Emissions and Projections into Future Planning. Energy Sources Part A Recovery Util. Environ. Eff. 2014, 36, 191–201. [Google Scholar]
- Bu, X. Collaborative management of pollution and carbon reduction enters a new journey. Environ. Econ. 2022, 15, 10–17. [Google Scholar]
- Yang, H.; Yao, R.; Sun, P.; Ge, C.; Ma, Z.; Bian, Y.; Liu, R. Spatiotemporal Evolution and Driving Forces of PM2.5 in Urban Agglomerations in China. Int. J. Environ. Res. Public Health 2023, 20, 2316. [Google Scholar] [CrossRef]
- Liu, C.; Sun, W.; Li, P.; Zhang, L.; Li, M. Differential characteristics of carbon emission efficiency and coordinated emission reduction pathways under different stages of economic development: Evidence from the Yangtze River Delta, China. J. Environ. Manag. 2023, 330, 117018. [Google Scholar] [CrossRef]
- Zhang, L.; Wu, P.; Niu, M.; Zheng, Y.; Wang, J.; Dong, G.; Zhang, Z.; Xie, Z.; Du, M.; Jiang, H.; et al. A systematic assessment of city-level climate change mitigation and air quality improvement in China. Sci. Total Environ. 2022, 839, 156274. [Google Scholar] [CrossRef] [PubMed]
- Gu, B.; Zhao, H.; Luo, X.; Zhu, T.; Fan, J. Progress and Prospects of Bibliometric-based Research on Pollution Reduction and Carbon Synergistic Emission Reduction. J. Environ. Eng. Technol. 2023, 13, 85–95. [Google Scholar]
- Smith, K.R.; Haigler, E. Co-benefits of climate mitigation and health protection in energy systems: Scoping methods. Annu. Rev. Public Health 2008, 29, 11–25. [Google Scholar] [CrossRef]
- Sharon, F.; Alan, D.D.; Tara, G.; Lock, K.; Chalabi, Z.; Roberts, I.; Haines, A. Public health benefits of strategies to reduce greenhouse-gas emissions: Food and agriculture (Review). Lancet 2009, 374, 2016–2025. [Google Scholar]
- Groosman, B.; Muller, N.Z.; O’Neill-Toy, E. The Ancillary Benefits from Climate Policy in the United States. Environ. Resour. Econ. 2011, 50, 585–603. [Google Scholar] [CrossRef]
- Shrestha, R.M.; Pradhan, S. Co-benefits of CO2 emission reduction in a developing country. Energy Policy 2010, 38, 2586–2597. [Google Scholar] [CrossRef]
- Qian, H.; Xu, S.; Cao, J.; Ren, F.; Wei, W.; Meng, J.; Wu, L. Air pollution reduction and climate co-benefits in China’s industries. Nat. Sustain. 2021, 4, 417–425. [Google Scholar] [CrossRef]
- Dong, F.; Yu, B.L.; Pan, Y.L. Examining the synergistic effect of CO2 emissions on PM2.5 emissions reduction: Evidence from China. J. Clean. Prod. 2019, 223, 759–771. [Google Scholar] [CrossRef]
- Jia, W.; Li, L.; Lei, Y.; Wu, S. Synergistic effect of CO2 and PM2.5 emissions from coal consumption and the impacts on health effects. J. Environ. Manag. 2023, 325, 116535. [Google Scholar] [CrossRef] [PubMed]
- Chae, Y. Co-benefit analysis of an air quality management plan and greenhouse gas reduction strategies in the Seoul metropolitan area. Environ. Sci. Policy 2010, 13, 205–216. [Google Scholar] [CrossRef]
- Wu, P.; Guo, F.; Cai, B.; Wang, C.; Lv, C.; Liu, H.; Gao, J. Co-benefits of peaking carbon dioxide emissions on air quality and health, a case of Guangzhou, China. J. Environ. Manag. 2021, 282, 111796. [Google Scholar] [CrossRef]
- Chen, Y.; Zhao, Z.; Yi, W.; Hong, J.; Zhang, B. Has China achieved synergistic reduction of carbon emissions and air pollution? Evidence from 283 Chinese cities. Environ. Impact Assess. Rev. 2023, 103, 107277. [Google Scholar] [CrossRef]
- Li, Y.; Lin, F.; Wang, W. Environmental regulation and inward foreign direct investment: Evidence from the eleventh Five-Year Plan in China. J. Econ. Surv. 2022, 36, 684–707. [Google Scholar] [CrossRef]
- Leite, M.S.M. Characterization of raw swine waste and effluents treated anaerobically: Parameters for Brazilian environmental regulation construction aiming agricultural use. J. Mater. Cycles Waste Manag. 2021, 1, 165–176. [Google Scholar]
- St-Pierre, M.; Elrod, A.A. The perverse effect of environmental regulation on emissions: The role of product-mix changes. J. Public Econ. Theory 2021, 24, 1. [Google Scholar] [CrossRef]
- Graafland, J.; Bovenberg, L. Government regulation, business leaders’ motivations and environmental performance of SMEs. J. Environ. Plan. Manag. 2020, 63, 1335–1355. [Google Scholar] [CrossRef]
- Xie, Z.; Qu, L.; Lin, R.; Guo, Q. Relationships between fluctuations of environmental regulation, technological innovation, and economic growth: A multinational perspective. J. Enterp. Inf. Manag. 2022, 35, 1267–1287. [Google Scholar] [CrossRef]
- Bao, Q.; Shao, M.; Yang, D. Environmental regulation, local legislation and pollution control in China. Environ. Dev. Econ. 2021, 26, 321–339. [Google Scholar] [CrossRef]
- Li, Y.; Zhang, L. Collaborative Governance and Environmental Regulation Measures for Pollution Reduction and Carbon Reduction in the Yangtze River Basin under the “Double Carbon” Goal. Sustainability 2023, 15, 5094. [Google Scholar] [CrossRef]
- Xu, X.; Cui, Y.; Zhong, Y. Impact of environmental regulation and fdi on green total factor productivity: Evidence from China. Environ. Eng. Manag. J. 2021, 20, 177–183. [Google Scholar]
- Liu, W. Mechanisms of Environmental Regulation’s Impact on Green Technological Progress—Evidence from China’s Manufacturing Sector. Sustainability 2021, 13, 1600. [Google Scholar] [CrossRef]
- Porter, M.E.; van der Linde, C. Toward a New Conception of the Environment-Competitiveness Relationship. J. Econ. Perspect. 1995, 9, 97–118. [Google Scholar] [CrossRef]
- Shadbegian, R.J.; Gray, W.B. Assessing multi-dimensional performance: Environmental and economic outcomes. J. Product. Anal. 2006, 26, 213–234. [Google Scholar] [CrossRef]
- Hu, J.; Wu, H.; Ying, S.X. Environmental regulation, market forces, and corporate environmental responsibility: Evidence from the implementation of cleaner production standards in China. J. Bus. Res. 2022, 150, 606–622. [Google Scholar] [CrossRef]
- Chen, X.; Chen, Z. Can China’s Environmental Regulations Effectively Reduce Pollution Emissions? Int. J. Environ. Res. Public Health 2021, 18, 4658. [Google Scholar] [CrossRef] [PubMed]
- Hu, X.; Sun, Y.; Liu, J.; Meng, J.; Wang, X.; Yang, H.; Tao, S. The impact of environmental protection tax on sectoral and spatial distribution of air pollution emissions in China—IOPscience. Environ. Res. Lett. 2019, 14, 054013. [Google Scholar] [CrossRef]
- Shen, L.; Fan, R.; Wang, Y.; Cheng, E. Invisible economy, performance assessment of local governments, and environmental regulation in China. Environ. Sci. Pollut. Res. Int. 2023, 1–18. [Google Scholar] [CrossRef] [PubMed]
- Zhang, T.; Zho, J.-Y.; Hussain, R.Y.; Wang, M.; Ren, K. Research on the cultivation of green competitiveness among chinese heavily polluting enterprises under country/district environmental regulations. Front. Environ. Sci. 2022, 10, 955744. [Google Scholar] [CrossRef]
- Feng, Y.; Wang, X.; Du, W.; Wu, H.; Wang, J. Effects of environmental regulation and FDI on urban innovation in China: A spatial Durbin econometric analysis. J. Clean. Prod. 2019, 235, 210–224. [Google Scholar] [CrossRef]
- Wang, H.; Zhang, R. Effects of environmental regulation on CO2 emissions: An empirical analysis of 282 cities in China. Sustain. Prod. Consum. 2022, 29, 259–272. [Google Scholar] [CrossRef]
- Bu, C.; Shi, D. The emission reduction effect of daily penalty policy on firms. J. Environ. Manag. 2021, 294, 112922. [Google Scholar] [CrossRef] [PubMed]
- Wang, Z.; Yu, L.; Zheng, M.; Xing, Y.; Liu, X.; Wang, Y.; Xiao, Z. One Fee, Two Reductions: The Double Abatement Effect of Pollutant Discharge Fees on Industrial Pollution and Carbon Emissions. Front. Environ. Sci. 2022, 10, 928434. [Google Scholar] [CrossRef]
- Ai, H.; Tan, X.; Liu, W.; Zhou, S.; Zhou, Y.; Xing, H. The impact of environmental regulation on carbon emissions: Evidence from China. Econ. Anal. Policy 2023, 80, 1067–1079. [Google Scholar] [CrossRef]
- Gao, X.; Liu, N.; Hua, Y. Environmental Protection Tax Law on the synergy of pollution reduction and carbon reduction in China: Evidence from a panel data of 107 cities. Sustain. Prod. Consum. 2022, 33, 425–437. [Google Scholar] [CrossRef]
- Liu, C.; Yang, D.; Sun, J.; Cheng, Y. The Impact of Environmental Regulations on Pollution and Carbon Reduction in the Yellow River Basin, China. Int. J. Environ. Res. Public Health 2023, 20, 1709. [Google Scholar] [CrossRef] [PubMed]
- Zhang, X.; Wu, N.; Wu, J.; Feng, Q.; Fu, Z. Review of the meaning, characterization and application of environmental regulation. J. Environ. Eng. Technol. 2021, 11, 1250–1257. [Google Scholar]
- Zhang, M.; Liu, X.; Ding, Y.; Wang, W. How does environmental regulation affect haze pollution governance?—An empirical test based on Chinese provincial panel data. Sci. Total Environ. 2019, 695, 133905. [Google Scholar] [CrossRef] [PubMed]
- Lin, B.; Zhang, A. Can government environmental regulation promote low-carbon development in heavy polluting industries? Evidence from China’s new environmental protection law. Environ. Impact Assess. Rev. 2023, 99, 106991. [Google Scholar] [CrossRef]
- Othman, N.; Yusop, Z.; Huay, C.S.; Azhar, N.A.Z.M. The Impact of The European Union’s Environmental Policy towards Competitiveness in Malaysia’s Palm Oil Industry. IOP Conf. Ser. Earth Environ. Sci. 2022, 1102, 12033. [Google Scholar] [CrossRef]
- Wu, J.; Wei, Y.D.; Li, Q.; Yuan, F. Economic transition and changing location of manufacturing industry in China: A study of the Yangtze River Delta. Sustainability 2018, 10, 2624. [Google Scholar] [CrossRef]
- Ginebreda, A.; Sabater-Liesa, L.; Rico, A.; Focks, A.; Barceló, D. Reconciling monitoring and modeling: An appraisal of river monitoring networks based on a spatial autocorrelation approach—Emerging pollutants in the Danube River as a case study. Sci. Total Environ. 2018, 618, 323–335. [Google Scholar] [CrossRef] [PubMed]
- Mondini, A.; Chiaravalloti-Neto, F. Spatial correlation of incidence of dengue with socioeconomic, demographic and environmental variables in a Brazilian city. Sci. Total Environ. 2008, 393, 241–248. [Google Scholar] [CrossRef]
- Kuersteiner, G.M. Invariance principles for dependent processes indexed by Besov classes with an application to a Hausman test for linearity (Article). J. Econom. 2019, 211, 243–261. [Google Scholar] [CrossRef]
- Pace, R.K.; LeSage, J.P. A spatial Hausman test. Econ. Lett. 2008, 101, 282–284. [Google Scholar] [CrossRef]
- Wen, Z.; Ye, B. Analyses of mediating effects: The development Analyses of mediating effects: The development of methods and models. Psychol. Sci. Res. 2014, 22, 731–745. [Google Scholar]
- Zhuang, R.; Mi, K.; Zhi, M.; Zhang, C. Digital Finance and Green Development: Characteristics, Mechanisms, and Empirical Evidence. Int. J. Environ. Res. Public Health 2022, 19, 16940. [Google Scholar] [CrossRef] [PubMed]
- Zhang, Q.; Tang, D.; Bethel, B.J. Impact of Urbanization on the Environmental Regulation Efficiency in the Yangtze River Basin Based on the Empirical Analysis of Spatial Econometrics. Int. J. Environ. Res. Public Health 2021, 18, 9105. [Google Scholar] [CrossRef] [PubMed]
- Dong, C.; Yang, Y. Construction of the Evaluation Index System of China’s Green Economy Development Level-Based on the Dual Model of Entropy Value Method and Coefficient of Variation Method. Int. J. New Dev. Eng. Soc. 2022, 6, 38–44. [Google Scholar]
Disclaimer/Publisher’s Note: The statements, opinions and data contained in all publications are solely those of the individual author(s) and contributor(s) and not of MDPI and/or the editor(s). MDPI and/or the editor(s) disclaim responsibility for any injury to people or property resulting from any ideas, methods, instructions or products referred to in the content. |
© 2024 by the authors. Licensee MDPI, Basel, Switzerland. This article is an open access article distributed under the terms and conditions of the Creative Commons Attribution (CC BY) license (https://creativecommons.org/licenses/by/4.0/).