
The Economic Spillover Effect of the Collaborative Agglomeration between Manufacturing and Producer Services


Abstract
:1. Introduction
2. Theoretical Analysis
3. Indicators and Data
3.1. Explanatory Variable
3.2. Core Explanatory Variable
3.3. Mediated Variable
3.4. Moderator Variable
3.5. Control Variables
4. Study Design
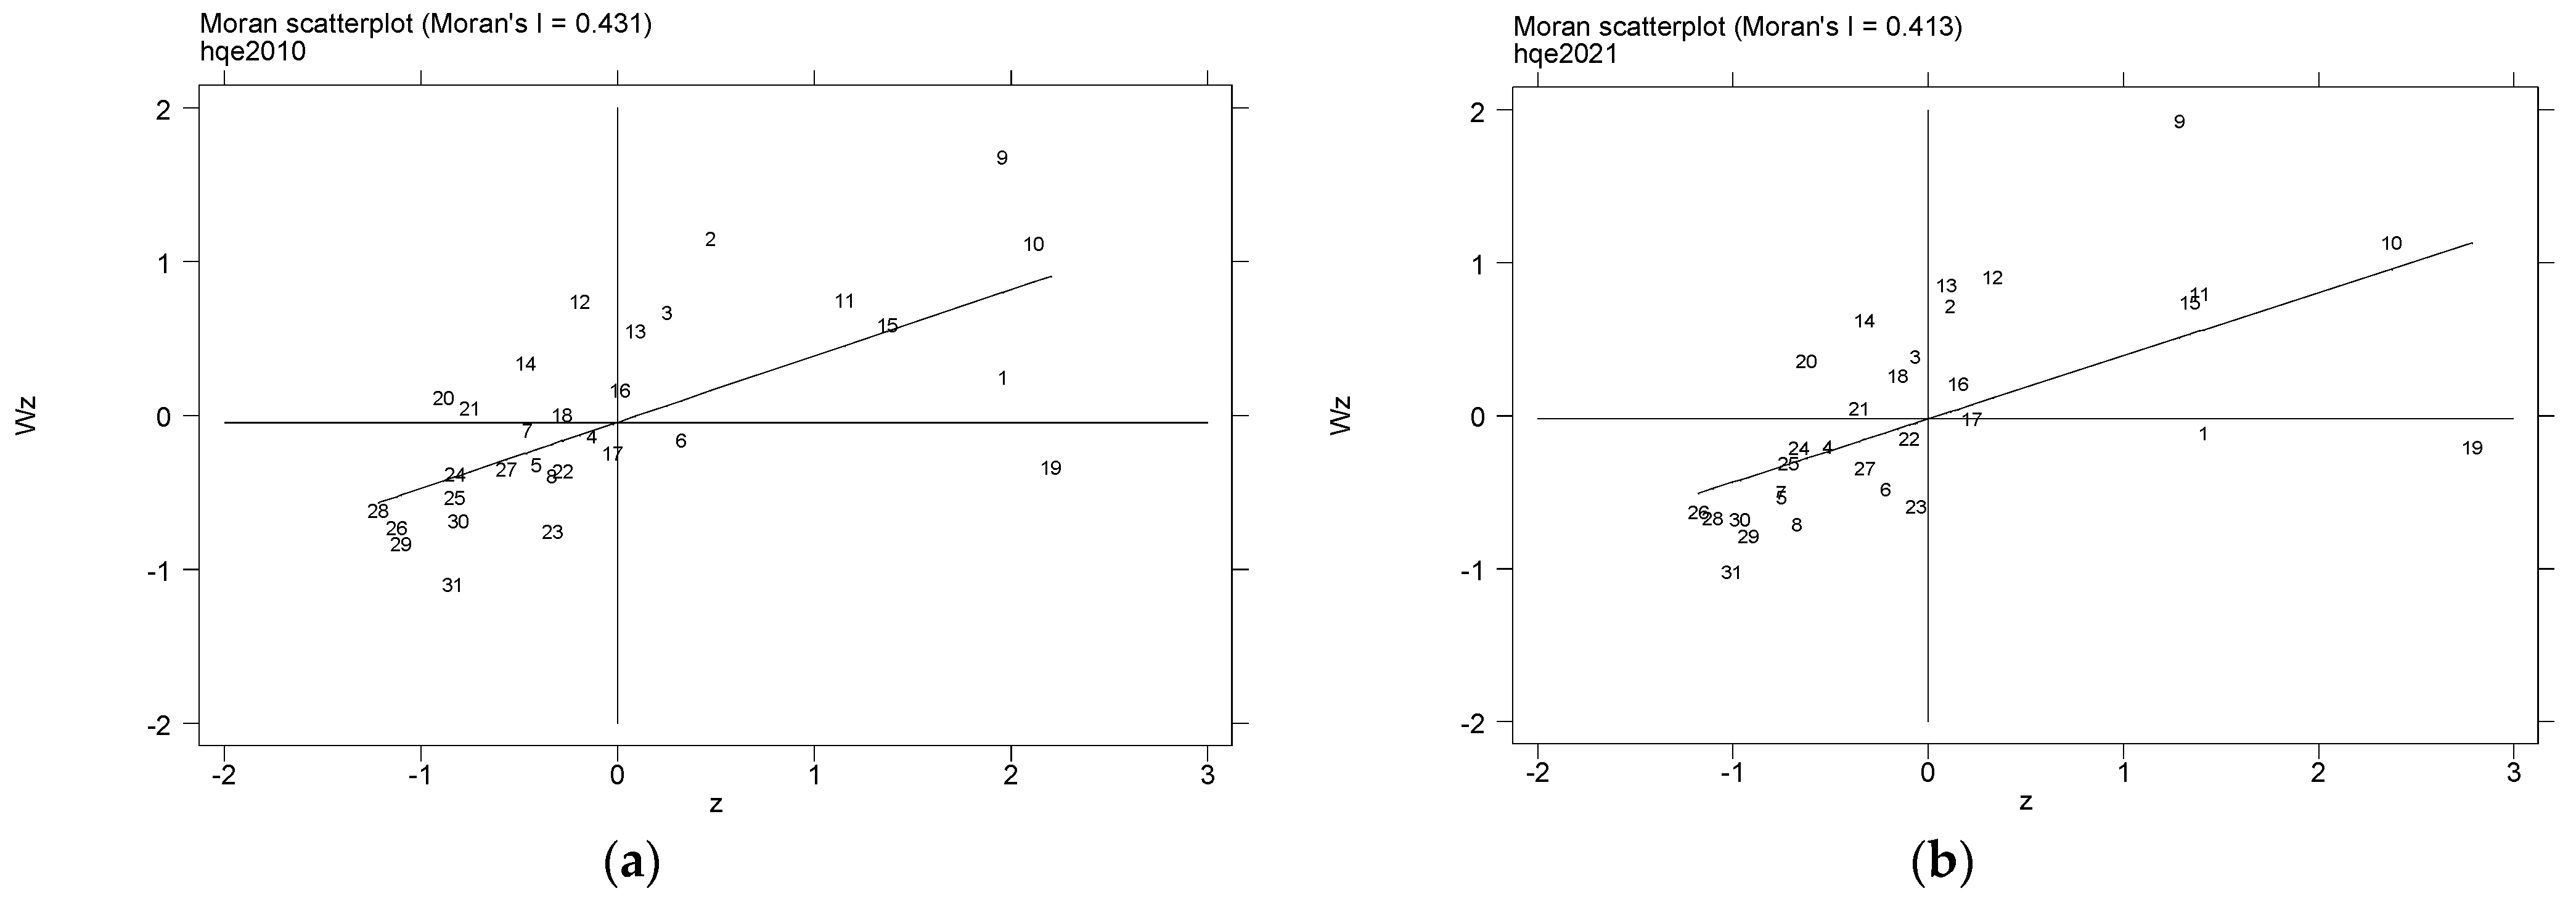
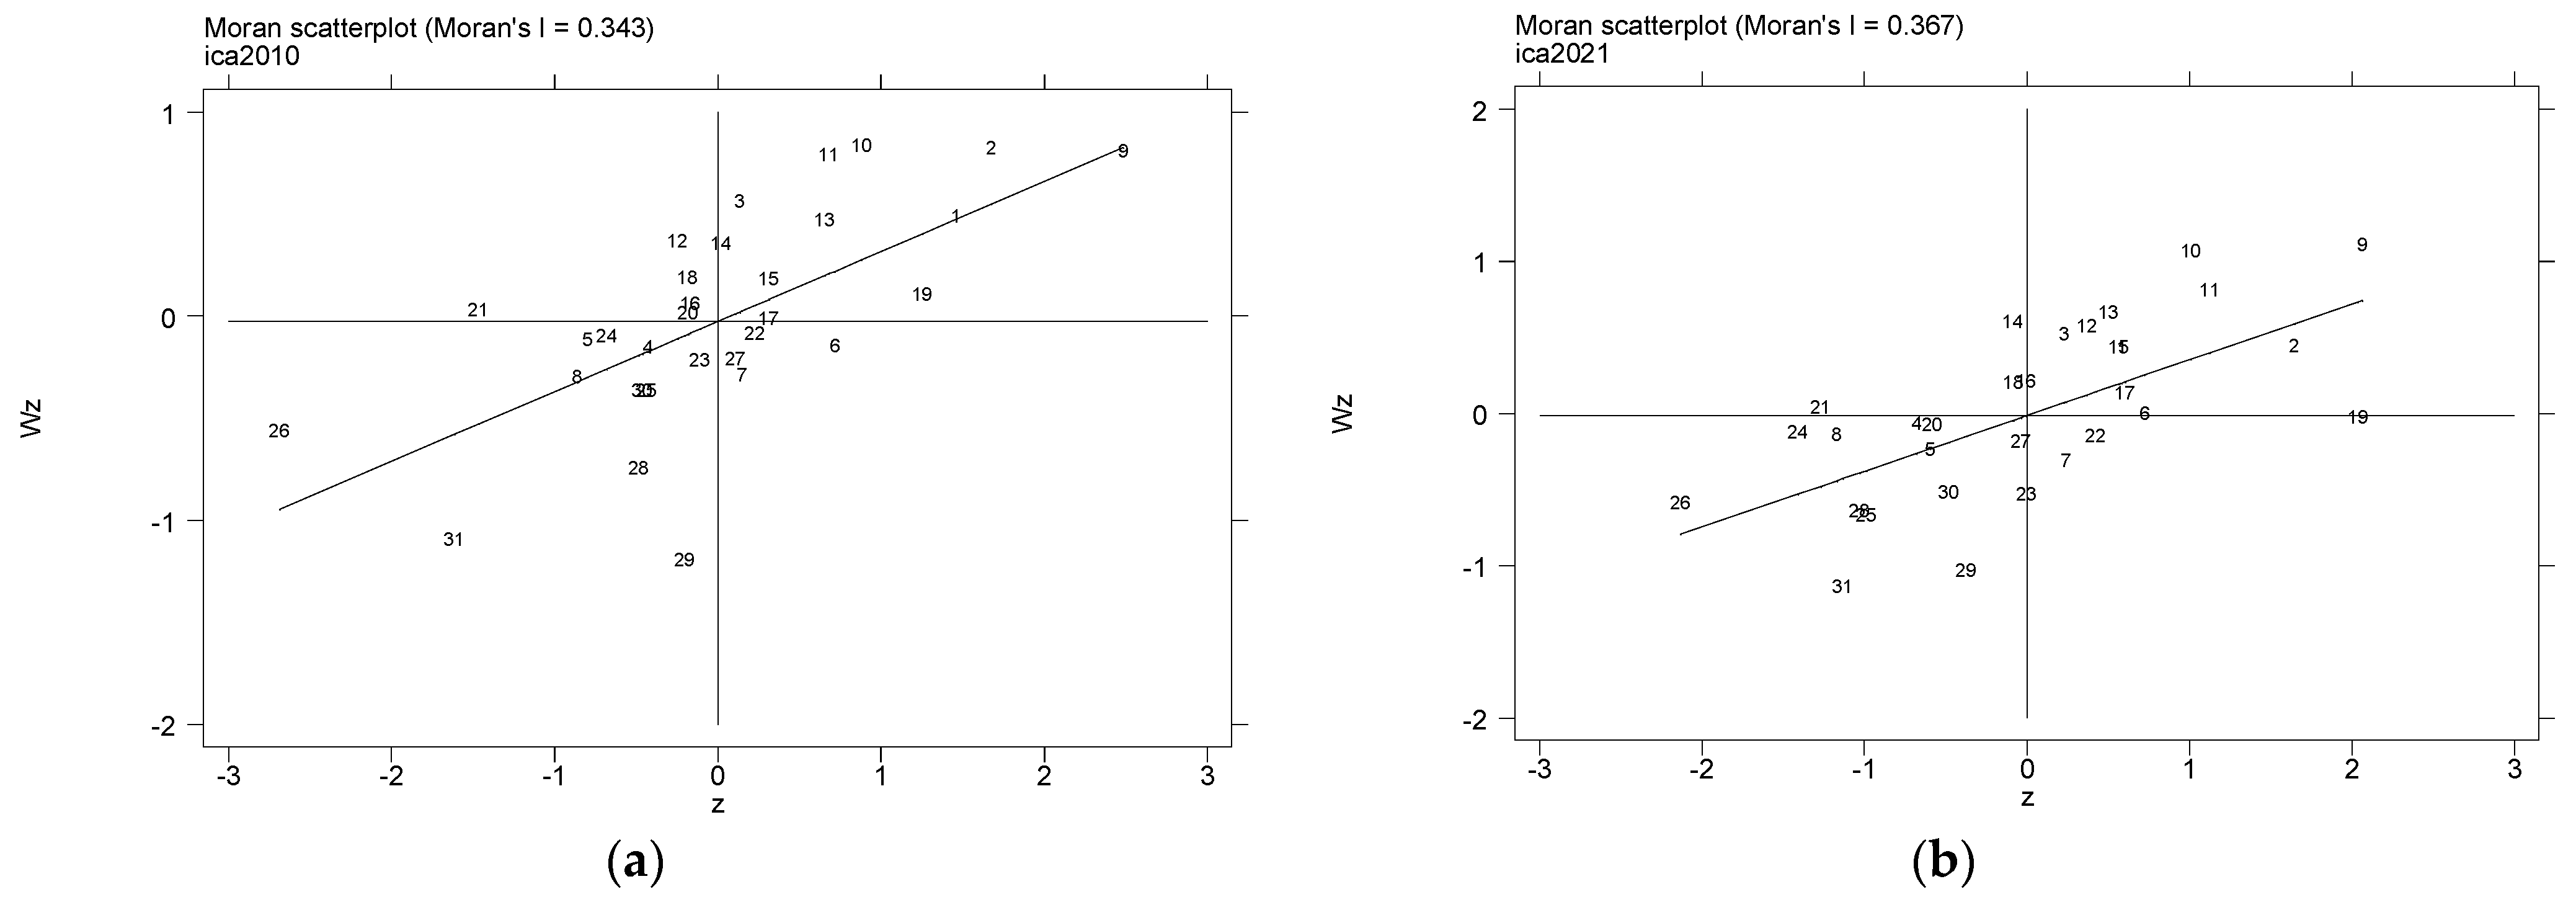
4.1. Spatial Correlation Test
4.2. Models
5. Empirical Analysis
5.1. Benchmark Results
5.2. Robustness Test
5.3. Spatial Heterogeneity Analysis
5.4. Mechanism Analysis
5.4.1. The Mediator Effect of Green Innovation
5.4.2. The Moderating Effect of the Digital Economy
6. Discussion
6.1. Academic Implications
6.2. Management Significance
6.3. Limitations
7. Conclusions
- (1)
- Similar to the conclusions of Peng, Elahi, and Fan (2022) and Yang et al. (2021), the collaborative agglomeration of manufacturing and producer services has an inverted U-shaped impact on high-quality economic development [3,12]. There is an obvious positive spillover effect. This conclusion validated hypothesis 1. Based on the overall samples, most regions in China are still on the left side of the inverted U-shaped influence structure. The collaborative agglomeration of manufacturing and producer services can significantly promote high-quality economic development.
- (2)
- In the impact effects of the co-agglomeration of manufacturing and producer services to promote high-quality development, some of them are realized by green innovation. Hypothesis 2 was validated. The mediating effect of green product innovation is the most important. About 75.58% of the impact effect is achieved through green product innovation. The second-strongest effect is green technological innovation, and the weakest mediating effect is green process innovation.
- (3)
- In the moderating effect test, the degree of regional digital economy plays a significant positive regulating role in promoting high-quality development. This conclusion validated hypothesis 3. With the continuous improvement of the digital economy, the role of industrial co-agglomeration in promoting high-quality development becomes more effective.
- (4)
- In the spatial heterogeneity analysis, it was found that high-quality development has a positive spatial spillover effect in each area. The spillover of positive externalities in promoting high-quality development by the industrial co-agglomeration is obvious in the eastern area, which confirms the existence of the trickle-down effect. In the central area, industrial co-agglomeration, human capital level, and financial development have a “siphon effect” on the high-quality development of neighboring regions. The co-agglomeration can effectively promote the high-quality economic growth of the central region. However, it plays a restraining role in neighboring regions. Compared with the above, industrial collaborative agglomeration impacts high-quality development within a U shape in the western area, and it inhibits the high-quality development at present. These results differ greatly from the conclusions of Chen et al. (2023) [45]. The main reason is that Chen et al. (2023) used the cooperation network and believed that the central and western regions were at the edge of the cooperation network, and therefore the role of industrial co-agglomeration in promoting high-quality development was weaker [45]. In this research, we studied the impact of industrial co-agglomeration on high-quality development from the perspective of the spatial spillover effect, and economic geography theories were introduced. This can not only reflect the increasing return to scale of industrial co-agglomeration but also discuss the decomposition effect of spatial spillover. More richer and meaningful conclusions were obtained.
Author Contributions
Funding
Institutional Review Board Statement
Informed Consent Statement
Data Availability Statement
Conflicts of Interest
References
- Hao, X.; Li, Y.; Ren, S.; Wu, H.; Hao, Y. The role of digitalization on green economic growth: Does industrial structure optimization and green innovation matter? J. Environ. Manag. 2023, 325, 116504. [Google Scholar] [CrossRef] [PubMed]
- Zhai, X.; An, Y. Analyzing influencing factors of green transformation in China’s manufacturing industry under environmental regulation: A structural equation model. J. Clean. Prod. 2020, 251, 119760. [Google Scholar] [CrossRef]
- Yang, H.; Zhang, F.; He, Y. Exploring the effect of producer services and manufacturing industrial co-agglomeration on the ecological environment pollution control in China. Environ. Dev. Sustain. 2021, 23, 16119–16144. [Google Scholar] [CrossRef]
- Ellison, G.; Glaeser, E.L. Geographic concentration in US manufacturing industries: A dartboard approach. J. Political Econ. 1997, 105, 889–927. [Google Scholar] [CrossRef]
- Howard, E.; Newman, C.; Tarp, F. Measuring industry coagglomeration and identifying the driving forces. J. Econ. Geogr. 2016, 16, 1055–1078. [Google Scholar] [CrossRef]
- Jacobs, W.; Koster, H.R.; van Oort, F. Co-agglomeration of knowledge-intensive business services and multinational enterprises. J. Econ. Geogr. 2014, 14, 443–475. [Google Scholar] [CrossRef]
- De Blasio, G.; Di Addario, S. Do workers benefit from industrial agglomeration? J. Reg. Sci. 2005, 45, 797–827. [Google Scholar] [CrossRef]
- Zheng, H.; He, Y. How does industrial co-agglomeration affect high-quality economic development? Evidence from Chengdu-Chongqing Economic Circle in China. J. Clean. Prod. 2022, 371, 133485. [Google Scholar] [CrossRef]
- Liu, Y.; He, Z. Synergistic Industrial Agglomeration, New Quality Productive Forces and High-quality Development of the Manufacturing Industry. Int. Rev. Econ. Financ. 2024, 94, 103373. [Google Scholar] [CrossRef]
- Zhang, W.; Cheng, J.; Liu, X.; Zhu, Z. Heterogeneous industrial agglomeration, its coordinated development and total factor energy efficiency. Environ. Dev. Sustain. 2023, 25, 5511–5537. [Google Scholar] [CrossRef]
- Yang, H.; Xu, X.; Zhang, F. Industrial co-agglomeration, green technological innovation, and total factor energy efficiency. Environ. Sci. Pollut. Res. 2022, 29, 62475–62494. [Google Scholar] [CrossRef] [PubMed]
- Peng, C.; Elahi, E.; Fan, B.; Li, Z. Effect of high-tech manufacturing co-agglomeration and producer service industry on regional innovation efficiency. Front. Environ. Sci. 2022, 10, 942057. [Google Scholar] [CrossRef]
- Zhou, Y. Human capital, institutional quality and industrial upgrading: Global insights from industrial data. Econ. Change Restruct. 2018, 51, 1–27. [Google Scholar] [CrossRef]
- Chang, K.; Zhang, H.; Li, B. The impact of digital economy and industrial agglomeration on the changes of industrial structure in the Yangtze River Delta. J. Knowl. Econ. 2023, 1–21. [Google Scholar] [CrossRef]
- Fan, W.; Wang, F.; Liu, S.; Chen, T.; Bai, X.; Zhang, Y. How does financial and manufacturing co-agglomeration affect environmental pollution? Evidence from China. J. Environ. Manag. 2023, 325, 116544. [Google Scholar] [CrossRef] [PubMed]
- Zhu, K.; Sun, W. Collaborative agglomeration level and spatial correlation of intercity manufacturing industry: An empirical study based on the cities of the Yangtze River Delta. PLoS ONE 2023, 18, e0293645. [Google Scholar] [CrossRef] [PubMed]
- Lu, P.; Liu, J.; Wang, Y.; Ruan, L. Can industrial agglomeration improve regional green total factor productivity in China? An empirical analysis based on spatial econometrics. Growth Change 2021, 52, 1011–1039. [Google Scholar] [CrossRef]
- Ye, C.; Zhu, J.; Li, S.; Yang, S.; Chen, M. Assessment and analysis of regional economic collaborative development within an urban agglomeration: Yangtze River Delta as a case study. Habitat Int. 2019, 83, 20–29. [Google Scholar] [CrossRef]
- Shen, Q.; Pan, Y.; Feng, Y. Identifying impacts of industrial co-agglomeration on carbon emissions: Evidence from China. Front. Public Health 2023, 11, 1154729. [Google Scholar] [CrossRef] [PubMed]
- Meng, X.N.; Xu, S.C. Can industrial collaborative agglomeration reduce carbon intensity? Empirical evidence based on Chinese provincial panel data. Environ. Sci. Pollut. Res. 2022, 29, 61012–61026. [Google Scholar] [CrossRef] [PubMed]
- Yuan, H.; Liu, J.; Li, X.; Zhong, S. The impact of industrial collaborative agglomeration on total factor carbon emission efficiency in China. Sci. Rep. 2023, 13, 12347. [Google Scholar] [CrossRef] [PubMed]
- Liu, B.; Luo, J.; Zheng, K.; Wu, F.; Zhao, X. How will industrial collaborative agglomeration affect the efficiency of regional green development? Front. Ecol. Evol. 2023, 11, 1179004. [Google Scholar] [CrossRef]
- Lin, S.; Chen, Z.; He, Z. Rapid transportation and green technology innovation in cities—From the view of the industrial collaborative agglomeration. Appl. Sci. 2021, 11, 8110. [Google Scholar] [CrossRef]
- Peng, H.; Shen, N.; Ying, H.; Wang, Q. Can environmental regulation directly promote green innovation behavior?—Based on situation of industrial agglomeration. J. Clean. Prod. 2021, 314, 128044. [Google Scholar] [CrossRef]
- He, W.; Li, Y.; Meng, X.; Song, M.; Ramsey, T.S.; An, M. Will green technological progress help industrial collaborative agglomeration increase regional carbon productivity: Evidence from Yangtze River Delta urban agglomerations. Environ. Dev. Sustain. 2023, 1–28. [Google Scholar] [CrossRef]
- Carlsson, B. The Digital Economy: What is new and what is not? Struct. Change Econ. Dyn. 2004, 15, 245–264. [Google Scholar] [CrossRef]
- Bin, H.; Yuanyuan, W. Network Infrastructure Construction, Industrial Co-agglomeration, and Urban Industrial Upgrading: Based on the Elements of “People” and “Land”. J. Financ. Econ. 2023, 49, 95–109. [Google Scholar]
- Li, X.; Wu, Q. The impact of digital economy on high-quality economic development: Research based on the consumption expansion. PLoS ONE 2023, 18, e0292925. [Google Scholar] [CrossRef] [PubMed]
- Vyas, V.; Jain, P. Role of digital economy and technology adoption for financial inclusion in India. Indian Growth Dev. Rev. 2021, 14, 302–324. [Google Scholar] [CrossRef]
- Liang, S.; Tan, Q. Can the digital economy accelerates China’s export technology upgrading? Based on the perspective of export technology complexity. Technol. Forecast. Soc. Change 2024, 199, 123052. [Google Scholar] [CrossRef]
- Bresnahan, T.F.; Brynjolfsson, E.; Hitt, L.M. Information technology, workplace organization, and the demand for skilled labor: Firm-level evidence. Q. J. Econ. 2002, 117, 339–376. [Google Scholar] [CrossRef]
- Chen, Y.; Zhu, M.; Lu, J.; Zhou, Q.; Ma, W. Evaluation of ecological city and analysis of obstacle factors under the background of high-quality development: Taking cities in the Yellow River Basin as examples. Ecol. Indic. 2020, 118, 106771. [Google Scholar] [CrossRef]
- Jia, H.; Zhang, W.; Pan, Y. Scientific and Technological Innovation, Industrial Structure Upgrading, and High-Quality Economic Development. China Econ. Transit. 2022, 5, 388–407. [Google Scholar]
- Zeng, W.; Li, L.; Huang, Y. Industrial collaborative agglomeration, marketization, and green innovation: Evidence from China’s provincial panel data. J. Clean. Prod. 2021, 279, 123598. [Google Scholar] [CrossRef]
- Liu, L. Green innovation, firm performance, and risk mitigation: Evidence from the USA. Environ. Dev. Sustain. 2023, 1–22. [Google Scholar] [CrossRef]
- Li, G.; Li, X.; Huo, L. Digital economy, spatial spillover and industrial green innovation efficiency: Empirical evidence from China. Heliyon 2023, 9, e12875. [Google Scholar] [CrossRef] [PubMed]
- Shahbaz, M.; Wang, J.; Dong, K.; Zhao, J. The impact of digital economy on energy transition across the globe: The mediating role of government governance. Renew. Sustain. Energy Rev. 2022, 166, 112620. [Google Scholar] [CrossRef]
- Fan, C.C.; Scott, A.J. Industrial agglomeration and development: A survey of spatial economic issues in East Asia and a statistical analysis of Chinese regions. Econ. Geogr. 2003, 79, 295–319. [Google Scholar] [CrossRef]
- Li, X.; Guo, Z.; Hu, Y.; Liu, X.; Wan, Y.; Luo, R.; Sun, Y.; Che, M. High-quality development of ultra-deep large gas fields in China: Challenges, strategies and proposals. Nat. Gas Ind. B 2020, 7, 505–513. [Google Scholar] [CrossRef]
- Zhao, H.; Cheng, Y.; Liu, Y. Can industrial co-agglomeration improve carbon emission efficiency? Empirical evidence based on the eastern coastal areas of China. Environ. Sci. Pollut. Res. 2024, 11, 1–20. [Google Scholar] [CrossRef] [PubMed]
- Lind, J.T.; Mehlum, H. With or without U? The appropriate test for a U-shaped relationship. Oxf. Bull. Econ. Stat. 2010, 72, 109–118. [Google Scholar] [CrossRef]
- Shen, N.; Peng, H. Can industrial agglomeration achieve the emission-reduction effect? Socio-Econ. Plan. Sci. 2021, 75, 100867. [Google Scholar] [CrossRef]
- Cheng, Z.; Hu, X. The effects of urbanization and urban sprawl on CO2 emissions in China. Environ. Dev. Sustain. 2023, 25, 1792–1808. [Google Scholar] [CrossRef]
- Chen, D.; Hu, W.; Li, Y.; Zhang, C.; Lu, X.; Cheng, H. Exploring the temporal and spatial effects of city size on regional economic integration: Evidence from the Yangtze River Economic Belt in China. Land Use Policy 2023, 132, 106770. [Google Scholar] [CrossRef]
- Chen, M.; Li, Q.; Zhang, B.; Xie, L.; Liu, J.; Geng, Y.; Liu, Z. The Spatial Correlation Network of China’s High-Quality Development and Its Driving Factors. Sustainability 2023, 15, 15738. [Google Scholar] [CrossRef]

| Dimensions | First Indicators | Secondary Indicators | Symbol |
|---|---|---|---|
| Innovation (0.3096) | Innovation Input (0.1569) | R&D Input | + |
| R&D Personnel Full-time Equivalent | + | ||
| Innovation Output (0.1527) | Number of Patents Granted Per Capita | + | |
| Technology Market Turnover | + | ||
| Coordination (0.1281) | Urban–rural Coordination (0.0747) | Level of Urbanization | + |
| Per Capita Disposable Income of Rural Residents/Per Capita Disposable Income of Urban Residents | + | ||
| Per Capita Consumption Expenditure of Rural Residents/Per Capita Consumption Expenditure of Urban Residents | + | ||
| Industrial Coordination (0.0280) | Industrial Upgrading Coefficient | + | |
| Economic Fluctuation (−0.0253) | CPI (Consumer Price Index) | − | |
| PPI (Producer Price Index) | − | ||
| Green (0.1984) | Energy Consumption (−0.0486) | Total Electricity Consumption | − |
| COD (Chemical Oxygen Demand) Emissions | − | ||
| Emissions of Major Pollutants in Waste Gas | − | ||
| Environmental Governance (0.0739) | Comprehensive Utilization of Industrial Solid Waste | + | |
| Harmless Treatment Rate of Household Garbage | + | ||
| Environmental Protection (0.0758) | Forest Cover | + | |
| Urban Green Space | + | ||
| Openness (0.1489) | Foreign Trade (0.0995) | Total Import and Export Volume | + |
| Foreign Direct Investment (0.0494) | FDI | + | |
| Sharing (0.2149) | Economic Sharing (0.0915) | Total Retail Sales of Consumer Goods | + |
| GDP Per Capita in a Region | + | ||
| Social Sharing (0.1235) | Number of Beds in Medical Institutions Per Capita | + | |
| Unit Road Mileage | + | ||
| Expenditure on Human Settlements Education | + | ||
| Registered Urban Unemployment Rate | − |
| First Indicators | Secondary Indicators | Symbol |
|---|---|---|
| Digital Foundation (0.122) | Number of Mobile Phone Base Stations | + |
| Internet Broadband Access Port | + | |
| Mobile Phone Penetration | + | |
| Digital Industry (0.4693) | Investment in Fixed Assets in Electronic Information Manufacturing | + |
| Software Product Revenue Scale | + | |
| Information Technology Services Revenue | + | |
| Volume of Telecommunication Service | + | |
| Digital Integration (0.1733) | Proportion of Enterprises Engaged in E-commerce Transactions | + |
| E-commerce Sales | + | |
| Digital Financial Inclusion Index | + | |
| Online Government Service Capability Index | + | |
| Digital Innovation (0.2354) | Number of Patent Applications Granted | + |
| Number of High School Students | + | |
| Number of R&D Projects of Industrial Enterprises Above the Designated Size | + |
| Variables | Means | Standard Deviation | Minimum | Maximum | Numbers of Observations |
|---|---|---|---|---|---|
| 0.4863 | 0.1052 | 0.2726 | 0.8682 | 372 | |
| 1.5323 | 0.2701 | 0.6221 | 2.3240 | 372 | |
| 3119.4 | 3116.2 | 1 | 13,856 | 372 | |
| 92.097 | 113.25 | 3 | 709.77 | 372 | |
| 4241.9 | 6187.8 | 4 | 46,147 | 372 | |
| 0.2639 | 0.1234 | 0.1067 | 0.9535 | 372 | |
| 13.648 | 7.8516 | 1.26 | 50.49 | 372 | |
| 2.0601 | 1.4957 | 0.3029 | 6.7569 | 372 | |
| 14.081 | 21.064 | 0.2497 | 151.76 | 372 | |
| 57.906 | 13.375 | 22.67 | 89.83 | 372 |
| Year | 2010 | 2011 | 2012 | 2013 | 2014 | 2015 | |
|---|---|---|---|---|---|---|---|
| 0.445 *** | 0.432 *** | 0.439 *** | 0.442 *** | 0.419 *** | 0.440 *** | ||
| 0.355 *** | 0.330 *** | 0.339 *** | 0.309 *** | 0.302 *** | 0.317 *** | ||
| Year | 2016 | 2017 | 2018 | 2019 | 2020 | 2021 | |
| 0.423 *** | 0.395 *** | 0.379 *** | 0.377 *** | 0.406 *** | 0.427 *** | ||
| 0.316 *** | 0.317 *** | 0.248 *** | 0.349 *** | 0.364 *** | 0.379 *** | ||
| Test Methods | Statistics | Statistical Values |
|---|---|---|
| Spatial Error Test | LM—Error | 403.792 *** |
| Robust LM—Error | 263.213 *** | |
| Spatial Lag Test | LM—Lag | 146.580 *** |
| Robust LM—Lag | 6.001 ** | |
| Hausman Test | Chi2 | 65.41 *** |
| LR Test—SAR | Chi2 | 46.26 *** |
| LR Test—SEM | Chi2 | 65.76 *** |
| Wald Test—SAR | Chi2 | 34.72 *** |
| Wald Test—SEM | Chi2 | 32.28 *** |
| Variables | Fix Effect Model | SDM Model | Effect Decomposition | ||
|---|---|---|---|---|---|
| Direct Effect | Indirect Effect | Total Effect | |||
| 0.1479 *** (2.75) | 0.1129 ** (2.67) | 0.1329 ** (2.82) | −0.6307 ** (2.70) | −0.4978 ** (−1.90) | |
| −0.0436 *** (−2.65) | −0.0322 *** (−3.53) | −0.0377 ** (2.66) | 0.1793 ** (−2.72) | 0.1416 ** (1.89) | |
| 0.0071 (0.15) | 0.0022 * (1.37) | 0.0024 * (1.41) | -0.0128 (-0.58) | −0.0105 (−0.44) | |
| 0.0251 *** (7.89) | 0.0304 *** (7.44) | 0.0337 *** (8.74) | 0.0935 *** (6.02) | 0.1272 *** (8.17) | |
| −0.0038 (−0.83) | −0.0081 (−1.39) | −0.0089 (−1.21) | −0.0275 (−1.38) | −0.0365 (−1.18) | |
| 0.0488 *** (3.11) | 0.0345 ** (2.60) | 0.0393 ** (1.94) | 0.1552 ** (2.13) | 0.1945 *** (2.76) | |
| Constant | 0.2794 *** (3.62) | ||||
| ρ | 0.2667 *** (3.08) | ||||
| Sigma2_e | 0.0002 *** (3.08) | ||||
| Individual/Time Fixed | YES | YES | |||
| 0.821 | 0.432 | ||||
| 1059.09 | |||||
| Obs | 372 | 372 | |||
| Variables | E-G Index | Adjacency Matrix | Economic Distance Matrix | |||
|---|---|---|---|---|---|---|
| Direct Effect | Indirect Effect | Direct Effect | Indirect Effect | Direct Effect | Indirect Effect | |
| 0.0878 *** (2.76) | −0.5802 ** (−1.93) | 0.1013 *** (4.21) | −0.5209 ** (−2.15) | 0.1101 ** (2.51) | −0.6081 *** (−3.23) | |
| −0.0252 ** (−2.17) | 0.0629 *** (5.06) | −0.0365 *** (−3.47) | 0.0512 *** (3.51) | −0.0618 ** (−2.37) | 0.0419 *** (4.34) | |
| Control Variables | YES | YES | YES | |||
| ρ | 0.2757 ** (3.25) | 0.5542 *** (12.01) | 0.4505 ** (4.70) | |||
| 0.0001 *** (13.53) | 0.0002 *** (13.37) | 0.0002 *** (13.60) | ||||
| 0.595 | 0.479 | 0.578 | ||||
| 1064.33 | 997.67 | 1019.66 | ||||
| Obs | 372 | 372 | 372 | |||
| Variables | Eastern | Central | Western | |||
|---|---|---|---|---|---|---|
| Direct Effect | Indirect Effect | Direct Effect | Indirect Effect | Direct Effect | Indirect Effect | |
| 0.2380 * (1.7) | 1.2901 ** (-6.55) | 0.7529 ** (2.36) | −1.3785 ** (−2.23) | −0.2289 *** (−3.20) | −1.2596 *** (−2.66) | |
| −0.0704 * (−1.81) | −0.3061 ** (−5.44) | −0.2210 ** (−2.34) | 0.3899 *** (4.15) | 0.0838 *** (3.16) | 0.4247 *** (2.66) | |
| 0.0548 *** (2.81) | 0.6217 *** (3.21) | 0.0052 (0.46) | −0.0323 ** (−2.22) | −0.0091 ** (1.97) | −0.4533 ** (−2.40) | |
| 0.0336 *** (4.40) | −0.1029 *** (−3.55) | 0.0429 *** (5.02) | 0.0608 *** (2.69) | 0.0266 *** (6.16) | 0.0641 *** (3.41) | |
| −0.0409 *** (−4.74) | 0.0208 * (1.83) | −0.0368 ** (−2.38) | −0.0469 ** (−1.88) | −0.0123 ** (−2.31) | −0.0821 ** (−3.96) | |
| 0.0398 *** (4.43) | 0.0485 (0.60) | 0.0209 (0.29) | −0.0264 (−0.27) | 0.0317 (1.03) | −0.3330 *** (−2.61) | |
| 0.2379 ** (2.40) | 0.4031 *** (4.50) | 0.3968 *** (−3.15) | ||||
| Sigma2_e | 0.0001 *** (8.06) | 0.0002 *** (6.71) | 0.0000 *** (8.59) | |||
| 0.731 | 0.661 | 0.638 | ||||
| 299.4201 | 279.6934 | 506.3519 | ||||
| Obs | 132 | 96 | 144 | |||
| Variables | Product Innovation | Process Innovation | Technology Innovation | ||||
|---|---|---|---|---|---|---|---|
(1) | (2) | (3) | (4) | (5) | (6) | (7) | |
| 0.1129 ** (2.67) | 9.9058 *** (15.18) | 0.0287 ** (1.90) | 1.5912 * (1.71) | 0.0881 * (2.15) | 1.5096 *** (10.14) | 0.0418 *** (5.29) | |
| −0.0322 *** (−3.53) | −3.4796 *** (−12.97) | −0.0401 ** (−1.92) | −0.6821 ** (2.38) | −0.0304 * (2.30) | −2.0344 *** (−8.16) | −0.3418 *** (−5.29) | |
| 0.0085 *** (2.90) | |||||||
| 0.0156 *** (2.61) | |||||||
| 0.0471 *** (12.09) | |||||||
| 0.0022 * (1.37) | −0.6501 *** (−3.73) | 0.0054 (0.92) | −0.1436 * (−1.78) | 0.0785 *** (5.46) | −0.4532 *** (−2.83) | 0.0619 *** (5.15) | |
| 0.0304 *** (7.44) | 0.8684 *** (9.05) | 0.0247 *** (5.78) | 0.2055 *** (3.62) | 0.0782 *** (9.51) | 0.9019 *** (10.19) | 0.0324 *** (4.33) | |
| −0.0081 (−1.39) | −0.0842 ** (−2.20) | −0.0109 ** (−1.88) | −0.1538 ** (−1.96) | −0.0261 *** (−8.47) | −0.4329 *** (−12.2) | −0.0063 ** (−2.01) | |
| 0.0345 ** (2.60) | 1.6692 *** (4.52) | 0.0435 *** (2.37) | 1.6836 *** (5.64) | 0.0431 (1.47) | 1.0085 *** (2.96) | 0.1107 *** (4.26) | |
| 0.2667 *** (3.08) | −0.1682 ** (−1.83) | 0.6067 *** (11.20) | 0.6933 *** (15.87) | 0.2749 *** (2.71) | −0.1574 ** (−1.69) | 0.0133 *** (4.13) | |
| Sigma2_e | 0.0002 *** (3.08) | 0.3782 *** (13.16) | 0.0002 *** (11.20) | 0.0352 *** (3.47) | 0.0023 *** (13.65) | 0.3233 *** (13.49) | 0.0002 *** (13.52) |
| Individual/Time Fixed | YES | YES | YES | YES | YES | YES | YES |
| 0.432 | 0.627 | 0.657 | 0.835 | 0.794 | 0.401 | 0.823 | |
| 1059.09 | −341.54 | 1039.34 | 934.19 | 600.91 | −316.57 | 1062.85 | |
| Obs | 372 | 372 | 372 | 372 | 372 | 372 | 372 |
| Variables | SDM | Effect Decomposition | ||
|---|---|---|---|---|
| Direct Effect | Indirect Effect | |||
| 0.1129 ** (2.67) | 0.1517 *** (3.37) | 0.1659 *** (3.45) | 0.5575 ** (2.31) | |
| −0.0322 *** (−3.53) | −0.0596 *** (−4.22) | −0.064 *** (−4.21) | −0.1778 *** (−2.64) | |
| 0.6471 *** (8.43) | 0.6734 *** (9.09) | 0.8553 *** (3.21) | ||
| 0.1821 *** (4.39) | 0.1935 *** (4.81) | 0.3723 ** (2.38) | ||
| Control Variables | YES | YES | ||
| 0.2667 *** (3.08) | 0.1964 *** (3.27) | |||
| Sigma2_e | 0.0002 *** (3.08) | 0.0001 *** (13.58) | ||
| Individual/Time Fixed | YES | YES | ||
| 0.432 | 0.807 | |||
| 1059.09 | 1219.14 | |||
| Obs | 372 | 372 | ||
Disclaimer/Publisher’s Note: The statements, opinions and data contained in all publications are solely those of the individual author(s) and contributor(s) and not of MDPI and/or the editor(s). MDPI and/or the editor(s) disclaim responsibility for any injury to people or property resulting from any ideas, methods, instructions or products referred to in the content. |
© 2024 by the authors. Licensee MDPI, Basel, Switzerland. This article is an open access article distributed under the terms and conditions of the Creative Commons Attribution (CC BY) license (https://creativecommons.org/licenses/by/4.0/).
Share and Cite
Li, X.; Liu, Y. The Economic Spillover Effect of the Collaborative Agglomeration between Manufacturing and Producer Services. Sustainability 2024, 16, 5343. https://doi.org/10.3390/su16135343
Li X, Liu Y. The Economic Spillover Effect of the Collaborative Agglomeration between Manufacturing and Producer Services. Sustainability. 2024; 16(13):5343. https://doi.org/10.3390/su16135343
Chicago/Turabian StyleLi, Xiaoxuan, and Ying Liu. 2024. "The Economic Spillover Effect of the Collaborative Agglomeration between Manufacturing and Producer Services" Sustainability 16, no. 13: 5343. https://doi.org/10.3390/su16135343
APA StyleLi, X., & Liu, Y. (2024). The Economic Spillover Effect of the Collaborative Agglomeration between Manufacturing and Producer Services. Sustainability, 16(13), 5343. https://doi.org/10.3390/su16135343