Abstract
This paper investigates the effect of E-government (EG) and COVID-19 on environmental sustainability (ES), considering the Load Capacity Curve (LCC) in the Chinese provinces, which employs the panel MMQR method. This study reveals that E-government initiatives positively impact environmental sustainability, with a 1% increase in E-government effectiveness leading to a rise in ES between 0.05% and 0.40%. Conversely, COVID-19 has a pronounced negative effect on sustainability, particularly at the medium quantiles. The results also report the non-LCC hypothesis in Chinese provinces. The Dumitrescu–Hurlin (DH) causality outcome indicates a bi-directional causal association between environmental sustainability and E-government practices and the unidirectional link from COVID-19 to environmental sustainability. These findings highlight the policy implication of the critical role of E-government in promoting environmental sustainability despite the challenges posed by economic and demographic factors.
1. Introduction
Environmental sustainability (ES) holds immense importance in China due to its significant global ecological impact, population and economic growth size, diverse ecosystems, and substantial natural resource (NR) consumption and production levels as the world’s most populous country with the largest consumers. It merits acknowledgment that China is the largest world supplier of mineral resources [1]. The nation is endowed with an extensive and diverse portfolio of NR reserves, revealing that they surpassed a staggering monetary value of USD 23 trillion between 1984 and 2016 [2].
E-government has the potential to significantly enhance environmental stewardship through data use, E-technologies, and online platforms [3]. The capacity of E-governance to gather an extensive array of satellite data and sensor systems spanning vast geographical regions facilitates a thorough comprehension of environmental conditions and resource utilization patterns [4]. Studying the effect of E-government on ecological sustainability in the context of Chinese provinces is particularly compelling due to China’s rapid technological advancement, which is the main feature of government governance transformation [5]. China’s provinces vary widely in terms of economic development, industrialization, and environmental conditions, providing a diverse landscape for examining the effect of E-government initiatives.
In provinces where E-government systems have been effectively implemented, there are notable improvements in efficiency and resource management. By reducing the reliance on physical documents and in-person interactions, these systems help conserve resources such as paper and fuel, directly contributing to environmental sustainability [6]. Additionally, E-government enhances transparency and accountability in environmental governance by making data and decision-making processes more accessible to the public. E-government also plays a crucial role in increasing public participation in environmental decision making. In many Chinese provinces, online platforms allow citizens to report environmental issues, participate in discussions, and contribute to policy development [7].
Moreover, the availability of comprehensive and accurate environmental data through E-government systems enables more informed and effective policy decisions. This data-driven approach allows provincial governments to address local environmental challenges better and monitor progress toward sustainability goals. Innovative technologies and practices promoted by E-government, such as smart city initiatives, enhance ecological sustainability by optimizing energy use, increasing energy efficiency, reducing emissions, and improving waste management [8]. Internationally, Chinese provinces can use E-government platforms to share best practices and collaborate on environmental issues, contributing to global sustainability efforts. Economically, promoting environmental sustainability through E-government can lead to cost savings, create green jobs, and attract investments in green technologies, fostering economic growth at the provincial level. The COVID-19 impact on the study of E-government and environmental sustainability in Chinese provinces is particularly significant. The pandemic has accelerated the adoption of digital technologies and highlighted the critical role of E-government in managing environmental sustainability during crises [9]. Firstly, the pandemic led to an increased reliance on digital platforms as lockdowns and social distancing measures made physical interactions difficult [10]. E-government systems became essential in maintaining administrative functions, allowing for continued governance without needing in-person contact. The pandemic also accelerated the adoption of innovative technologies and smart city initiatives as governments sought solutions to manage urban environments more effectively. These technologies, often facilitated by E-government platforms, contributed to optimizing energy use, reducing emissions, improving waste management, addressing environmental challenges, and contributing to a sustainable and resilient future [11].
Based on the context above, this study examines the impact of E-government on environmental sustainability across 30 Chinese provinces, with a particular focus on the effects of COVID-19. This study makes several key contributions. Firstly, it addresses the significant gap between theoretical models and the practical implementation of environmental sustainability policies, resulting from insufficient attention to evaluative aspects. Secondly, this research offers a comprehensive analysis during COVID-19, bridging gaps in prior studies within this field. While previous research has explored policies in multiple contexts relevant to environmental-based regions, such studies have been limited and sparse across Chinese provinces [12,13,14]. Thirdly, this study acknowledges the economic and geographical diversity of the sampled towns, which can influence digitalization, policy interventions, and environmental sustainability outcomes.
This research provides policy recommendations aimed at enhancing environmental sustainability. Integrating E-governance in environmental sustainability efforts aligns with several United Nations (UN) sustainable development goals (SDGs). Primarily, it improves transparency and promotes digital governance (SDG 16: Peace, Justice, and Strong Institutions). It also emphasizes sustainable management and responsible consumption of natural resources (SDG 12: Responsible Consumption and Production) and supports climate change action (SDG 13: Climate Action). Additionally, integrating E-government initiatives supports SDG 7 (Affordable and Clean Energy) by promoting efficient energy use and the transition to renewable energy sources through improved monitoring, data analysis, and policy enforcement. It also aligns with SDG 9 (Industry, Innovation, and Infrastructure) by fostering innovation, developing sustainable infrastructure, and supporting sustainable industrialization. It contributes to SDG 11 (Sustainable Cities and Communities) by enhancing urban planning, reducing pollution, and improving waste management systems. Furthermore, it supports SDG 14 (Life Below Water) by strengthening the management and protection of marine resources and ecosystems, reducing pollution and overfishing. Lastly, it aligns with SDG 15 (Life on Land) by supporting better land use management, deforestation control, and biodiversity protection through data-driven policies and increased public participation in environmental conservation efforts.
Recent studies have provided valuable perspectives on the significant relationship and impact of E-governance and environmental sustainability in different countries and regions. Lee [15] explores the link between E-government and ES, mainly focusing on Small Island Developing States (SIDS). The findings suggest that E-government positively influences environmental sustainability both directly and indirectly by enhancing government efficiency. It identified the importance of intermediary factors in assessing E-government effectiveness. Zioło et al. [8] analyze the association between the digitalization of E-government and the ESG factors in European countries alongside various socioeconomic and environmental variables from 2003 to 2020. The findings reveal statistically significant relationships between E-government and the ESG, indicating that digitalized administrative processes genuinely and positively impact ES. They confirm that investments in digital infrastructure and government have substantial long-term advantages, contributing to environmental, social, and economic sustainability.
Castro and Lopes [16] examined the link between E-government and ES, indicating that digital transformation can drive government changes by enhancing transparency, accountability, and efficiency. Using a logit model of 103 countries from 2003 to 2018, the study finds that E-government development positively influences an ES, as measured by adjusted net savings, which reflects economic, social, and environmental development. The results indicate that E-government is particularly beneficial for sustainability in developing and transitioning economies. Hashim [17] investigates the impact of E-government on smart cities in Saudi Arabia, focusing on the opportunities and challenges involved. The study recognizes the recent impact of information and communication technologies (ICT) on E-government. It examines the definitions of E-government and the technologies that support it, including smart cities, IoT, big data, cloud computing, and various digital government platforms.
Regardless of the China case, Vashkevich et al. [18] examined how elderly citizens in China engage with electronic governance (E-governance) platforms. They conducted an online survey distributed via WeChat in major cities, namely Beijing, Shanghai, Tianjin, and Changsha. Using Structural Equation Modeling (SEM), They identified the primary factors affecting subjective norms, including perceived ease of use, perceived usefulness, trust, supportive conditions, and previous exposure to technology. They also contribute to developing Social Sustainability Marketing Technologies in China, highlighting the need for actionable strategies to address the digital divide among older populations.
Li and Xu [19] investigate how digital government policies influence urban economic sustainable development through enterprise digital transformation. Using data from A-share listed companies from 2012 to 2022, the study finds that digital government policies significantly drive enterprise digital transformation, particularly in central and western cities, provincial capitals, and cities with lower economic development levels. The authors of [20] emphasized the critical role of digital infrastructure in addressing the resource curse in urban environments in the 242 Chinese prefectures. Likewise, the authors of [21] highlighted the potential of numerical infrastructure in improving the allocation of alternative resources.
Focusing on COVID-19, extensive studies have highlighted the effect of COVID-19 on environmental sustainability [22,23,24,25,26]. Ullah et al. [10] examined the role of E-governance in combating COVID-19, focusing on China and Pakistan. They analyzed the E-Government Development Index (EGDI) reports and highlighted the use of 5G and big data technologies during the pandemic. China’s EGDI ranking improved from 74 to 65, while Pakistan’s ranking declined from 137 to 148. The study suggests that Pakistan can learn from China’s E-governance model to enhance its sustainable development, especially in the context of the China–Pakistan Economic Corridor (CPEC). The authors conclude that CPEC collaboration can help combat COVID-19 and promote sustainable development in Pakistan.
Moreover, the study by Palos-Sa’nchez et al. [27] found that Digital Transformation (DT) processes significantly influenced the attitude of local governments (LGs) in Spain toward the COVID-19 pandemic. The research, based on data collected from 124 LGs through a questionnaire, revealed that the implementation of DT, along with factors such as the IT skills of workers, budgets, regulatory compliance, and the use of trust seals, played a crucial role in how LGs responded to the pandemic. The findings underscore the importance of IT infrastructure and security in the context of public health emergencies and sustainable development initiatives.
2. Materials and Methods
2.1. Data Specification
While sustainable development encompasses economic growth, social inclusion, and environmental protection, it is a broader concept that aims to meet the needs of the present without compromising the ability of future generations to meet their own needs [28]. On the other hand, ES focuses explicitly on the health, involving responsible interaction with the environment to avoid depletion or degradation of natural resources and enhance long-term environmental quality [29]. Based on this distinguished term, this research investigates the impact of E-government on ES in Chinese provinces. To achieve this goal, we conducted a thorough data collection from 2012 to 2021, a period recognized as crucial for the maturity of the digital government in the Chinese provincial administrations [30]. This timeframe also aligns with heightened Chinese government efforts to improve environmental health, exemplified by initiatives like the China Pilot Low Carbon City Program introduced in 2010 [31,32,33].
This study employs the technique proposed by Ahmad et al. [34] to evaluate NR extraction as a proxy for determining environmental sustainability across various provinces. The parameter used for quantification is the fixed investment in the mining sector, normalized as units per 100 million RMB. This approach reflects how efficiently and responsibly natural resources are managed, ensuring their consumption does not lead to depletion or significant environmental harm [35]. A higher investment ratio may imply a province’s economic model heavily relying on natural resource extraction. Consequently, areas with significant investment in their mining industries indicate the presence of valuable resources and indirectly reveal their policies for managing these resources [36]. The second primary variable consists of the dimension of the E-government index, drawing upon the analytical framework established by [35,37]. It utilizes a Principal Component Analysis (PCA) of indicators sourced from NIPAC to illuminate the progression of digital technology, with a particular emphasis on digital public services, representing the extent of internet access, the level of mobile technology use, and, notably, the advancements in digitizing government services.
This study considers the LCC context in which GDP2 represents the squared term of Gross Domestic Product (GDP). This term is included to capture the potential non-linear relationship between economic growth and environmental impact [38,39,40]. The inclusion of GDP2 allows for modeling a quadratic relationship, indicating that the impact of economic growth on the environment may vary at different levels of development. Typically, a positive coefficient for GDP and a negative coefficient for GDP2 suggest an inverted U-shaped curve. This means that at lower levels of GDP, economic growth might lead to higher environmental degradation, but further economic growth could improve ES beyond a certain point (the turning point).
The baseline methodology for this research is outlined as follows:
Environmental sustainability = (E-government, FDI, GDP, government intervention, R and D, Population, and Oil prices)
ψ1 to ψ7 are the coefficients. represents the error term. All data are converted to the logarithm. Table 1 shows the corresponding source and measures while Figure 1 shows the data trend.

Table 1.
Data definition.
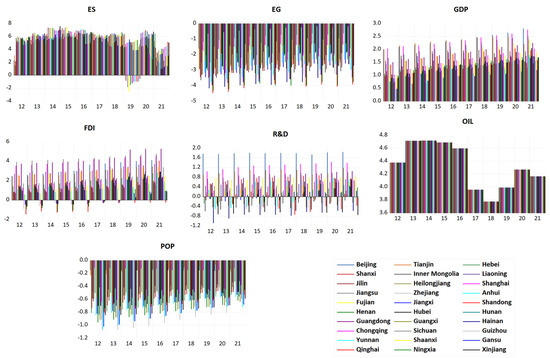
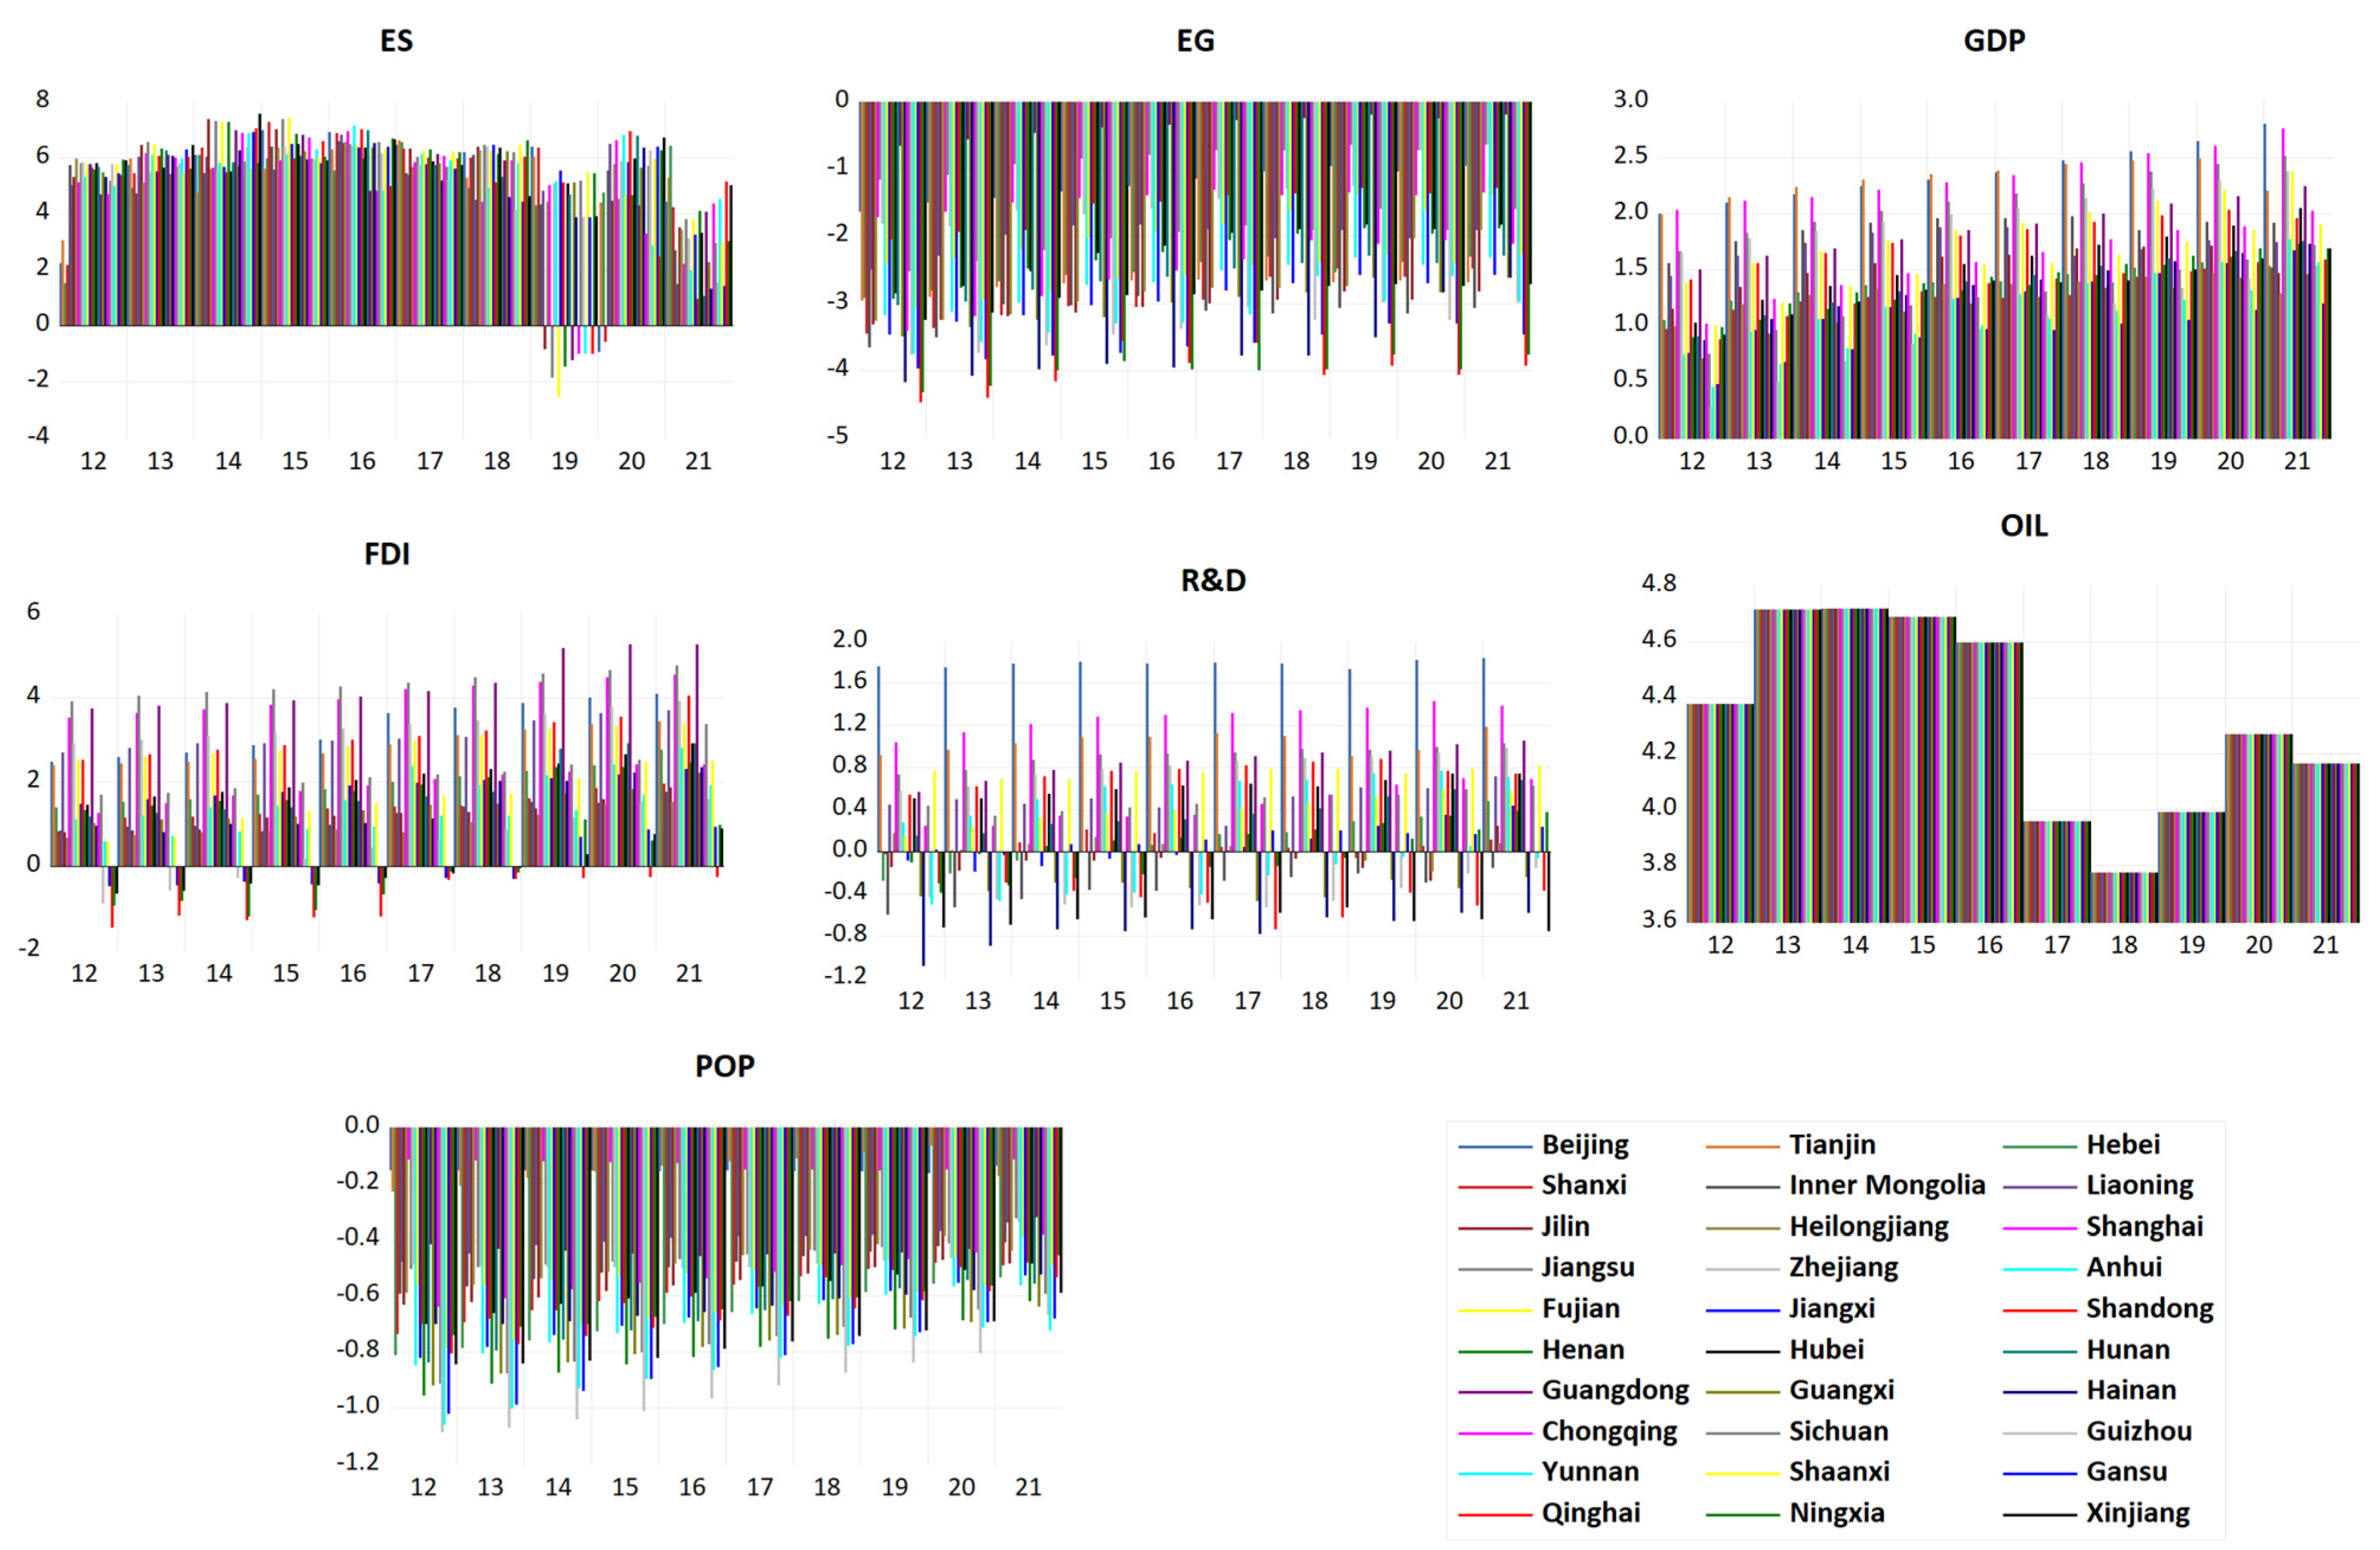
Figure 1.
Data trend.
2.2. The CSTD Test
The choice of appropriate tests becomes particularly relevant in settings with heterogeneous cross-sectional units (CSTD), where diverse economic conditions and behaviors may influence the data. By rigorously applying these tests, researchers can obtain more reliable insights and make informed decisions based on their panel data analyses. This test encompasses several statistical approaches, including those developed in [41,42,43]. Employing these tests is crucial for ensuring the accuracy. The system performs effectively over extended periods and in critical software development contexts. This assertion is supported by observing significant disparities among cities within a nation. The CSTD proposed by Pesaran [43] can be summarized in the following equation:
2.3. Heterogeneity Test
Accounting for slope heterogeneity in panel data studies is crucial due to varying slopes among panel units. Statistical tests developed by the authors of [44,45] are instrumental in addressing this issue. Based on a fixed-effects model, the Pesaran et al. [46] test assesses slope heterogeneity by examining the link between each individual’s slope. On the other hand, the test in [44] evaluates slope heterogeneity by comparing the homogeneous slope values, and it applies to both fixed.
By thoroughly addressing slope heterogeneity, researchers can ensure that variations among individual units are accurately captured, leading to more robust and reliable conclusions. This approach enhances the validity of panel data analyses and contributes to a deeper understanding of the studied phenomena. This research delves into the implications of the homogeneity panel data:
2.4. Unit Root Test (URT)
The unit root test (URT) is a crucial statistical test used to determine the presence of a unit root in the panel, indicating non-stationarity in the series. Indicating a unit root signifies that the variables do not revert to a mean or exhibit constant variance over time, assessing the stationarity’s essential and dynamic effect. Several statistical methods can be employed to conduct a URT, one of which is the (CIPS) test proposed in [47]. The CIPS statistic test is a comprehensive tool that effectively addresses serial correlation through a straightforward linearity regression. By augmenting the standard IPS test with cross-sectional averages of lagged levels and first differences of the individual series, the CIPS test enhances the ability to manage cross-sectional dependence, making it more robust in practical applications.
The asymptotic properties of the CIPS test are illustrated in Equation (4). Utilizing the CIPS test allows researchers to accurately determine the stationarity of time series data, providing a solid foundation for subsequent econometric analyses.
2.5. Co Integration Test
By utilizing the Westerlund test, researchers can effectively determine the presence of co-integration, ensuring that the analysis captures the long run dynamics among the non-stationary data. This is crucial for understanding the underlying economic or financial relationships and making reliable long-term predictions based on the co-integrated series. One prominent method is the one proposed in [48].
2.6. Dumitrescu and Hurlin Causality
The Dumitrescu and Hurlin [49] test is widely used for examining causality in panel data. This test extends the Granger causality concept to panel data, allowing for the analysis of causal relationships between variables across different cross-sectional units while accommodating heterogeneity. This makes it a valuable tool for researchers examining causal relationships in economics, finance, and social sciences. The Dumitrescu and Hurlin test evaluates the null hypothesis that no Granger causality exists from one variable to another across all panel units. This test allows for heterogeneity in the causal relationships by permitting individual-specific effects and varying lag lengths among the panel units.
2.7. MMQR Method
The MMQR is a statistical technique used to estimate quantile regression parameters by matching sample moments of the dependent variable with those predicted by the model [50]. Unlike traditional quantile regression, which minimizes a loss function, MMQR directly estimates the quantile parameters by equating the sample moments to the theoretical moments implied by the model [13,14].
In MMQR, the moments of the dependent variable are expressed as functions of the parameters of interest, and these equations are solved to obtain estimates of the quantile parameters. This approach is advantageous when the distributional assumptions of traditional quantile regression models are not met or when the conditional quantile function is not easily specified [51]. MMQR offers a flexible and computationally efficient alternative to traditional quantile regression methods, especially in cases where the underlying distribution of the data is poorly understood or when the quantile function is complex [52]. The conditional quantiles estimate Qy(τ|X) of the location-scale variant model is written in the following equation:
P(ci + ′γ > 0) = 1 determines the probability. (a, b′, c, d′) denote the coefficient to be calculated. (ai, ci), i = 1, 2, 3,…,n, address the fixed effect i of each data variable. Z corresponds to a k-vector of operators in X, which signifies conversions that are differentiable by a factor of l.
3. Results
3.1. Summarize Statistics
Table 2 shows the descriptive statistics for the variables ES, EG, GDP, OIL, FDI, POP, and R and D in the dataset reveal several key insights. The ES variable has a mean of 5.29 and a median of 5.79, with a high standard deviation of 1.72, indicating considerable variability and a negatively skewed distribution with significant kurtosis, as confirmed by the JB test (p < 0.001).
Table 2.
Descriptive statistic.
For EG, the mean is −2.50, and the median is −2.63, with moderate variability ES of 0.93 and a slightly positive skew, suggesting minor deviation from normality (JB = 0.015).
GDP shows a mean of 1.55 and a median of 1.51, with low variability (about 0.46) and a distribution close to normal (JB = 0.25). The OIL variable, with a mean and median around 4.32, has low variability (ES of 0.33) but a significant distribution, indicated by a low kurtosis value and a strong rejection of normality (JB < 0.001).
FDI exhibits a mean of 1.90 and a median of 1.77, with moderate variability (ES of 1.38) and a symmetric, showing no significant deviation from normality (JB = 0.62). The POP variable has a mean of −0.58 and a median of −0.59, with low variability (ES of 0.21), slightly positive skewness, and a near-normal kurtosis. However, it shows a minor deviation from normality (JB p = 0.037). Lastly, the R and D variable, with a mean of 0.29 and a median of 0.27, displays a moderate variability of about 0.60. Overall, all annual data do not follow a normal distribution. The results from the JB test statistics indicate that utilizing quantile-based frameworks represents the optimal strategy for addressing non-linearity within data series. This approach enables the effective utilization of quantile models to fulfill the intended objectives.
3.2. Correlations Results
Table 3 presents the pairwise correlation coefficients of sustainability development with EG, GDP, OIL, FDI, POP, and the R_D, respectively. ES demonstrates a weak negative correlation with EG (−0.1032) and a slightly stronger negative correlation with GDP (−0.1746), indicating a tendency to decrease as economic growth and GDP increase. On the other hand, ES shows a moderate positive correlation with OIL (0.3176), suggesting a tendency to increase with higher oil production. The correlations with FDI (−0.1556), POP (−0.1367), and R_D (−0.0551) are also negative but relatively weak, indicating a slight tendency to decrease with higher levels of foreign direct investment, population, and research and development expenditures, respectively.
Table 3.
Ccorrelation results.
3.3. CSTD Result
Before discussing the MMQR results, we conducted the CSTD test to detect any interrelationships among the chosen variables across provinces. This test evaluates whether CSTD exists among the entities under investigation, with the null hypothesis (H0) suggesting no such dependence and the alternative hypothesis (H1) indicating the presence of CSD across Chinese provinces. The results in Table 3 decisively reject the null hypothesis, indicating an absence of CSD in the residuals. This finding underscores the significance of the CSD issue, particularly considering the increasing interdependence among the Chinese provinces. Furthermore, the results in Table 4 suggest that the CSTD problem is present among the panel of 30 Chinese provinces.
Table 4.
CD findings.
Table 5 displays the results of the unit root test (URT) conducted on the selected data series. To address the potential issue of CSTD, we applied for a stationarity test. Specifically, we utilized the CIPS and Bai and Ng tests, which suggest that all panel data are integrated into order one, denoted as I(1), after taking the first difference.
Table 5.
URT tests.
Having established the stationarity of our chosen data series, we conducted a co-integration analysis as the subsequent step. We utilized the test in [48] to uncover enduring co-movements among variables over the long term. The detailed findings of the co-integration test are presented in Table 6. Our analysis reveals a persistent long-term co-movement between ES and EG, GD, FDI, OIL, R and D, COVID-19, and oil prices.
Table 6.
Westrulnd cointegration.
3.4. MMQR Results
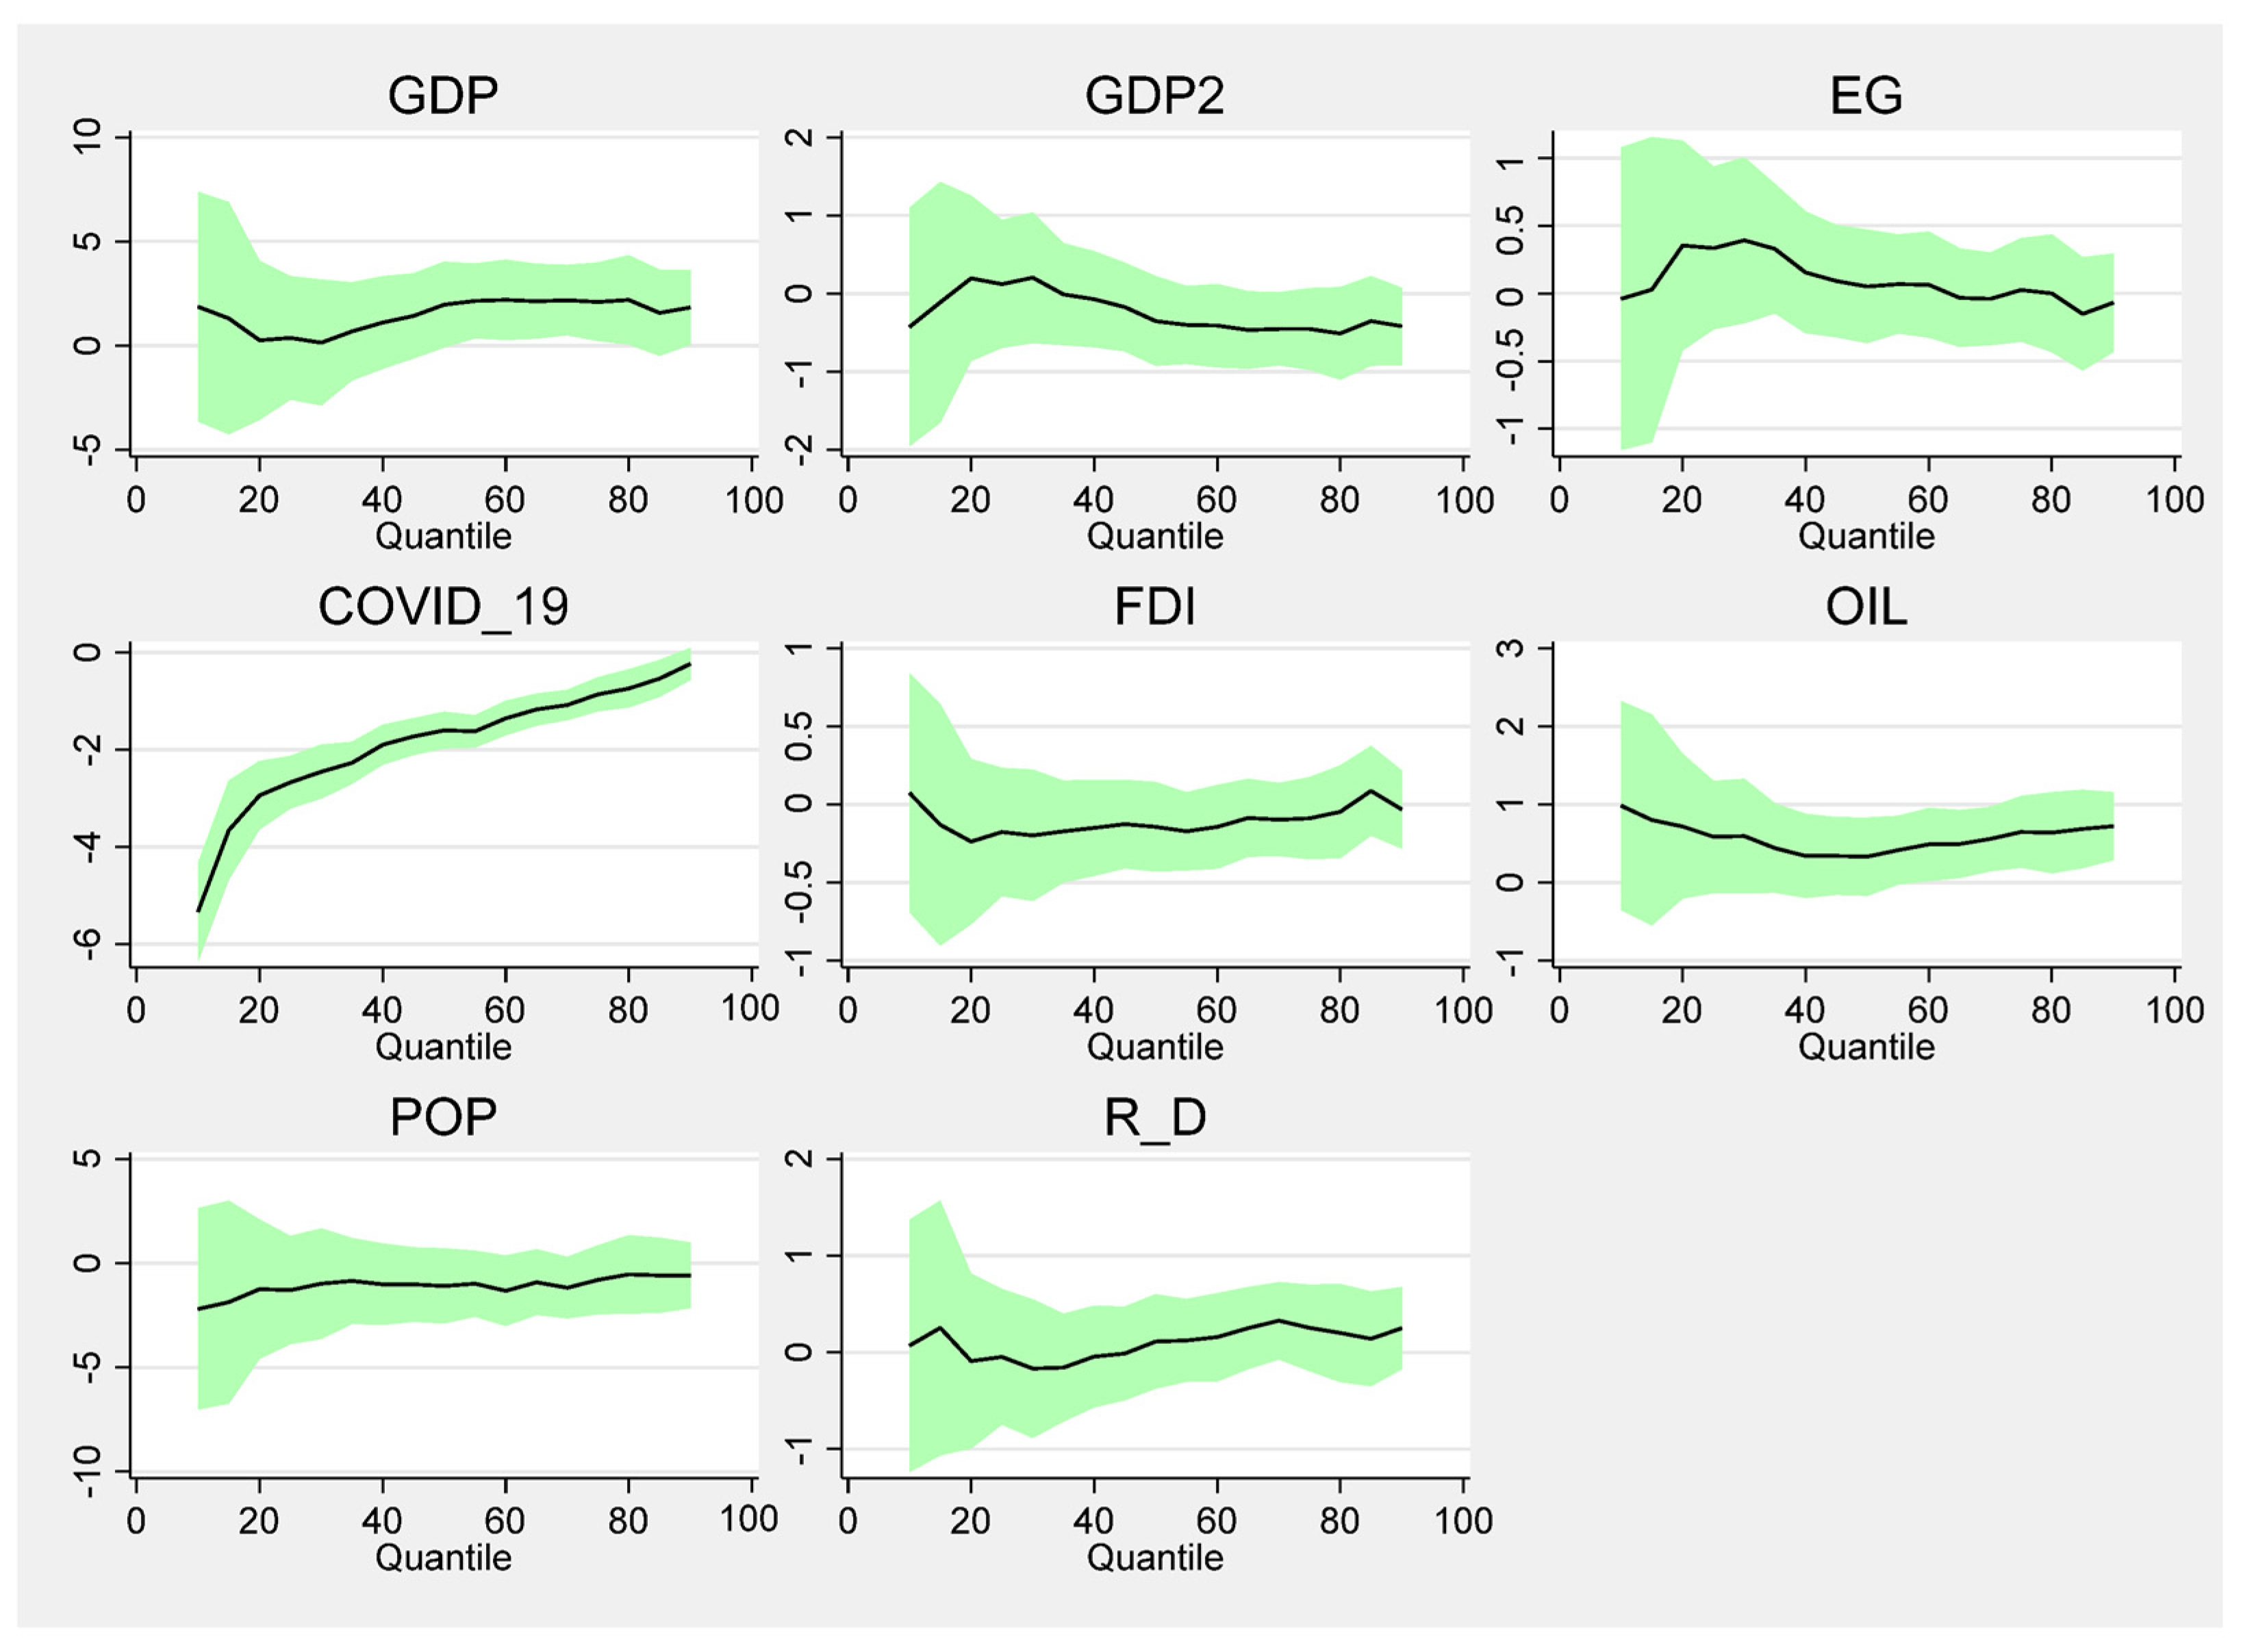
The results of the co-integration test affirm that we can advance with our estimation across 6 quantile levels (5th, 20th, 40th, 60th, 80th, and 95th). The outcomes of the MMQR method are illustrated in Figure 2. Our result indicates that a 1% increase in the E-government effect is positive and statistically significant on sustainability development (ES), resulting in a rise of 0.05% to 0.40% in ES at the 5th to 40th percentiles, respectively. However, this impact diminishes in the median and upper quantiles. Integrating E-governmental practices, facilitated by satellite imaging and Internet of Things (IoT) devices, has significantly enhanced the monitoring and management of ES initiatives. This technological advancement has enabled prompt responses to climate and environmental changes and more effective enforcement of policy regulations. As a result, the Chinese provincial strategy for tackling environmental sustainability challenges has become more flexible while requiring fewer resources to implement effectively; incorporating digital technology into ES has fostered a more profound response. This has facilitated the implementation of more informed and strategic policies by Chinese provinces, considering regional ecological demands and sustainability objectives [53]. In these areas, human activities were the primary factor in the spread of COVID-19, making physical isolation through digital administration the most effective measure for controlling the outbreak despite existing waste management issues. These findings are consistent with previous studies in different nations [10,18,30,35]. Conversely, it can be observed that COVID-19 exhibits a more pronounced deleterious influence across quantiles. The effect is less substantial in the upper quantiles than in the median and lower quantiles. This indicates that the pandemic’s negative impact is greater for regions with a median level of sustainability, in which less extreme weather events indirectly affect epidemic intensity than decreased biomedical waste [54]. In the upper quantile, lockdowns, characterized by restricted movement and workplace shutdowns, resulted in reduced transportation and lower use of natural resources like oil and coal rather than increased environmental quality. The results indicate that the impact of FDI ES diminishes. In less developed provinces, which typically fall into the lower quantiles of ES, the influx of FDI often leads to increased industrial activity and higher consumption of natural resources. This surge in economic activity, driven by foreign investments, tends to exacerbate environmental degradation due to insufficient regulatory frameworks and a lack of advanced environmental technologies. As a result, these regions experience significant declines in ES as they struggle to balance economic growth with environmental protection. For instance, in the western provinces of China, where economic development is a priority, FDI tends to focus on resource-intensive industries. These regions’ lack of stringent environmental regulations means increased industrial activity directly translates to higher pollution levels and greater environmental damage. This finding is consistent with the prior studies [27].
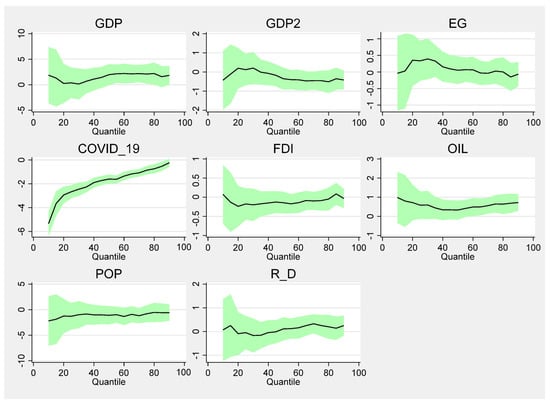
Figure 2.
MMQR results.
The impact of GDP growth on ES demonstrates a correlation between a 1% increase in GDP and an augmentation in ES in the lower quantile. The upper quantiles exercise had a significant positive impact, with a rise of 0.4% compared to 0.05% in the 40th quantile. On the contrary, the GDP squared effect negatively impacts ES under all quantiles except the 30th. This study investigated the factors impacting ES and found that higher GDP has a positive effect, whereas GDP2 has a negative effect in the long term. These findings are consistent with those of [40], which report the non-LCC in China [55].
Furthermore, the results indicate that a 1% increase in R and D has a very modest effect on managing ES, ranging from 0.03% at the lower quantiles to 0.9% at the upper quantiles. This implies that although the significant advantages of increased R and D in ES might be challenging to discern reliably, there are still modest benefits [56,57]. It is also important to show statistical significance; ES maintains a positive trend (ranging between 0.5% in the medium and 1% across lower and upper quantiles), while the population variable significantly negatively affects ES across different quantiles. These results align with the previous studies [58,59,60].
3.5. QR Finding
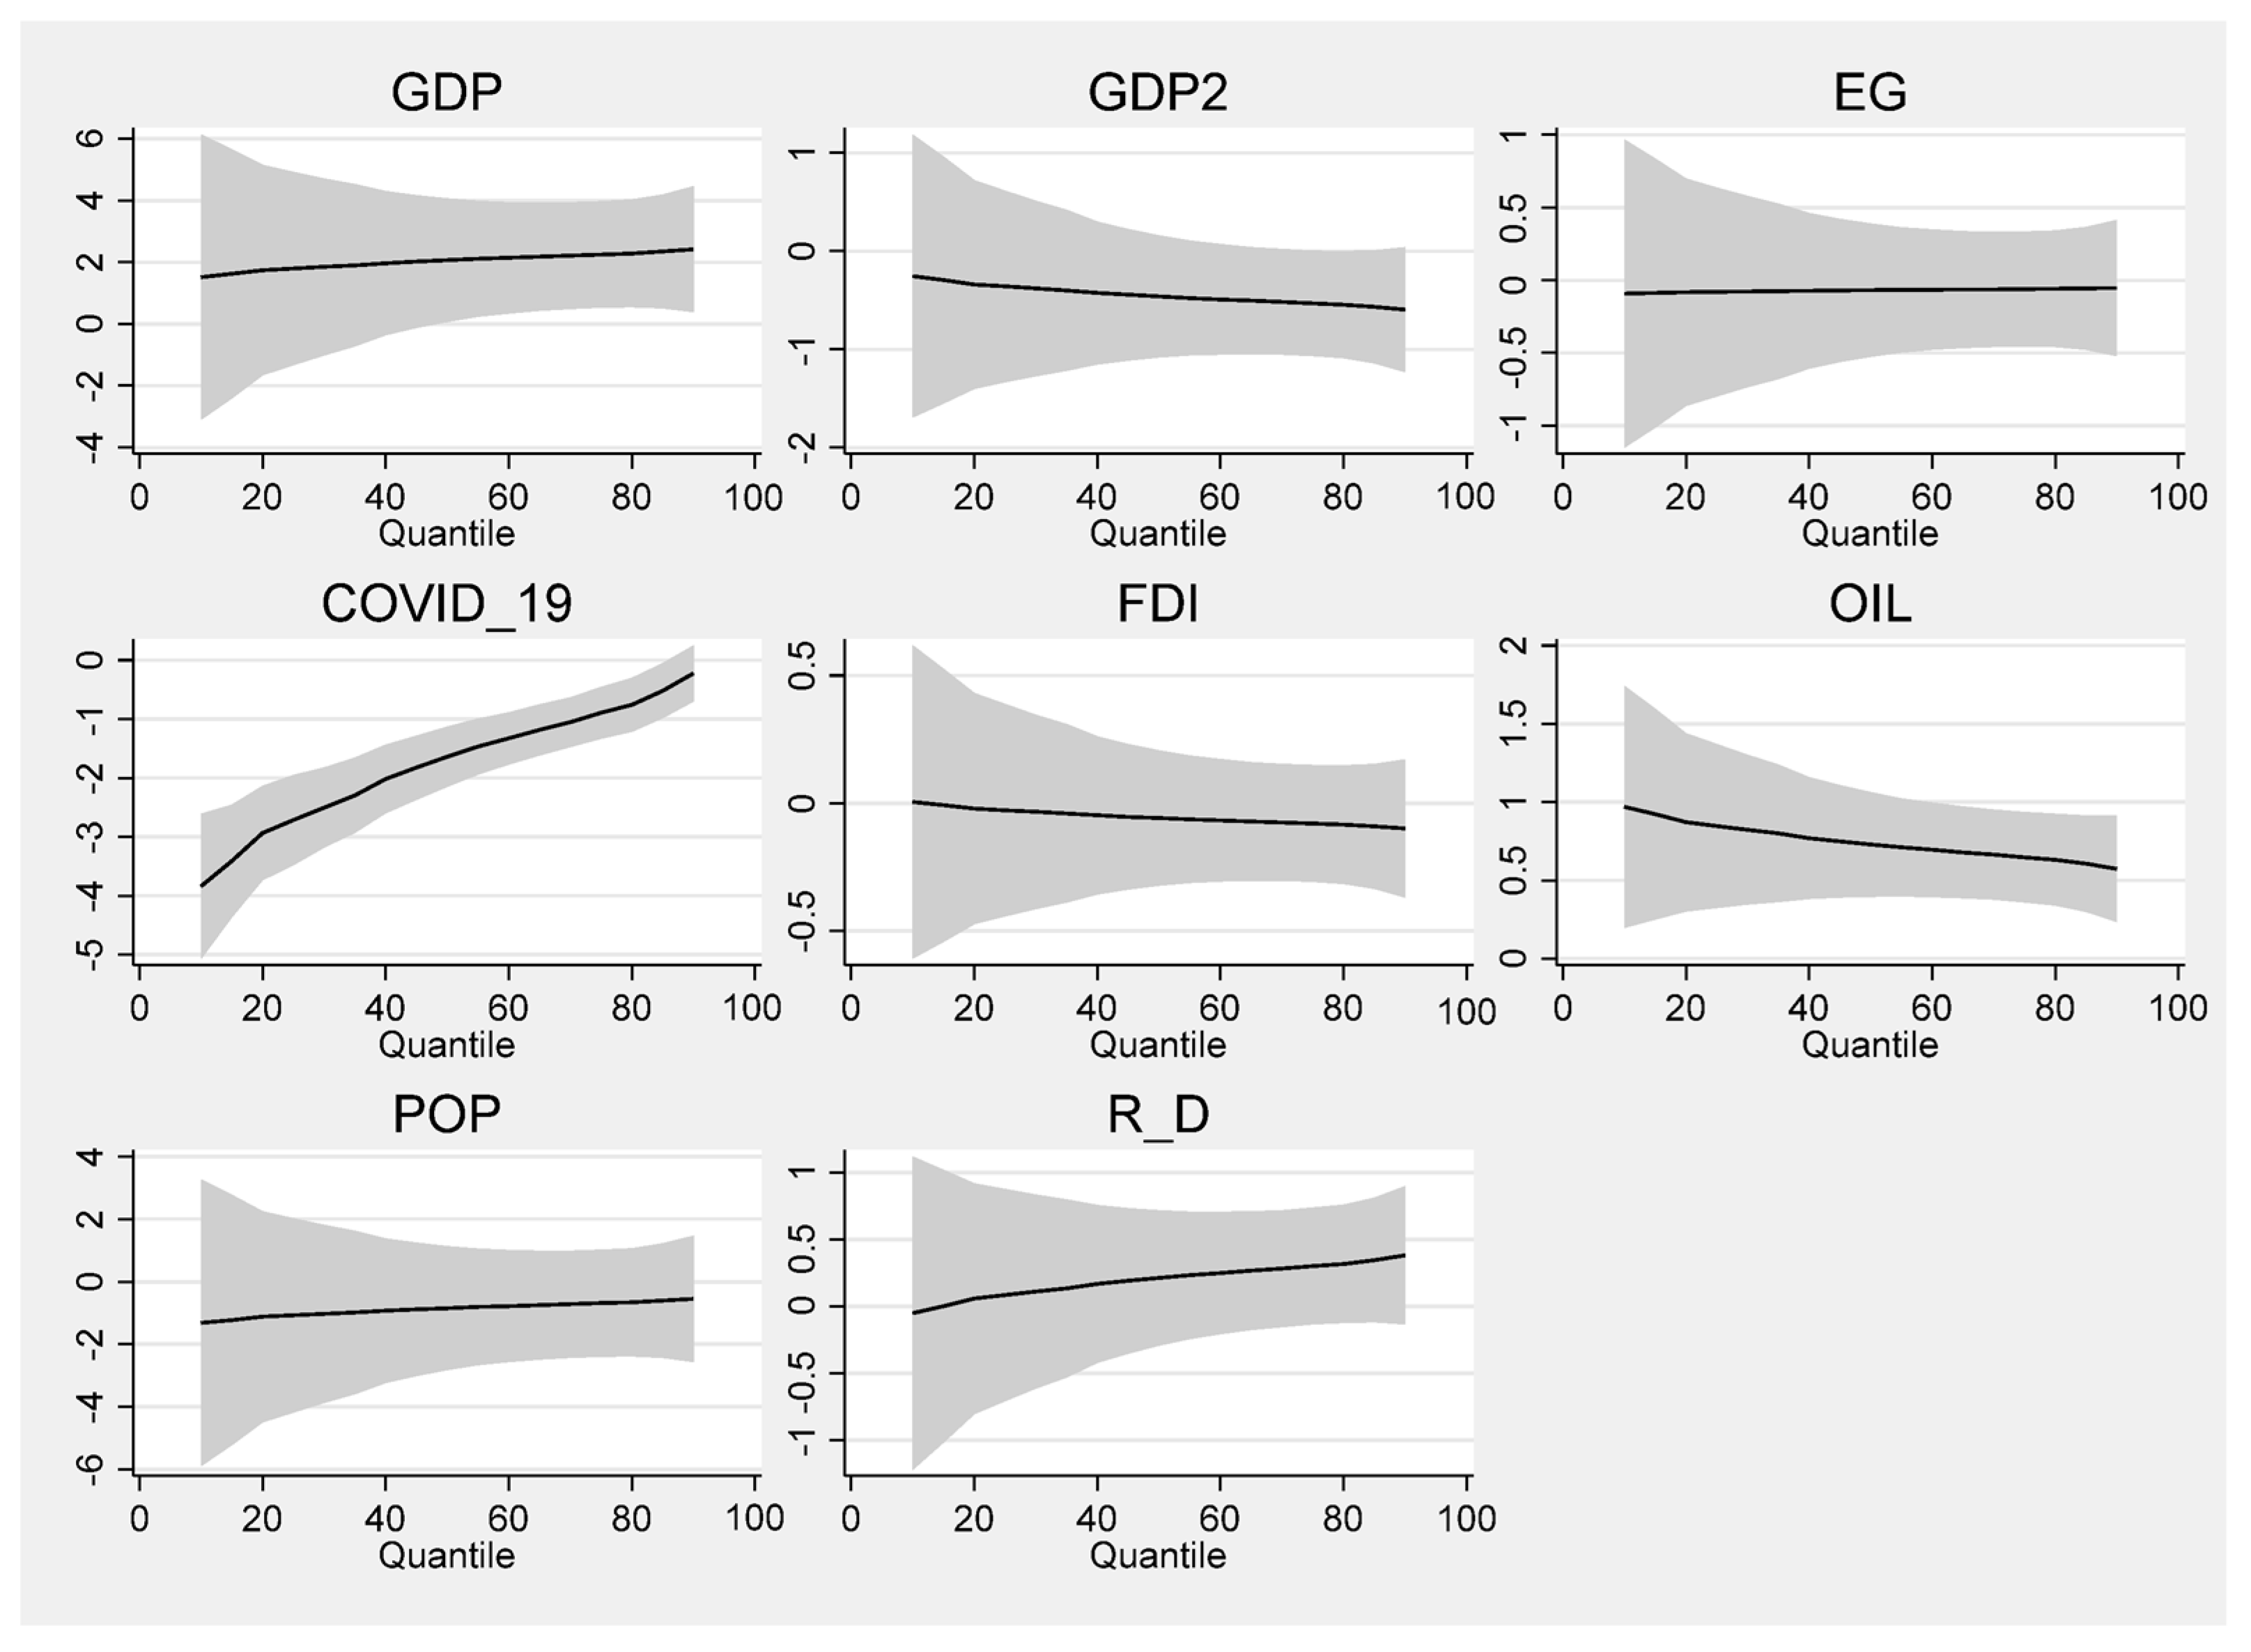
To make the MMQR results presented in Figure 2 more robust, the QR outcome is illustrated in Figure 3. The results provide the empirical report for the substantial effect of GDP and the limited effect of EG, R and D, OIL, and FDI while noting the negative impact of COVID-19 and population POP. The conclusions derived from the quantile regression (QR) proffer corroborating evidence regarding the influence of these explanatory variables, lending credence to the MMQR methods.
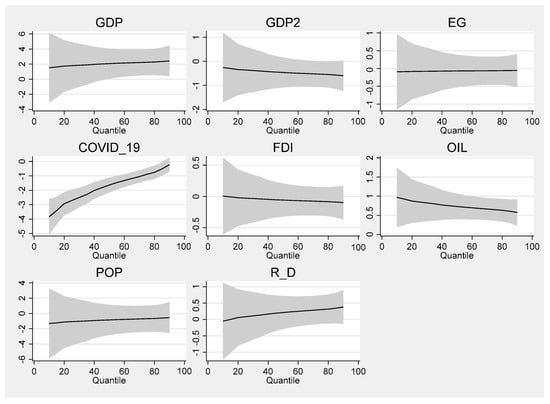
Figure 3.
QR Results.
3.6. The DH Causality Results
After completing the MMQR and QR techniques, the research used the causality test proposed [49], as presented in Table 7. It was utilized to determine the direction of causality associated with environmental sustainability and explanatory variables, including E-government. The findings indicate a bi-directional causal association between environmental sustainability (ES) and E-government practices. Conversely, there is an absence of a causal link between GDP and ES. The causality results also indicate the bi-directionality link from ES concerning oil, FDI, and POP.
Table 7.
Causality results.
4. Conclusions
This research investigated how E-governance and COVID-19 affected sustainable development in 30 Chinese provinces from 2012 to 2021, considering the GDP, FDI, R and D, urbanization, and oil prices using MMQR. The findings demonstrate that a 1% increase in E-government significantly boosts environmental sustainability (ES) by 0.05% to 0.40% in the 5th to 40th percentiles, though this effect diminishes at higher quantiles.
COVID-19 negatively affects ES across all quantiles, while the impact of Foreign Direct Investment (FDI) on ES diminishes over time. GDP growth positively correlates with ES, with a more substantial effect at higher economic levels. Research and Development (R and D) has a modest positive impact on ES. Despite significant energy prices, ES continues to trend positively, supported by investments in renewable energy. However, population growth negatively impacts ES, underscoring the need for effective population management.
The findings of this research, which examined the impact of E-governance and COVID-19 on environmental sustainability in 30 Chinese provinces from 2012 to 2021 using MMQR, have several important policy implications. Firstly, there is a clear need to prioritize and promote E-governance initiatives. These initiatives have significantly boosted environmental sustainability, particularly in the lower to middle quantiles. Governments should invest in digital infrastructure and technology to enhance monitoring, data collection, and analysis, which are critical for informed decision making and effective policy implementation.
Secondly, the negative impact of COVID-19 on environmental sustainability highlights the importance of implementing policies and strategies to mitigate these effects. Governments should prioritize recovery plans that address the pandemic’s immediate impacts and integrate environmental sustainability goals into long-term recovery strategies. This could include green stimulus packages, investment in sustainable infrastructure, and support for green industries.
Thirdly, the findings suggest the need for economic diversification strategies. While E-governance positively impacts environmental sustainability, its effects diminish at higher quantiles of development. Therefore, policymakers should focus on diversifying the economy beyond digital governance to ensure environmental sustainability across all levels of economic development. Fourthly, given the significant impact of energy prices on environmental sustainability, there is a need for policies that promote renewable energy investments and efficient resource management practices. This includes incentivizing renewable energy sources and promoting energy efficiency measures. Lastly, addressing the negative impact of population growth on environmental sustainability requires effective population management policies. This includes family planning initiatives, urban planning strategies that promote environmental sustainability, and policies that ensure equitable resource allocation. This study has several limitations that provide a foundation for future research. Firstly, our analysis is confined to Chinese provinces, restricting our understanding of how sustainability and global crises, such as the pandemic and armed conflicts, impact ES in other developing and emerging nations. Secondly, the study does not capture underlying micro and macro economic variables such as green productivity, AI, and urban digitalization, which could offer deeper insights into environmental sustainability dynamics. Finally, the spatial distribution estimation techniques should be used in future studies. Subsequent research could include a comparative analysis of E-government policies across different Chinese cities, evaluating their effectiveness in enhancing renewable energy capacity and improving environmental quality. Additionally, examining the impact of green finance mechanisms, such as China’s Green Credit Guidelines, could offer insights into financial instruments’ crucial role in steering economies toward sustainable practices.
Funding
This research was funded by Princess Nourah bint Abdulrahman University Researchers Supporting Project number (PNURSP2024R548), Princess Nourah bint Abdulrahman University, Riyadh, Saudi Arabia.
Institutional Review Board Statement
Not applicable.
Informed Consent Statement
Not applicable.
Data Availability Statement
All data presented in this research can be found on the Chinese City Statistical Yearbook and NIPAC, which is the Chinese National Intellectual Property Administration.
Acknowledgments
The authors extend their appreciation to Princess Nourah bint Abdulrahman University Researchers Supporting Project number (PNURSP2024R548), Princess Nourah bint Abdulrahman University, Riyadh, Saudi Arabia.
Conflicts of Interest
The author declares no conflicts of interest.
References
- Sun, X.; Liu, Y.; Guo, S.; Wang, Y.; Zhang, B. Interregional Supply Chains of Chinese Mineral Resource Requirements. J. Clean. Prod. 2021, 279, 123514. [Google Scholar] [CrossRef]
- Li, J.; Lin, B. The Sustainability of Remarkable Growth in Emerging Economies. Resour. Conserv. Recycl. 2019, 145, 349–358. [Google Scholar] [CrossRef]
- Liu, N.; Teng, L.; Tian, W.; Li, Y. Does Digitalization Enhance Fossil Fuels Resources Efficiency? Resour. Policy 2023, 85, 103878. [Google Scholar] [CrossRef]
- Zhu, M.; Shen, L.; Tam, V.W.Y.; Liu, Z.; Shu, T.; Luo, W. A Load-Carrier Perspective Examination on the Change of Ecological Environment Carrying Capacity during Urbanization Process in China. Sci. Total Environ. 2020, 714, 136843. [Google Scholar] [CrossRef]
- Li, X.; Ding, Y.; Li, Y. M-Government Cooperation for Sustainable Development in China: A Transaction Cost and Resource-Based View. Sustainability 2019, 11, 1884. [Google Scholar] [CrossRef]
- Azzam, F.; Jaber, M.; Saies, A.; Kirresh, T.; Awadallah, R.; Karakra, A.; Barghouthi, H.; Amarneh, S. The Use of Blockchain Technology and OCR in E-Government for Document Management: Inbound Invoice Management as an Example. Appl. Sci. 2023, 13, 8463. [Google Scholar] [CrossRef]
- Joshi, P.R.; Islam, S. E-Government Maturity Model for Sustainable E-Government Services from the Perspective of Developing Countries. Sustainability 2018, 10, 1882. [Google Scholar] [CrossRef]
- Zioło, M.; Niedzielski, P.; Kuzionko-Ochrymiuk, E.; Marcinkiewicz, J.; Łobacz, K.; Dyl, K.; Szanter, R. E-Government Development in European Countries: Socio-Economic and Environmental Aspects. Energies 2022, 15, 8870. [Google Scholar] [CrossRef]
- Grinin, L.; Grinin, A.; Korotayev, A. COVID-19 Pandemic as a Trigger for the Acceleration of the Cybernetic Revolution, Transition from e-Government to e-State, and Change in Social Relations. Technol. Forecast. Soc. Chang. 2022, 175, 121348. [Google Scholar] [CrossRef] [PubMed]
- Ullah, A.; Pinglu, C.; Ullah, S.; Abbas, H.S.M.; Khan, S. The Role of E-Governance in Combating COVID-19 and Promoting Sustainable Development: A Comparative Study of China and Pakistan; Springer: Singapore, 2021; Volume 6, ISBN 4111102000167. [Google Scholar]
- Bie, F.; Zhou, L.; Liu, S.; Yang, T. Government Digital Transformation, Resource Curse and Green Total Factor Energy Efficiency in Chinese Cities. Resour. Policy 2024, 92, 105002. [Google Scholar] [CrossRef]
- Lu, H.; Liu, M.; Song, W. Place-Based Policies, Government Intervention, and Regional Innovation: Evidence from China’s Resource-Exhausted City Program. Resour. Policy 2022, 75, 102438. [Google Scholar] [CrossRef]
- Ma, B.; Karimi, M.S.; Mohammed, K.S.; Shahzadi, I.; Dai, J. Nexus between Climate Change, Agricultural Output, Fertilizer Use, Agriculture Soil Emissions: Novel Implications in the Context of Environmental Management. J. Clean. Prod. 2024, 450, 141801. [Google Scholar] [CrossRef]
- Pata, U.K.; SI Mohammed, K.; Nassani, A.A.; Ghosh, S. Discovering the Sustainable Development Role of Fintech Credit and the Pilot Low Carbon Project on Greenwashing in China. Environ. Dev. Sustain. 2024, 7–15. [Google Scholar] [CrossRef]
- Lee, Y.B. Exploring the Relationship between E-Government Development and Environmental Sustainability: A Study of Small Island Developing States. Sustainability 2017, 9, 732. [Google Scholar] [CrossRef]
- Castro, C.; Lopes, C. Digital Government and Sustainable Development. J. Knowl. Econ. 2022, 13, 880–903. [Google Scholar] [CrossRef]
- Hashim, H. E-Government Impact on Developing Smart Cities Initiative in Saudi Arabia: Opportunities & Challenges. Alex. Eng. J. 2024, 96, 124–131. [Google Scholar] [CrossRef]
- Vashkevich, N.; Barykin, S.E.; Krasnov, A.; Kurochkina, A.A.; Alekseeva, N.; Krasnova, D.S.; Kankhva, V.S.; Khovalova, T.V.; Mikhov, O.; Buniak, V.; et al. E-Government Based on Sustainable Digitalization: The Case of the Chinese Social Sustainability Marketing Technologies Paradigm. J. Infrastruct. Policy Dev. 2024, 8, 3113. [Google Scholar] [CrossRef]
- Li, H.; Xu, J. Impact of Digital Government on Digital Transformation of Enterprises from the Perspective of Urban Economic Sustainable Development. Sustainability 2024, 16, 2667. [Google Scholar] [CrossRef]
- Sun, J.; Zhai, C.; Dong, X.; Li, C.; Wang, Z.; Li, D.; Sun, Y. How Does Digital Infrastructure Break the Resource Curse of Cities? Evidence from a Quasi-Natural Experiment in China. Resour. Policy 2023, 86, 104302. [Google Scholar] [CrossRef]
- Pan, Y.; Yang, M.-Y. Research on the Impact of Digital Infrastructure on the Allocation Efficiency of Green Resources in the Service Industry. Am. J. Econ. Sociol. 2024, 83, 223–247. [Google Scholar] [CrossRef]
- Andersson, F.N.G.; Arvidsson, S. The Impact of the Covid-19 Pandemic on the Environmental Sustainability Strategies of Listed Firms in Sweden. Bus. Strategy Environ. 2024, 33, 462–476. [Google Scholar] [CrossRef]
- Mengxuan, T.; Khan, K.; Cifuentes-Faura, J.; Sukumaran, S. Technological Innovation and Energy Efficiency in Central Eastern European Countries. Util. Policy 2024, 88, 101761. [Google Scholar] [CrossRef]
- Valenzuela-Fernández, L.; Escobar-Farfán, M.; Guerra-Velásquez, M.; García-Salirrosas, E.E. COVID-19 Effects on Environmentally Responsible Behavior: A Social Impact Perspective from Latin American Countries. Int. J. Environ. Res. Public Health 2023, 20, 3330. [Google Scholar] [CrossRef]
- Wang, J.; Zhang, J.; Cifuentes-Faura, J.; Ileana, S.C.; Zhao, X. Exploring factors influencing the digital economy: Uncovering the relationship structure to improve. Technol. Econ. Dev. Econ. 2024, 30, 441–478. [Google Scholar] [CrossRef]
- Hanna, T.; Hughes, B.B.; Irfan, M.T.; Bohl, D.K.; Solórzano, J.; Abidoye, B.; Patterson, L.; Moyer, J.D. Sustainable Development Goal Attainment in the Wake of COVID-19: Simulating an Ambitious Policy Push. Sustainability 2024, 16, 3309. [Google Scholar] [CrossRef]
- Palos-Sánchez, R.P.; Baena-Luna, P.; García-Ordaz, M.; Martínez-López, F.J. Digital Transformation and Local Government Response to the COVID-19 Pandemic: An Assessment of Its Impact on the Sustainable Development Goals. SAGE Open 2023, 13, 1–12. [Google Scholar] [CrossRef]
- Parmentola, A.; Petrillo, A.; Tutore, I.; De Felice, F. Is Blockchain Able to Enhance Environmental Sustainability? A Systematic Review and Research Agenda from the Perspective of Sustainable Development Goals (SDGs). Bus. Strateg. Environ. 2022, 31, 194–217. [Google Scholar] [CrossRef]
- Arora, N.K.; Mishra, I. United Nations Sustainable Development Goals 2030 and Environmental Sustainability: Race against Time. Environ. Sustain. 2019, 2, 339–342. [Google Scholar] [CrossRef]
- Wang, X.; Qin, C.; Liu, Y.; Tanasescu, C.; Bao, J. Emerging Enablers of Green Low-Carbon Development: Do Digital Economy and Open Innovation Matter? Energy Econ. 2023, 127, 107065. [Google Scholar] [CrossRef]
- Shu, Y.; Deng, N.; Wu, Y.; Bao, S.; Bie, A. Urban Governance and Sustainable Development: The Effect of Smart City on Carbon Emission in China. Technol. Forecast. Soc. Change 2023, 193, 122643. [Google Scholar] [CrossRef]
- Abbas, S.; Saqib, N.; Mohammed, K.S.; Sahore, N.; Shahzad, U. Pathways towards Carbon Neutrality in Low Carbon Cities: The Role of Green Patents, R&D and Energy Use for Carbon Emissions. Technol. Forecast. Soc. Chang. 2024, 200, 123109. [Google Scholar] [CrossRef]
- Tiwari, S.; Si, K.; Guesmi, K. A Way Forward to End Energy Poverty in China: Role of Carbon-Cutting Targets and Net-Zero Commitments. Energy Policy 2023, 180, 113677. [Google Scholar] [CrossRef]
- Ahmad, F.; Draz, M.U.; Chandio, A.A.; Ahmad, M.; Su, L.; Shahzad, F.; Jia, M. Natural Resources and Environmental Quality: Exploring the Regional Variations among Chinese Provinces with a Novel Approach. Resour. Policy 2022, 77, 102745. [Google Scholar] [CrossRef]
- Si Mohammed, K.; Abddel-Jalil Sallam, O.A.; Abdelkader, S.B.; Radulescu, M. Dynamic Effects of Digital Governance and Government Interventions on Natural Resources Management: Fresh Findings from Chinese Provinces. Resour. Policy 2024, 92, 105004. [Google Scholar] [CrossRef]
- Moldan, B.; Janoušková, S.; Hák, T. How to Understand and Measure Environmental Sustainability: Indicators and Targets. Ecol. Indic. 2012, 17, 4–13. [Google Scholar] [CrossRef]
- Liu, J.; Yu, Q.; Chen, Y.; Liu, J. The Impact of Digital Technology Development on Carbon Emissions: A Spatial Effect Analysis for China. Resour. Conserv. Recycl. 2022, 185, 106445. [Google Scholar] [CrossRef]
- Pata, U.K.; Tanriover, B. Is the Load Capacity Curve Hypothesis Valid for the Top Ten Tourism Destinations? Sustainability 2023, 15, 960. [Google Scholar] [CrossRef]
- Dogan, A.; Pata, U.K. The Role of ICT, R and D Spending and Renewable Energy Consumption on Environmental Quality: Testing the LCC Hypothesis for G7 Countries; Elsevier Ltd.: Amsterdam, The Netherlands, 2022; Volume 380, ISBN 0000000228534. [Google Scholar]
- Shahzad, U.; Tiwari, S.; Si Mohammed, K.; Zenchenko, S. Asymmetric Nexus between Renewable Energy, Economic Progress, and Ecological Issues: Testing the LCC Hypothesis in the Context of Sustainability Perspective. Gondwana Res. 2024, 129, 465–475. [Google Scholar] [CrossRef]
- Breusch, T.S.; Pagan, A.R. The Lagrange Multiplier Test and Its Applications to Model Specification in Econometrics. Rev. Econ. Stud. 1980, 47, 239. [Google Scholar] [CrossRef]
- Pesaran, M.H. Estimation and Inference in Large Heterogeneous Panels with a Multifactor Error Structure. Econometrica 2006, 74, 967–1012. [Google Scholar] [CrossRef]
- Pesaran, M.H. General Diagnostic Tests for Cross Section Dependence in Panels. Economics 2004, 1240, 1. [Google Scholar] [CrossRef]
- Blomquist, J.; Westerlund, J. Testing Slope Homogeneity in Large Panels with Serial Correlation. Econ. Lett. 2013, 121, 374–378. [Google Scholar] [CrossRef]
- Pesaran, M.H.; Ullah, A.; Yamagata, T. A Bias-Adjusted LM Test of Error Cross-Section Independence. Econ. J. 2008, 11, 105–127. [Google Scholar] [CrossRef]
- Hashem Pesaran, M.; Yamagata, T. Testing Slope Homogeneity in Large Panels. J. Econ. 2008, 142, 50–93. [Google Scholar] [CrossRef]
- Pesaran, M.H. A simple panel unit root test in the presence of cross-section dependence. J. Appl. Econ. 2007, 22, 265–312. [Google Scholar] [CrossRef]
- Westerlund, J. Testing for Error Correction in Panel Data. Oxf. Bull. Econ. Stat. 2007, 69, 709–748. [Google Scholar] [CrossRef]
- Dumitrescu, E.I.; Hurlin, C. Testing for Granger Non-Causality in Heterogeneous Panels. Econ. Model. 2012, 29, 1450–1460. [Google Scholar] [CrossRef]
- Machado, J.A.F.; Silva, J.M.C.S. Quantiles via Moments. J. Econ. 2019, 213, 145–173. [Google Scholar] [CrossRef]
- Simionescu, M.; Cifuentes-Faura, J. Public Debt in the Spanish Municipalities: Drivers and Policy Proposals. Eval. Rev. 2023, 48. [Google Scholar] [CrossRef]
- Hossain, M.R.; Dash, D.P.; Das, N.; Hossain, M.E.; Haseeb, M.; Cifuentes-Faura, J. Do Trade-Adjusted Emissions Perform Better in Capturing Environmental Mishandling among the Most Complex Economies of the World. Environ. Model. Assess. 2023, 20–29. [Google Scholar] [CrossRef]
- Bengana, I.; Adeleye, B.N.; Adeleye, B.N.; Mohammed, K.S.; Ibrahim, E.; Salim, E.; Semlali, Y.; Elrayah, M. Artificial Intelligence, Human Capital Development and Economic Performance In Saudi Arabia (1990–2019). J. Namib. Stud. 2023, 36, 794–815. [Google Scholar]
- Yu, Z.; Wang, J.; Tan, Z.; Luo, Y. Impact of Climate Change on SARS-CoV-2 Epidemic in China. PLoS ONE 2023, 18, e0285179. [Google Scholar] [CrossRef] [PubMed]
- Caglar, A.E.; Avci, S.B.; Daştan, M.; Destek, M.A. Investigation of the Effect of Natural Resource Dependence on Environmental Sustainability under the Novel Load Capacity Curve Hypothesis. Int. J. Sustain. Dev. World Ecol. 2024, 31, 431–446. [Google Scholar] [CrossRef]
- Nketiah, E.; Song, H.; Adjei, M.; Obuobi, B.; Adu-Gyamfi, G. Assessing the Influence of Research and Development, Environmental Policies, and Green Technology on Ecological Footprint for Achieving Environmental Sustainability. Renew. Sustain. Energy Rev. 2024, 199, 114508. [Google Scholar] [CrossRef]
- Lin, B.; Wang, S. Sustainability of Renewable Energy in China: Enhanced Strategic Investment and Displaced R&D Expenditure. Energy Econ. 2024, 131, 107312. [Google Scholar] [CrossRef]
- Mohamued, E.A.; Ahmed, M.; Pypłacz, P.; Liczmańska-Kopcewicz, K.; Khan, M.A. Global Oil Price and Innovation for Sustainability: The Impact of R&d Spending, Oil Price and Oil Price Volatility on Ghg Emissions. Energies 2021, 14, 1757. [Google Scholar] [CrossRef]
- Yan, H.; Qamruzzaman, M.; Kor, S. Nexus between Green Investment, Fiscal Policy, Environmental Tax, Energy Price, Natural Resources, and Clean Energy—A Step towards Sustainable Development by Fostering Clean Energy Inclusion. Sustainability 2023, 15, 13591. [Google Scholar] [CrossRef]
- Mosikari, T. Heterogenous Effect of Industrialisation on Environmental Degradation in Southern African Customs Union (SACU) Countries: Quantile Analysis. Economies 2024, 12, 71. [Google Scholar] [CrossRef]
Disclaimer/Publisher’s Note: The statements, opinions and data contained in all publications are solely those of the individual author(s) and contributor(s) and not of MDPI and/or the editor(s). MDPI and/or the editor(s) disclaim responsibility for any injury to people or property resulting from any ideas, methods, instructions or products referred to in the content. |
© 2024 by the author. Licensee MDPI, Basel, Switzerland. This article is an open access article distributed under the terms and conditions of the Creative Commons Attribution (CC BY) license (https://creativecommons.org/licenses/by/4.0/).