Article

Analysis of the Gravimetric Composition of Urban Solid Waste from the Municipality of Belém/PA

by
Gabriel Pereira Colares da Silva
1,
Fernanda Paula da Costa Assunção
1,
Diogo Oliveira Pereira
1,
Jorge Fernando Hungria Ferreira
1,
Josiane Coutinho Mathews
1,
Débora Prissila Reis Sandim
1,
Higor Ribeiro Borges
1,
Mel Safira Cruz do Nascimento
2,
Neyson Martins Mendonça
2,
Isaque Wilkson de Sousa Brandão
2,
André Oliveira Menezes
3,
Luiz Eduardo Pizarro Borges
3,
José Almir Rodrigues Pereira
1,2 and
Nélio Teixeira Machado
1,2,*
1
Graduate Program of Civil Engineering, Campus Profissional-UFPA, Universidade Federal do Pará, Rua Augusto Corrêa N° 1, Belém 66075-110, Brazil
2
Faculty of Sanitary and Environmental Engineering, Campus Professional-UFPA, Universidade Federal do Pará, Rua Corrêa N° 1, Belém 66075-900, Brazil
3
Laboratory of Catalyst Preparation and Catalytic Cracking, Section of Chemical Engineering, Instituto Militar de Engenharia-IME, Praça General Tibúrcio N°. 80, Rio de Janeiro 22290-270, Brazil
*
Author to whom correspondence should be addressed.
Sustainability 2024, 16(13), 5438; https://doi.org/10.3390/su16135438 (registering DOI)
Submission received: 10 April 2024 / Revised: 26 May 2024 / Accepted: 10 June 2024 / Published: 26 June 2024
(This article belongs to the Special Issue Environmental, Economic and Health Challenges of Managing Wastes)

Abstract

:
This article aimed to evaluate, using statistical tools, the generation and composition of municipal solid waste (MSW) in the city of Belém, Pará, from nine urban collection sectors in the municipality and the average nominal income of the population. Approximately 900 kg of urban solid waste was collected from the municipality in the period from 2021 to 2022. Statistical tests were carried out on hypotheses with 5% significance in comparative evaluations and their respective average nominal incomes. The results indicated that the organic fraction corresponded to 55.57% of the waste generated in the municipality, 14.26% was inert waste (potentially contaminating), and 0.67% was miscellaneous waste. It was observed that the waste generated by families with high purchasing power tended to contain higher percentages of recyclables while in families with lower purchasing power, the highest percentages tended to be organic. Knowledge of the generation of MSW is fundamental for the choice and dimensioning of operations and processes involved in the management chain at the municipal level. The decentralization of services offered based on solid waste management would enable greater success in serving the population.

1. Introduction

The generation of municipal solid waste (MSW) is a significant environmental problem on a global scale. The amount of solid waste (RS) produced can vary according to factors such as population size, level of industrialization, and consumption patterns. Globally, around 1.3 to 1.9 billion tons of solid waste are generated annually [1]. Currently, waste management can be one of the following four types: landfills, recycling, thermal, and biological treatment. In the global scenario, MSW management is mostly addressed in the form of landfills. The statistics reveal that only 15% of the total waste collected is sent for recycling and the remaining waste is sent to landfills or is simply dumped in open places, inviting high risk factors [2].
In Brazil, in 2022, a total of 81.8 million tons of MSW were generated, corresponding to 224 thousand tons per day, that is, each Brazilian produced, on average, 1.043 kg of waste per day. The region with the highest waste generation continued to be the southeast, with around 111 thousand tons per day (approximately 50% of the country’s generation) and an average of 450 kg/habitant/year, while the northern region represented 7.4% of the total generated, with around 6 million tons/year and 328 kg/habitant/year, the lowest among the regions [3].
The city council of Belém in the State of Pará, Brazil, the city that will host the 30th UN Conference on Climate Change (COP-30) in November 2025, allocates practically all of its MSW to landfills [4]. Only around 1.3% of waste is recycled in the municipality of Belém, which is unlike what is occurring in developed countries where we find much higher percentages of recycling and composting [5].
Currently, urban solid waste (MSW) management can be divided into four main types: landfills, recycling, thermal treatment and biological treatment. Globally, most MSW management is carried out through landfills. Statistics show that only 15% of collected waste is recycled, while the rest is sent to landfills or simply dumped in open areas, which increases risk factors [6].
This amount is estimated to increase to around 3.5 billion tons by 2050, overwhelming the existing management systems [7,8]. In the current scenario of total waste collection, only around 11% is converted into energy, 19% is recycled, and around 70% is dumped in landfills, causing many health and environmental problems [1].
Furthermore, common MSW management practices such as the use of incineration and landfill pose numerous dangerous risks while increasing greenhouse gas (GHG) emissions, contributing to climate change, MSW causes a substantial socioeconomic burden, and its management cost is estimated to increase by USD 675.5 billion by 2025 [9].
In Brazil, to minimize such problems, the National Solid Waste Policy was introduced. This is legislation on solid waste regulated by Decree No. 7404/2010, which brings together a set of principles, objectives, guidelines, instruments, goals, and actions for the integrated management and the environmentally correct management of municipal solid waste. In aiming to offer alternatives for waste management, it proposes the implementation of energy recovery as an environmentally appropriate treatment and destination, in addition to determining the development of RS management plans at state, municipal, and regional levels, as well as the National Solid Waste Plan; the establishment of goals for the eradication of landfills; providing for the preparation of RS management plans by companies; and the implementation of selective collection and reverse logistics [10,11].
In this sense, the research focused on this topic has attracted the attention of researchers in recent years. According to [12], the insertion of statistical techniques has proven to be relevant for assisting the municipality in the planning and management of solid waste. Multivariate techniques stand out for enabling the simultaneous analysis of several indicators and identifying possible management strategies for public managers [13,14,15].
Accurate and reliable data on the composition of waste are fundamental both for the planning and environmental assessment of waste management and for improving resource recovery in society. To develop the waste system and improve technologies, detailed data on the material characteristics of the waste involved are needed. The characterization of waste composition typically consists of three phases: first sampling the waste itself, then sorting the waste into the desired number of material fractions (e.g., paper, plastic, organics, etc.), and finally handling the interpretation and application of the data obtained. Sampling and sorting activities themselves are fundamental to obtaining adequate data on waste composition. The absence of international standards for solid waste characterization has led to a variety of sampling and screening approaches, making it challenging to compare results across studies [16]. That way, determining the composition and quantity of waste allows a greater understanding of the reality of the generating source, enabling more efficient management proposals [17]. Furthermore, gravimetric characterization supports the development of any program or project related to MS; therefore, this is an important integrated management instrument for the municipality [18].
In view of the above, the present work aimed to analyze the gravimetric composition of municipal solid waste (MSW) in the city of Belém, Pará, based on the city’s nine urban collection sectors and the population’s household income.

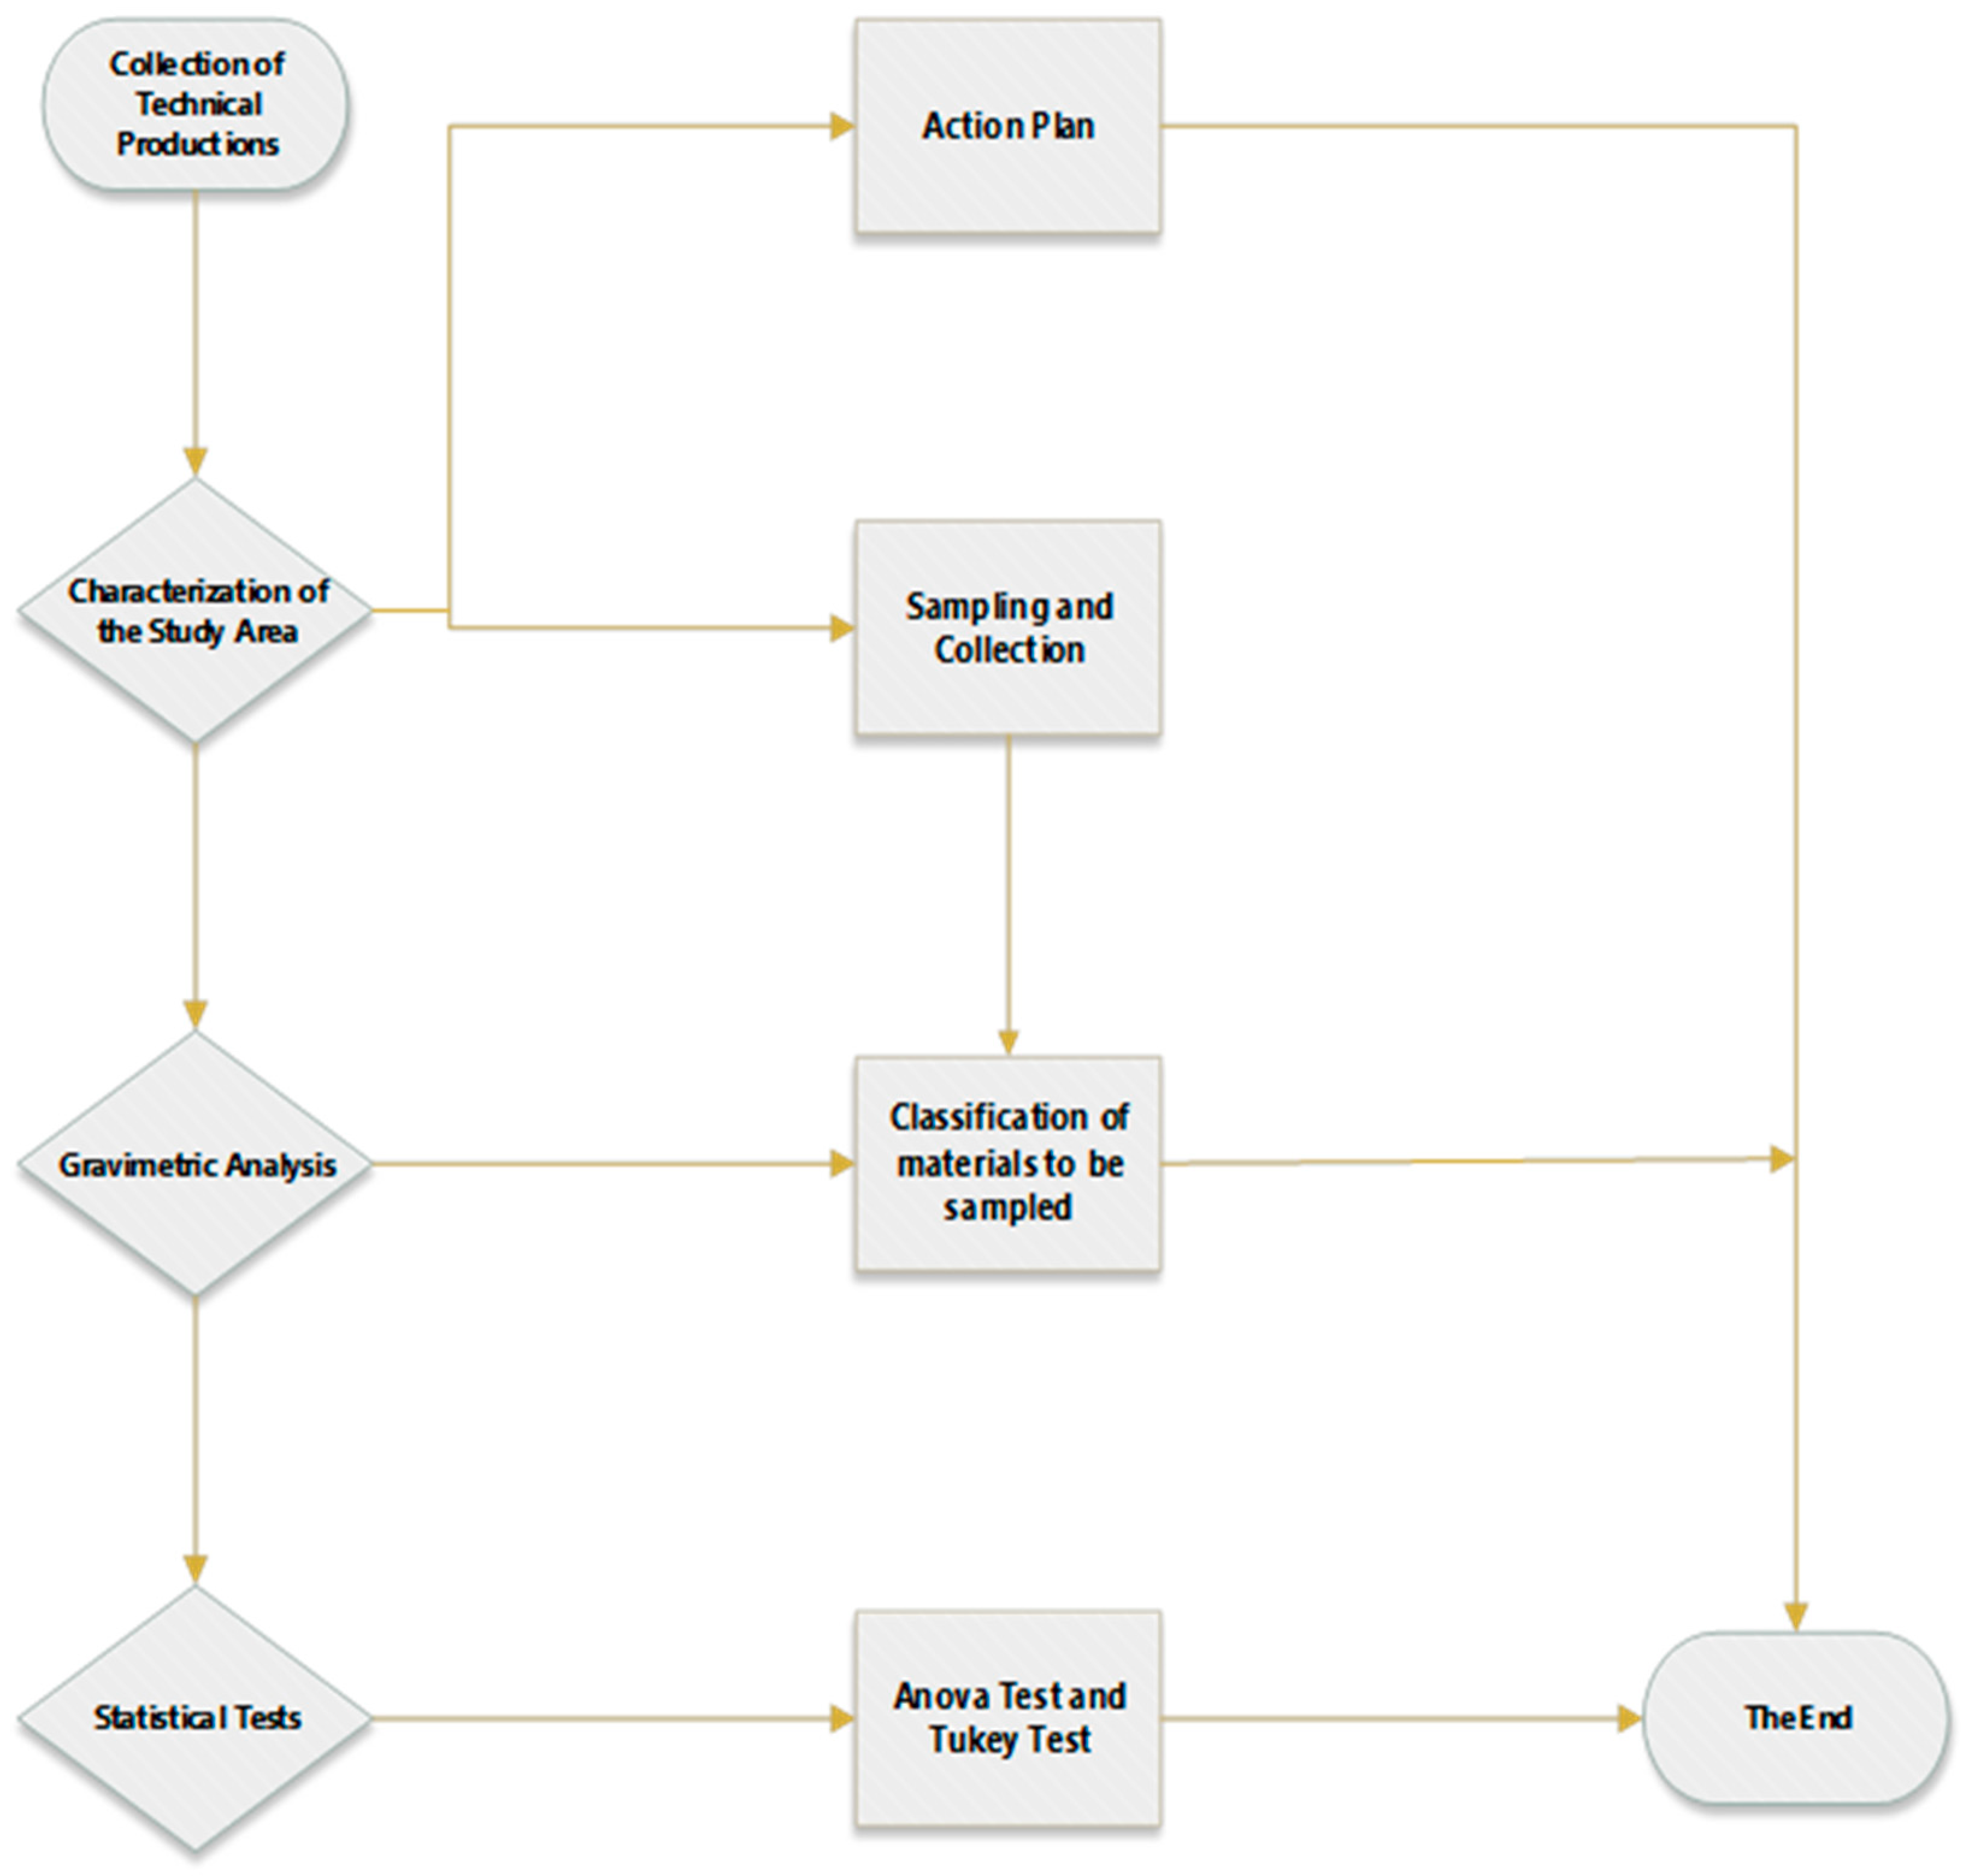
2. Materials and Methods

In this work, the methodology for achieving the proposed objectives in the current research is presented, detailing the study area, methodological design, specific data collection procedures, data analysis, and the statistical techniques used. The development of the experimental research took place in 2021. Figure 1 depicts the flowchart of the stages developed in the research.

2.1. Collection of Technical Productions

The first stage sought to understand the management context, including the generation and composition of MSW to formulate the problem and thus move on to the second stage of identifying the objectives, that is, these were defined within the reality of MSW collected by the company Terraplena LTDA within the municipality of Belém/PA in which specific sector the company was intended to work, and directed the work.
At this stage, research was carried out in reviewing academic and technical publications to collect reference data on the gravimetric composition of MSW adopted in other countries, in Brazil, and in the city of Belém/PA, which served as the basis for adopting the type of collection and gravimetric composition adopted in the research. To achieve this, several sources were consulted, including references [19,20,21,22,23,24,25,26].

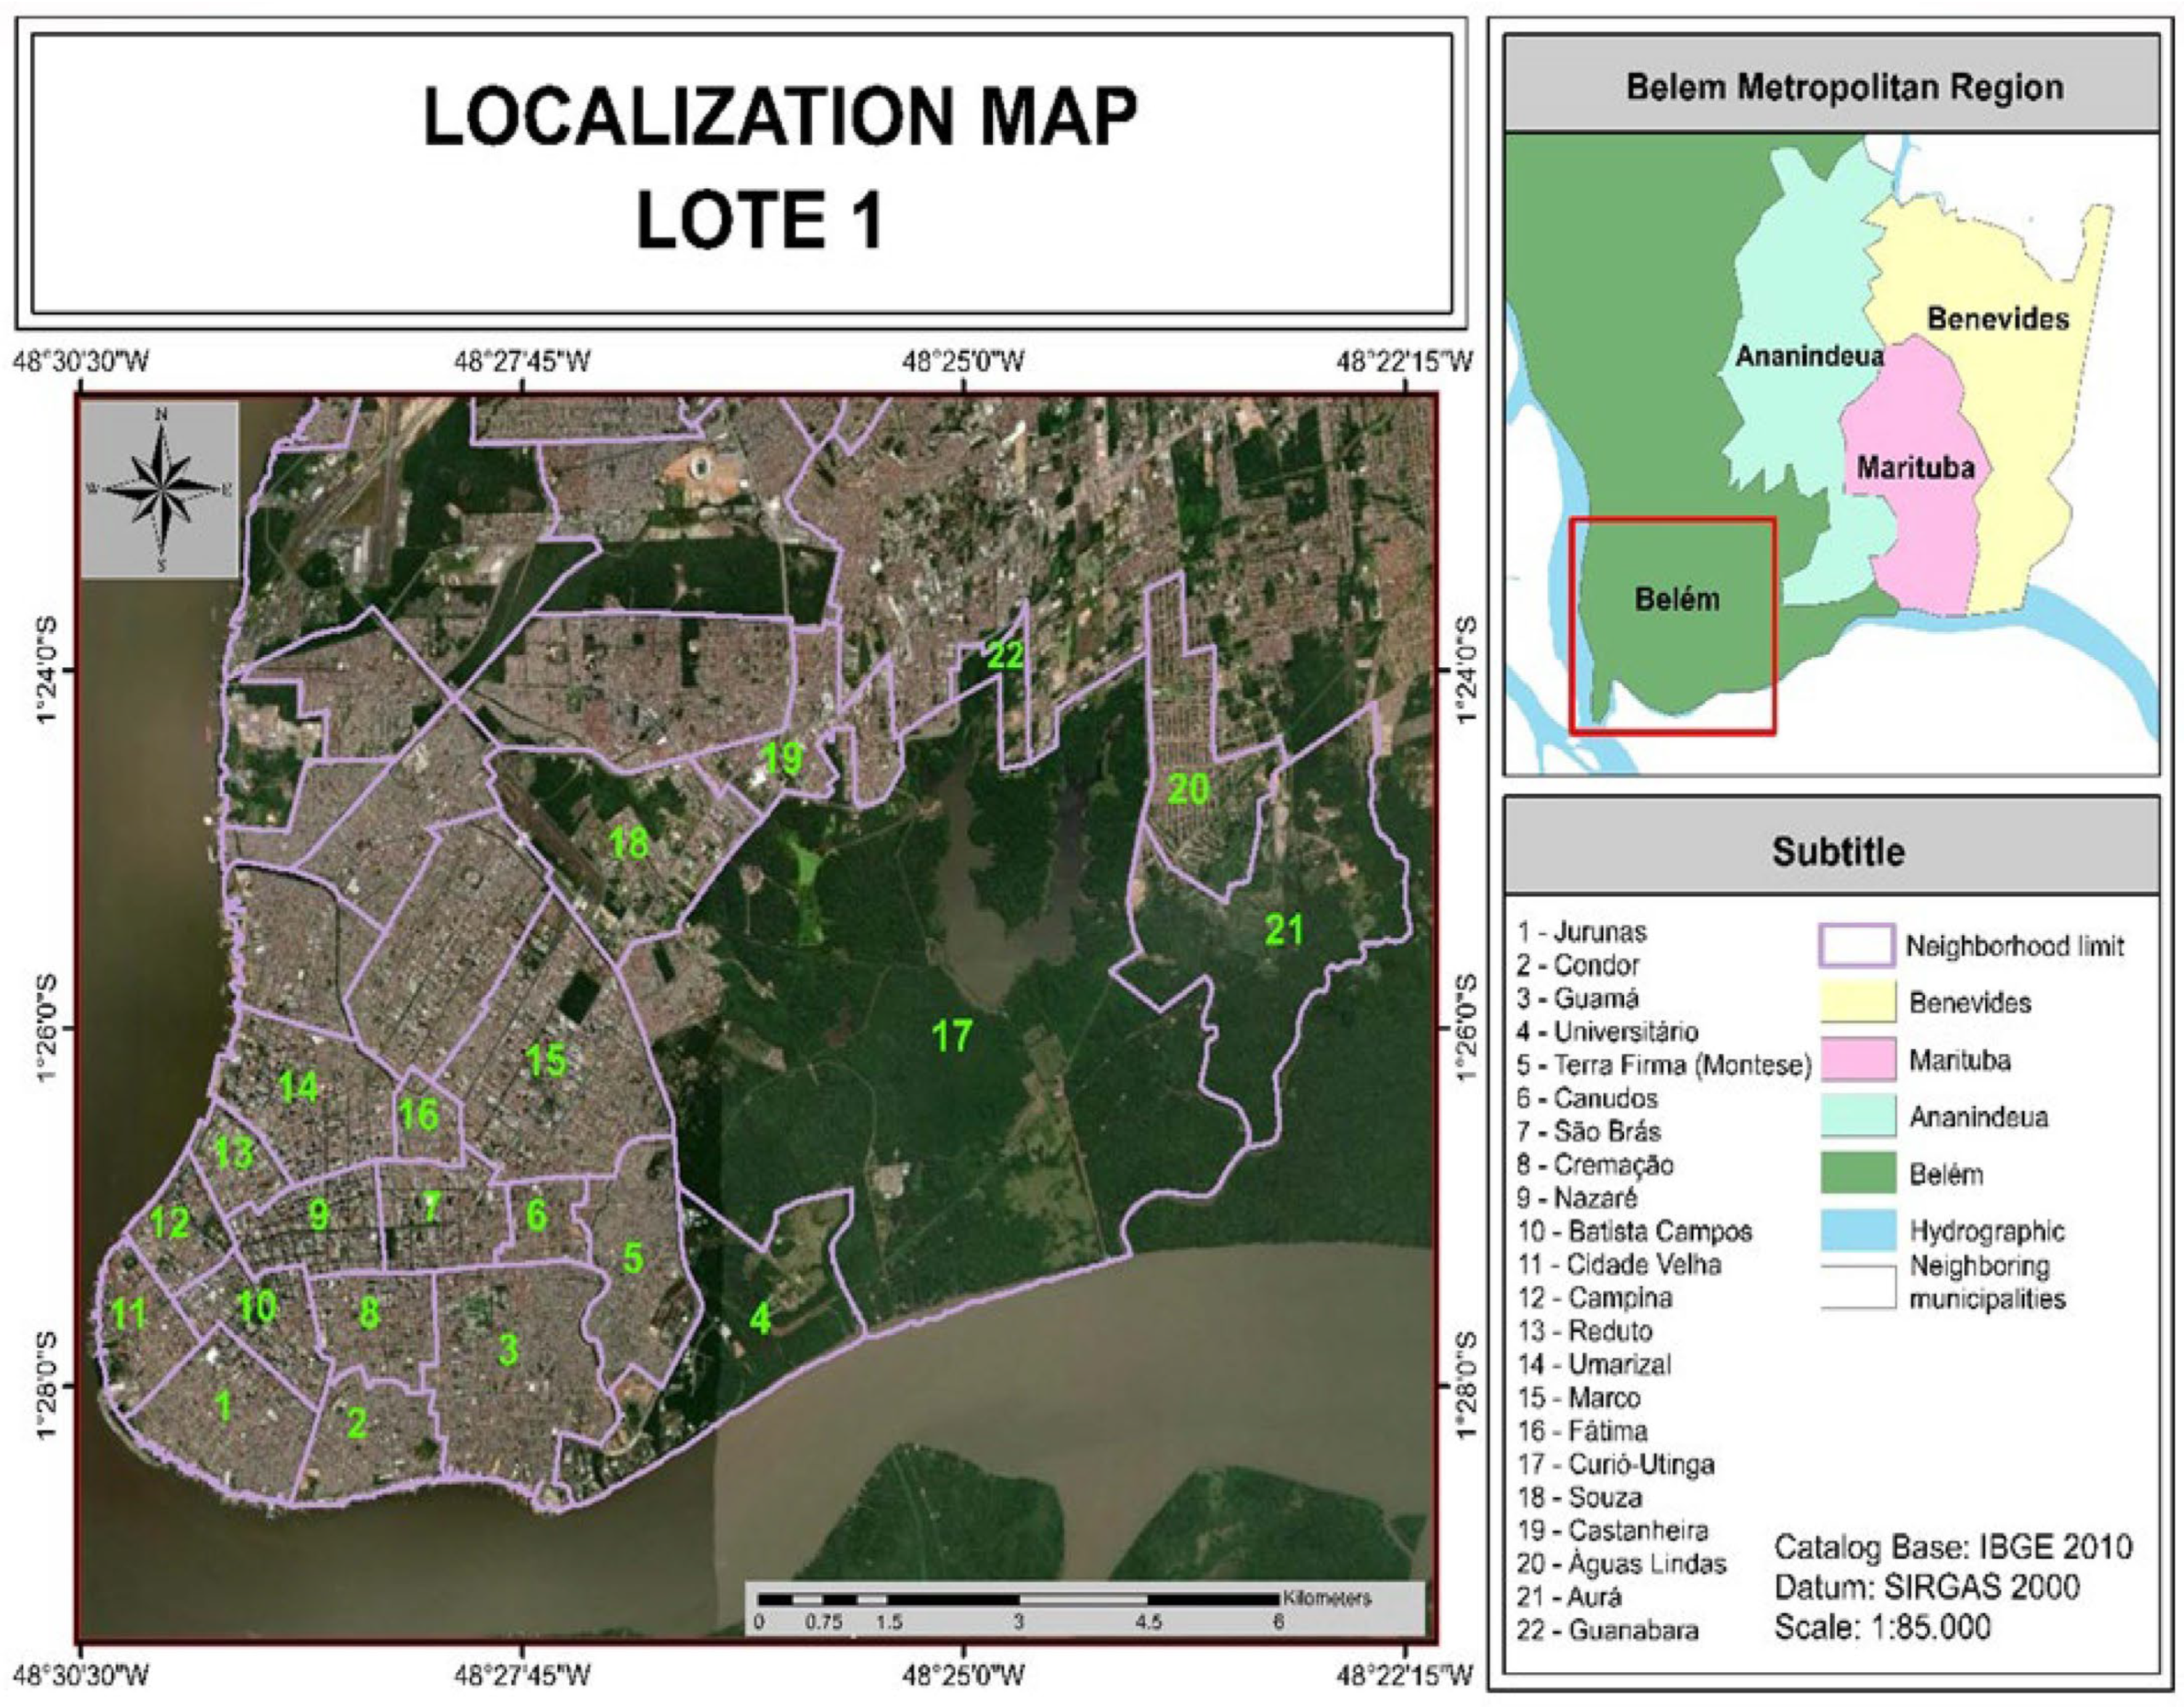
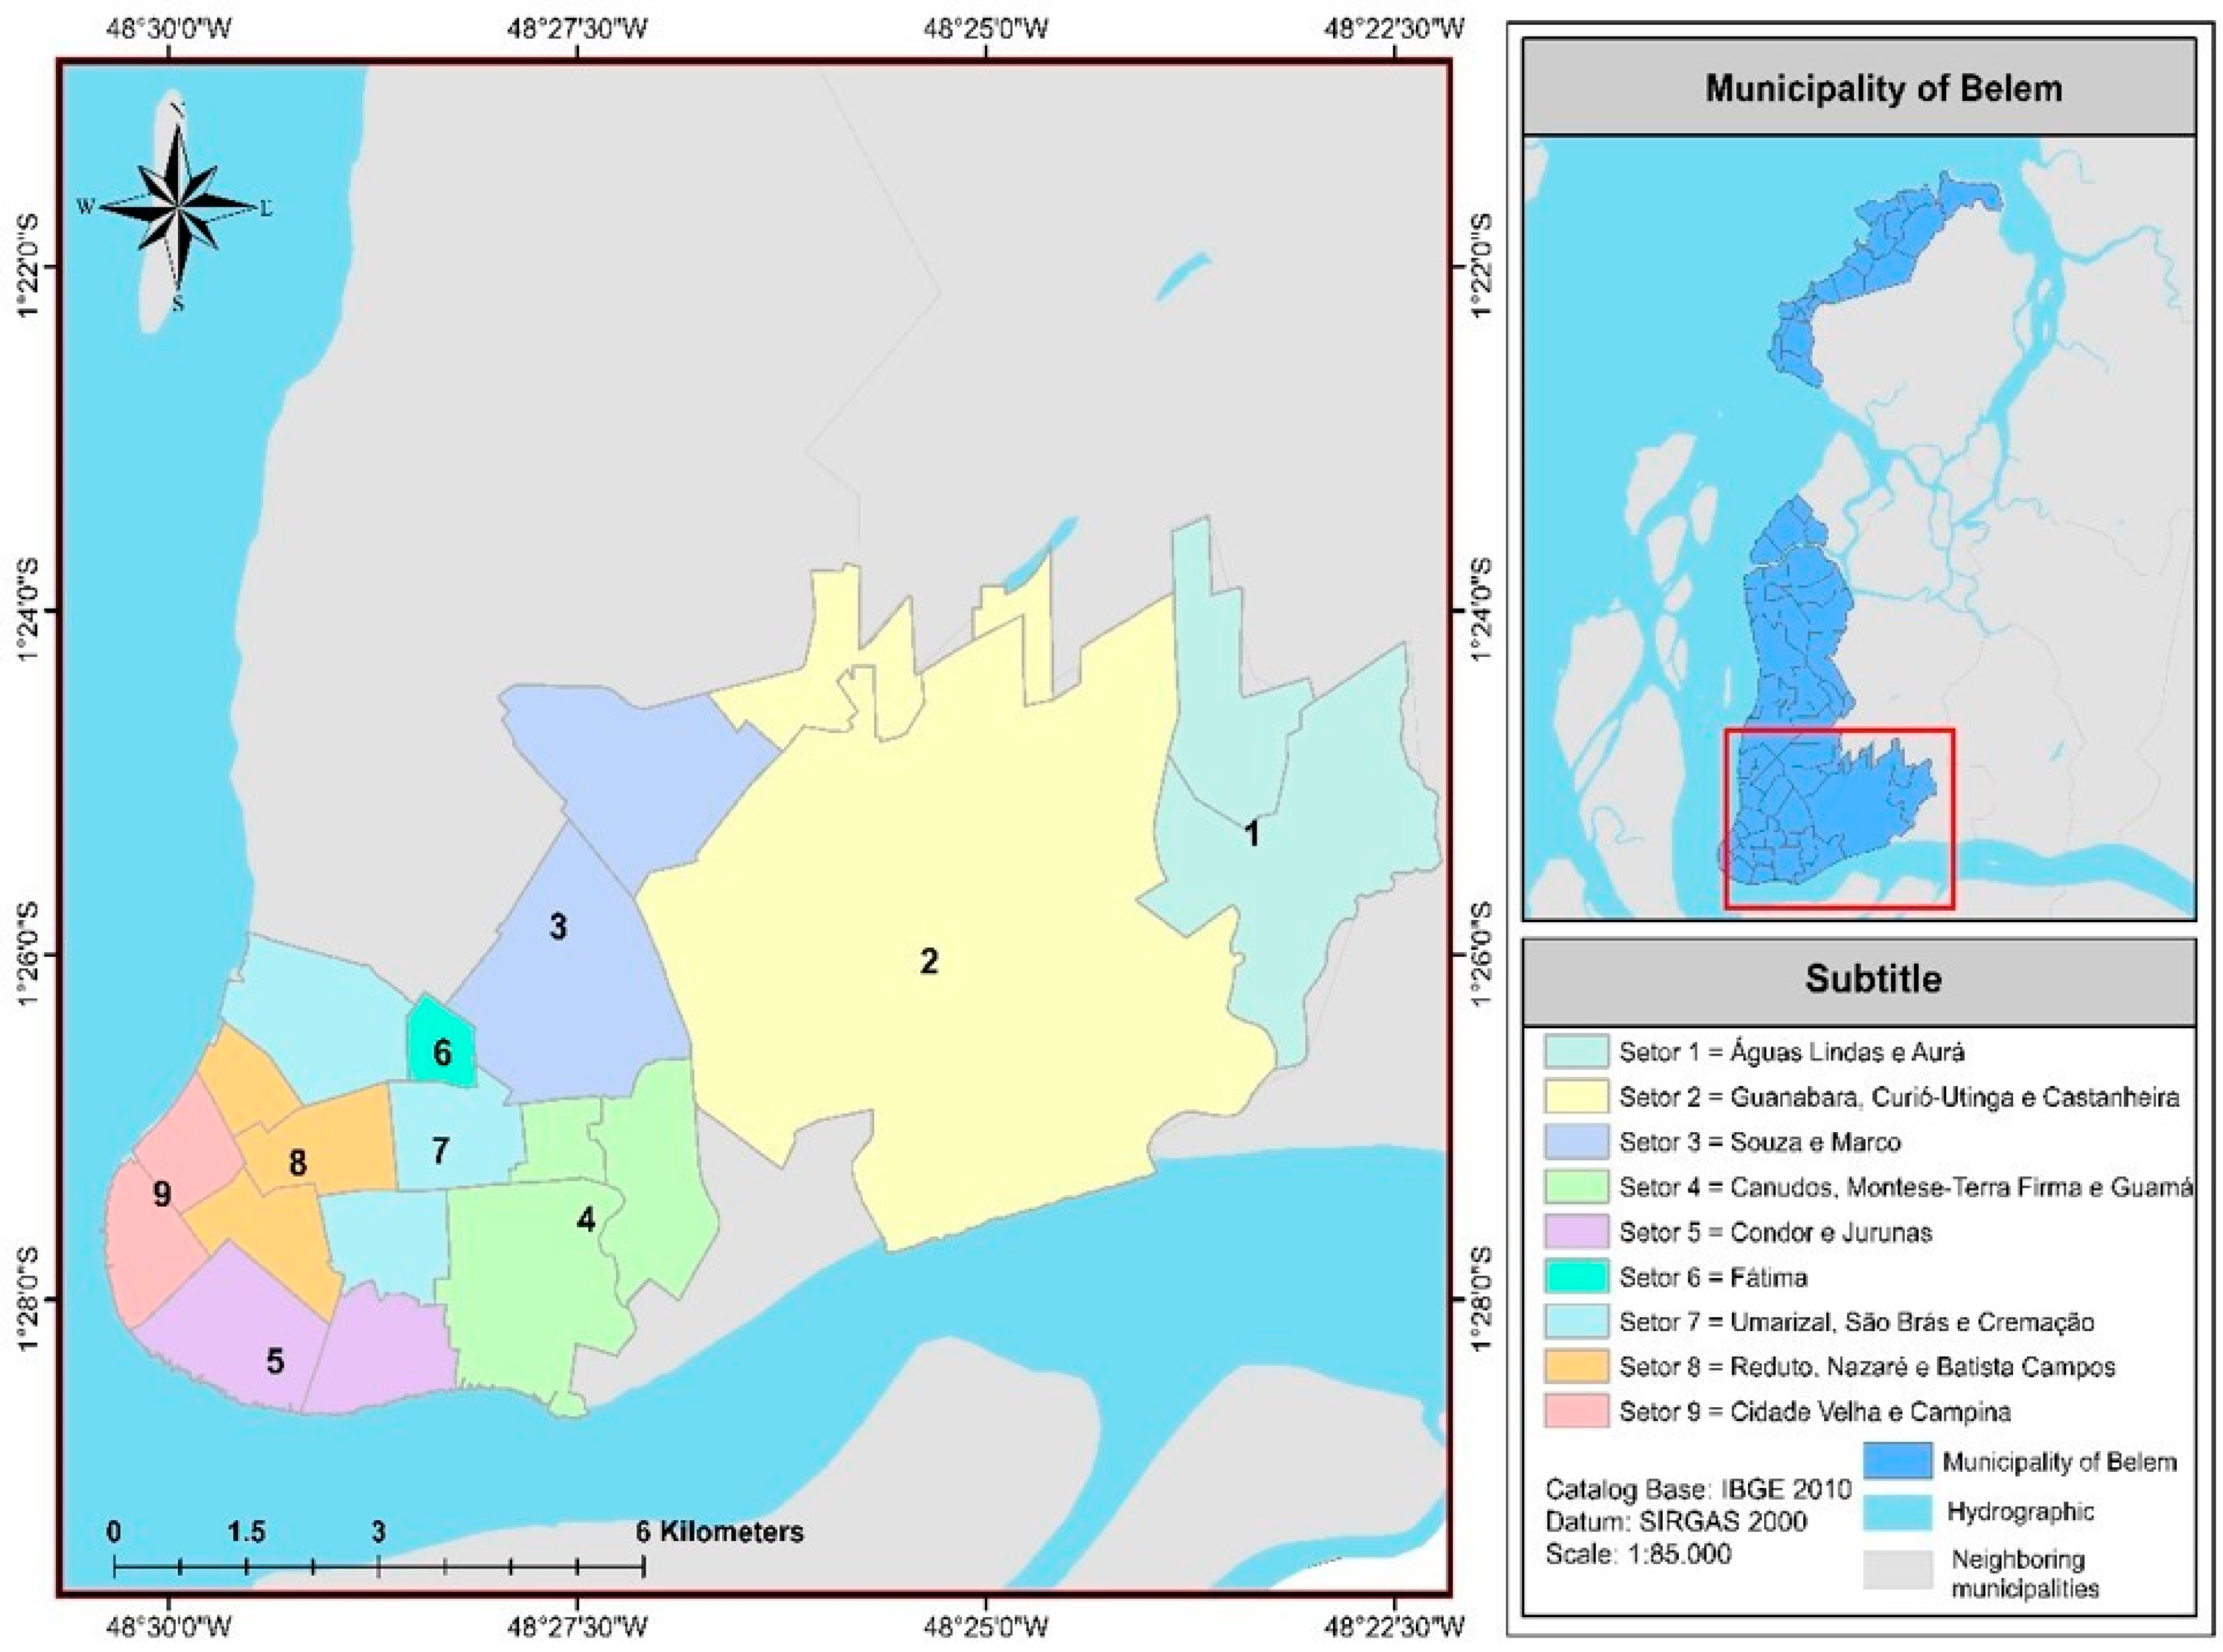
2.2. Characterization of the Study Area

Therefore, the study area is the urban area of Belém served by Terraplena LTDA and belonging to Lot 1, according to the division presented in the Municipal Basic Sanitation Plan of Belém [27], which includes 21 neighborhoods in the urban area of Belém (Figure 2), totaling 37 itineraries (routes).
With the objective of carrying out the quantitative characterization of urban solid waste (MSW) in the twenty-one (21) neighborhoods in which the company Terraplena LTDA provides collection and transportation services, it was necessary to prepare and execute a viable and appropriate work action plan. The action plan included activities related to the on-site knowledge of the waste flow of collection routes, definition of the volume to be collected, sampling of newly deposited waste, transportation of waste to the location where the gravimetric composition was determined, that have already been described in the study of Assunção et al. [26]. Collections were made during the rainy season.
The neighborhoods were classified according to family income, which was established by adapting the methodology recommended by the IBGE (2010) [28]. According to this methodology, the Brazilian population is divided into five classes (A, B, C, D, and E) according to family income, based on the minimum wage. It is noteworthy that for the municipality of Belém, there are no neighborhoods that fit into class A and B, and that most of its neighborhoods, approximately 61%, are characterized as class E. It can be inferred that the absence of neighborhoods in classes A and B suggests a scenario where the population in Belém does not reach the highest income levels, directly impacting consumption patterns and, consequently, waste generation. With approximately 61% of neighborhoods classified as Class E, there is a significant characterization of areas with a lower purchasing power.
By grouping the 21 neighborhoods into 9 sectors (Figure 3), it was possible to establish the formation of regions, which correspond to larger areas, which were considered as the unit for sampling solid waste for statistical analyses.
Therefore, the composition of three regions was determined, as shown in Table 1. The grouping into sectors and regions aimed to facilitate the planning of collections, gravimetric composition, and all packaging and transformation processes carried out on waste, considering the objectives of the research carried out.

2.3. Gravimetric Analysis

The methodology used in the research for collecting and preparing the samples, as well as determining the gravimetric analysis, was previously described by Assunção et al. [26] and Pereira et al. [29]. In summary, statistical sampling was initially carried out using the STATDISK 13.0 software sampling tool (Statsoft, Tulsa, OK, USA, 2021). The tool was applied to determine the amount of waste that must be collected for the sample to be statistically representative. Therefore, with a reliability index of 95%, significance of 5%, and margin of error of 10%, a mass of waste of approximately 100 kg was obtained to compose the sample in each collection carried out, from a total of 15,000 kg. which can be collected in a 15 m3 collection truck, when considering the specific weight of water at 1 atm and 25 °C. The gravimetric analysis was made considering the separation of solid waste into the following elements: Paper, Cardboard, Tetra Pak, Rigid Plastic, Malleable Plastic, Glass, Metal, Organic Matter, Fabrics, Sanitary Waste, and Rejects/Others. This analysis was carried out in which the separation of materials was performed using the mass of this diversity of materials and the proportion of these among the mass. Such classification can contribute to different conclusions being obtained, considering the dominant types of materials and others in smaller proportions and masses.
Before carrying out the gravimetric characterization, the total mass of waste was measured, to guide the gravimetric process, with the correct proportion of waste characterized by Assunção et al. [26] and Pereira et al. [29].

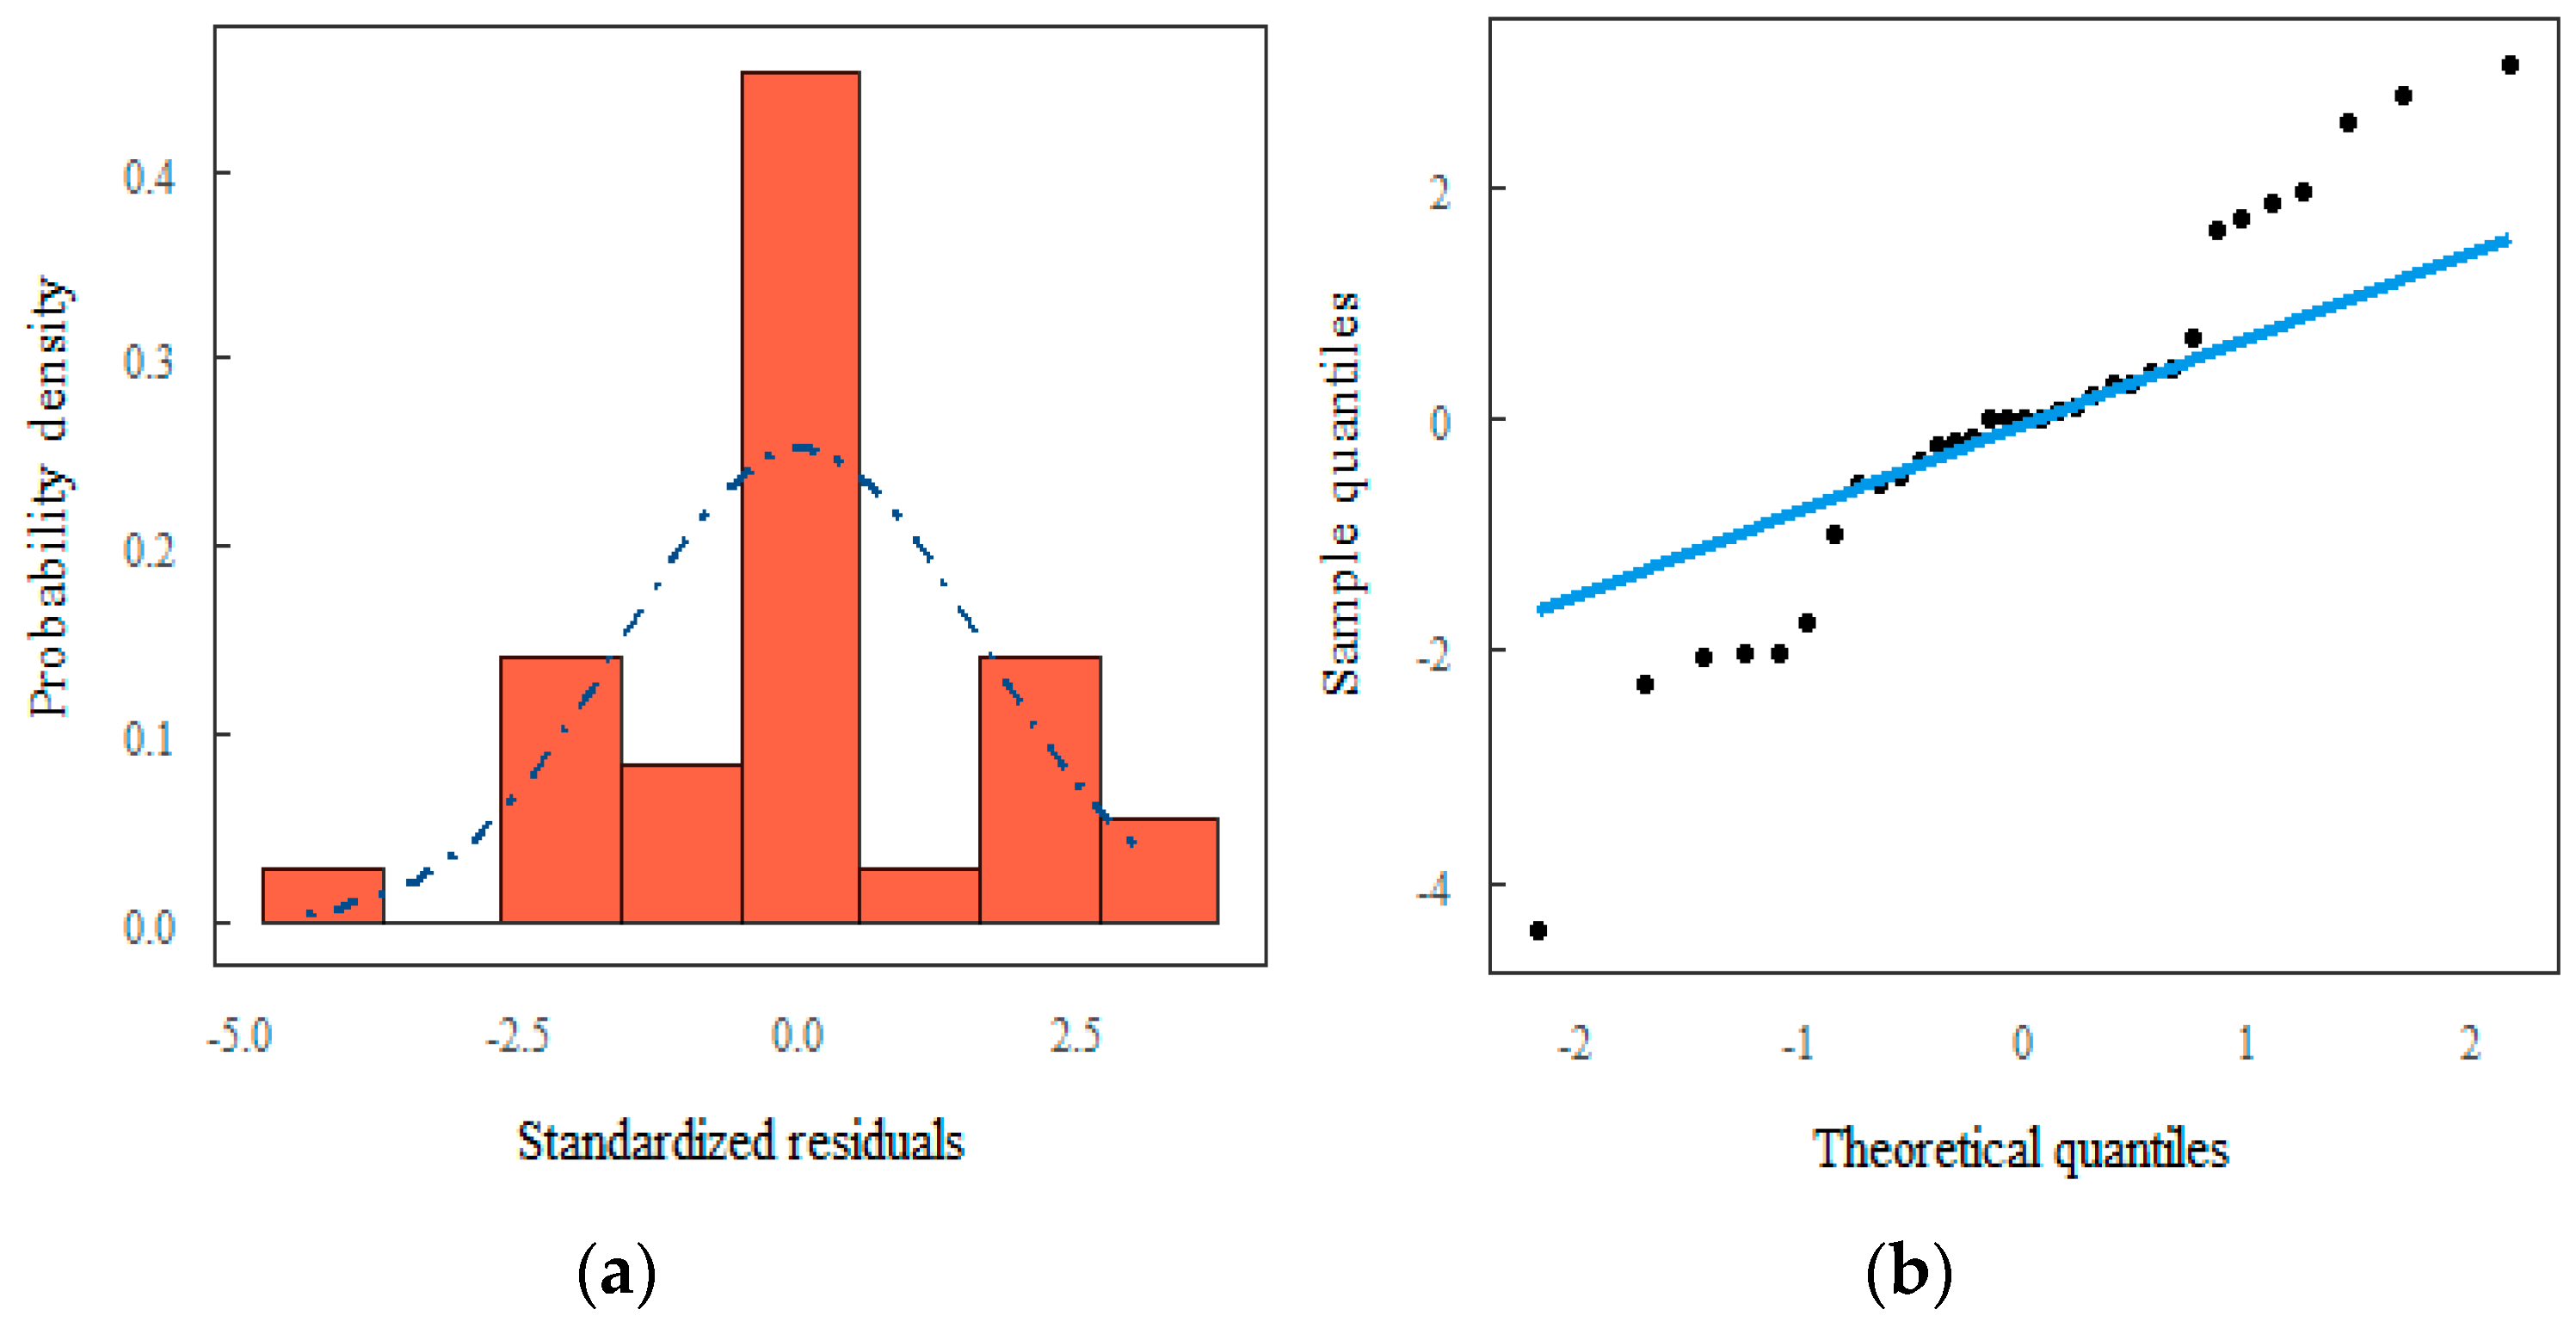
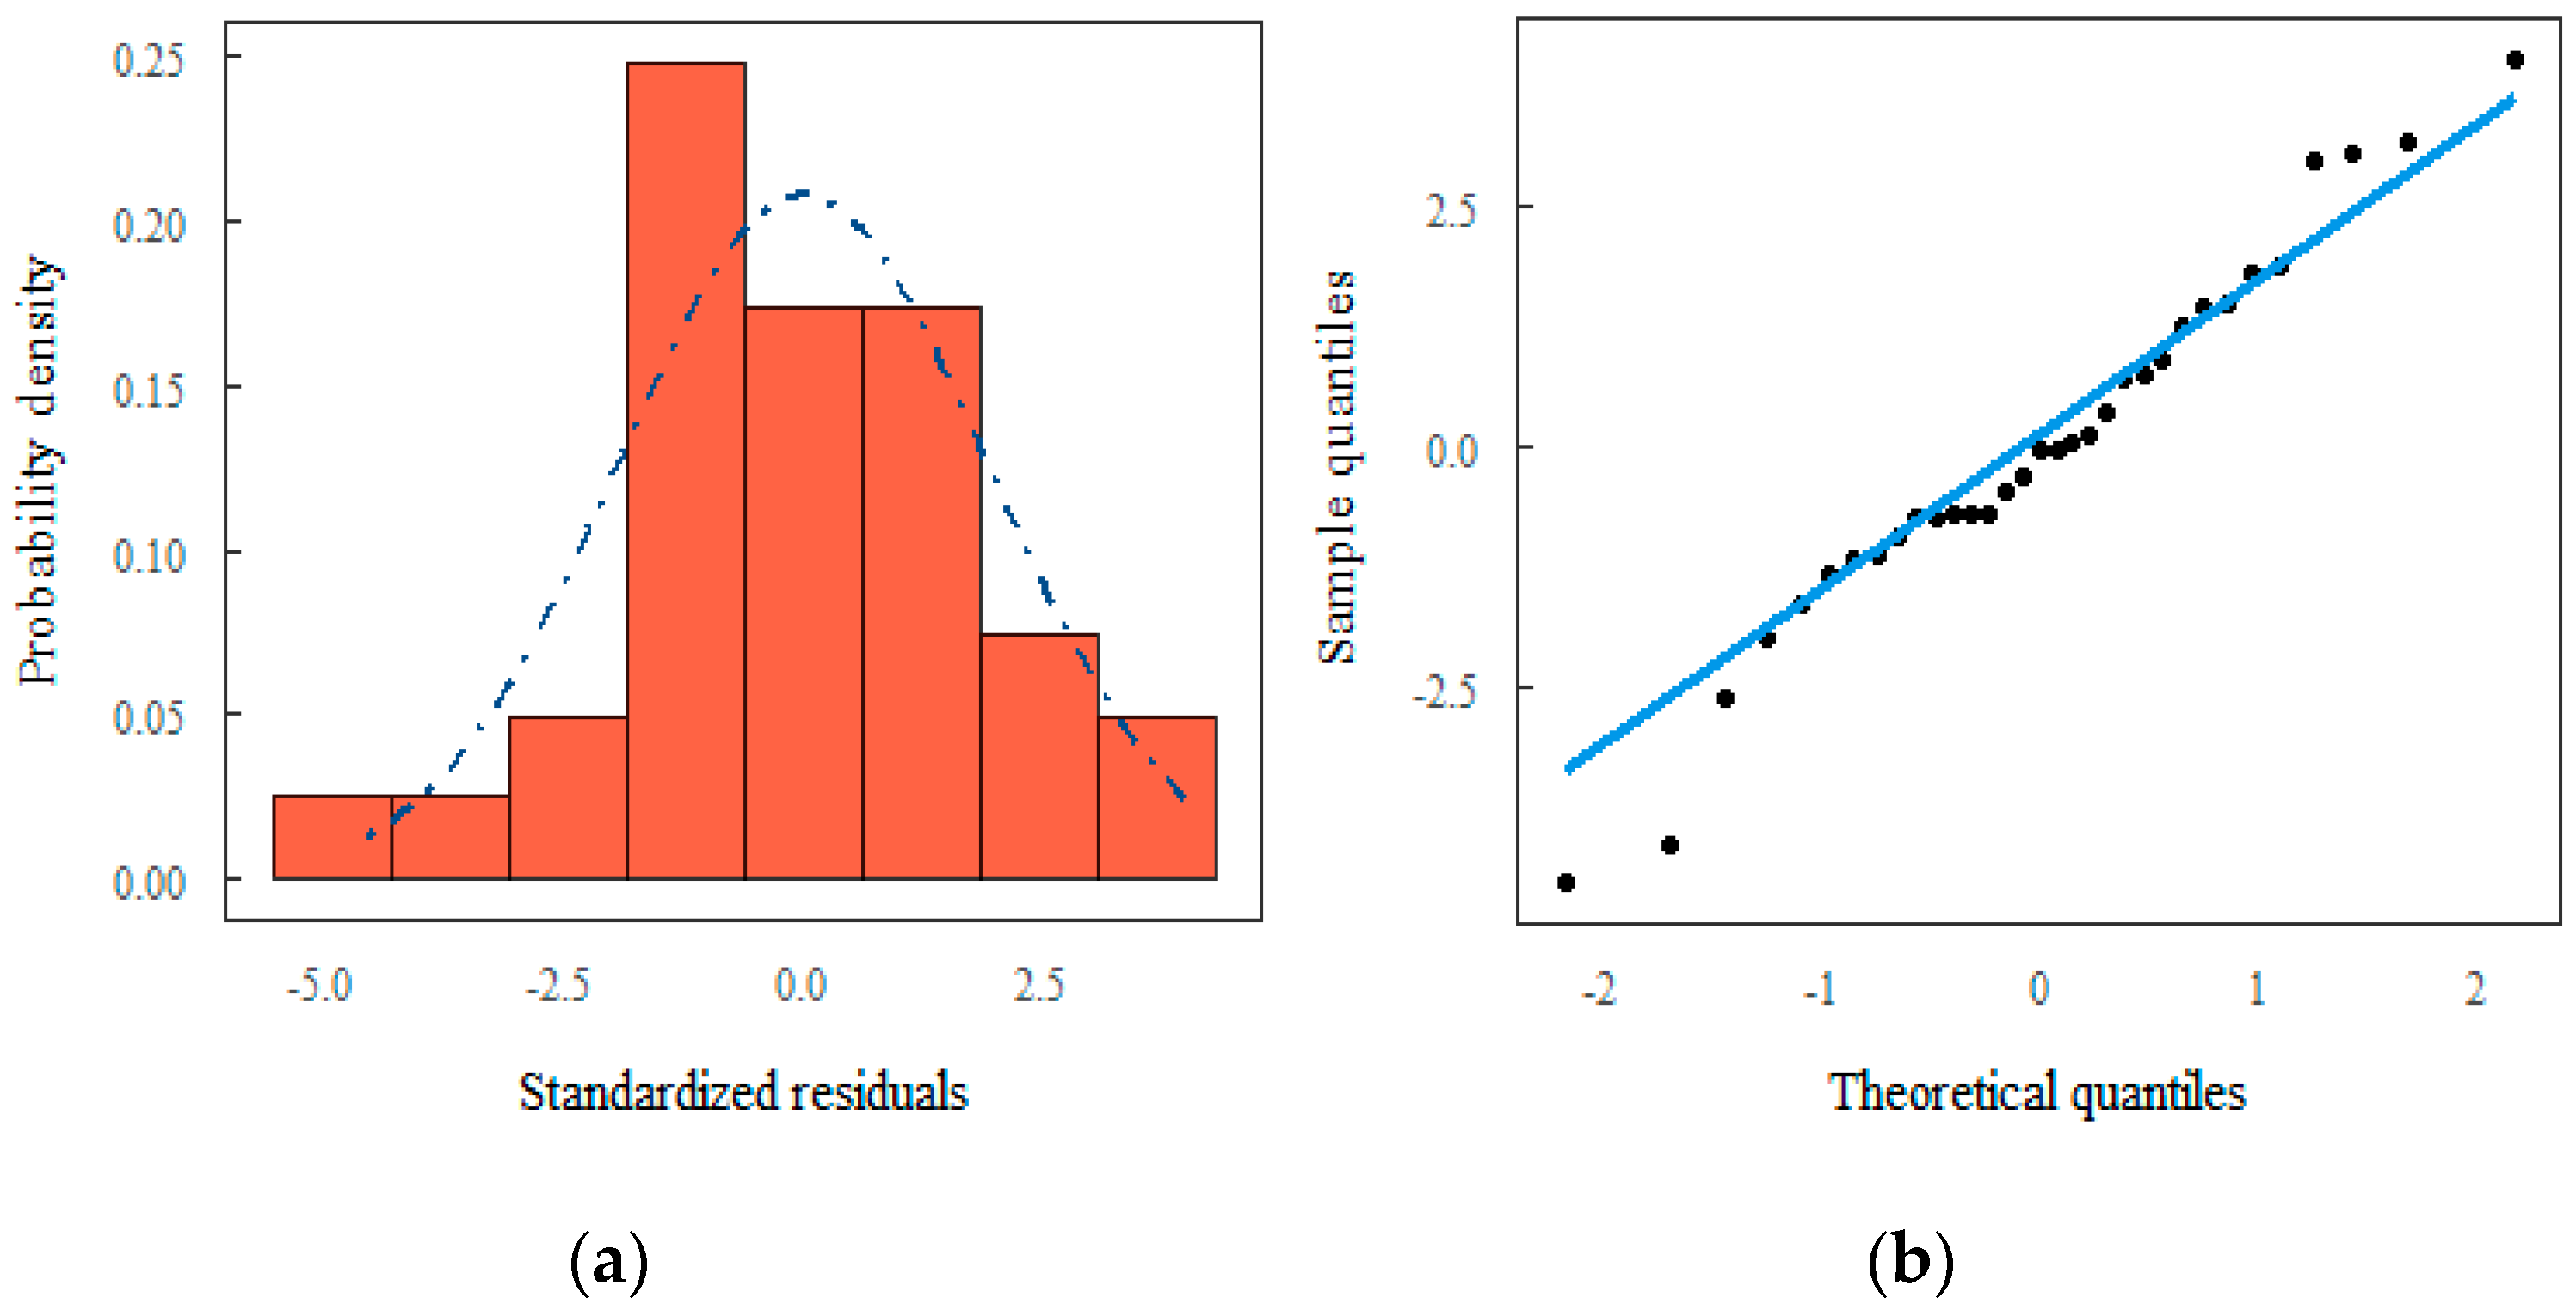
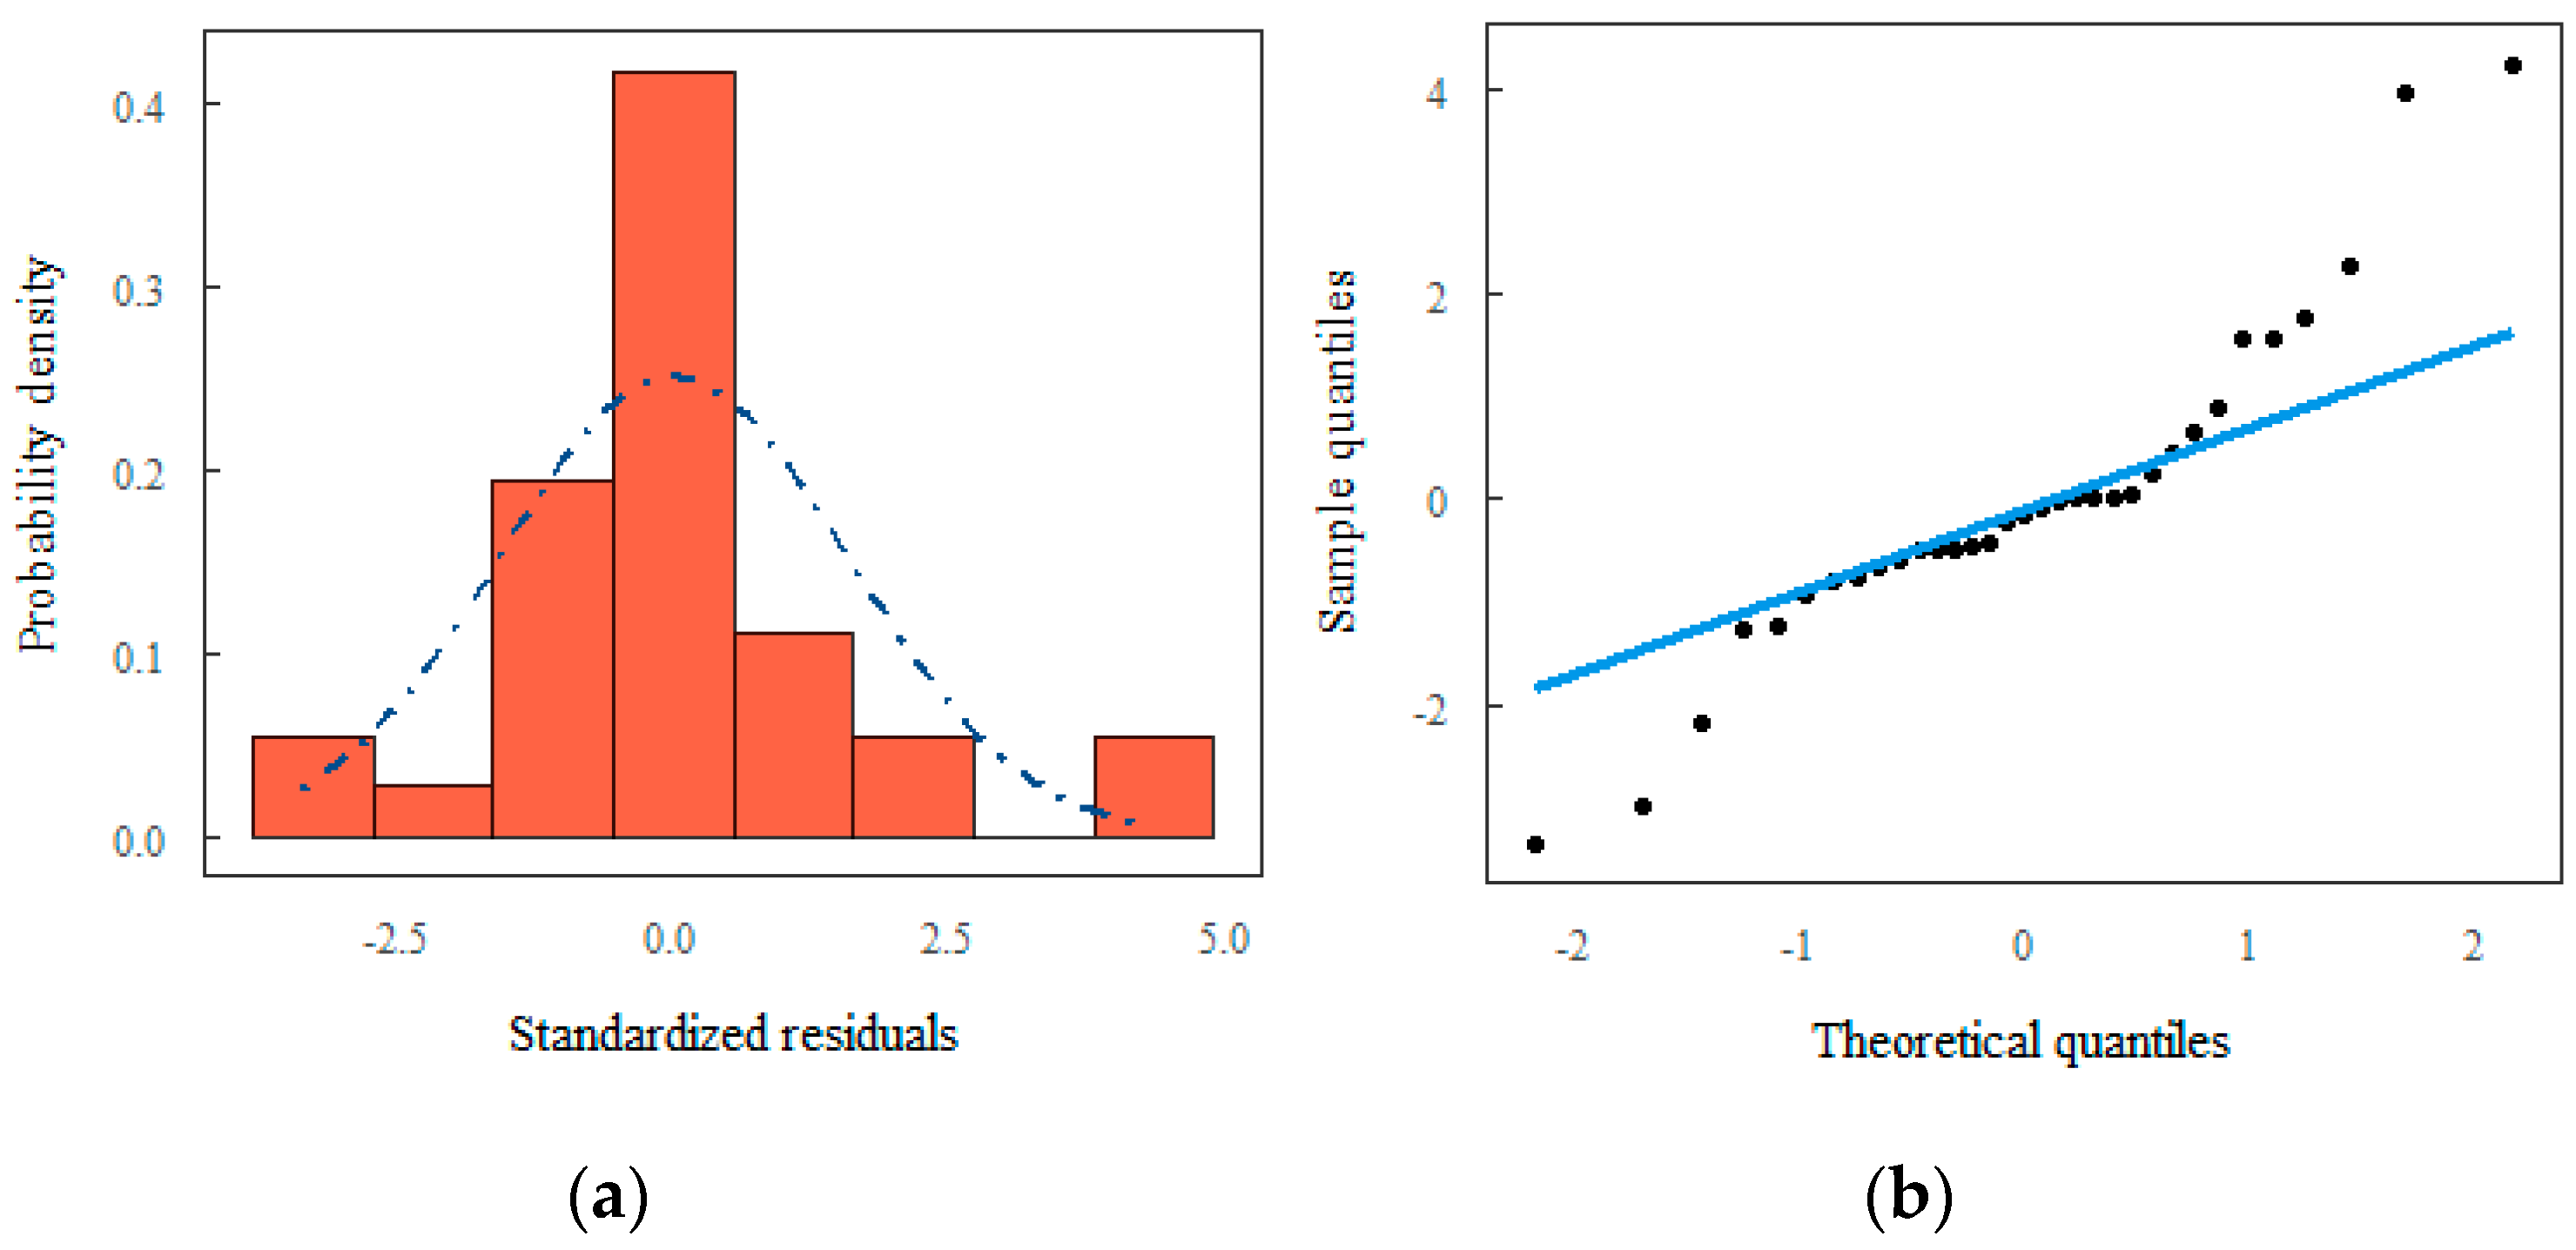
2.4. Statistical Tests

Descriptive and Analytical Statistics

Using the R Statistics software version 4.4.0 (Core Team, Vienna, Austria, 2024), a descriptive analysis of the data was carried out to understand the population and apply statistical tests [30,31]; additionally, a statistical analysis of the data obtained in the field was carried out, considering a significance level of 5% when carrying out the tests. To characterize the sampling distribution of the data set, measures of central tendency and dispersion were used. Measures of central tendency, or position measures, signal the middle of the data distribution (such as the mean, median, and mode) or other important points of the distribution (such as quartiles). Dispersion measures, on the other hand, point out the variability in the data (such as variance and standard deviation) [32,33].
Initially, the test was selected to check whether the sample values were compatible with the population they represented, thus having a normal distribution [30]. In this test, the distribution of sample data for each variable under study was evaluated, and it was verified whether the data for each fraction of urban solid waste from the collected sectors were parametric (have normal distribution) or non-parametric (do not have normal distribution).
The test selected was the Shapiro–Wilk (W test), as it calculates samples: 2 < n < 50. The test result was obtained by dividing the square of the appropriate linear combination of the sample’s ordered values by the estimated symmetric variance [30]. The test was performed, along with a probability distribution analysis (Q-Q plot), in addition to descriptive statistics of the data set.
After verifying the normality of both fractions, the parametric simple classification analysis of variance test (one-way ANOVA) was carried out, as well as the verification of the following hypotheses:
  • H0: the averages of the materials are the same.
  • H1: the averages of the materials are different.
This test compared the averages of organic and inert waste fractions from different sectors, evaluating the presence of statistically significant differences between them, with a confidence level of 95%. To conduct these tests, a critical analysis was carried out in which a limit of two standard deviations was established to identify and remove outliers, which are frequently found in environmental data sets. To deepen the understanding of the discrepancies observed between two specific means, the Tukey multiple comparison method was used. This involved defining several significance levels (α) to evaluate the most significant contrasts.

3. Results

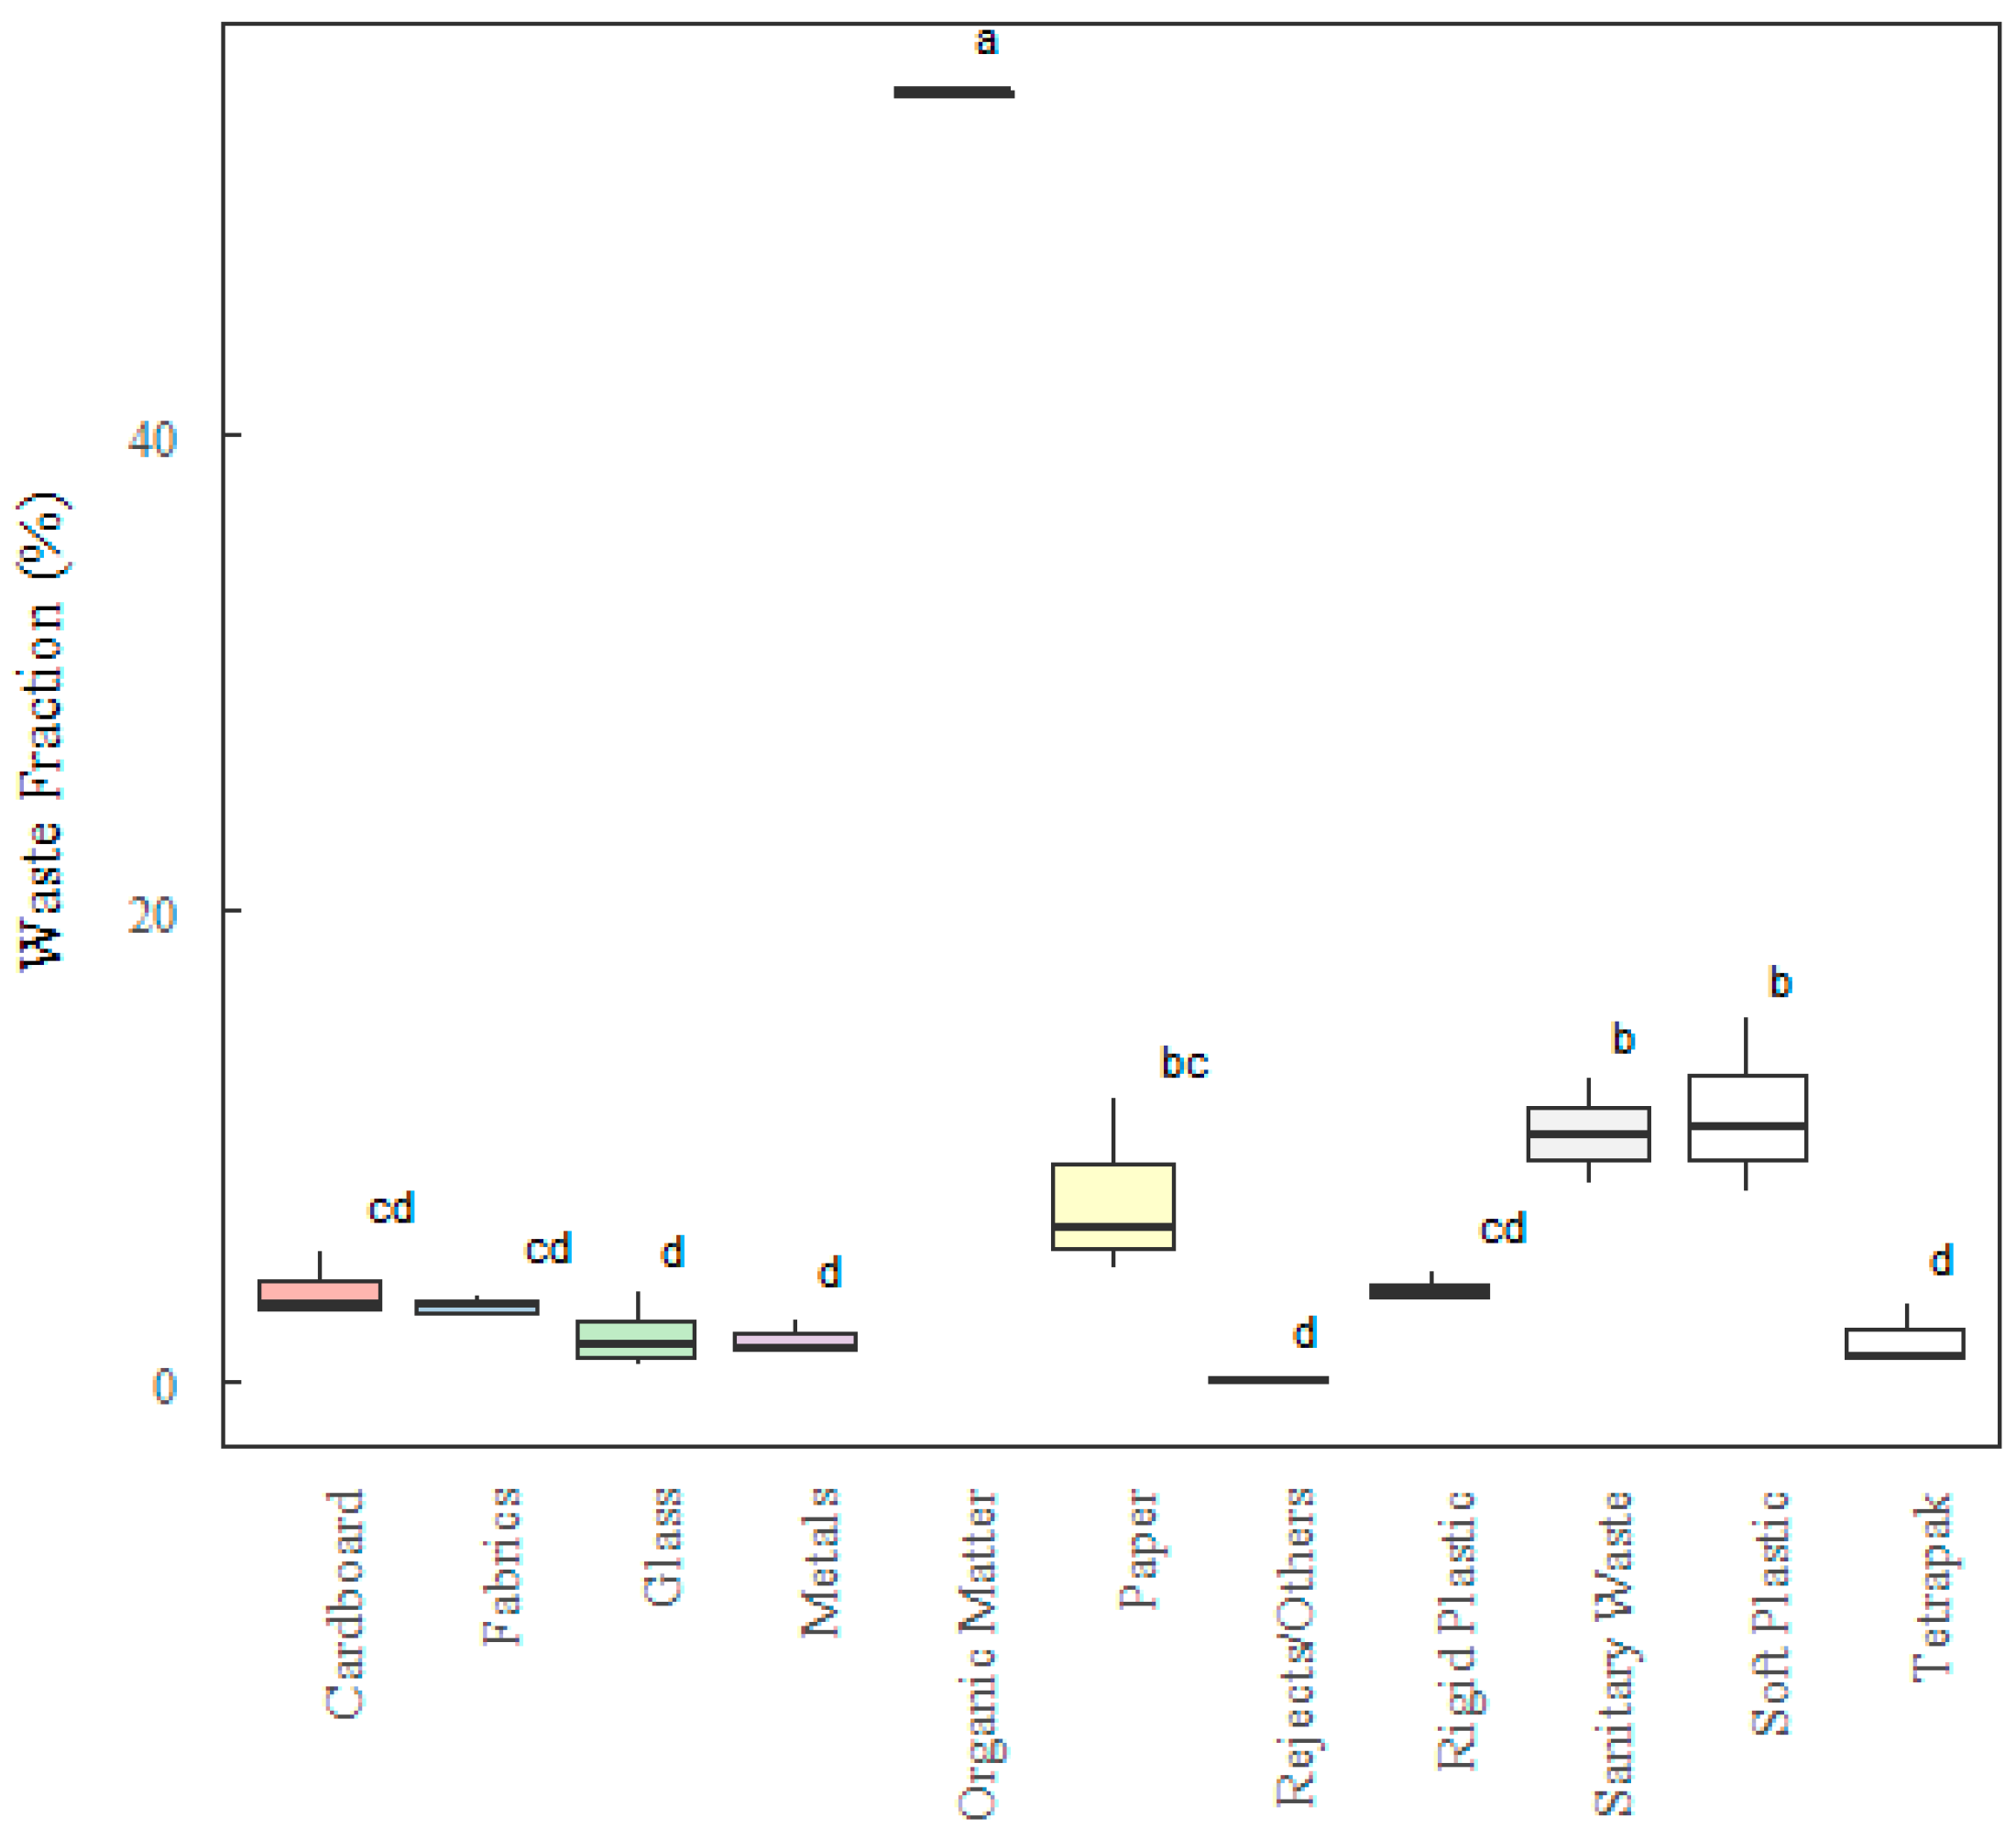
3.1. Analysis by Descriptive Statistics of Gravimetric Analysis

The composition of MSW is directly affected by a variety of factors: socioeconomic status, cultural conditions, eating habits, season, geographic location, etc. In Table 2, the results of the gravimetric analyses of MSW for the nine urban sectors of the municipality of Belém are illustrated, corresponding to the neighborhoods that were grouped according to socioeconomic classification and in Table 3, several statistical variables are calculated, such as mean, median, minimum, maximum, coefficient of variation, and standard deviation of the collected masses, which have already been described by Pereira et al. [29].
Analyzing the results obtained in the characterization, it was found that the fractions that presented the highest percentage in all nine sectors, that is, the most representative, were the organic ones, composed of food and pruning remains, ranging from 61, 12% to 49.45%, and sanitary waste consisting of (toilet paper, disposable diapers, surgical masks, etc.), varying between 20.34% and 8.25%, as shown in Table 2. Following these fractions, with the highest percentage, we have the recyclable fraction, such as paper ranging from (11.95% to 1.24%), cardboard from (5.89% to 1.87%), rigid plastic from (4.53% to 2.25%), and malleable plastic from (11.69% to 7.90%).
In relation to the results in Table 3, a greater deviation can be seen in the values referring to the fractions of paper ± 3.28, malleable plastic ± 2.38, organic matter ± 3.62, and sanitary waste ± 3.91. Lower values were found for the fractions of rigid plastic ± 0.65, metal ± 0.66, Tetra Pak ± 0.90, and cardboard ± 1.16. The heterogeneity of waste fractions across sectors makes the statistical data very sensitive to changes and the presence of outliers.
In general, it is possible to verify the proximity between the mean and median values (no difference above three units), which represents a good distribution of data within their minimum and maximum values. It is possible to verify, however, a proximity between the average values and the values of each composition, given that except for the “other” composition, the standard deviation value is always lower than the average value, which is an indicator of the homogeneity of the collected samples.
Comparing the results found in Table 2 and Table 3 for the different MSW fractions with the data reported by the Basic Sanitation Plan of the municipalities of Belém [24,27,31,34], it can be observed that the variation in the mass percentages of the different fractions is in line with those found in this study. When comparing the average data on the organic fraction obtained in this study with data from the Basic Sanitation Plan of the municipality of Belém [27], which are in the order of 51.34%, and from the research by [24] who, during the period from 2018 to 2022, developed a study of the per capita generation and gravimetric composition of urban solid waste in the municipalities that make up the Metropolitan Region of Belém, in the state of Pará, the proximity between such values can be seen, which were 51.2% for the municipality of Belém, demonstrating that discarding of waste irregularly is still a common practice [34].
Several researchers like Suthar and [22,35,36] have also reported similar results, that is, food/kitchen waste is the main constituent of household waste generated. For UNEP [37], food wastage in Brazil has still proven to be a common practice, with a rate of around 12 tons/year wasted and disposed of in landfills and/or dumps. Oliveira et al. [38] and Campos [39] highlighted that the aspect with the greatest influence on the per capita generation and composition of urban solid waste is the economic aspect, which is directly associated with the level of development of the region, since developed countries have greater amounts of recyclables and developing countries have greater amounts of organic matter.
In developing countries, most urban and rural populations still cook their daily meals in domestic kitchens and, generally, food waste (kitchen waste; organic fraction) is the main component of the MSW. According to Gupta et al. [40], the composition of solid waste in urban centers depends on a wide range of factors, such as housing, culture, lifestyle, climate, income, etc. According to a report published by [41], the bio-degradable fraction is the largest fraction of urban waste (38.6%), followed by inert materials (stones, bricks, ash, etc.; 34.7%), non-biodegradable (leather, rubber, bones, and synthetic material; 13.9%), plastic (6%), paper (5.6%), and glass (1.0%). The relative percentage of organic waste in MSW is generally linked to the socioeconomic level; thus, low-income families generate more organic waste than high-income families.
It is important to highlight that the comparative analysis of the gravimetric composition between some works can be questionable due to the use of different methodologies, covering areas with peculiar social, economic, and cultural characteristics or even due to the great variability in the classifications adopted.
Making comparisons with the bibliography researched by adding up the averages of materials destined for recycling and/or reverse logistics such as paper, cardboard, Tetra Pak, metals, aluminum, fabrics, and glass in the order of 29.87%, an approximation to the reference values of Menezes et al. [34] was found, who in their studies statistically analyzed the gravimetric composition of domestic solid waste in Juiz de Fora, Minas Gerais, depending on the seven urban regions of the municipality and the household income of the population, discovering values of 31.74% for recyclables. In relation to the fraction of contaminants such as inert materials (sanitary waste) and rejects, the sum of the averages of these values are 17.26% for this research and are in line with the values found by Belém [27], Da Silva et al. [24], and Menezes et al. [34] which were 13.39%, 12.5%, and 14.36%, respectively.
According to the Academy of Sciences of São Paulo (ACIESP) [42], a contaminant is any substance added to the environment that causes a deviation in its average geochemical composition, becoming a pollutant from the moment it causes an adverse effect on the environment. In addition, more broadly, Resolution No. 420/09 of the National Environmental Council (CONAMA) [43] defines contaminants as substances introduced into the environment through human activities, whose concentrations restrict the use of the natural resource for current or predicted uses.

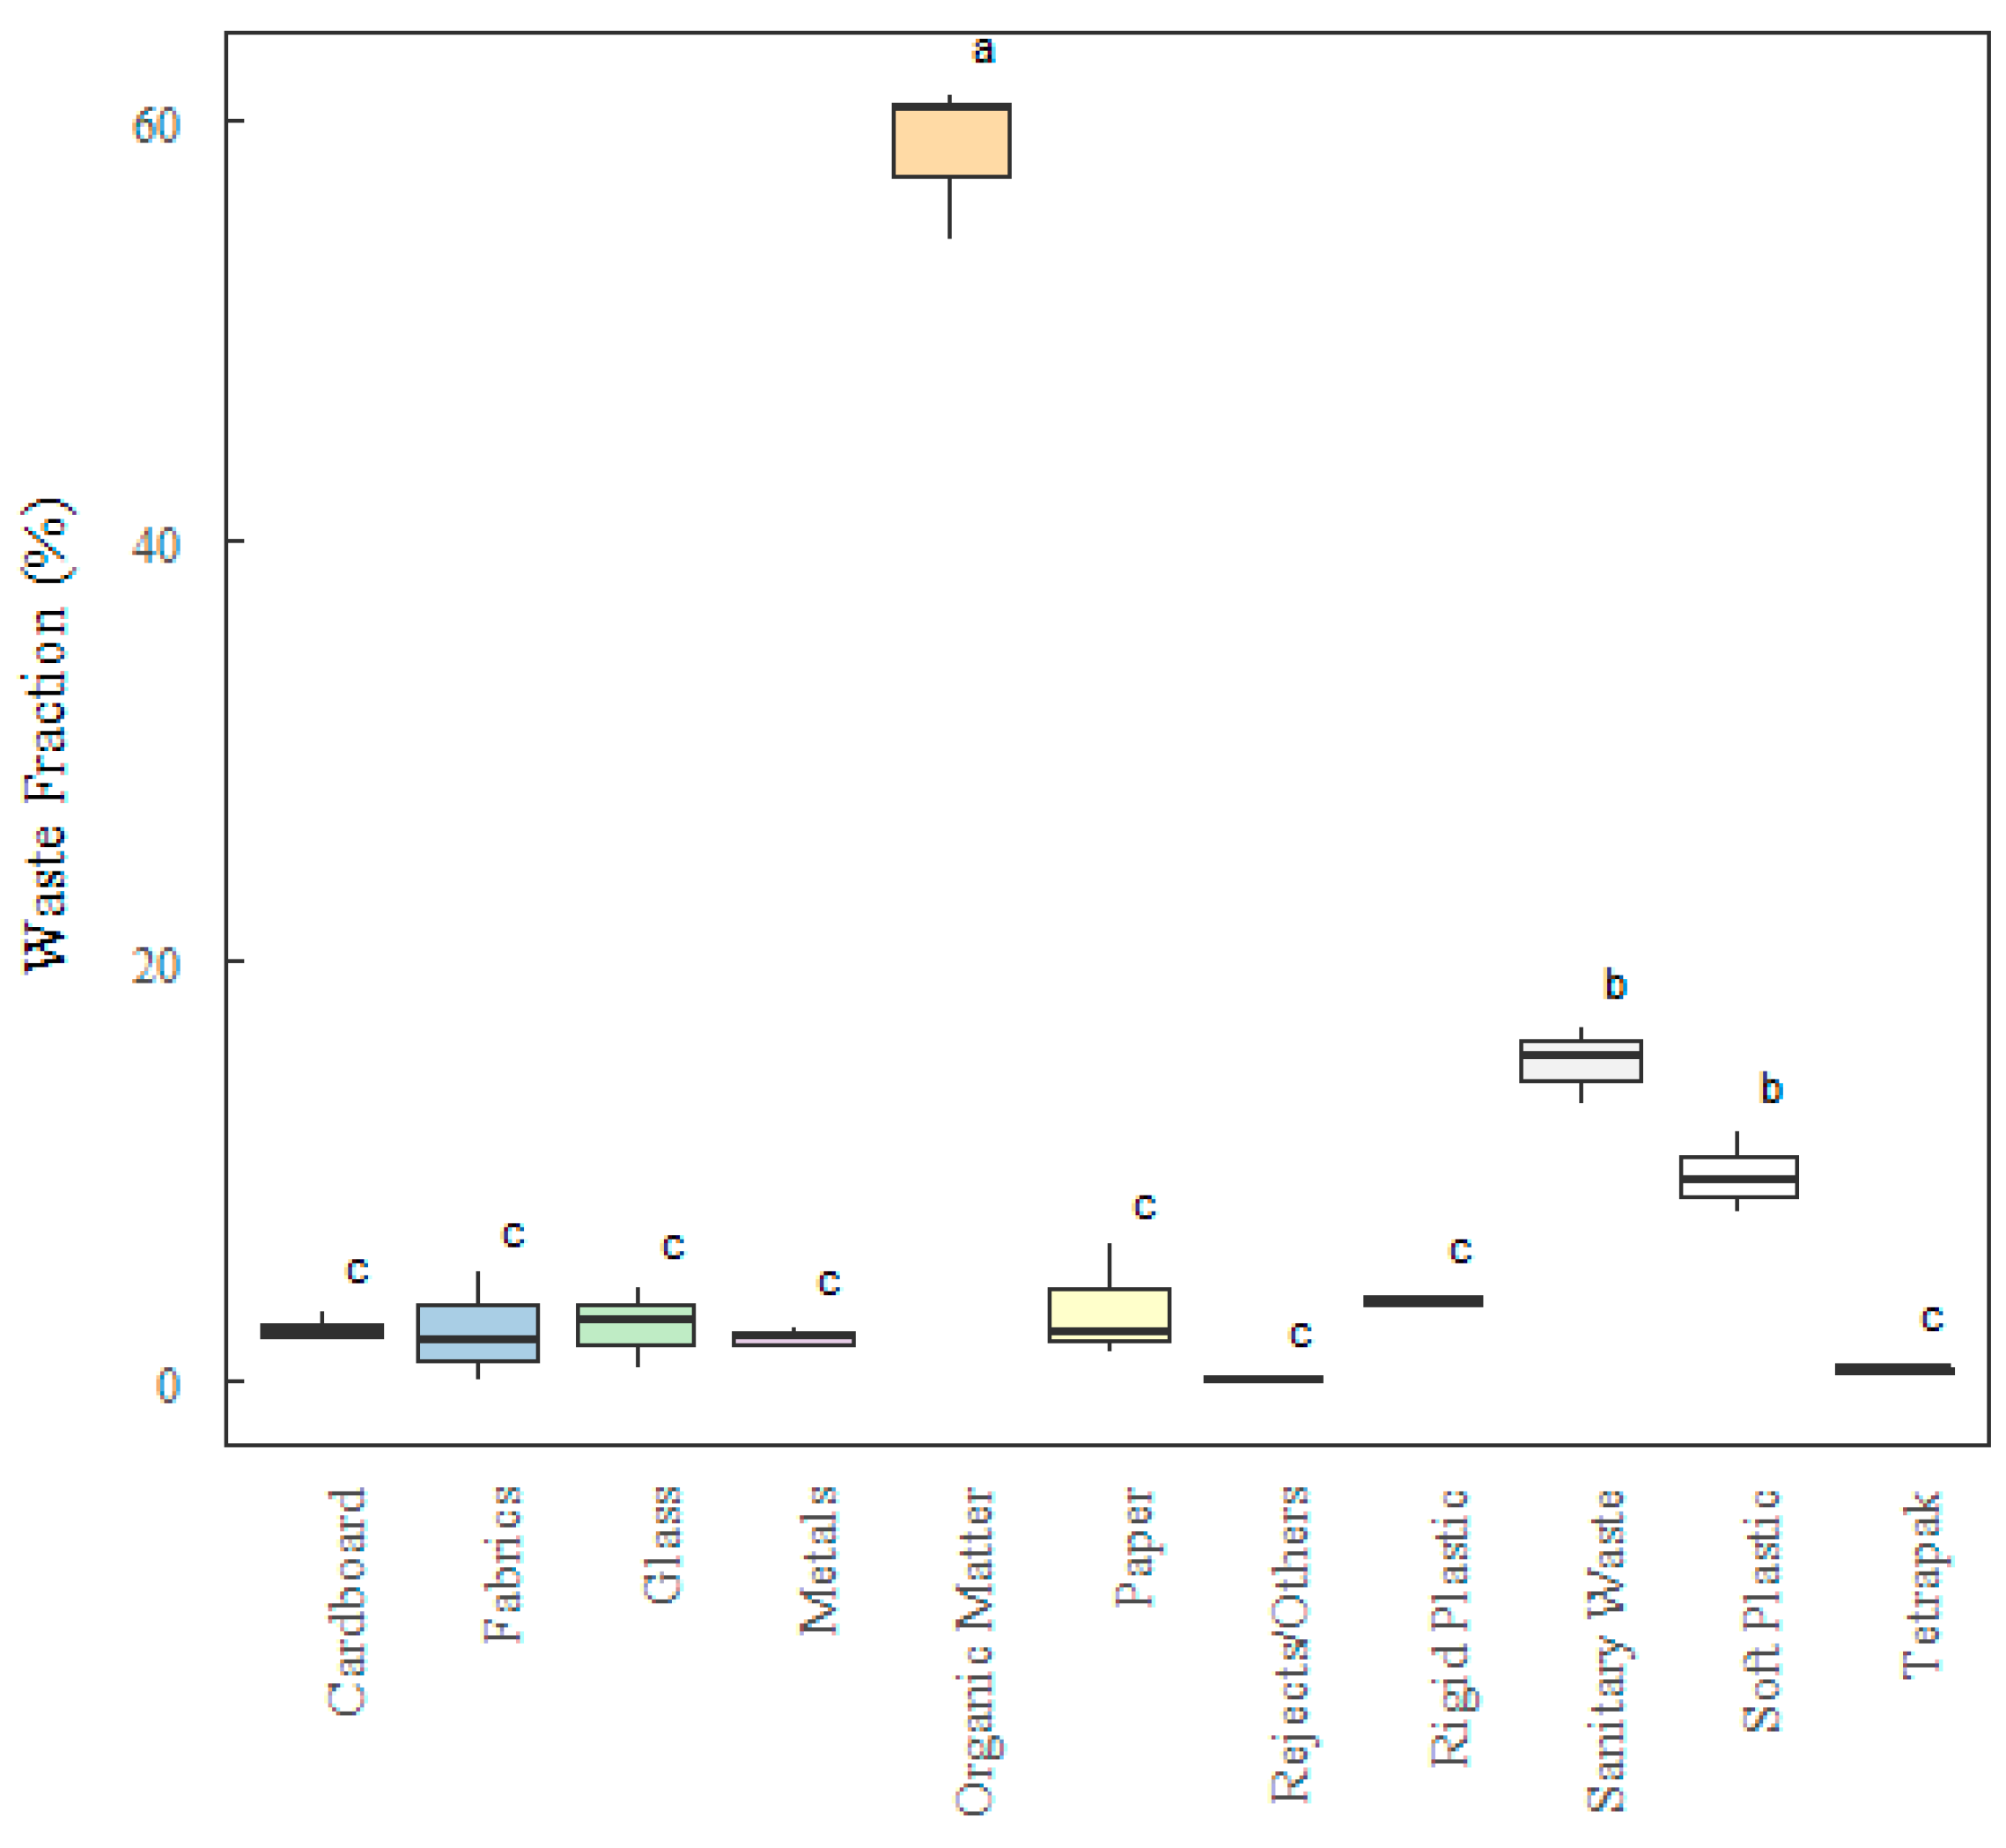
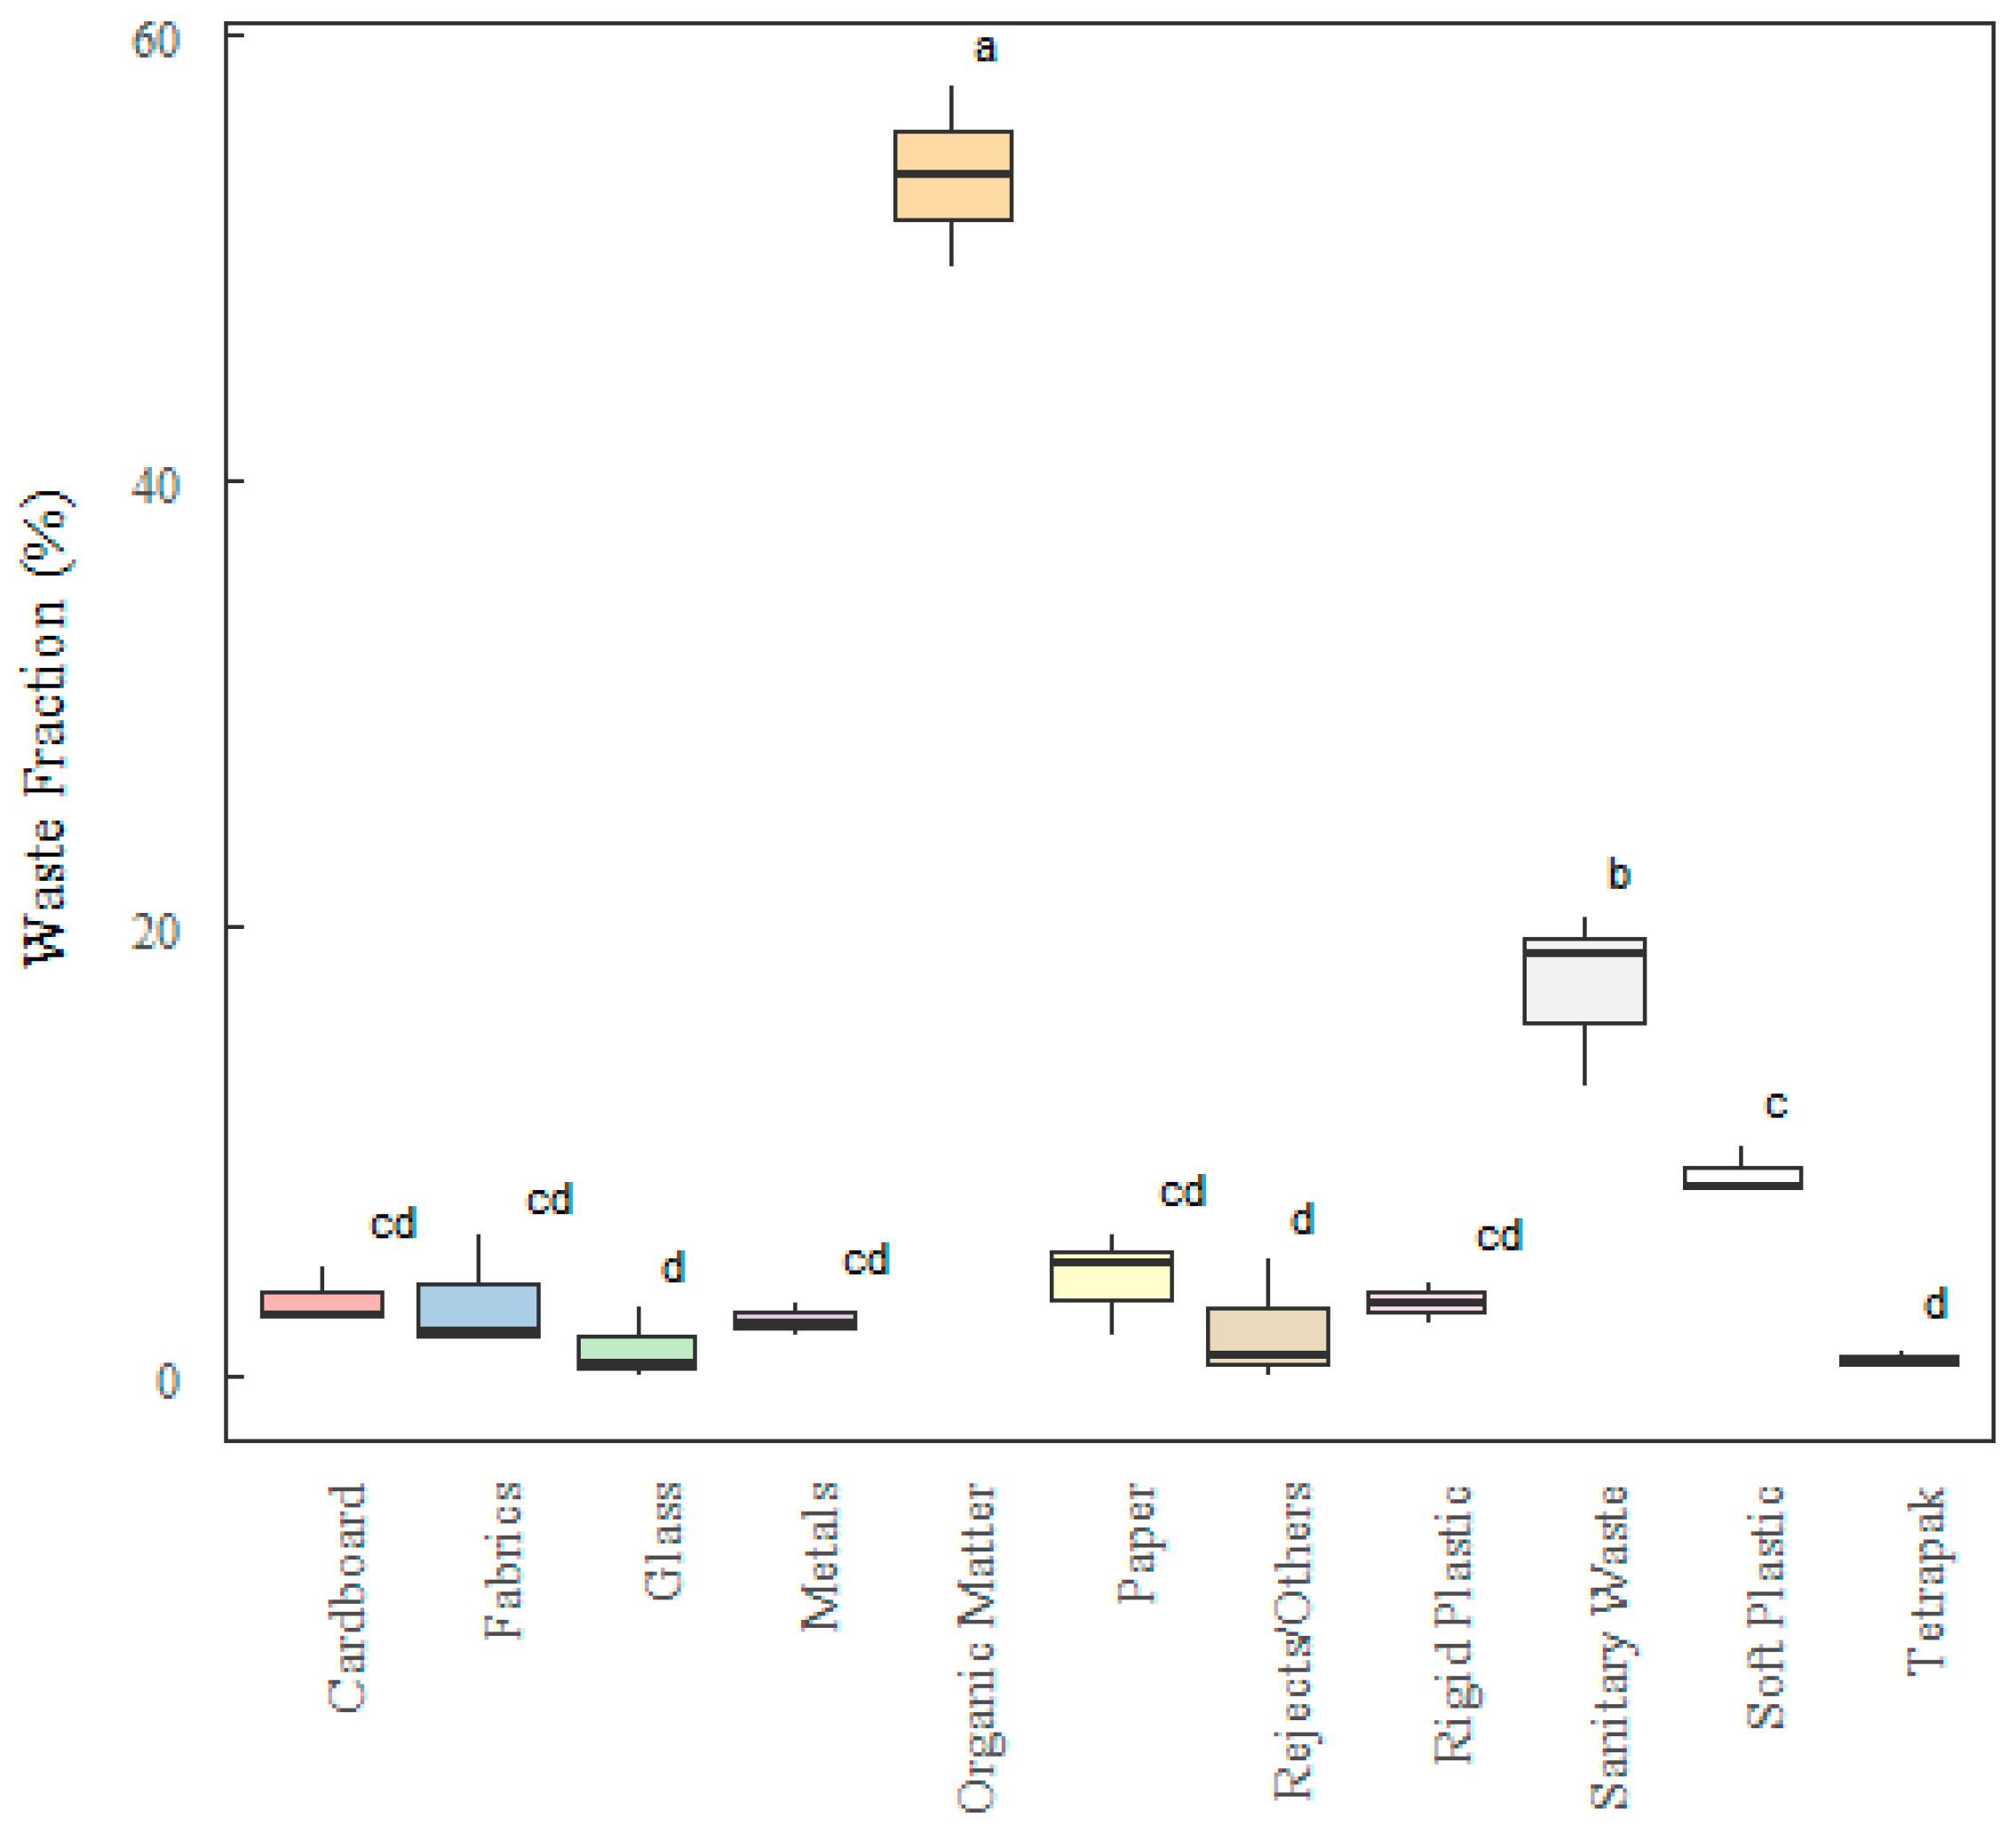
3.2. Analysis by Analytical Statistics (ANOVA and TUKEY Test)

Table 4 presents the result of the ANOVA applied to the percentage data of the types of materials in the gravimetric composition in relation to the total mass of the sample from the different socioeconomic groups (Regions 1, 2, and 3).
In Table 4, GL represents the degree of freedom and QM means the mean square. In both regions, the calculated F value was greater than the critical F, rejecting the null hypothesis that the percentage averages of the materials are equal at a significance level of 5%. The analysis of variance indicated that at least one of the materials has a different mean than the others. As a 95% confidence level was used in the analysis, the fact that the p-value is less than 0.05 demonstrates that the type of material is significant, that is, the influence on the percentage values of these materials in relation to the total mass of the samples.
Furthermore, the value of the coefficient of determination (R²) was 99.08%, 98.39%, and 98.89% for regions 1, 2, and 3, respectively, indicating that the percentage values in relation to the total mass of the sample are strongly explained by the variable “type of material”. The results of the statistical test demonstrate that the sample collected represents a normal distribution (p-value > 0.05) in all cases in which the test was performed. The ANOVA analysis of variance showed no significant difference between the means of the fractions at a 5% significance. Figure 4, Figure 5, Figure 6 and Figure 7 illustrate the histogram graphs and the quantile for the three regions.
It can be observed in both graphs that the residuals behave relatively like a normal bell-shaped curve and in the quantile graphs, the residual values fall along an approximately straight line, which contributes to the statement that the residuals are normally distributed.
Some studies used GenStat using the R Statistics software version 4.4.0, Core Team, 2024, as a computational tool to apply the ANOVA technique, aiming to find statistically significant relationships between waste produced by households in Wales and variables such as location, season, etc. [44]. The study found a maximum value for recyclable and compostable fractions of 65% and contained 62% biodegradable material. In Mexico, Gómez et al. [45] found fractions for organic waste of approximately 45% of all MSW generated and used the ANOVA technique to validate that there was no significant difference between the three socioeconomic levels. In the study of Menezes et al. [34], who carried out the gravimetric composition for seven regions that were classified according to socioeconomic stratification, the analysis of variance also did not indicate a significant difference between the means of the fractions at 5% significance.
Luizari [46] used the statistical test (ANOVA) to assess whether there was a significant difference between the density values of the household solid waste (MSW) categories in the four condominiums investigated and it can be concluded that there was no significant difference in the MSW density of the condominiums surveyed; therefore, statistically it can be concluded that there was no variation between the waste generated by the residents of the condominiums, based on the twelve samples analyzed.
To identify these differences in means between materials, the Tukey test was applied for multiple comparisons for each region. In Figure 7, for Region 1, the test identified three different groupings, one group formed only by organic matter (Group a) which had the highest average percentage value (58.57%), and another group formed by inert materials (15.04%) and soft plastic (Group b) (9.72%). Meanwhile, Group c was made up of materials with the lowest percentage representation in relation to the total mass of samples (hard plastics, fabric, glass, metal, paper, cardboard, and Tetra Pak and others), which ranged from 0.49% to 3.66%. Figure 7 illustrates the variation in percentage values of different materials within a 95% confidence interval.
The test identified five different groupings (Figure 8), one group formed only of organic matter (Group a) which had the highest average percentage value (58.6%), another group formed of inert materials (Group b) (17.3%), Group c formed of malleable plastic (8.92%), and Group cd which varied from 2.37% to 4.27%. Meanwhile, Group d was composed of materials with the lowest percentage representation in relation to the total mass of samples (waste, glass, and Tetra Pak), which ranged from 0.65% to 2.00%.
The same occurred for the values found in Figure 9, in which the test also identified five different groupings, one group being formed only by organic matter (Group a) which had the highest average percentage value (54.6%), and another grouping made up of malleable plastic and inert materials (Group b) (11.3%) and (10.4%), respectively. Another group formed was Group bc, composed solely of paper (7.7%), while Group cd was formed of hard plastic, cardboard and fabrics ranged from 3.11% to 3.87%. Finally, Group d comprised the materials with the lowest percentage representation in relation to the total mass of the samples (metal, waste, glass and Tetra Pak), which ranged from 1.68% to 1.89%.

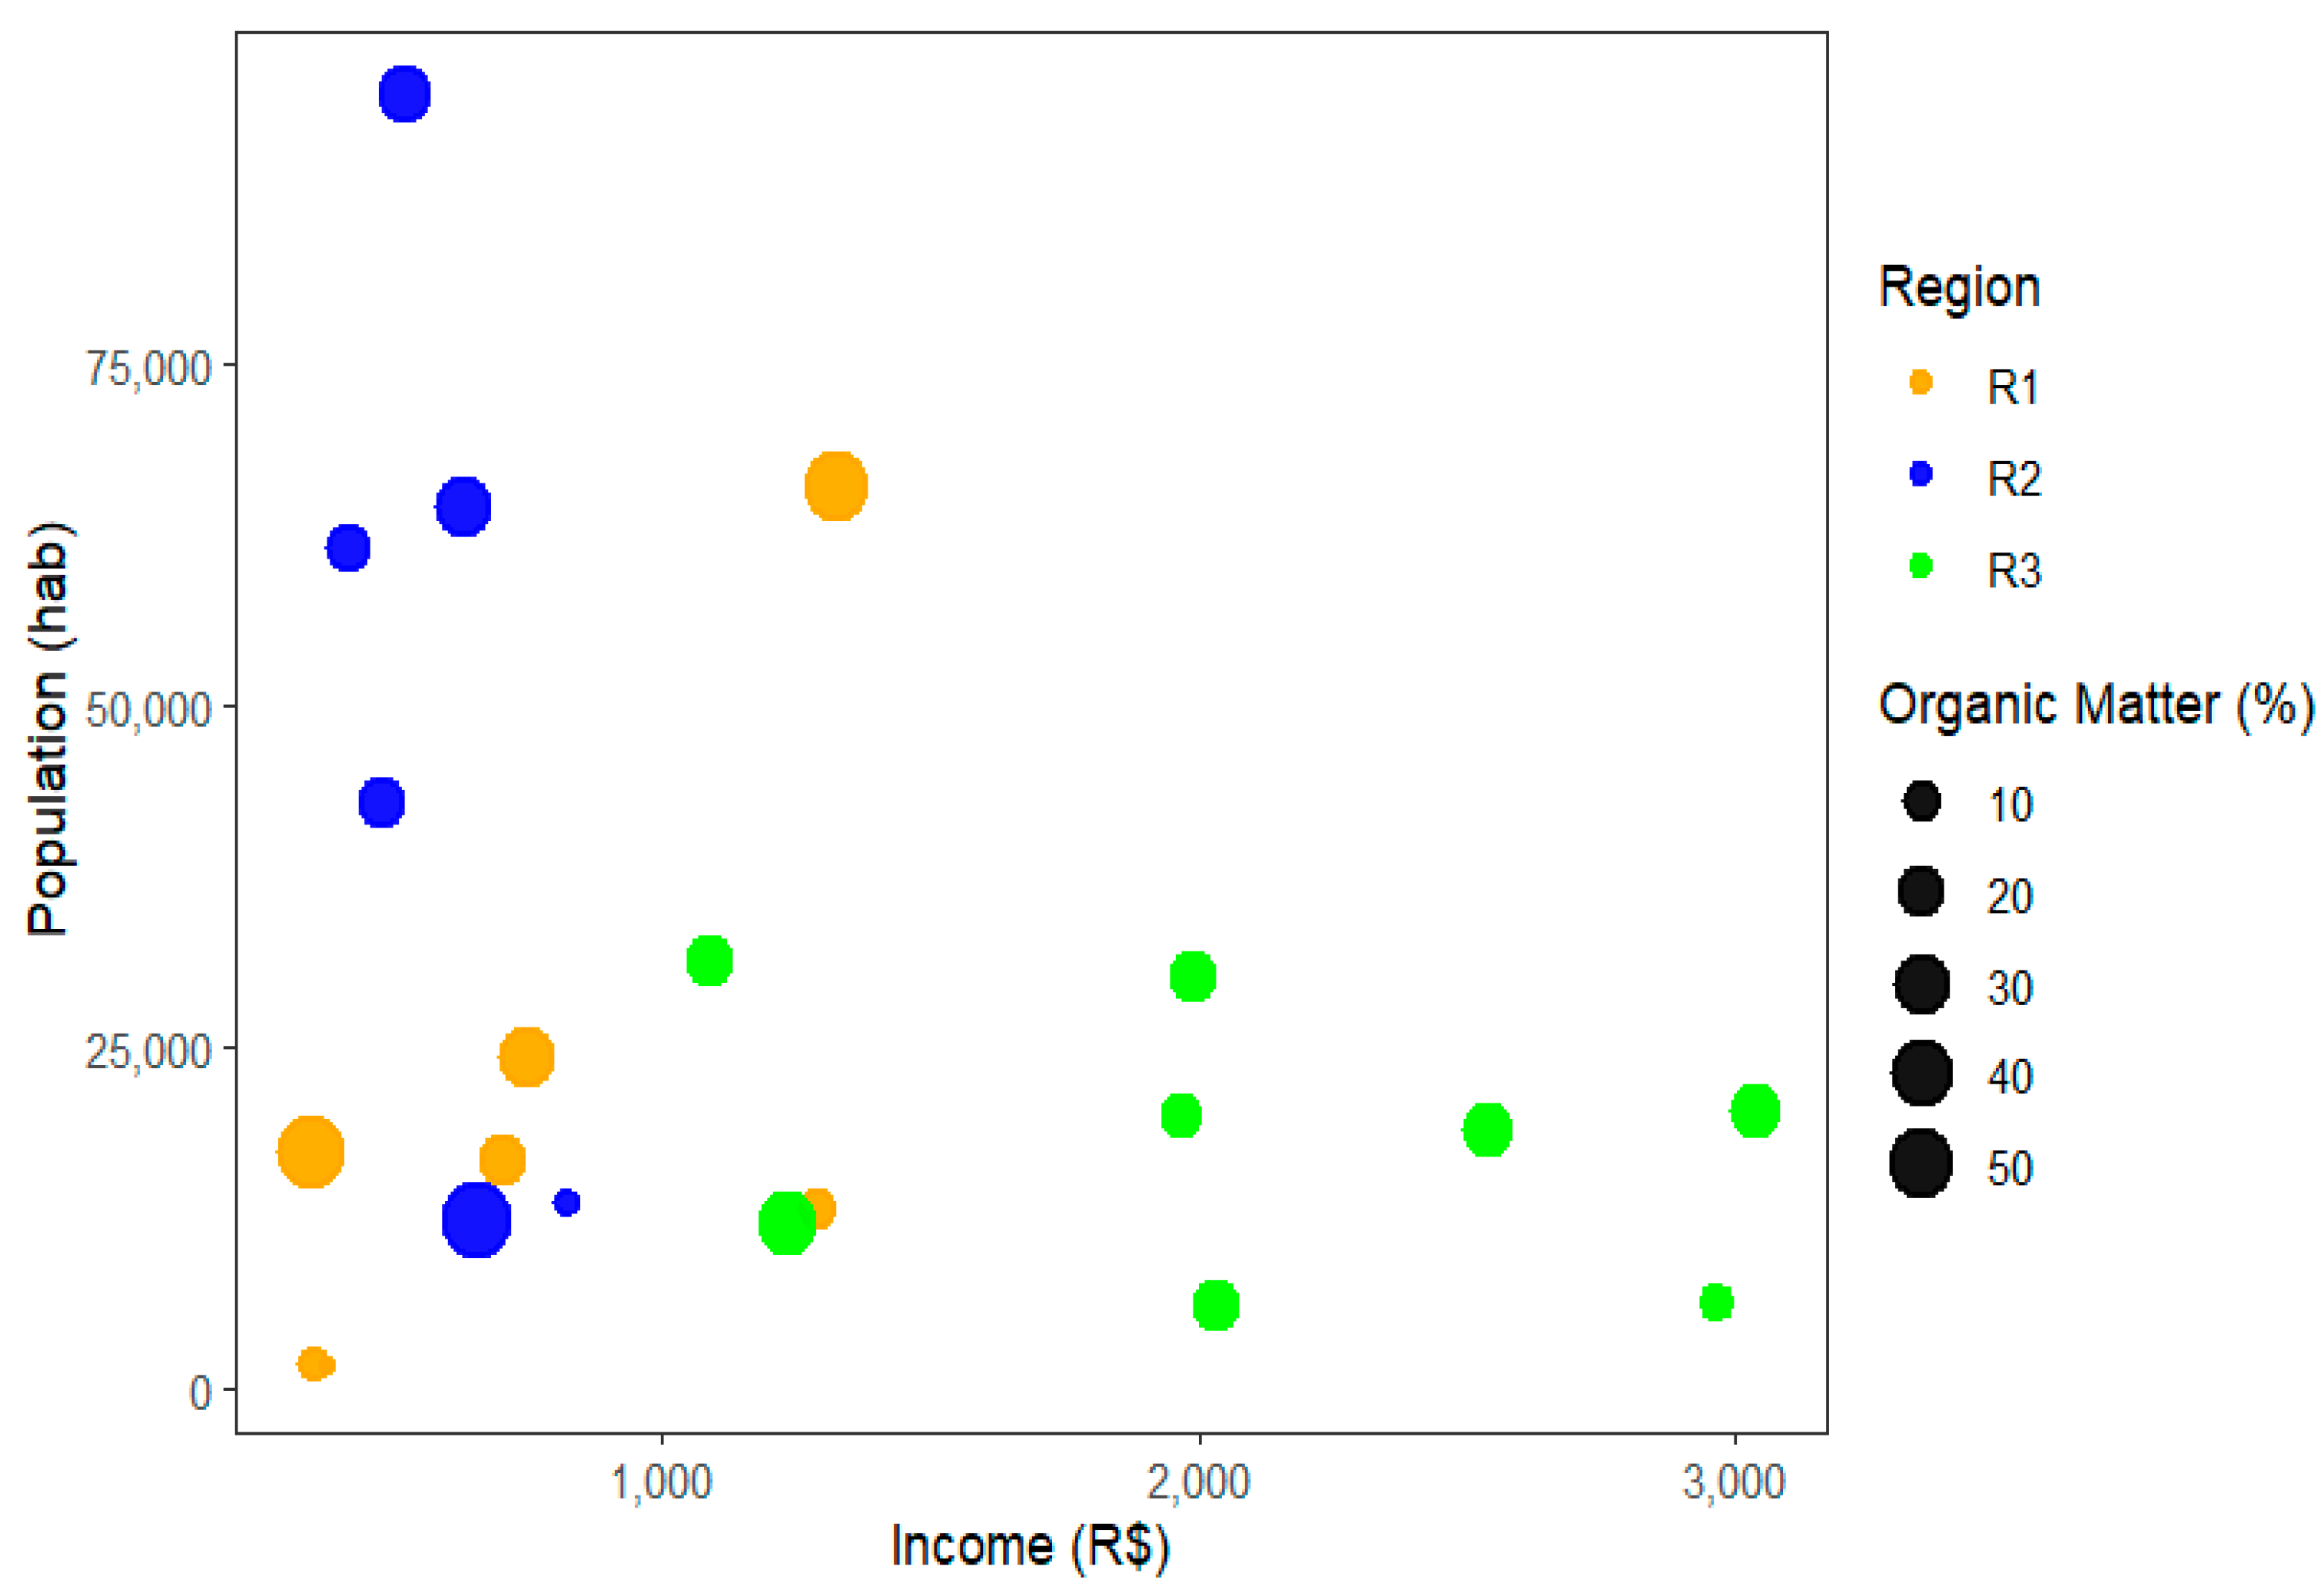
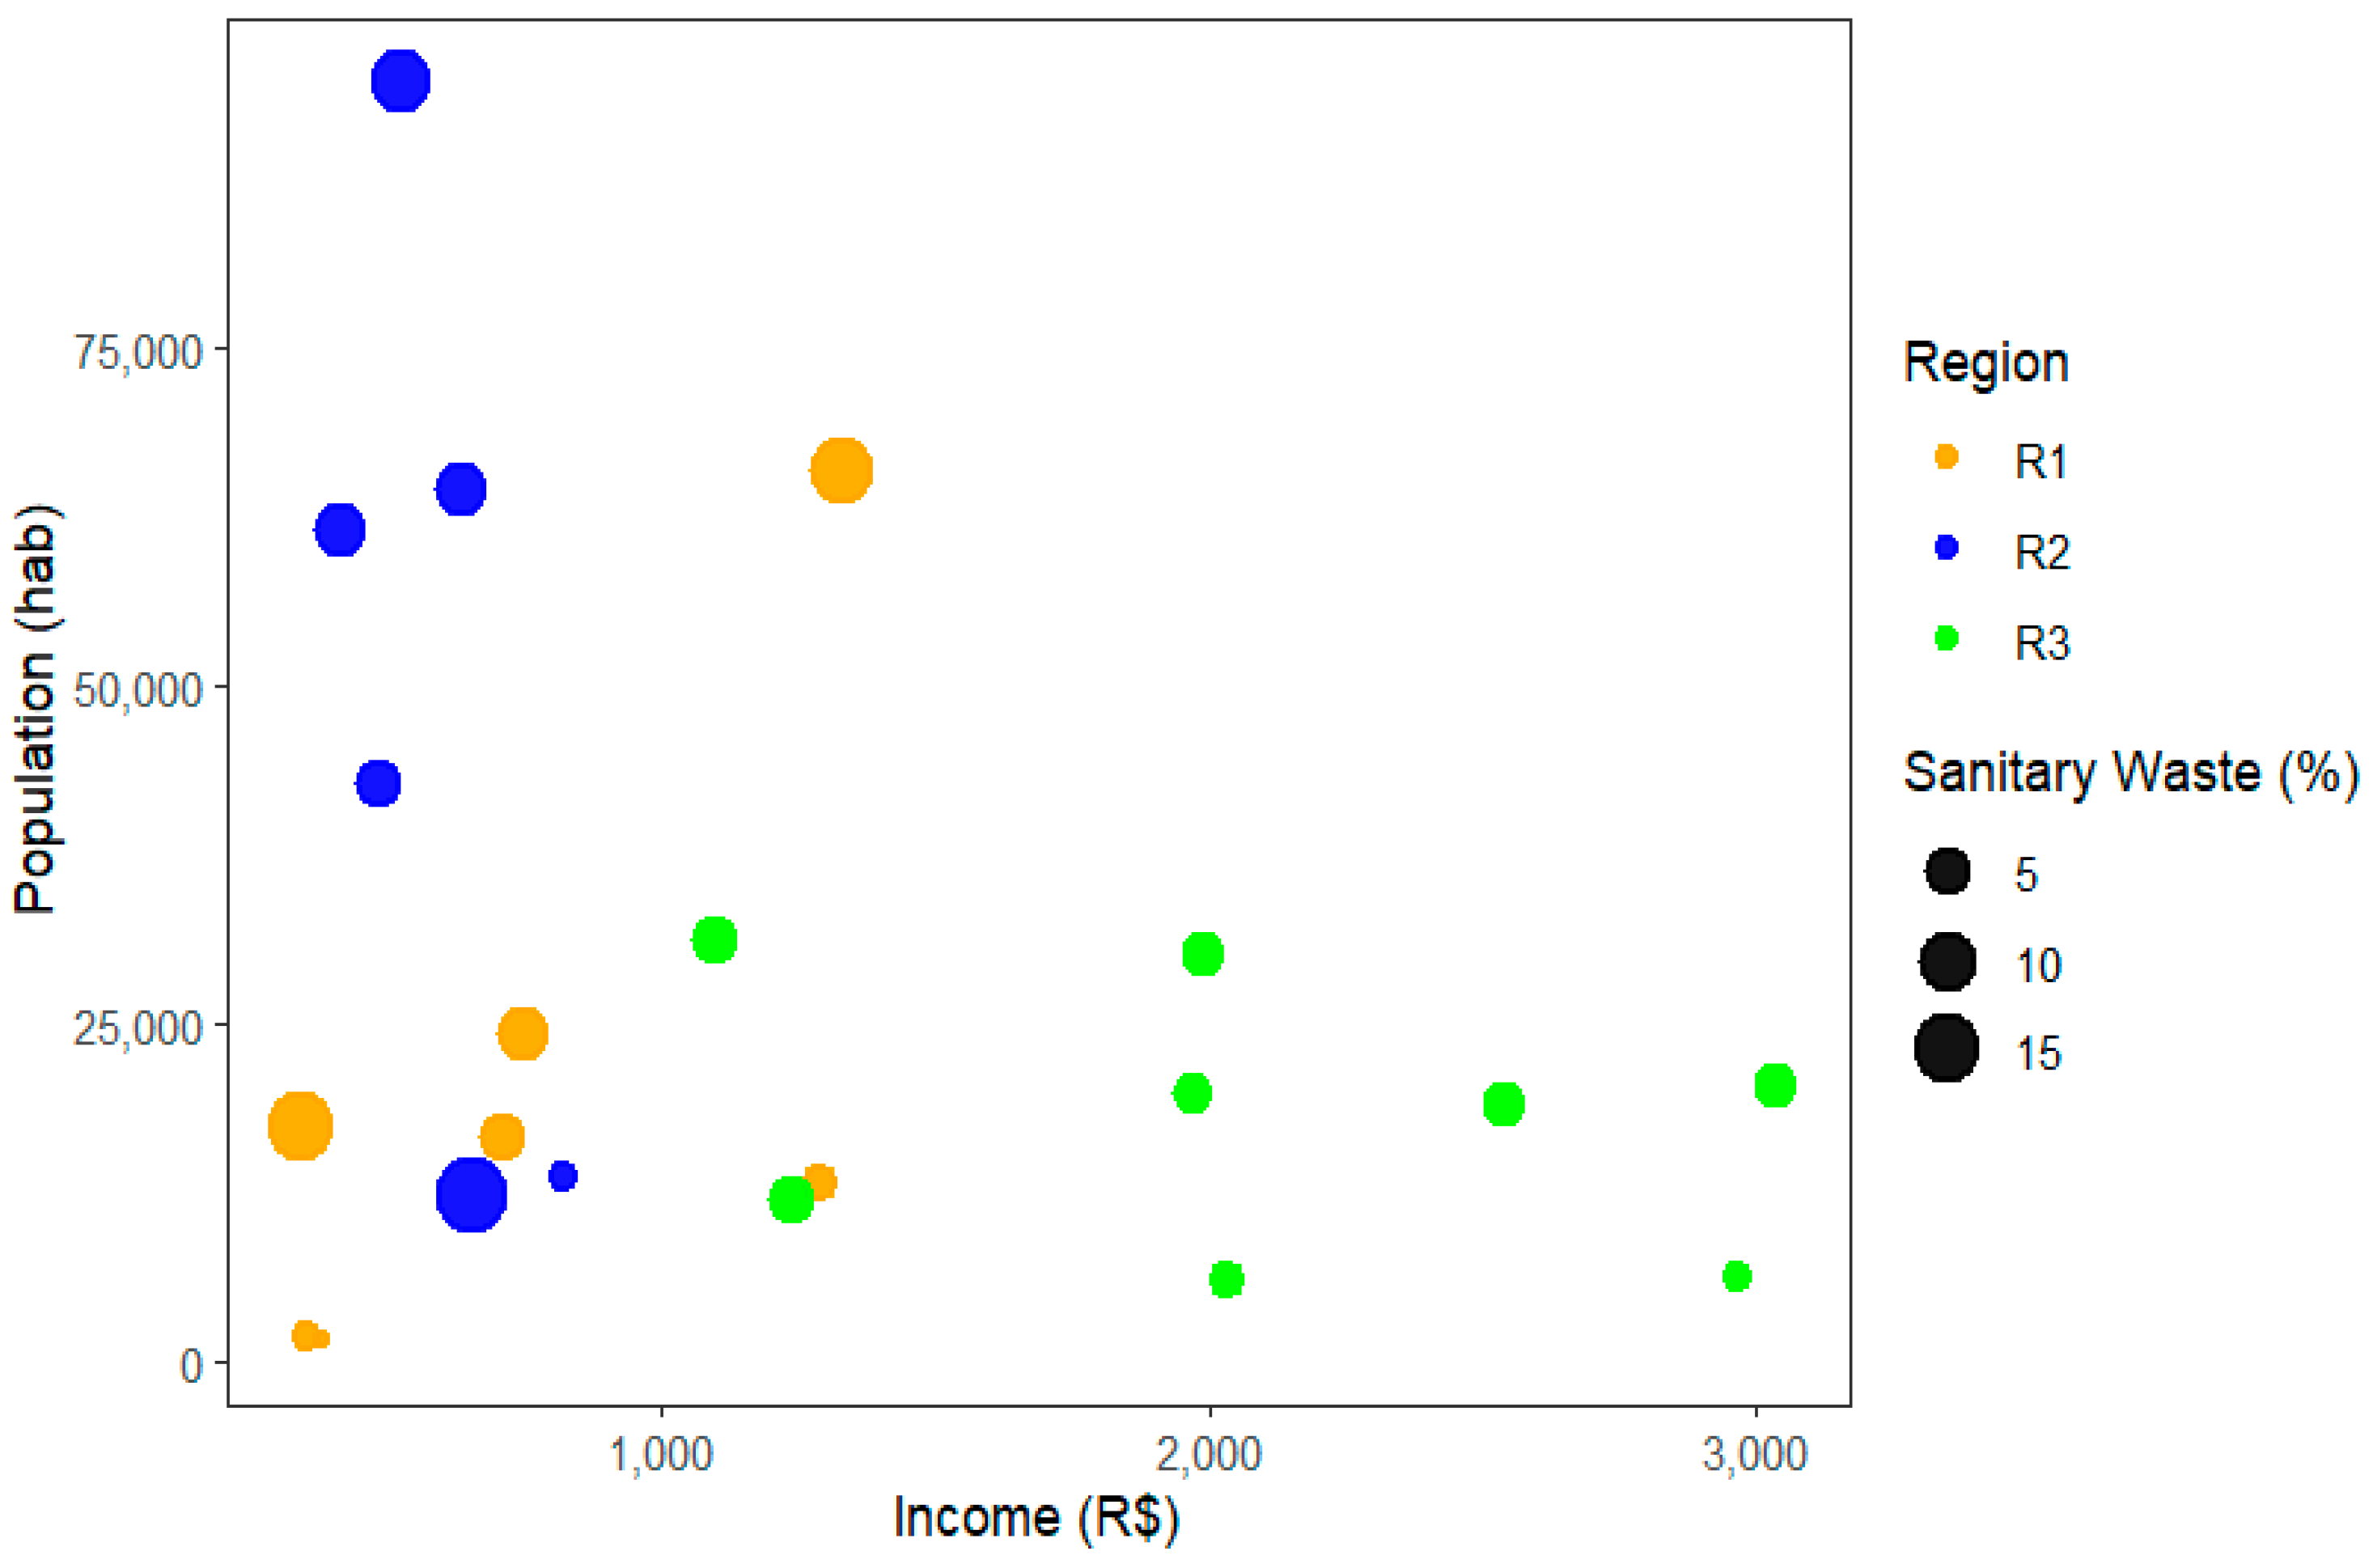
3.3. Analysis Based on Household Income

Due to the economic diversity between neighborhoods in the same region, it was decided to carry out an analysis based exclusively on this factor, considering the organic matter fraction, which stood out significantly among the fractions of urban solid waste collected. In Figure 10, the results of household income in the neighborhoods of the city of Belém/PA are graphically represented compared with the average nominal income from data from (IBGE, 2010) [28] and the fractions of organics collected from regions 1, 2, and 3, and classes E, D, and C, respectively. In general, higher incomes may be associated with greater waste generation. However, the sectors with higher incomes had lower organic fraction generation and a smaller population. It was observed that in region 1, income was less than R$1000, however, the fraction of organic matter did not grow with the increase in population. While in region 2, where income was less than R$1.500, the fraction of organic matter varied between 10% and 50%. In region 3, income varied between BRL 1.000 and BRL 3.000, with a smaller number of inhabitants and smaller fractions of organic material, showing a slight tendency to reduce the fraction of organic matter with increasing income and population.
The finding that the higher the income, the lower the organic fraction suggests that there is an association between people’s purchasing power and waste disposal patterns. People with higher incomes may have different consumption behaviors, such as purchasing processed foods, which may generate less organic waste. This result may also be because families with greater purchasing power normally do not eat their meals at home. Families with lower purchasing power typically have their meals cooked at home, justifying the high percentages of organics found in their waste [47].
This relationship can guide waste management strategies that consider the socioeconomic characteristics of the population. For example, in higher income areas, emphasis may be placed on the selective collection of recyclable materials. The consistency of these results with previous studies, such as those of Costa [48], provides additional validation of the observed relationship. This strengthens confidence in the identified patterns.
Based on the results, environmental awareness campaigns can be targeted at higher income classes to promote sustainable waste management practices. It is important to consider that the relationships between income and waste composition may vary regionally and culturally. Therefore, personalized approaches may be necessary. Longitudinal studies over time can provide a more dynamic understanding of changes in disposal patterns in response to socioeconomic factors. By integrating these observations into future waste management research and practices, it is possible to develop more accurate and effective strategies for dealing with variations in waste composition across different social strata. This contributes to the promotion of more sustainable practices that are aligned with the specific characteristics of the community in question.
The evaluation of the results of the characterization of urban solid waste revealed that the main average fractions of waste were organic and sanitary waste, representing, 55.6% and 14.4%, respectively, of the total waste analyzed. Region 1 had the highest percentage of organic (58.6%) and inert (15%) waste (Figure 11). The comparison of the means of the main fractions between the materials, through statistical analyses, revealed significant differences for each region. Based on the statistical analysis of the data, it is possible to infer that a region with greater purchasing power and fewer inhabitants tends to generate fewer organic materials. On the other hand, in areas with low-income families and more inhabitants, a greater presence of organic matter is observed. The high percentages of organic and inert waste indicate the potential for waste generation in the city, highlighting the disparity in the composition of waste in different areas, implying that waste management strategies must be adapted to the specific characteristics of each region. These inferences are valuable for guiding public policies, waste management practices, and awareness initiatives in the city. Understanding the relationships between socioeconomic and demographic characteristics and the composition of waste is fundamental to the development of sustainable and effective strategies.

4. Conclusions

The analysis of the results of the characterization of urban solid waste from the urban area of Belém served by Terraplena LTDA belonging to Lot 1 allowed us to verify that the majority of the fractions of waste in the city of Belém/PA were organic and inert, representing maximum values of 61.12% and 49.45% and minimum values of 20.34% and 8.25%, respectively, in the sectors where collections were made.
On average, 5.46% ± 1.86% of the MSW generated in the sectors of the urban area of Belém served by Terraplena LTDA consisted of material with the potential to be recycled and/or enter a reverse logistics route. Meanwhile, 14.26% ± 3.91% comprised inert materials (waste and/or low economic potential for recycling).
Based on the statistical analysis of the data, it can be concluded that the class C (R3) region with greater purchasing power and higher instructional level indicated a greater tendency toward the generation of recyclable materials. On the other hand, in regions where the families have low household income and were in educational level classes D (Region 2) and E (Region 1), there was a higher incidence of organic matter in the MSW.
No significant differences were found in the means of the majority fractions between the regions analyzed. This suggests that statistically the waste compositions in different regions of the municipality are similar, allowing the presentation of unique trend values for the entire municipality. No significant differences were also identified between the averages of these fractions in the analysis between social classes C, D, and E, indicating that at least at a statistical level, the waste compositions in these social classes are comparable. In summary, the results of the statistical analyses suggest homogeneity in waste compositions between different regions and social classes in the municipality. However, the focus on the high presence of organic, inert and recyclable materials highlights the urgency of efficient management to deal with these specific fractions, aiming at environmental sustainability and reducing the impact of waste in the municipality.

Author Contributions

The individual contributions of all the co-authors are provided as follows: G.P.C.d.S. contributed to the formal analysis and the writing—original draft preparation, investigation, and methodology; F.P.d.C.A. contributed to the formal analysis, investigation, and methodology; D.O.P. contributed to the investigation and methodology; J.F.H.F. contributed to the formal analysis and software analysis; J.C.M. contributed to the investigation and methodology; D.P.R.S. contributed to the investigation and methodology; H.R.B. contributed to the formal analysis; M.S.C.d.N. contributed to the investigation, methodology, and geographical information system; N.M.M. contributed to the investigation, methodology, and resources; I.W.d.S.B. contributed to the investigation and chemical analysis; A.O.M. contributed to the investigation and methodology; L.E.P.B. contributed to the chemical analysis and resources; J.A.R.P. contributed to the investigation, methodology, and resources; N.T.M. contributed to the supervision, conceptualization, and data curation. All authors have read and agreed to the published version of the manuscript.

Funding

This research received no external funding.

Institutional Review Board Statement

Not applicable.

Informed Consent Statement

Not applicable.

Data Availability Statement

Data are contained within the article.

Acknowledgments

I would like to dedicate this research to the memory of Hélio da Silva Almeida, who was Professor at the Faculty of Sanitary and Environmental Engineering/UFPa and passed away on 13 March 2021. His contagious joy, dedication, intelligence, honesty, seriousness, and kindness will always be remembered in our hearts.

Conflicts of Interest

The authors declare no conflicts of interest.

References

  1. Mutz, D.; Hengevoss, D.; Hugi, C.M.; Gross, T. Waste-to-Energy Options in Municipal Solid Waste Management. In A Guide for Decision Makers in Developing and Emerging Countries; GIZ: Eschborn, Germany, 2017. [Google Scholar]
  2. Yang, W.; Pudasainee, D.; Gupta, R.; Li, W.; Wang, B.; Sun, L. An overview of inorganic particulate matter emission from coal/biomass/MSW combustion: Sampling and measurement, formation, distribution, inorganic composition and influencing factors. Fuel Process. Technol. 2021, 213, 106657. [Google Scholar] [CrossRef]
  3. Associação Brasileira de Empresas de Limpeza Pública E Resíduos Especiais (ABRELPE). Panorama 2022; ABRELPE: São Paulo, Brazil, 2023. [Google Scholar]
  4. Legado da COP-30 para Belém vai Transformar a Vida da População e Beneficiar a Cidade. Agência Belém. 2023. Available online: https://agenciabelem.com.br (accessed on 24 November 2023).
  5. Brasil Ministério do Desenvolvimento Regional. Diagnóstico Temático do Manejo de Resíduos Sólidos Urbanos; SNIS: São Paulo, Brazil, 2022. [Google Scholar]
  6. Rajendran, N.; Gurunathan, B.; Han, J.; Krishna, S.; Ananth, A.; Venugopal, K.; Sherly Priyanka, R.B. Recent advances in valorization of organic municipal waste into energy using biorefinery approach, environment and economic analysis. Bioresour. Technol. 2021, 337, 125498. [Google Scholar] [CrossRef] [PubMed]
  7. Scarlat, N.; Motola, V.; Dallemand, J.F.; Monforti-Ferrario, F.; Mofor, L. Evaluation of energy potential of Municipal Solid Waste from African urban areas. Renew. Sustain. Energy Rev. 2015, 50, 1269–1286. [Google Scholar] [CrossRef]
  8. Kaza, S.; Yao, L.; Bhada-Tata, P.; Van Woerden, F. What a Waste 2.0: A Global Snapshot of Solid Waste Management to 2050; The World Bank: Washington, DC, USA, 2018. [Google Scholar]
  9. Wang, N.; Chen, D.; Arena, U.; He, P. Hot char-catalytic reforming of volatiles from MSW pyrolysis. Appl. Energy 2017, 191, 111–124. [Google Scholar] [CrossRef]
  10. Gouveia, N. Resíduos sólidos urbanos: Impactos socioambientais e perspectiva de manejo sustentável com inclusão social. Ciência Saúde Coletiva 2012, 17, 1503–1510. [Google Scholar] [CrossRef] [PubMed]
  11. Brasil, 2010. Lei Federal N° 12,305, de 2 de Agosto de 2010. Institui a Política Nacional de Resíduos Sólidos que Altera a Lei n° 9605, de 12 de Fevereiro de 1998; e Outros Arranjos. Presidencia de la Republica: Brasilia, Brazil, 2010. Available online: https://www.gov.br/planalto/pt-br (accessed on 15 August 2023).
  12. Purcell, M.; Magette, W.L. Prediction of household and commercial BMW generation according to socioeconomic and other factors for the Dublin region. Waste Manag. 2009, 29, 1237–1250. [Google Scholar] [CrossRef] [PubMed]
  13. Chang, Y.F.; Lin, C.J.; Chyan, J.M.; Chen, I.M.; Chang, J.E. Multiple regression models for the lower heating value of municipal solid waste in Taiwan. J. Environ. Manag. 2007, 85, 891–899. [Google Scholar] [CrossRef]
  14. Lin, C.J.; Chyan, J.M.; Chen, I.M.; Wang, Y.T. Swift model for a lower heating value prediction based on wet-based physical components of municipal solid waste. Waste Manag. 2013, 33, 268–276. [Google Scholar] [CrossRef]
  15. Ryu, C.; Shin, D. Combined heat and power from municipal solid waste: Status and issues in South Korea. Energies 2013, 6, 45–57. [Google Scholar] [CrossRef]
  16. Dahlén, H.; Pereira, A.; Lagerkvist, P.E.O.B. Inconsistent household waste trajectories. Waste Manag. 2009, 29, 1798–1806. [Google Scholar] [CrossRef]
  17. Vega, C.A.; Benítez, S.O.; Barreto, M.E.R. Solid waste characterization and recycling potential for a university campus. Waste Manag. 2008, 28 (Suppl. 1), S21–S26. [Google Scholar] [CrossRef]
  18. Streb, C.S.; Nagle, E.C.; Teixeira, E.N. Caracterização do resíduo sólido doméstico: Metodologia para avaliação do potencial de minimização. In Congresso Interamericano de Engenharia Sanitária e Ambiental; Anais: San Juan, Puerto Rico, 2004; Volume 29. [Google Scholar]
  19. Carneiro, P.F.N. Caracterização e Avaliação da Potencialidade Econômica da Coleta Seletiva e Reciclagem dos Resíduos Sólidos Domiciliares Gerados Nos Municípios de Belém e Ananindeua—PA. 2006. Dissertação (Mestrado em Engenharia Civil)—Programa de Pós-Graduação em Engenharia Civil (PPGEC), Instituto de Tecnologia (ITEC), Centro Tecnológico, Universidade Federal do Pará, Belém, 2006. Available online: http://www.repositorio.ufpa.br:8080/jspui/handle/2011/1899 (accessed on 15 August 2022).
  20. Drudi, K.C.R.; Drudi, R.; Martins, G.; Colato, G.; Tofano, A.J.; Leite, C. Statistical model for heating value of municipal solid waste in Brazil based on gravimetric composition. Waste Manag. 2019, 87, 782–790. [Google Scholar] [CrossRef]
  21. Nizami, A.S.; Shahzad, K.; Rehan, M.; Ouda, O.K.M.; Khan, M.Z.; Ismail, I.M.I.; Almeebi, T.; Basahi, J.M.; Demirbas, A. Developing waste biorefinery in Makkah: A way forward to convert urban waste into renewable energy. App. Energy 2017, 186, 189–196. [Google Scholar] [CrossRef]
  22. Singh, J.; Laurenti, R.; Sinha, R.; Frostell, B. Progress and challenges to the global waste management system. Waste Manag. Res. 2014, 32, 800–812. [Google Scholar] [CrossRef] [PubMed]
  23. Zhou, C.; Gong, Z.; Hu, J.; Cao, A.; Liang, H. A cost-benefit analysis of landfill mining and material recycling in China. Waste Manag. 2015, 35, 191–198. [Google Scholar] [CrossRef]
  24. Da Silva, R.C.P.; Costa, A.R.S.; El-Deir, S.G.; Jucá, J.F.T. Setorização de rotas de coleta de resíduos sólidos domiciliares por técnicas multivariadas: Estudo de caso da cidade do Recife, Brasil. Eng. Sanitária Ambient. 2020, 25, 821–832. [Google Scholar] [CrossRef]
  25. Mendonça, N.M.; Russo, M.A.T.; Penner, G.C.; Almeida, H.d.S.; Assunção, M.A.d.C.; Brandao, I.W.d.S.; Silva, R.H.Y.; Pereira, F.C.; dos Santos, F.V.; Machado, P.C.d.F.M.; et al. Monitoramento das Atividades Decorrentes do Plano Emergencial na Área da CPTR de Marituba (PA) para Ações do Tratamento do Lixiviado e de Emissão de Gases; Relatório Final do Estudo; Fundação de Amparo e Desenvolvimento da Pesquisa (FADESP): Belém, Brazil, 2021. [Google Scholar]
  26. Assunção, F.P.d.C.; Pereira, D.O.; Silva, J.C.C.d.; Ferreira, J.F.H.; Bezerra, K.C.A.; Bernar, L.P.; Ferreira, C.C.; Costa, A.F.d.F.; Pereira, L.M.; Paz, S.P.A.d.; et al. A Systematic Approach to Thermochemical Treatment of Municipal Household Solid Waste into Valuable Products: Analysis of Routes, Gravimetric Analysis, Pre-Treatment of Solid Mixtures, Thermochemical Processes, and Characterization of Bio-Oils and Bio-Adsorbents. Energies 2022, 15, 7971. [Google Scholar] [CrossRef]
  27. BELÉM. Lei Municipal nº 9.656, de 30 de dezembro de 2020. Institui a Política Municipal de Saneamento Básico do Município de Belém, o Plano Municipal de Saneamento Básico (PMSB), e o Plano de Gestão Integrada de Resíduos Sólidos (PGIRS), em Atenção ao Disposto no Art. 9º da Lei Federal nº 11.445/2007, Com as Atualizações Trazidas pela Lei nº 14.026/2020, o Novo Marco do Saneamento Básico, e dá Outras Providências. Belém, PA, 30 Dez. 2020. Available online: https://arbel.belem.pa.gov.br/legislacao/pmsb-plano-municipal-de-saneamento-basico/ (accessed on 24 May 2024).
  28. Instituto Brasileiro de Geografia e Estatística (IBGE). Censo Brasileiro de 2010; IBGE: Rio de Janeiro, Brazil, 2012. Available online: https://censo2010.ibge.gov.br/ (accessed on 1 August 2022).
  29. Pereira, D.O.; da Costa Assunção, F.P.; da Silva, J.C.C.; Ferreira, J.F.H.; Ferreira, R.B.P.; Lola, Á.L.; do Nascimento, Í.C.P.; Chaves, J.P.; do Nascimento, M.S.C.; da Silva Gouvêa, T.; et al. Prediction of Leachate Characteristics via an Analysis of the Solubilized Extract of the Organic Fraction of Domestic Solid Waste from the Municipality of Belém, PA. Sustainability 2023, 15, 15456. [Google Scholar] [CrossRef]
  30. Ayres, M. Elementos de Bioestatística, 2nd ed.; Supercores: Belém, Brazil, 2012. [Google Scholar]
  31. Al-Khatib, I.A.; Monou, M.; Abu Zahra, A.S.F.; Shaheen, H.Q.; Kassinos, D. Solid waste characterization, quantification and management practices in developing countries. A case study: Nablus district e Palestine. J. Environ. Manag. 2010, 91, 1131–1138. [Google Scholar] [CrossRef]
  32. Hair, J.F.; Black, W.C.; Babin, B.J.; Anderson, R.E.; Tatham, R.L. Análise Multivariada de Dados; ArtMed: Porto Alegre, Brazil, 2009. [Google Scholar]
  33. Field, A.P. Descobrindo a Estatística Usando o SPSS, 2nd ed.; ArtMed: Porto Alegre, Brazil, 2009. [Google Scholar]
  34. Menezes, R.O.; Castro, S.R.; Silva, J.B.G.; Teixeira, G.P.; Silva, M.A.M. Análise estatística da caracterização gravimétrica de resíduos sólidos domiciliares: Estudo de caso do município de Juiz de Fora, Minas Gerais. Eng. Sanitária Ambient. 2019, 24, 271–282. [Google Scholar] [CrossRef]
  35. Ojeda-Benítez, S.; de Vega, C.A.; Marquez-Montenegro, M.Y. Household solid waste characterization by family socioeconomic profile as unit of analysis. Resour. Conserv. Recycl. 2008, 52, 992–999. [Google Scholar] [CrossRef]
  36. Monavari, S.M.; Omrani, G.A.; Karbassi, A.; Raof, F.F. The effects of socioeconomic parameters on household solid-waste generation and composition in developing countries (a case study: Ahvaz, Iran). Environ. Monit. Assess. 2012, 184, 1841–1846. [Google Scholar] [CrossRef]
  37. Programa das Nações Unidas para o Ambiente (PNUMA). Índice de Desperdício Alimentar: Relatório 2021. 100p. Available online: https://www.unep.org/ptbr/resources/relatorios/indice-de-desperdicio-de-alimentos-2021 (accessed on 1 August 2023).
  38. Oliveira, S.A.; Leite, V.D.; Prasad, S.; Ribeiro, M.D. Estudo da produção per capita de resíduos sólidos domiciliares da cidade de Campina Grande-PB. Rev. Saúde Ambiente 2004, 5, 37–44. [Google Scholar]
  39. Campos, H.K.T. Evolution of income and per capita generation of solid wastes in Brazil. Eng. Sanit Ambient. 2012, 17, 171–180. [Google Scholar] [CrossRef]
  40. Gupta, S.; Mohan, K.; Prasad, R.; Gupta, S.; Kansal, A. Solid waste management in India: Options and opportunities. Resour. Conserv. Recycl. 1998, 24, 137–154, ISSN 0921-3449. [Google Scholar] [CrossRef]
  41. TERI. Impact of Population on Water and the Quality of Life; Project Report No. 1999d42. Submitted to United Nations Population Fund; The Energy and Resource Institute, TERI: New Delhi, India, 2002. [Google Scholar]
  42. ACIESP. Glossário de Ecologia; Publicação ACIESP nº57; Academia de Ciências do Estado de São Paulo (ACIESP): São Paulo, Brazil, 1987. [Google Scholar]
  43. Conselho Nacional do Meio Ambiente Brasil (CONAMA). Resolução nº 420 Brasil; Conselho Nacional do Meio Ambiente: Brasilia, Brazil, 2009. [Google Scholar]
  44. Burnley, S.J.; Ellis, J.C.; Flowerdew, R.; Poll, A.J.; Prosser, H. Assessing the composition of municipal solid waste in Wales. Resour. Conserv. Recycl. 2007, 49, 264–283. [Google Scholar] [CrossRef]
  45. Gomez, G.; Menesesa, M.; Ballinas, L.; Castells, F. Characterization of urban solid waste in Chihuahua, Mexico. Waste Manag. 2008, 28, 2465–2471. [Google Scholar] [CrossRef] [PubMed]
  46. Luizari, J.D. Análise da Geração e Composição dos Resíduos Sólidos Domiciliares: Estudo de Caso no Plano Piloto—DF. Monografia de Projeto Final; Departamento de Engenharia Civil e Ambiental, Universidade de Brasília: Brasília, Brazil, 2019; 100p. [Google Scholar]
  47. Suthar, S.; Singh, P. Household Solid Waste Generation and Composition in Different Family Size and Socio-Economic Groups: A Case Study. Sustain. Cities Soc. 2015, 14, 56–63. [Google Scholar] [CrossRef]
  48. Costa, L.E.B.; Costa, S.K.; Rego, N.A.C.; Silva Júnior, M.F. Gravimétrica dos resíduos sólidos urbanos domiciliares e perfil socioeconômico no município de Salinas, Minas Gerais. Rev. Ibero-Am. Ciênc. Ambient. 2012, 3, 73–90. [Google Scholar] [CrossRef]
Figure 1. Flowchart of the steps developed in the research.
Sustainability 16 05438 g001
Figure 2. Neighborhoods served by the company Terraplena in the municipality of Belém/PA.
Sustainability 16 05438 g002
Figure 3. Map of sectorization of the neighborhoods of Belém/PA belonging to Lot 1.
Sustainability 16 05438 g003
Figure 4. (a) Shapiro–Wilk test for Region 1; (b) Quantile-quantile (Q-Q) test for Region 1.
Sustainability 16 05438 g004
Figure 5. (a) Shapiro–Wilk test for Region 2; (b) Quantile-quantile (Q-Q) test for Region 2.
Sustainability 16 05438 g005
Figure 6. (a) Shapiro–Wilk test for Region 3; (b) Quantile-quantile (Q-Q) test for Region 3.
Sustainability 16 05438 g006
Figure 7. Variation in percentage values of materials in relation to the sample mass for Region 1.
Sustainability 16 05438 g007
Figure 8. Variation in percentage values of materials in relation to the sample mass for Region 2.
Sustainability 16 05438 g008
Figure 9. Variation in percentage values of materials in relation to the sample mass for Region 3.
Sustainability 16 05438 g009
Figure 10. Generation of organic matter from income and number of inhabitants.
Sustainability 16 05438 g010
Figure 11. Generation of sanitary waste (inert) from income and number of inhabitants.
Sustainability 16 05438 g011
Table 1. Determination of the grouping of sectors into regions.
Region ClassSectors Neighborhoods
1E1, 2 and 3Aurá, Águas Lindas, Curió-Utinga, Guanabara, Castanheira, Souza e Marco.
2D4, 5 and 6Canudos, Terra Firme, Guamá, Condor, Jurunas e Fátima.
3C7, 8 and 9Umarizal, São Brás, Cremação, Batista Campos, Nazaré, Reduto, Campina e Cidade Velha.
Table 2. Results of the gravimetric characterization for the nine sectors in relation to the percentage of the collected mass of waste, collected in the municipalities of Belém, state of Pará, between 4 November 2021 to 13 May 2022, Pereira et al. [29].
Class of MSWSectors
S1 (%)S2 (%)S3 (%)S4 (%)S5 (%)S6 (%)S7 (%)S8 (%)S9 (%)
Paper1.242.306.386.135.011.674.706.4511.95
Cardboard2.263.111.872.634.822.665.393.172.90
Tetra Pak0.310.680.480.340.630.990.920.873.25
Hard plastic3.723.293.982.254.103.254.533.373.70
Soft plastic7.9611.699.5010.158.448.1710.6615.257.90
Metal2.032.391.391.683.092.352.581.201.25
Organic matter61.1254.1560.4349.4553.7157.6154.3354.7954.55
Glass2.874.290.530.000.432.930.631.393.65
Sanitary waste16.6713.0015.4420.3412.7818.7812.7210.348.25
Fabrics1.815.100.001.876.171.583.553.172.60
Rejects/Others0.000.000.005.170.820.000.000.000.00
Total100100100100100100100100100
Table 3. Mean, standard deviation, median, variance, maximum, and minimum values of percentages of waste fractions collected in collection campaigns and gravimetric characterization results Pereira et al. [29].
Class of MHSWMean ± SDWeighted AverageMedianVarianceMaximumMinimum
Paper5.09 ± 3.285.355.0110.7611.951.24
Cardboard3.20 ± 1.163.402.901.355.391.87
Tetra Pak0.94 ± 0.900.640.680.813.250.31
Hard plastic3.58 ± 0.653.433.700.424.532.25
Soft plastic9.97 ± 2.3810.179.505.6815.257.90
Metal2.00 ± 0.662.062.030.433.091.20
Organic matter55.57 ± 3.6253.9454.5513.0961.1249.45
Glass2.09 ± 1.59 0.921.392.534.290.00
Sanitary waste14.26 ± 3.9115.3813.0015.2920.348.25
Fabrics2.87 ± 1.663.012.892.756.171.58
Rejects/Others0.67 ± 1.711.693.009.465.170.82
Table 4. ANOVA of gravimetric composition data from Regions 1, 2, and 3.
R1
(E)
GLSQ (Aj.)QM (Aj.)F-Valuep-ValueF-Critical
Factor108663.8866.28236.920.0002.297
Error2280.43.66
Total328744.2
R2
(D)
GLSQ (Aj.)QM (Aj.)F-Valuep-ValueF-Critical
Factor107209.2720.92134.420.0002.297
Error22118.05.36
Total327327.2
R3
(C)
GLSQ (Aj.)QM (Aj.)F-Valuep-ValueF-Critical
Factor107232.7723.27196.280.0002.297
Error2281.13.68
Total327313.8
Disclaimer/Publisher’s Note: The statements, opinions and data contained in all publications are solely those of the individual author(s) and contributor(s) and not of MDPI and/or the editor(s). MDPI and/or the editor(s) disclaim responsibility for any injury to people or property resulting from any ideas, methods, instructions or products referred to in the content.

