Article

Land Green Utilization Efficiency and Its Driving Mechanisms in the Zhengzhou Metropolitan Area

School of Resources and Environment, Shandong Agricultural University, Taian 271000, China
*
Author to whom correspondence should be addressed.
These authors contributed equally to this work.
Sustainability 2024, 16(13), 5447; https://doi.org/10.3390/su16135447
Submission received: 10 March 2024 / Revised: 13 June 2024 / Accepted: 17 June 2024 / Published: 26 June 2024

Abstract

:
Improving land green use efficiency is of great significance for promoting high-quality economic development and promoting the modernization of harmonious coexistence between humans and nature. In this study, the super-efficiency SBM model with non-expected output was used to measure the level of land green use efficiency at county scale in the Zhengzhou metropolitan area from 2005 to 2020. Based on this, the spatio-temporal evolution and spatial agglomeration characteristics were analyzed. Finally, the driving mechanisms were revealed by using the geographical detector model. The results were as follows: (1) From 2005 to 2020, the land green use efficiency of the Zhengzhou metropolitan area fluctuated from 0.5329 to 0.5164, with an average annual decline rate of 0.21%, exhibiting three stages: decline, rise, then another slight decline. At the city level, Luohe City had the highest land green use efficiency, while Zhengzhou City had the lowest. (2) The land green use efficiency of the Zhengzhou metropolitan area showed a significant spatial positive correlation, Moran’s I index increased from 0.1472 to 0.2991, and the spatial agglomeration effect was continuously enhanced. On the local scale, high-high (H-H) aggregation and low-low (L-L) aggregation were dominant, high-high (H-H) aggregation areas were mainly distributed in the southwest and southeast of the Zhengzhou metropolitan area, and low-low (L-L) aggregation areas were mainly distributed in the central and western parts of the Zhengzhou metropolitan area. (3) There is heterogeneity in the degree of influence of different driving factors on land green use efficiency in the Zhengzhou metropolitan area, which is ranked as topographic relief (X7) > forest coverage rate (X8) > social consumption (X6) > industrial structure (X3) > urbanization rate (X2) > economic development (X1) > industrial added value scale (X5) > financial expenditure (X4). q values were 0.1856, 0.1119, 0.1082, 0.0741, 0.0673, 0.0589, 0.0492 and 0.0430, respectively. The interaction of two factors can enhance the explanatory power of land green use efficiency in the Zhengzhou metropolitan area. Except for the interaction of topographic relief and forest coverage rate, the other factors all show double factor enhancement. The explanatory power of the interaction between topographic relief and urbanization rate is the strongest, at 0.3513. In the future, policy regulation should be carried out from the perspectives of the interaction of social and economic conditions such as improving forest coverage rate, improving consumption power, optimizing industrial structure and improving land green use mechanisms to promote the improvement of land green use efficiency.

1. Introduction

According to the 14th Five-Year Plan for National Economic and Social Development of the People’s Republic of China and the Outline of the 2035 Vision Goals, it is necessary to realize new progress in ecological civilization, accelerate the green transformation of development, and comprehensively improve the efficiency of resource utilization. Under the guidance of this series of new concepts, new ideas and new strategies, ecological protection and high-quality development in the Yellow River Basin has been elevated to a national strategy, and land use is a core element in the process of ecological protection and high-quality development [1]. As a key hub of modernization in the development process of the Yellow River Basin, Zhengzhou metropolitan area, located in the Central Plains, faces the problems of resource and environmental carrying capacity constraints and low land use efficiency, and urgently needs to transform its development from the current high-pollution, broad-extent and low-efficiency paradigm to intensive conservation, green development, and high efficiency. Therefore, it is imperative to realize the green use of land in Zhengzhou metropolitan area, and provide strategic support for building a demonstration area of ecological protection and high-quality development in the Yellow River Basin, which is of great significance for the integrated development of the Central Plains urban agglomeration and the high-quality development of the Yellow River Basin.
At present, research on land green use efficiency mainly focuses on the measurement of efficiency, the selection of an evaluation index, and the analysis of driving factors. In terms of efficiency measurement, stochastic frontier analysis (SFA) and data inclusion Analysis (DEA) are mainly used at present. SFA is a method of measuring the efficiency of statistical data. The effective frontier is determined by measuring the minimum input of DMU, and the influence of random factors on production efficiency is considered. For example, some scholars [2] calculated the land use efficiency of 284 cities in China from 2009 to 2016 by using the SFA method, taking into account the existence of technical inefficiencies and random errors, and concluded that land use efficiency in China was not high and showed a decreasing trend from east to west. The traditional DEA method assumes that all production units operate on the same production frontier, and there are no technical inefficiencies and random errors, but it cannot further compare multiple objects at the frontier. For example, Song et al. [3] used the DEA model to measure the land use efficiency of county urban areas in the Beijing-Tianjin-Hebei city cluster from 2009 to 2017, and found that there were significant differences in the mechanism of different factors. The super-efficiency DEA model introduces the construction of relaxation variables, and combines the traditional DEA model and the super-efficiency model to form a super-SBM model. It can not only measure the undesired output, but also deal with the case of DMU being 1. Luo and Li [4] used the Super SBM method to analyze the temporal and spatial characteristics and influencing factors of land use efficiency in China’s provinces under the influence of carbon emissions from 2003 to 2016, and put forward corresponding countermeasures according to the difference factors of land use efficiency and inefficiency in different regions.
In terms of the index system, scholars mostly measure the input index composed of population, capital and land [5] and the output index containing non-expectations. Liang et al. [6] calculates the urban land green use efficiency of 284 cities at the local level in China. It is believed that the state of spatial agglomeration in China can be divided into high-value agglomeration areas, high-value heterogeneous areas, low-value heterogeneous areas, and low-value agglomeration areas, and there is broad scope for optimizing and improving land green use efficiency. This paper makes a useful contribution on the basis of the existing input index theory. The output index of the existing studies mainly considers economic benefit, ecological benefit, and comprehensive industrial pollution. For example, Ding et al. [7] take three types of industrial waste as the non-expected output of environmental pollution, indicating that the green land use efficiency of resource-based cities in the Yellow River Basin has spatial heterogeneity, and the overall change trend is not obvious. However, few studies included PM2.5 concentration [8], which reflects urban air quality and sustainable development, into the index system of non-expected output. Studies on driving factors focus on two main aspects. The first is the combined effect of multiple influencing factors. Existing studies mainly build an index system including economic, industrial, environmental, and other influencing factors. Hu Bixia et al. [9] considered the influencing mechanism of a combination of multiple complex factors such as policy, urbanization, scale, society, structure, and environment on urban land use efficiency. The second is the role of a single influencing factor. For example, Lu Xinhai et al. [10] established a spatial error model to show that compact traffic development has a significant positive impact on land green use efficiency. Based on the differential model, Jiang et al. [11] empirically found that low-carbon pilot policies have a positive effect on land green use efficiency. Few studies have introduced natural conditions into the impact factor index system based on China’s undulating terrain [12].
To summarize the existing studies, the following shortcomings can be found: (1) In the calculation of land use efficiency, the traditional envelope analysis DEA model is often used, which does not fully consider whether the communication factors between different cities have the same frontier. In addition, the efficiency results measured are affected by the units used for input and output items. As a relatively perfect DEA expansion model, the super-efficiency SBM model can solve these problems well by taking relaxation variables into account [13]. (2) In the construction of the index system, the existing index system is not intuitive enough to reflect the concept of sustainable, green and high-quality development. Fine particulate matter (PM2.5) is an important component of air pollution and has a significant impact on green development. However, most of the current studies focus on the relationship between PM2.5 and land type factors and economic factors, and there are relatively few studies to analyze the role of PM2.5 in land green use change, which needs further in-depth discussion. (3) In the exploration of a variety of influencing factors, the primary focus is on human factors, with little attention to the impact of natural conditions on land green use efficiency. (4) In terms of research areas, with the deepening of regional economic development and industrial division of labor and cooperation in China, land green use efficiency will further reflect regional characteristics. However, most of the existing literature covers a broad research area and lacks empirical research on a specific region to provide more targeted policy suggestions and strategic support. There are even fewer studies on Zhengzhou metropolitan area from the county perspective.
In summary, with reference to the existing research results, this paper takes 120 counties in Zhengzhou metropolitan area from 2005 to 2020 as the research object, builds an “economic-social-ecological” integrated land green use efficiency measurement system based on the super-efficiency SBM model, and uses spatial autocorrelation analysis to deeply explore the spatio-temporal characteristics and evolution process of land green use efficiency. Finally, the influence of driving factors of regional land green use efficiency was analyzed by using the geographical detector model, and the specific path to accelerate the development of Zhengzhou metropolitan area as a demonstration area of ecological protection and high-quality development in the Yellow River Basin was further clarified.

2. Materials and Methods

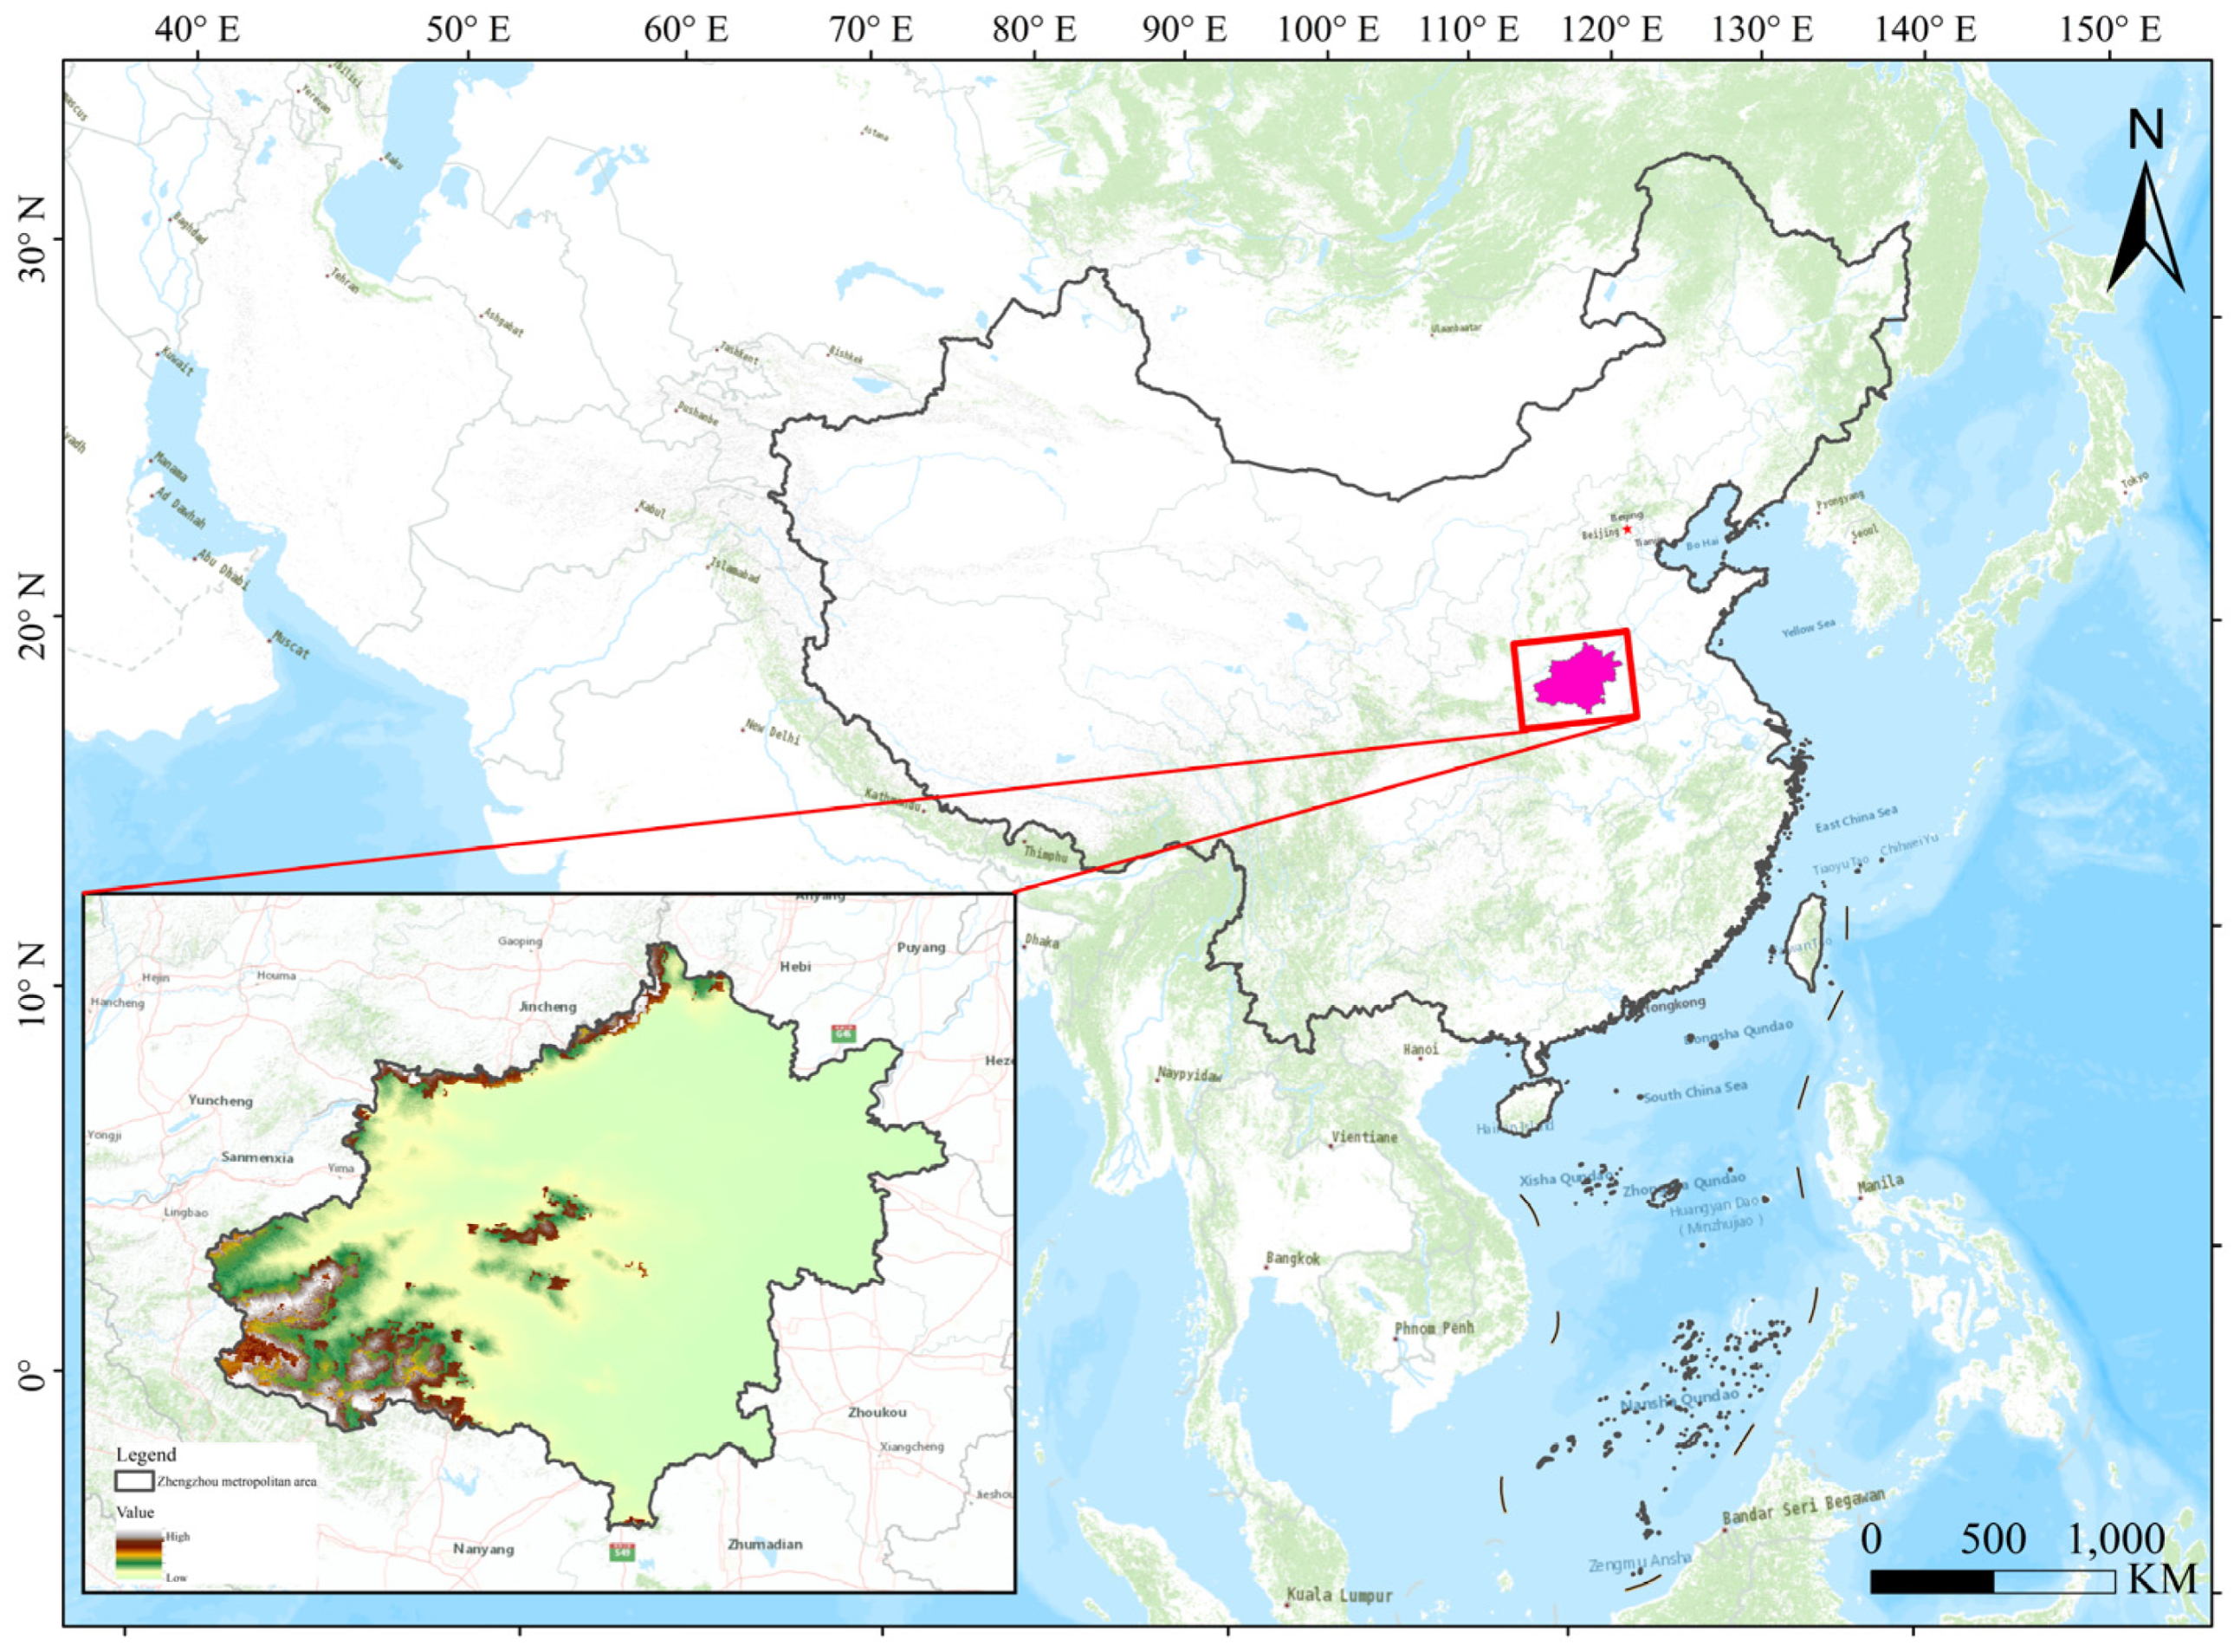
2.1. Overview of the Study Area

The Zhengzhou metropolitan area is located at 33°85′ N~35°20′ N, 112°79′ E~114°82′ E, with Zhengzhou as the core. The area includes eight closely-linked cities: Kaifeng, Luoyang, Pingdingshan, Xinxiang, Jiaozuo, Xuchang, Luohe, and Jiyuan (https://www.henan.gov.cn/2021/12-28/2373130.html, accessed on 3 October 2023), and a total of 80 counties The area spans the Yellow River, the Haihe River, and Huaihe River basins, with a total area of 58,525 km2, accounting for 35.04% of the total area of Henan Province. In 2020, the Zhengzhou metropolitan area is home to nearly 47.03% of the province’s population and generates about 59.78% of its GDP, acting as a core power source that supports and leads the integrated high-quality development of the Central Plains urban agglomeration. The topography of the region is very varied, with mountains and hills in the west and plains in the east. It is located in the transition zone between the second and third grade landforms in China, and the overall terrain is high in the west and low in the east. In 2020, built-up areas accounted for 15.33% of the total area of the Zhengzhou metropolitan area, and the proportion of cultivated land reached 60.02%. From 2005 to 2020, the average PM2.5 in the metropolitan area decreased from 79.77 μg/m3 to 56.58 μg/m3, but total net carbon emissions increased from 1,603,800 tons in 2005 to 2,937,900 tons in 2020. Land use extent and environmental ecology still need to be further improved (Figure 1).

2.2. Evaluation Index System

2.2.1. Evaluation Index System of Land Green Use Efficiency in Zhengzhou Metropolitan Area

According to the basic principle of the super-efficiency SBM model including non-expected output, this study constructed a comprehensive evaluation index system of land green use efficiency of the Zhengzhou metropolitan area, including 8 indicators from three perspectives: input, expected output, and non-expected output (Table 1). From the perspective of input, the input unit is divided into three parts: population, capital, and land. On the one hand, the quantity and distribution of population has an important impact on land productivity [14], which is closely related to the process of urban economic development and creates challenges in land use in the process of urbanization, agricultural and industrial development, and environmental protection, thus affecting the efficiency of urban land use [15]. The number of permanent residents of each county in different years was selected as the index to measure population. On the other hand, land, as the core element of land use, is the basic support for urban production and development, and the change of land area provides potential for the allocation of urban land use structure [16], which in turn affects the efficiency of urban land use. Therefore, the county land area is selected as the index to measure land factors. In addition, the amount of capital in production factors directly affects the vitality of the land factor market and thus urban land use efficiency. Therefore, fixed asset investment is selected as the index to measure capital factors [17].
In terms of expected output, the output units are divided into economic output, social output, and ecological output [18]. Economic benefit reflects the productivity level and the economic level of land green utilization in the study area, and the county gross national product (GDP) is used as the characteristic value of economic output. Social benefit reflects the consumption ability and living standard of residents in the process of land production; it is the social reflection of land green use, and is represented by per capita disposable income. Ecological benefit reflects the degree of positive driving of green land use [9]. Forest coverage rate was selected as an indicator to measure ecological environment status. In terms of undesired output, PM2.5 concentration and net carbon emissions were mainly considered. With the rapid population growth and accelerated urbanization process, fine particulate matter (PM2.5), as an important component of air pollution, is closely related to land use type, especially green space area [19]. Carbon dioxide, as a major greenhouse gas, has a serious impact on regional green and low-carbon development and optimal allocation of land resources. Net carbon emissions are used as an indicator to measure carbon dioxide.

2.2.2. Driving Factor Index System of Land Green Use Efficiency in Zhengzhou Metropolitan Area

Land green use efficiency is comprehensively affected by the pull of social and economic development factors within the land use system and the push of the regional natural and geographical environment. Therefore, this study selects 8 indicators from the two dimensions of natural environment and economy and society to construct the driving factor index system (Table 2).
In the social and economic dimension, the level of economic development has an impact on the comprehensive strength of a city, thus affecting the input intensity of resource factors in county land per unit area, which is conducive to improving industrial and agricultural production efficiency. Therefore, per capita GDP [20] is selected as the proxy indicator of economic development in this study. Urbanization rate affects the pattern of population agglomeration and land use and development. In the last 15 years, a large number of people in Zhengzhou metropolitan area have moved to urban areas in the metropolitan area. The good agglomeration effect of cities and towns is beneficial to the economic output per unit of land, but increases the vacancy rate of rural industrial land and residential land. Therefore, this study selected the ratio of urban permanent population to county permanent population as the proxy index of urbanization rate [21]. The upgrading of industrial structure [15] has an impact on the degree of land pollution and the direction of land use development. Counties that support the development of secondary industry will vigorously develop resources and utilization which increases the degree of land pollution, while counties that mainly develop environment-friendly tertiary industry will reduce industrial pollution through new energy development and scientific and technological innovation. This is conducive to the high-quality development of enterprises, thereby improving the green use efficiency of land. Therefore, the ratio of tertiary industry to secondary industry was selected as the proxy index for the upgrading of industrial structure in this study. Fiscal expenditure affects the impact of land factor input. Increasing government financial input is conducive to industrial land development and agricultural production, improving county infrastructure construction, and improving unit land economic and ecological output efficiency. Therefore, the amount of general budget expenditure was selected as the proxy indicator of fiscal expenditure in this study [22]. The scale of industrial added value has an impact on the economic structure and land use mode. The expansion of industrial scale is not conducive to service-oriented development of the economic structure. The “three wastes” generated by industry pollute the soil and increase the negative environmental externalities, and generally inhibit the green use efficiency of land. Therefore, this study selected the output value of the second product as the proxy index of the scale of industrial added value [13]. Social consumption affects the level of economic output per unit of land, increases the level of residents’ consumption and enhances their purchasing power, promotes the consumption of agricultural products, contributes to the sale of idle residences and industrial buildings, and forms an effective land resource allocation system. Therefore, this study chooses the retail sales of social consumer goods [23] as the proxy indicator of social consumption. In terms of natural environment, land fluctuation at county level has an impact on industrial layout and intensive land use pattern. On relatively flat land, industries tend to be distributed in the form of parks, which is conducive to the development of industrial clusters, while mountainous and hilly areas tend to result in distributed development, which has an impact on green land use efficiency. Therefore, topographic relief [24] is selected as the proxy index of geographical conditions in this study. Forest coverage has an impact on county carbon emissions. Forest has the benefit of carbon sequestration and sink enhancement, positively promotes land green utilization efficiency, and represents ecological output benefit per unit of land. Therefore, the ratio of forest area to county total area was selected as the proxy index of forest coverage rate in this study.

2.3. Research Methods

2.3.1. Super Efficient SBM Model with Unexpected Output

The traditional DEA model requires the input or output to change in the same proportion, and does not consider the non-radial relaxation variables. Tone et al. [25] proposed the SBM model on this basis to eliminate the result deviation caused by radial selection and angle selection. However, this model cannot deal with the problem of multiple evaluation units with efficiency values of “1” at the same time, and it cannot measure the efficiency [26] with non-expected output. To solve this problem, Tone et al. proposed a Super-SBM model based on the SBM model, which includes non-expected outputs. Since there are undesirable outputs such as industrial comprehensive pollution and carbon emissions in the land use process of the Central Plains urban agglomeration, this paper will adopt the super-efficiency SBM model including undesirable outputs to measure the land green use efficiency of the Central Plains urban agglomeration. The calculation formula is as follows [10]:
P = min 1 r i = 1 m S ¯ X i w 1 k 1 + k 2 n = 1 k 1 y v ¯ y n w v + t = 1 k 2 y u ¯ y n w u
X i o j = 1 , w q X i j λ j ; y n w v j = 1 , w q y n j v λ j ; y t w u j = 1 , w q y t j u λ j S ¯ X w ; y v ¯ y w v ; y u ¯ y w u ; λ 0 ; i = 1 , 2 , , r ; j = 1 , 2 , , q ; n = 1 , 2 , , k 1 ; t = 1 , 2 , , k 2
where P is the value of green land use efficiency in Zhengzhou metropolitan area; r, k1 and k2 represent the quantity of input, expected output, and unexpected output, respectively; w represents the number of decision making units; S ¯ , y v ¯ , y u ¯ the relaxation of factor input, expected output, and non-expected output; X v u , y n j v , y t j u the expected output of factor n and the unexpected output of factor t of factor i input of the j decision unit; X n j , y n w v , y t w u respectively represent the optimal input of factor, the expected output of factor n, and the unexpected output of factor t in the decision-making unit after improvement of relaxation variable, and λ j represents weight.

2.3.2. Spatial Autocorrelation Method

Spatial autocorrelation is the quantification of the degree of spatial autocorrelation between data at relevant locations, which can be divided into global spatial autocorrelation and local spatial autocorrelation [18].
(1)
Global spatial autocorrelation analysis is used to describe the overall distribution of a phenomenon and determine whether the phenomenon has agglomeration characteristics in space. In this paper, the Moran index is used to measure the global spatial autocorrelation. The value range of Moran’s I coefficient is [−1, 1]. When the value of Moran’s I is greater than 0, it indicates that the land green use efficiency in the Zhengzhou metropolitan area has a spatial positive correlation and shows an aggregation distribution. When the value of Moran’s I is less than 0, it indicates that the land green use efficiency of the Zhengzhou metropolitan area has a spatial negative correlation and presents a spatial differentiation. When the value of Moran’s I is close to 0, it presents a random distribution without autocorrelation. The formula is [27].
I = n v = 1 n u n W v u s v s ¯ s u s ¯ v = 1 n u = 1 n W v u v = 1 n s v s ¯ 2
where for the global Moran’s I  I index, n is the number of studied variables; sv and su are the land green use efficiency values of research units v and u; s ¯ is the mean value of land use efficiency in the Zhengzhou metropolitan area; Wvu is the spatial relation measure of research unit v and u, 0 means not adjacent, 1 means adjacent.
(2)
Local spatial autocorrelation analysis. Since global Moran’s I is a comprehensive measure of spatial autocorrelation of land green use efficiency in the Zhengzhou metropolitan area, reflecting the average degree of spatial correlation, and there may be some positive and negative spatial correlation coexistence of land green use efficiency in the Zhengzhou metropolitan area, it is necessary to adopt local spatial autocorrelation statistics to reveal the possible spatial variability. The formula is [23]
I v = n s v s ¯ u = 1 n W v u s u s ¯ v = 1 n s v s ¯ 2
where I v represents the local Moran’s I index of research unit v, and n, sv, su, s ¯ , and wvu are the same as Equation (3).

2.3.3. Geographical Detector Model

Geographical detector is an analytical method to detect the spatial differentiation of geographical phenomena and reveal the driving factors behind it [28]. It mainly includes four kinds of detectors, such as factor detection, interaction detection, risk area detection and ecological detection. This study mainly uses the factor detection and interactive detection to show the significant influencing factors and driving forces of the land green use efficiency in Zhengzhou metropolitan area, and to judge whether there is interaction between the two factors and the intensity of the effect. The q value represents the explanatory power of each factor to the land green use efficiency of Zhengzhou metropolitan area, and the range of q is [0, 1]. The larger the value, the stronger the explanatory power. Its calculation formula is as follows [29]:
q = 1 h = 1 L N h σ h 2 N σ 2
where q represents the driving force of driving factors on the green land use efficiency of the Zhengzhou metropolitan area; h = 1 , , L is the stratification of driving factors; N h is the number of spatial units representing the layer; N σ h 2 , σ 2 are the dependent variable of the study area and the variance of the first layer h .
In addition, the interaction relationship between indicators is evaluated by the interaction detector. According to the q value of analyzing interaction and independent influence, the relationship between factors can be divided into 5 categories [23].
Table 3 explains the interactions between variables.

2.4. Data Sources

This paper takes 80 counties in the Zhengzhou metropolitan area as the research object. The data of county resident population, county fixed asset investment, county land area, county GDP, per capita disposable income, urban resident population, tertiary output value, secondary output value, general budget expenditure and retail sales of social consumer goods in the calculation and analysis of land green use efficiency were obtained from Henan Statistical Yearbook (2006–2021). The data of the Zhengzhou metropolitan area administrative boundary and forest coverage rate are derived from the Data Center for Resources and Environmental Sciences, Chinese Academy of Sciences (https://www.resdc.cn/, accessed on 11 October 2023). PM2.5 concentration data is from the University of Washington’s Atmospheric Composition Analysis Group (https://sites.wustl.edu/acag/datasets/surface-pm2-5/, accessed on 11 October 2023), in ArcGIS spatial overlay and extraction. Net carbon emission calculation method references [8]. Topographic relief data are from Global Change Research Data Publishing & Repository (https://geodoi.ac.cn/WebCn/doi.aspx?Id=887, accessed on 11 October 2023) (Table 4).

3. Result Analysis

3.1. Spatial-Temporal Pattern of Land Green Use Efficiency in Zhengzhou Metropolitan Area

From 2005 to 2020, the land green use efficiency of the Zhengzhou metropolitan area fluctuated from 0.5329 to 0.5164, with an average annual decline rate of 0.21%, experiencing three distinct stages: decline, rise, and then another slight decline. In different years, there were great differences in the spatial distribution pattern of land green use efficiency in the Zhengzhou metropolitan area (Figure 2). On the whole, the spatial distribution was higher in the west and southeast, and lower in the middle and north. The green utilization efficiency at different levels showed a continuous distribution, and the local distribution was scattered. From 2005 to 2010, the land green use efficiency of Zhengzhou metropolitan area showed an overall downward trend, from 0.53 to 0.48 in 2010, mainly concentrated in Zhongzhan District, Shanyang District and Masun District of Jiaozuo City, Shilong District and Zhanhe District of Pingdingshan City and Qi County, Tongxu County and Lankao County of Kaifeng City. In these areas, the speed of urbanization is fast, and the increasing intensity of economic development leads to the deterioration of the environment, which is not conducive to green land use. From 2010 to 2015, the overall land use efficiency of all counties increased, especially in Luoyan City, Pingdingshan City and Zhengzhou City. It shows that after 2010, Zhengzhou metropolitan area gradually attaches importance to ecological construction, while the state strictly controls the extensive use of land and pays attention to the prevention and control of air pollution and greenhouse gas emissions, all of which play a positive role in promoting the improvement of land green efficiency. From 2015 to 2020, the land green use efficiency decreased slightly, with the average land green use efficiency increasing from 0.5193 in 2015 to 0.5173 in 2020, reflecting the stagnation of economic output in the Zhengzhou metropolitan area due to the impact of the novel coronavirus epidemic, and the decrease of social consumption has a negative impact on land green use. In 2020, the land green use efficiency of different counties in the Zhengzhou metropolitan area shows large gaps, with a span of 1.1. The Zhengzhou metropolitan area should improve the level of regional integration and overall and coordinated development, and improve the land green use efficiency of each county in the metropolitan area to support the green and high-quality development of the entire metropolitan area.
From 2005 to 2020, the green land use efficiency of Luohe City was the highest, and that of Zhengzhou City was the lowest, and the change of both was relatively stable. Xinxiang City had the most drastic change, Luoyang City and Jiyuan City continuously increased, while Kaifeng City and Xuchang City decreased significantly (Figure 3). The green land use efficiency of all counties in the Zhengzhou metropolitan area generally showed a trend of first decreasing and then increasing, while the change of all counties in Zhengzhou was relatively stable, and all counties in Kaifeng showed a decrease year by year, while the green land use efficiency of Luohe City was relatively high on the whole and showed first an increase and then a decrease, while Jiyuan, as a county-level city, developed steadily and well during the study period. On the whole, the landform and natural resource conditions of counties in the Zhengzhou metropolitan area are different, and the price of green land use is gradually increasing in the process of continuous improvement of the economic development level. The green land use efficiency of the Zhengzhou metropolitan area is mainly concentrated in the range of 0.3–0.6, the process of scientific and technological innovation of major cities in the metropolitan area is slow, the environmental protection measures are weak, and the economic compensation mechanism of ecological restoration is not perfect. Kaifeng City is close to the Yellow River, the ecological environment is fragile, the urban expansion speed is fast, the population size is large, and the economic benefits of ecological environment resources are low after they are put into production. Compared with other cities, Luohe has a good ecological environment foundation, and the urbanization process is slower, so it has its own advantages in the process of transforming the ecological resources that contribute to the economic output value of the green use of land.

3.2. Spatial-Temporal Heterogeneity of Green Land Use Efficiency in the Zhengzhou Metropolitan Area

Moran’s I index was selected to conduct spatial autocorrelation analysis of land green use efficiency (Table 5). From 2005 to 2020, the global Moran’s I index was consistently greater than 0, and the p value was consistently less than 0.05. The data of each year passed the significance test, which indicated that there was a significant spatial aggregation feature of land green use efficiency in the Zhengzhou metropolitan area during the study period. In general, the Moran’s I index showed a trend of first increasing and then decreasing, indicating that the spatial positive correlation of land green use efficiency in the Zhengzhou metropolitan area changed from weak to strong during 2005–2015. During this period, more and more attention was paid to ecological value by various governments, and urbanization brought human resources and economic capital to the development of land green use. From 2015 to 2020, the Moran’s I index showed a downward trend. During this period, the green land use efficiency of the Zhengzhou metropolitan area changed from strong to weak, the urbanization process was too fast, and the deterioration of the ecological environment was deepened. In addition, the COVID-19 epidemic from 2019 led to a certain decline in production and development level, and the gap in land green use between counties widened. Therefore, the spatial evolution analysis of land green use efficiency in the study area was carried out, and the Lisa cluster diagram of land green use efficiency in the Zhengzhou metropolitan area was obtained (Figure 4).
Based on the analysis of the spatial evolution of land green use efficiency in the local study area, the Lisa cluster map of land green use efficiency in the Zhengzhou metropolitan area was obtained (Figure 4). From 2005 to 2020, the distribution pattern of H-L agglomeration presents a divergent distribution, while H-H and L-L agglomeration presents a relatively centralized distribution. (1) The high-high (H-H) type of agglomeration, that is, the land green use efficiency within and among counties is high and the spatial correlation is positive. There is no change in the spatial pattern of H-H cluster distribution from 2005 to 2020, mainly in Songxian and Luoning counties and Luohe city of Luoyang. (2) High-low (H-L) type agglomeration areas, that is, the land green use efficiency in each county is high and there are agglomeration phenomena among counties, and the space is negatively correlated. From 2005 to 2020, the H-L cluster expanded and moved from the west of the Zhengzhou metropolitan area to the north. In 2005, the H-L cluster areas were mainly Jili District of Luoyang City and Shangjie District of Zhengzhou City. These two areas have advanced scientific and technological support and innovation in the process of economic development, and pay attention to ecological environmental protection while developing the economy. In 2020, the H-L cluster was concentrated in Xinmi City, Xinxiang County and Yanjin County, all of which are key development counties of each city, with good location conditions and supportive policies. Ecological protection and restoration projects were incorporated into the urbanization process, and ecological benefits and economic benefits were combined. (3) Low-high (L-H) type agglomeration areas, that is, the green land use efficiency in each county is not high and the spatial agglomeration is low, while the green land use efficiency in neighboring counties is high. It is worth noting that from 2005 to 2020, there was no L-H agglomeration area in the Zhengzhou metropolitan area, indicating that areas with low land green use efficiency within and between counties were not adjacent to high-efficiency areas. (4) Low-low (L-L) type agglomeration area, that is, the land green use efficiency of the county and the adjacent county is low and low-value areas are clustered. From 2005 to 2020, the L-L cluster distribution gradually gathered in the central city of Zhengzhou. The economic development speed of Zhengzhou is too fast, the input-output ratio of ecological resources is low, and green land use needs to be developed. In general, the radiation effect of counties with high land green utilization efficiency on the surrounding areas should be strengthened in the future, and the synergistic effect between counties should be enhanced to promote the improvement of land green utilization efficiency and the optimal allocation of resources in the Zhengzhou metropolitan area.

3.3. Analysis of Driving Mechanism of Land Green Use Efficiency in Zhengzhou Metropolitan Area

From 2005 to 2020, topographic relief is dominant among the driving factors of land green use efficiency, and the explanatory power for land green use efficiency is 18.56%, indicating that topographic conditions have a significant positive impact [30]. In general (Table 6), the explanatory power is as follows: topographic relief (X7) > forest coverage rate (X8) > social consumption (X6) > industrial structure (X3) > urbanization rate (X2) > economic development (X1) > financial expenditure (X4). Among them, the influence of fiscal expenditure is only 4.3%, and the general financial investment of the government in each county has a certain positive effect on promoting the green use of land. The four index coefficients of industrial structure, social consumption, topographic relief and forest coverage rate passed the significance level test of 1%, and the four index coefficients of economic development, urbanization rate, fiscal expenditure and industrial added value passed the significance level test of 5%, indicating that the natural environmental conditions and the consumption behavior of urban and rural residents are closely related to green land use. Natural environmental conditions have a restrictive effect on land use and industrial development in each county, while social consumption can significantly promote economic development and produce a low negative impact on the environment. Therefore, it is necessary to rationally optimize the relationship between land use, nature and residents’ consumption, and promote the improvement of green land use efficiency in the Zhengzhou metropolitan area.
From the results of interactive detection, the impact of interaction on land green use efficiency in Zhengzhou metropolitan area is higher than the interpretation of single factor alone. The proportion of nonlinear enhancement of interaction of each factor is 97.22%, and only the interaction of topographic relief (X7) and forest coverage rate (X8) shows double-factor enhancement (Figure 5). From 2005 to 2020, the land green use efficiency of Zhengzhou metropolitan area was mainly reflected in the superimposed effects of topographic relief (X7), industrial structure (X3), urbanization rate (X2), social consumption (X6), and other factors. There were some differences in the interaction between factors at different stages, but the interaction between urbanization rate (X2) and topographic relief (X7) is the strongest in general, indicating that the central urban area of the Zhengzhou metropolitan area continues to expand outward, the population size continues to increase, the industrial structure layout continues to change, and the regional ecological space is squeezed. There is a significant negative correlation between urban expansion and land green use efficiency. During the study period, the interaction between industrial structure (X3) and topographic relief (X7) was strong, indicating that the Taihang Mountains in the north of the study area and the overall topography— high in the west and low in the east—affect the industrial distribution and industrial development priorities of the county, and the combined effect of the two can strongly drive land green use efficiency. The interaction between terrain relief (X7) and forest coverage rate (X8) was enhanced by two factors, which reflected that both of them had strong influence on land green use efficiency in the Zhengzhou metropolitan area. Overall, the q value of the interaction between topographic relief and economic and social factors is larger, which can better explain land green use efficiency.

4. Discussion

In this paper, the evaluation index system of land green use efficiency was established, and the value of land green use efficiency in the Zhengzhou metropolitan area during 2005–2020 was estimated by using the SBM model containing non-expected output. The spatial-temporal differentiation of land green use efficiency in the Zhengzhou metropolitan area was analyzed and discussed based on the spatial autocorrelation method. The spatial pattern of land use efficiency in the Zhengzhou metropolitan area was divided into areas of “high-low” value, “high-high” value, and “low-low” value. Finally, the driving factors of land use efficiency in the Zhengzhou metropolitan area were analyzed by means of the geographic detector model. The main discussion results are as follows:
(1)
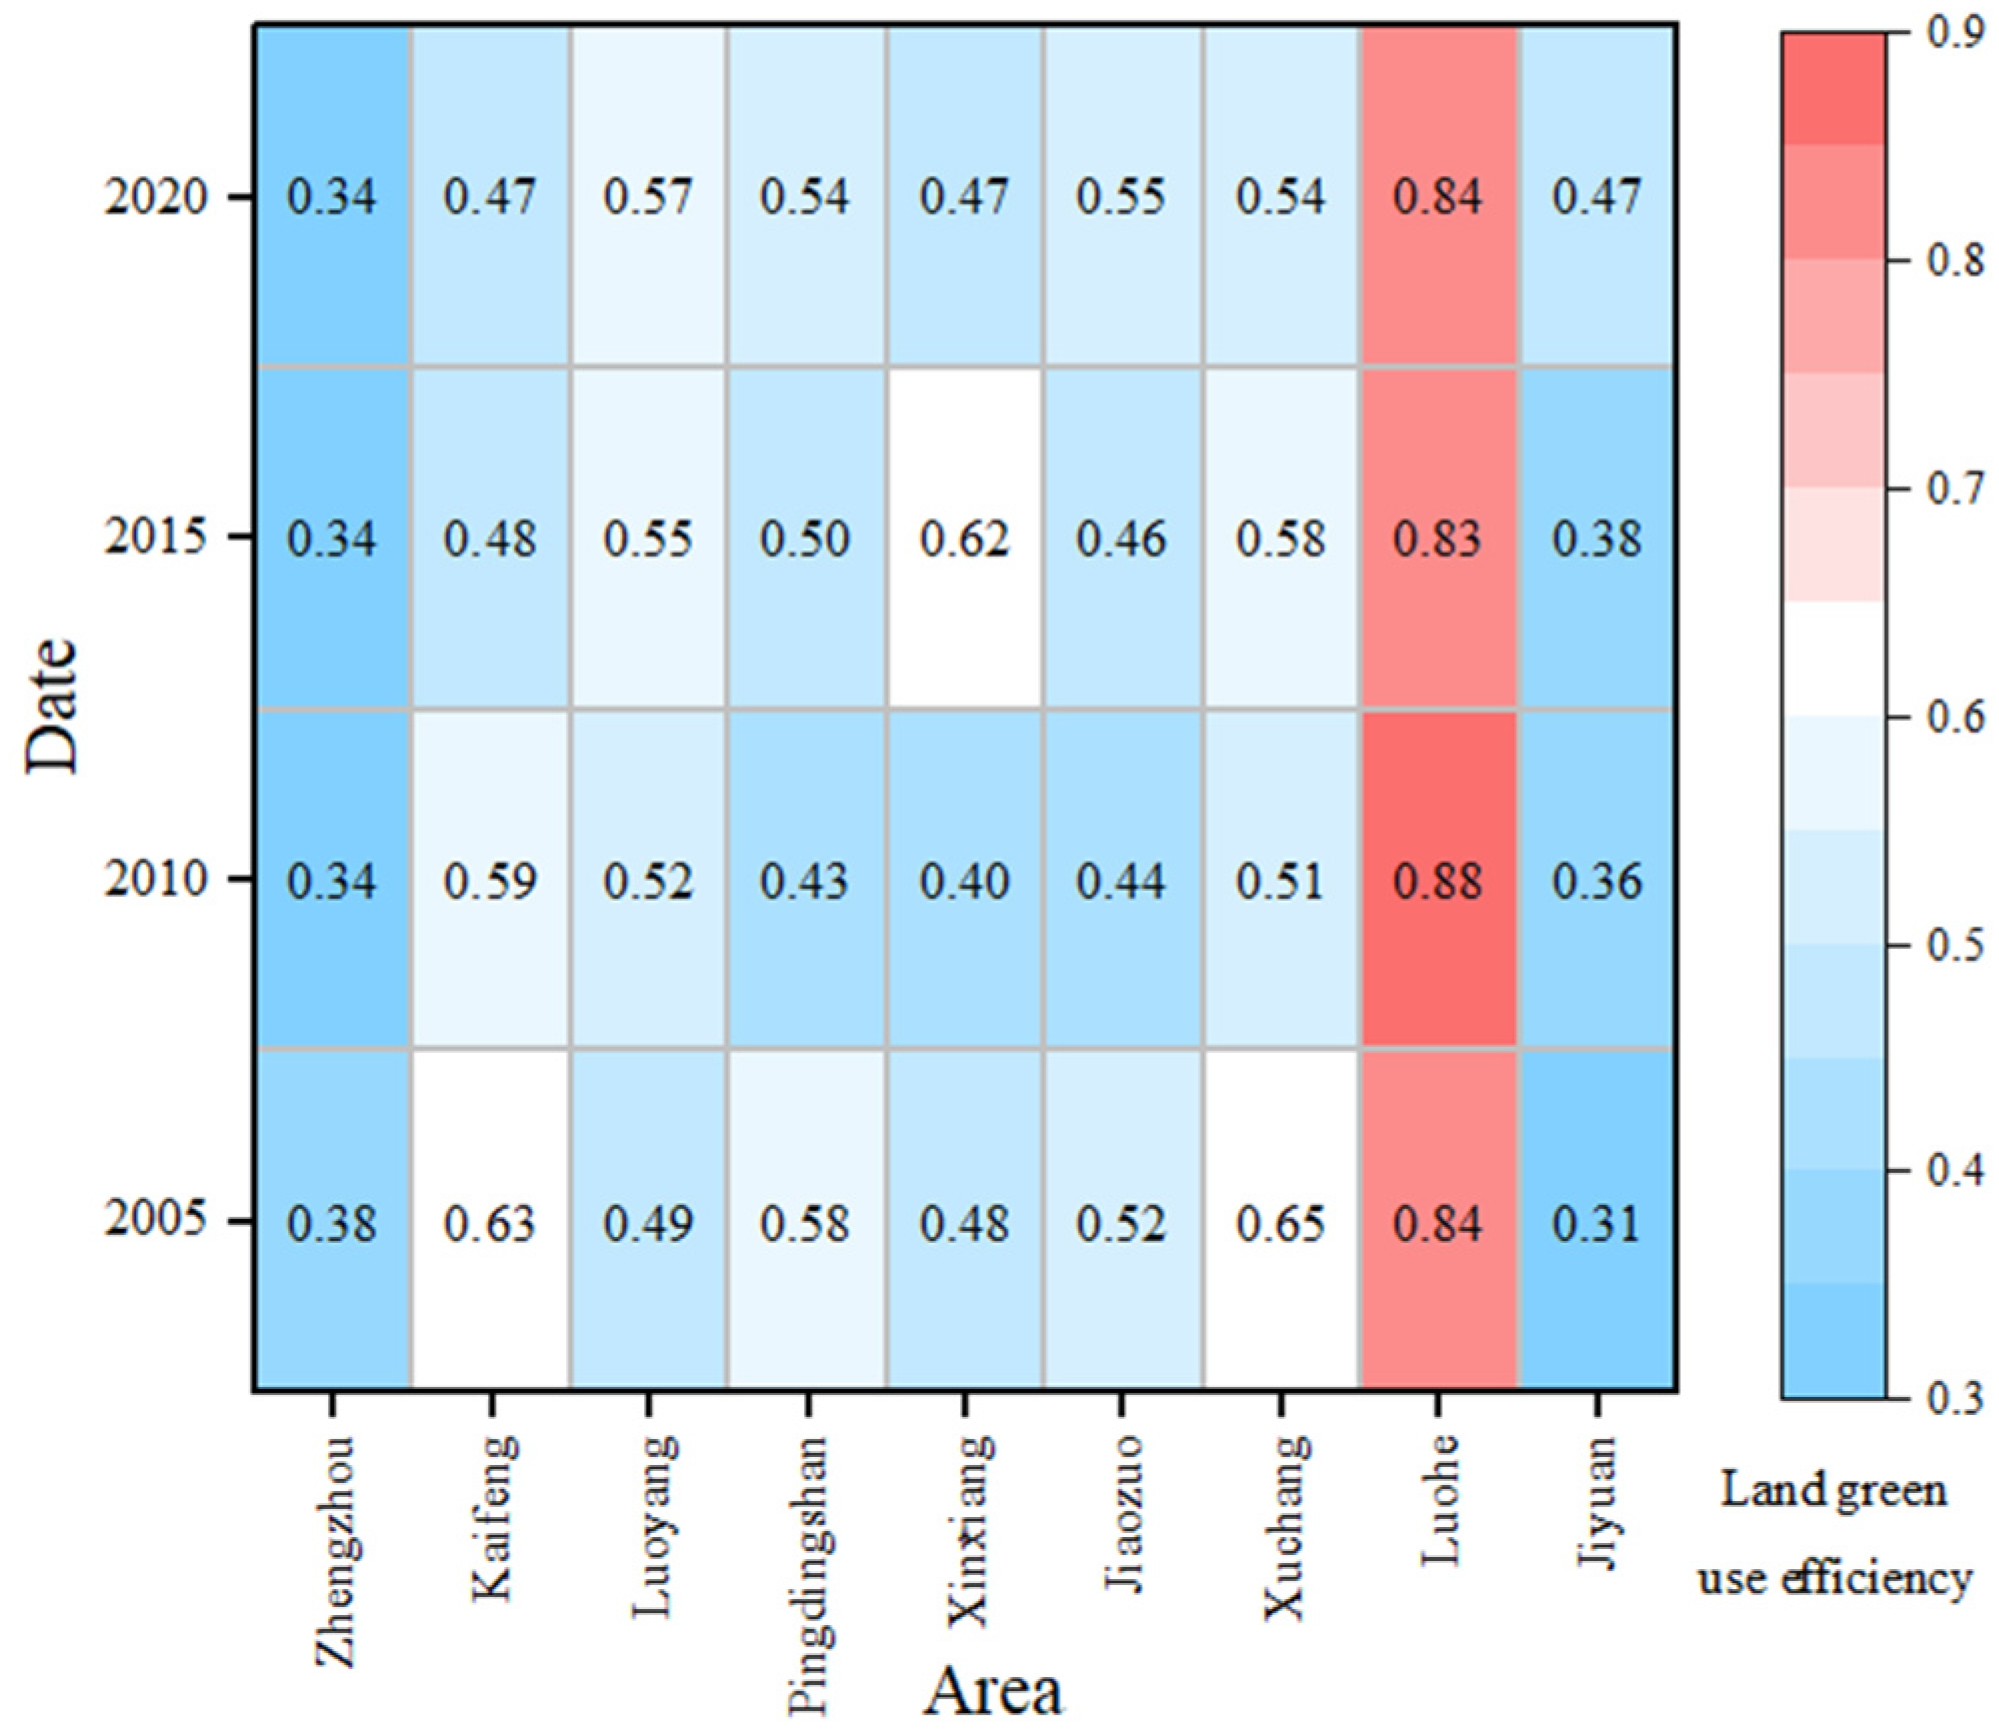
From the perspective of time series changes, the land green use efficiency of the Zhengzhou metropolitan area fluctuated from 2005 to 2020. By 2010, the average efficiency of the Zhengzhou metropolitan area was 0.48, a decrease of 0.05 compared with 2005, and by 2015, the average value of land green use efficiency increased to 0.52. By 2020, the average efficiency showed an insignificant decrease of 0.002. From 2005 to 2020, the green land use efficiency of Luohe City was the highest, and that of Zhengzhou City was the lowest, and the change of both was relatively stable. The change of Xinxiang City was the most drastic, Luoyang City and Jiyuan City continuously increased, while Kaifeng city and Xuchang City decreased significantly. The land green use efficiency of all counties in Luohe City was generally high, while the land green use efficiency of all counties in Zhengzhou City was generally low. It was higher in the west and southeast of the Zhengzhou metropolitan area, and lower in the central and northern areas. The efficiency values of different intervals show the characteristics of overall continuous distribution and local scattered distribution in space.
(2)
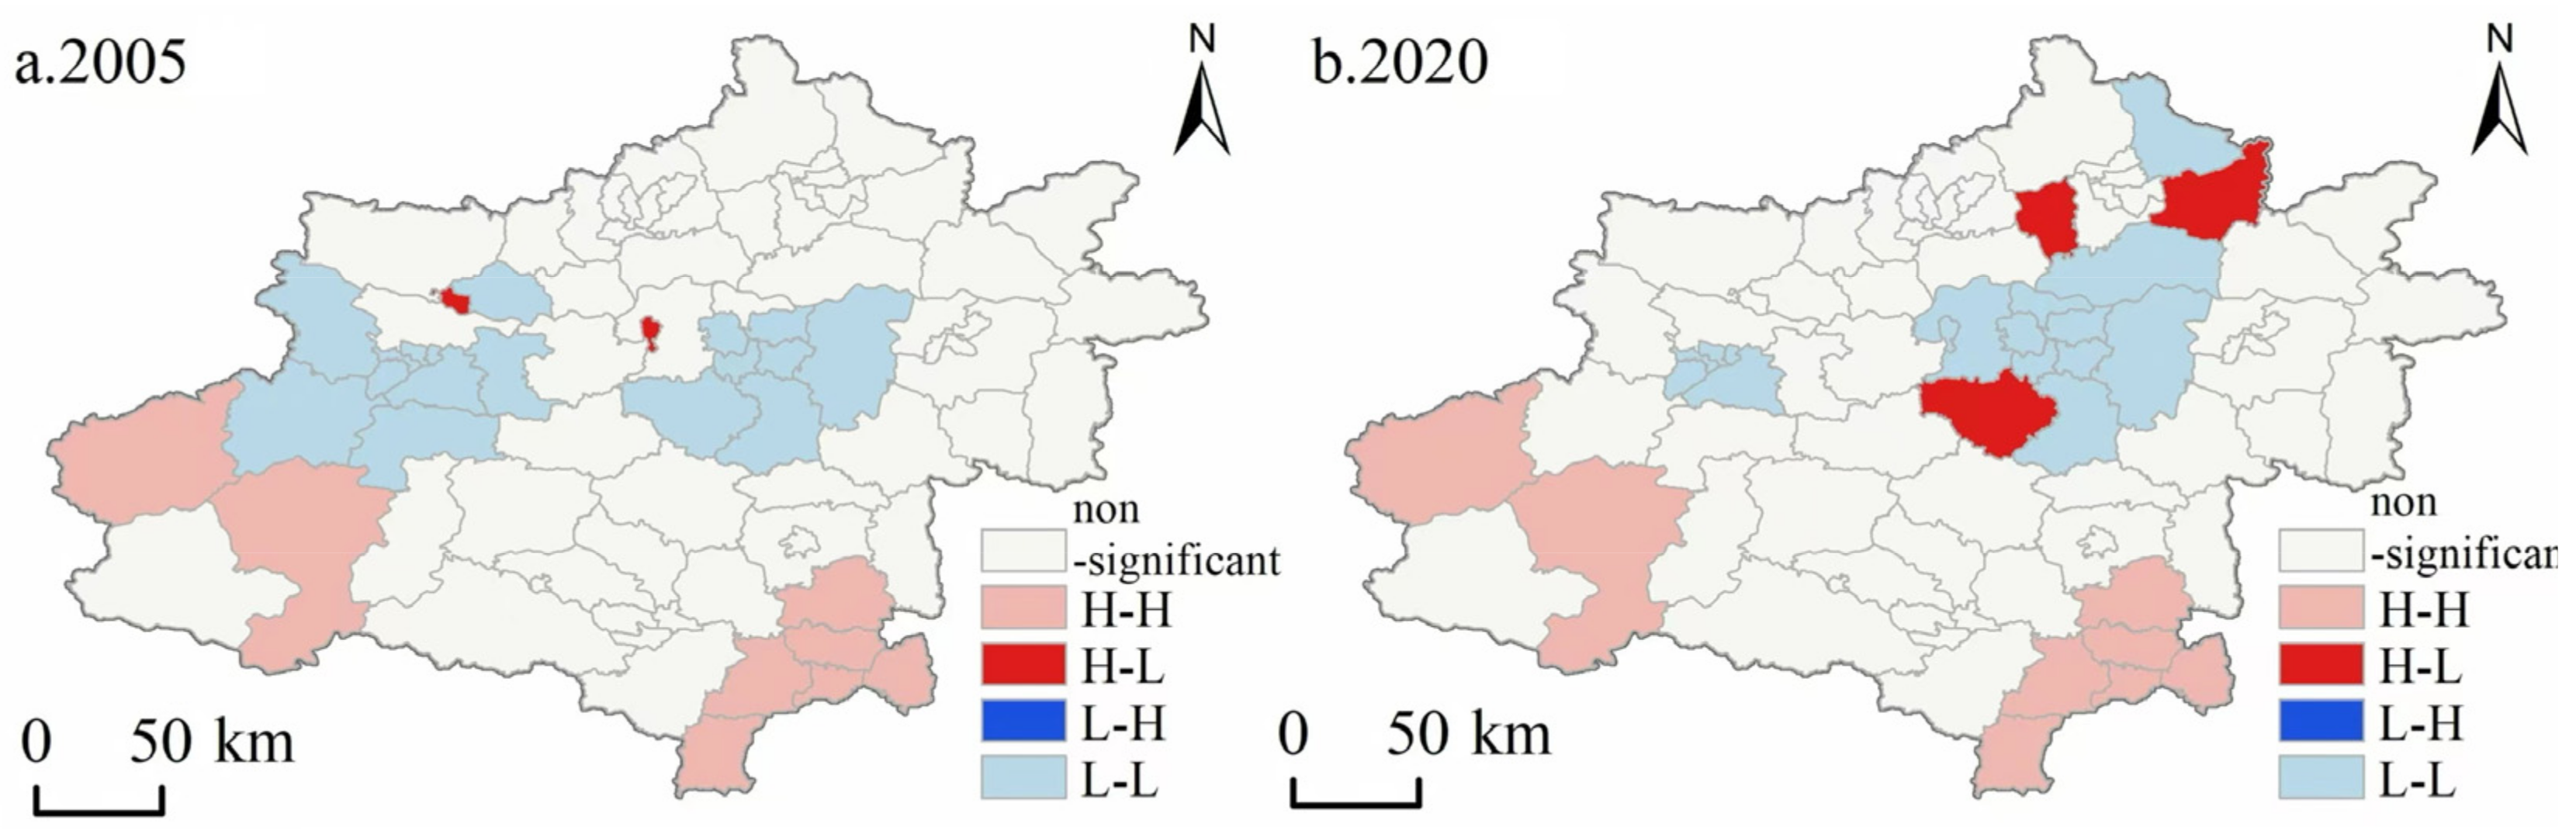
From the perspective of spatial differentiation patterns, the global Moran’s I index of land green use efficiency in the Zhengzhou metropolitan area increased from 0.1472 in 2005 to 0.4114 in 2015, and decreased to 0.2991 in 2020. The global spatial autocorrelation first increased and then decreased. The global spatial autocorrelation showed a strengthening trend during the whole study period. The local spatial autocorrelation had high-high clustering, high-low clustering, low-high clustering, and low-low clustering, which were concentrated in the west, southeast and central regions of the Zhengzhou metropolitan area, and there is a large space for collaborative improvement and optimization in each region.
(3)
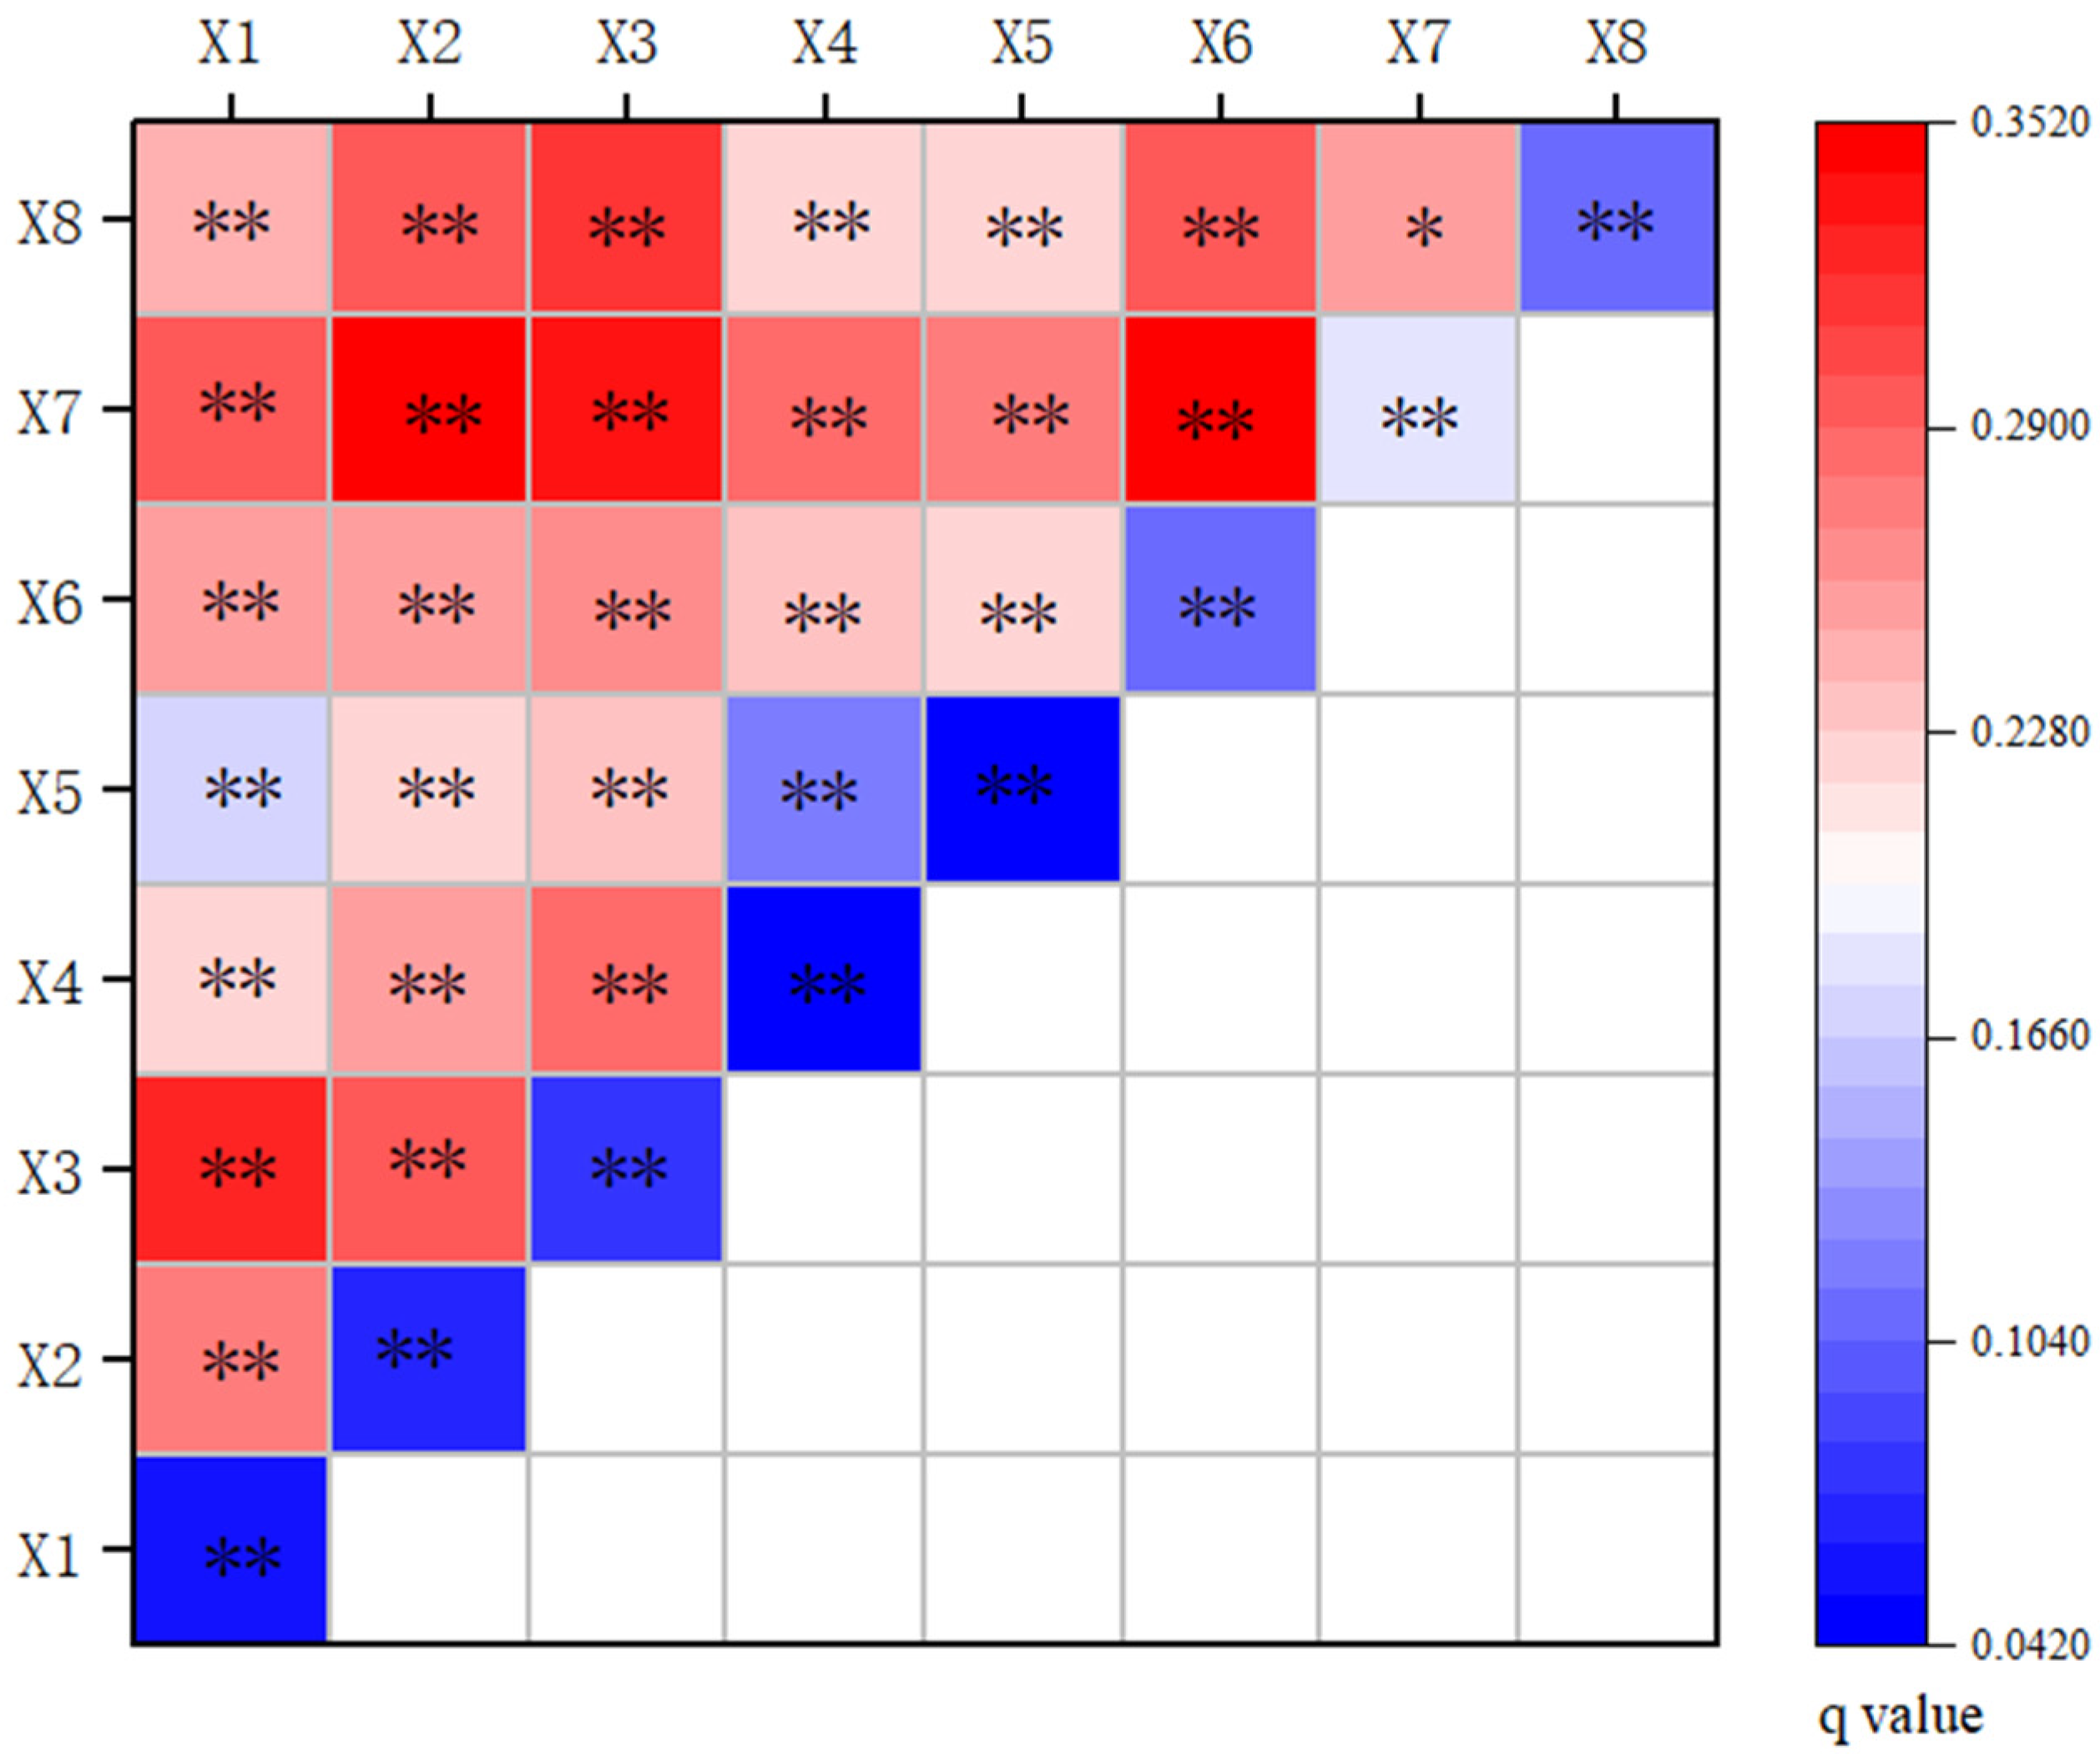
From the perspective of driving factors, the eight influencing factors of land green use efficiency in the Zhengzhou metropolitan area all passed the 5% significance level test, and the explanatory power is shown as topographic relief > forest coverage rate > social consumption > industrial structure > urbanization rate > economic development > industrial added value scale > financial expenditure, among which topographic relief is the leading influencing factor. The explanatory power is 0.1856. In the two-factor interaction, topographic relief and forest coverage rate showed nonlinear enhancement, and the rest showed a two-factor enhancement relationship. Topographic relief had strong interaction with urbanization rate, industrial structure upgrading and social consumption, and the highest explanatory power was 0.3513, 0.3370, and 0.3494, respectively. The results showed that the greater the relief degree, the worse the green use of urban land, and the increase of forest coverage rate had a significant positive effect on the green use of urban land.
(4)
Compared with the existing research on land green use efficiency, this paper profoundly reveals the spatial correlation of land green use efficiency in the Zhengzhou metropolitan area and profoundly reflects its dynamic change process. It is more clearly proved that by using the more accurate data of 120 counties in the Zhengzhou metropolitan area as the research object, compared with existing results mainly based on a wider research area, more specific influencing factors and countermeasures can be obtained. Moreover, the research results show that in contrast to the dominant economic driving factors in the past [15], in the 120 counties of the Zhengzhou metropolitan area, the two environmental factors of topographic relief and forest coverage rate have a more significant effect on the land green use efficiency, indicating that economic growth leads to rapid urbanization. However, it is not necessarily conducive to the improvement of urban land use efficiency [3], which can provide more accurate and detailed scientific data support for low-carbon green development and efficient utilization of resources in the Zhengzhou metropolitan area.
The study further shows that cities play an important role in the land green use efficiency of the Zhengzhou metropolitan area, where most of the cities are resource-based cities, in terms of natural endowments, especially the particularity of geographical conditions. Models of different development stages also reveal the possible impact of socioeconomic structure on urban land green use. At present, the main task facing the Zhengzhou metropolitan area is how to accelerate green development and regionally coordinated development according to geographical conditions. For old industrial cities and resource-based cities like the Zhengzhou metropolitan area, in order to develop the economy under modern conditions, most cities take the road of extensive utilization of land resources, ignoring the difference of resource endowment and economic development among different regions, and there is a lack of economic support and reserve power for overall development.
Imperfections of the research: This paper attempts to calculate and evaluate the land green use efficiency of 120 counties in the Zhengzhou metropolitan area, but due to the limitations of data acquisition and the feasibility of the method, there is still room for further improvement. First, when future evaluation index systems are constructed, more objective and effective indicators can be selected from multiple dimensions. The entropy method was used to further process the original data and improve the evaluation index system of land green utilization efficiency. Second, due to the limitations of the method, no further correlation analysis was performed on the driving factors. In the future, further exploration can be made from the aspects of natural geographical conditions, carbon emissions and other influencing factors, and social network analysis can be introduced to analyze the spatial correlation network characteristics and interaction from the perspectives of network density, network correlation degree and network efficiency, so as to clarify the driving mechanisms of land green utilization. This could provide more accurate policy support for the development of the Zhengzhou metropolitan area.

5. Policy Impact and Further Research

At the end of 2016, it was mentioned in the Central Plains Urban Agglomeration Development Policy (Central Plains Urban Agglomeration Development Plan, 2016) [31] that Zhengzhou and Kaifeng, Xinxiang, Jiaozuo and Xuchang should be deeply integrated to build a modern metropolitan area and form a core area that drives the surrounding areas, radiates to the whole country and connects to the international community. In October 2023, the Zhengzhou Metropolitan Area Development Planning Policy (Zhengzhou Metropolitan Area Development Plan, 2023) [32] was issued, which promoted the Zhengzhou metropolitan area to play an increasingly important leading role in the economic development of Henan Province. Under the development trend of China’s new urbanization, the Zhengzhou metropolitan area, while considering its own economic structure and natural resource endowment, should take effective measures to improve the comprehensive utilization level of economy, society and ecology. The lack of spatial coordination and correlation among cities has become an important obstacle to the green use efficiency of urban land. For example, Zhongmou County and Yuanyang County have always been at a low value of land green use efficiency in the study time series, and their spatial clustering also presents corresponding insignificant characteristics. In order to solve the existing difficulties, it is necessary to open up the flow channel of factors between 120 counties in the metropolitan area, and enhance the role of counties as the basic financial unit of national social economy and the carrier of urbanization construction. County land use should be guided by natural geographical conditions, determine the central development area through population size, strengthen the coordinated development between regions, form the core competitiveness of county economy, and help the Zhengzhou metropolitan area become the new growth pole of the development of the Central Plains urban agglomeration.
In 2019, the average annual concentration of PM2.5 in Zhengzhou dropped to 58 micrograms/cubic meter, and the air quality rate reached 48.5%. The air quality in Kaifeng, Xuchang, Xinxiang and other cities is also gradually improving. The water quality of rivers in the metropolitan area has been continuously improved, the water quality of the national and provincial sections of major rivers has generally met the standards, and the water quality of drinking water sources has reached over 98 percent. In the stage of strengthening ecological protection in the Zhengzhou metropolitan area, land green use efficiency showed obvious improvement, which was consistent with this study.
In the Zhengzhou Metropolitan Area Transportation Development Plan (Zhengzhou Metropolitan Area Transportation Integration Development Plan (2020–2035), 2020) [33] promulgated by the government, the Zhengzhou metropolitan area strives to improve the Yellow River Basin’s ecological protection and high-quality development of the transportation pilot area. The government chose Zhengzhou and Jinan to build the Zhengzhou-Jinan high-speed railway bridge. Improve the density of cross-river channels, strengthen the regional coordination between metropolitan area and surrounding cities by using traffic advantages, and promote the balance and optimization of internal economic structure through external connections. Facing the inherent challenges of geographical conditions and the external challenges of unbalanced economic structures, this paper constructs the evaluation index system of urban land green use efficiency in the Zhengzhou metropolitan area from 2005 to 2020, uses the super-efficiency SBM model to measure the output efficiency of land use, and analyzes the spatial-temporal correlation of urban efficiency through the spatial autocorrelation method. This paper introduces a geodetector model to explore the driving factors affecting efficiency, and suggests that the Zhengzhou metropolitan area should pay attention to the relationship between economic benefits, social benefits and ecological benefits in the development process, so as to respond to China’s carbon emission reduction plan. Local governments cannot just blindly invest, but should take into account economic development and effectively carry out environmental protection, because geographical conditions and green space coverage have a more significant role in improving the green use efficiency of urban land. It is more effective for the local government of the Zhengzhou metropolitan area to improve the green utilization efficiency of urban land by improving the consumption level of residents and optimizing the industrial structure, which will also accelerate urbanization.

Author Contributions

Writing—original draft & review, L.Y.; Writing—review & editing, K.L. All authors have read and agreed to the published version of the manuscript.

Funding

This research received no external funding.

Data Availability Statement

The data of this study are available in the Chinese Statistical Yearbook.

Conflicts of Interest

The authors declare no conflict of interest.

References

  1. Lu, D.; Sun, D. Comprehensive management and sustainable development of the Yellow River Basin. Acta Geogr. Sin. 2019, 74, 2431–2436. [Google Scholar]
  2. Liu, S.; Ye, Y.; Xiao, W. Spatial and temporal differentiation of urban land use efficiency in China based on stochastic Frontier analysis. China Land Sci. 2020, 34, 61–69. [Google Scholar]
  3. Song, Y.; Yeung, G.; Zhu, D.; Xu, Y.; Zhao, J. Spatial and temporal pattern of land use efficiency and its driving factors in the Beijing-Tianjin-Hebei urban agglomeration. China Land Sci. 2021, 35, 69–78. [Google Scholar]
  4. Luo, G.; Li, T. Dynamic change and influencing factors of provincial land use efficiency differences in China under the influence of carbon emissions. Acta Ecol. Sin. 2019, 39, 4751–4760. [Google Scholar]
  5. Gai, M.; Qin, B.; Zheng, X. Spatial and temporal pattern evolution analysis of coupled coordination between transformation of economic growth momentum and green development. Geogr. Res. 2021, 40, 2572–2590. [Google Scholar]
  6. Liang, L.; Yong, Y.; Yuan, C. Measurement and spatial differentiation of urban land green use efficiency: Based on an empirical study of 284 cities at or above prefecture level. China Land Sci. 2019, 33, 80–87. [Google Scholar]
  7. Ding, Y.; Guo, Q.; Qin, M. Spatial and temporal evolution and influencing factors of land green use efficiency in resource-based cities in the Yellow River Basin. Trans. Chin. Soc. Agric. Eng. 2021, 37, 250–259. [Google Scholar]
  8. Feng, W.; Zhao, R.; Xie, Z.; Ding, M.; Xiao, L.; Sun, J.; Yang, Q.; Liu, T.; You, Z. Land use carbon emission efficiency and its spatial-temporal pattern under carbon neutral target: A case study of 72 prefecture-level cities in the Yellow River Basin. China Land Sci. 2023, 37, 102–113. [Google Scholar]
  9. Hu, B.; Li, J.; Kuang, B. Evolution characteristics and influencing factors of urban land use efficiency difference under the concept of green development. Econ. Geogr. 2018, 38, 183–189. [Google Scholar]
  10. Lu, X.; Ren, W.; Yang, H.; Ke, S. Impact of compact urban traffic development on land green use efficiency: An empirical analysis based on spatial metrology. China Popul. Resour. Environ. 2023, 33, 113–124. [Google Scholar]
  11. Jiang, X.; Hou, J.; Lu, X. The impact of low-carbon pilot policies on urban land green use: An empirical study based on differentially differential model. China Land Sci. 2023, 37, 80–89. [Google Scholar]
  12. Hu, F.; Zhao, R.; Jia, Z.; Wei, J.; Li, L. Spatial and temporal characteristics of urban land expansion and its influencing factors: Based on panel data from 31 provinces in China. Resour. Dev. Mark. 2022, 38, 939–947. [Google Scholar]
  13. Xu, Z.; Xu, W.; Liu, C. Impact of environmental regulation on land green use efficiency. China Land Sci. 2021, 35, 87–95. [Google Scholar]
  14. Zhang, J.; Liang, J.; Zhu, Y.; Zhou, X. Land resources and the influence of the GDP of China’s population distribution mechanism analysis. J. Geogr. Sci. 2017, 37, 1006–1013. [Google Scholar]
  15. Lu, X.; Li, J.; Liu, C.; Kuang, B.; Cai, D.; Hou, J. Driving factors and spatial differentiation of urban land green use efficiency in China. Sci. Geogr. Sin. 2022, 42, 611–621. [Google Scholar]
  16. Wen, R.; Li, H.; Wu, R.; Yan, L. Spatial and temporal variation of county land green use efficiency and its influencing factors based on multi-source data in Jiangxi Province. Areal Res. Dev. 2023, 42, 136–142. [Google Scholar]
  17. Nie, L.; Wang, Y.; Shao, Z.; Wu, Y.; Liu, X. Measurement of urban land use efficiency and its influencing factors: Based on empirical analysis of ten major urban agglomerations in China. Explor. Econ. Probl. 2022, 82–93. [Google Scholar]
  18. Zhang, Z.; Zhong, J.; Zhao, Z.; Fang, H. Research on urban land use efficiency and its influencing factors in Beijing-Tianjin-Hebei region. China Soft Sci. 2022, 121–126. [Google Scholar]
  19. Xie, W.; Wu, J. Effects of land use and landscape pattern on PM2.5 concentration: A case study of Shenzhen City. J. Peking Univ. Nat. Sci. Ed. 2017, 53, 160–170. [Google Scholar] [CrossRef]
  20. Xue, J.; Zhang, A.; Cao, L. Spatial effects of land marketization and supply structure on green use efficiency of construction land in the Yellow River Basin. Resour. Dev. Mark. 2022, 38, 1304–1313. [Google Scholar]
  21. Zhang, S.; Du, S.; Liu, X.; Niu, W. Spatial and temporal differences and influencing factors of land use eco-efficiency in urban agglomerations of the lower Yellow River. Resour. Dev. Mark. 2022, 38, 280–289. [Google Scholar]
  22. Fan, X.; Lu, X.; Liu, J. Impact of digital economy development on urban land green use efficiency: A moderating effect analysis based on infrastructure construction. China Land Sci. 2023, 37, 79–89. [Google Scholar]
  23. Wang, J.; Xu, C. Geodetector: Principles and prospects. Acta Geogr. Sin. 2017, 72, 116–134. [Google Scholar]
  24. Zheng, T.; Yang, L.; Jia, Z.; Ao, N.; Jiang, Y.; Liu, X. Ecological spatial zoning and conservation and restoration strategies of Inner Mongolia based on ecosystem “damage-restoration-potential” assessment. J. Environ. Eng. Technol. 2023, 13, 1901–1909. [Google Scholar]
  25. Tone, K.; Tsutsui, M. An epsilon- based measure of efficiency in DEA: A third pole of technical efficiency. Eur. J. Oper. Res. 2010, 207, 1554–1563. [Google Scholar] [CrossRef]
  26. You, J.; Dong, H.; Jiang, B.; Zhu, Y.; Tao, J. Spatial and temporal non-stationality of energy eco-efficiency and driving factors in the Yangtze River Economic Belt. Resour. Sci. 2022, 44, 2207–2221. [Google Scholar]
  27. Yu, W.; Chen, Y.; Fang, F.; Zhang, J.; Li, Z.; Zhao, L. Evolution and driving force of grassland spatial distribution pattern in Guizhou Province from 1980 to 2020. J. Pratacultural Sci. 2023, 33, 1–18. [Google Scholar]
  28. Zhou, L.; Zhou, C.; Yang, F.; Wang, B.; Sun, D. Spatio-temporal evolution and driving factors of PM (2.5) in China from 2000 to 2011. Acta Geogr. Sin. 2017, 72, 2079–2092. [Google Scholar]
  29. Hong, H.; Cai, Z.; Liao, H.; Liu, T. Spatial differentiation mechanism and optimization strategy of rural residential cooperation in hilly and mountainous areas of Southwest China: A case study of 37 districts and counties in Chongqing. J. Nat. Resour. 2023, 38, 2581–2598. [Google Scholar]
  30. Qiao, X.; Shi, Y.; Guo, J.; Yang, Y.; Zhang, H. Impacts of urban expansion at different levels on ecosystem services in Zhengzhou metropolitan area. Geogr. Res. 2022, 41, 1913–1931. [Google Scholar]
  31. Central Plains Urban Agglomeration Development Plan, 2016. The Main Task Is to Promote the Scientific Development of Central Plains Urban Agglomeration. Available online: https://www.gov.cn/xinwen (accessed on 6 May 2024). (In Chinese)
  32. State Council. The Main Task Is the Construction of Zhengzhou Metropolitan Area. 2023. Available online: https://www.henan.gov.cn/2023/10-27/2836963.html (accessed on 6 May 2024). (In Chinese)
  33. The Master Plan of the Territorial Space of Zhengzhou (2021–2035). The Main Task Is to Strengthen the Radiation Capacity of Zhengzhou Metropolitan Area. Available online: https://www.henan.gov.cn/2022/11-10/2637548.html (accessed on 6 May 2024). (In Chinese)
Figure 1. Overview of the study area. Approved map No. GS (2024)0650.
Sustainability 16 05447 g001
Figure 2. Space–time pattern evolution of land green use efficiency in Zhengzhou metropolitan area from 2005 to 2020.
Sustainability 16 05447 g002
Figure 3. Change of green land use efficiency in each city from 2005 to 2020. Note: Jiyuan is a county-level city directly under the jurisdiction of Henan Province.
Sustainability 16 05447 g003
Figure 4. Lisa cluster map of land green use efficiency in the Zhengzhou metropolitan area.
Sustainability 16 05447 g004
Figure 5. Interaction of various factors on land green use in the Zhengzhou metropolitan area from 2005 to 2020. Note: * stands for two-factor enhancement relationship, ** stands for nonlinear enhancement.
Sustainability 16 05447 g005
Table 1. Evaluation index system of land green use efficiency in Zhengzhou metropolitan area.
Indicator TypesIndicator SelectionIndicator ConnotationUnits
Input indicatorsPopulation inputThe number of permanent residents in the countypeople
Financial inputCounty fixed asset investmentCNY
Land inputCounty land areakm2
Desired output metricsEconomic benefitTotal county GDPCNY
Social benefitsPer capita disposable incomeCNY per person
Ecological benefitsForest coverage%
Indicator of undesirable outputPM2.5 concentrationThe concentration of dust or drifting dust with a diameter of 2.5 μm or less in ambient airMu g/m3
Net carbon emissionsThe difference between carbon emissions and carbon uptakeCO2e
Table 2. Index system of influencing factors of land green use efficiency in Zhengzhou metropolitan area.
IndicatorsMethod of CalculationUnits
Economic Development (X1)GDP per capitaCNY per person
Urbanization rate (X2)Urban resident population/county resident population%
Industrial structure advanced (X3)Output value of tertiary industry/output value of secondary industry-
Fiscal expenditure (X4)Amount of general budget expenditureCNY
Industrial value added scale (X5)Output value of secondary productionCNY
Social consumption (X6)Retail sales of consumer goodsCNY
Geographical condition (X7)Topographic relief-
Forest cover (X8)Forest area/total county area%
Table 3. The interaction between variables.
The Interaction between VariablesInteraction Outcome
q(X1X2) < Min(q(X1),q(X2))Nonlinearity attenuation
Min(q(X1),q(X2)) < q(X1∩X2) < Max(q(X1),q(X2))The single-factor nonlinearity is weakened
q(X1∩X2) > Max(q(X1),q(X2))Two-factor enhancement relationship
q(X1∩X2) = q(X1) + q(X2)Two-factor independence
q(X1∩X2) > q(X1) + q(X2)Nonlinear enhancement
Table 4. Statistical table of sources of data for the article.
Data TypePeriodData Source
Administrative boundary of Zhengzhou metropolitan area2005, 2010, 2015, 2020Institute of Geographic Sciences and Natural Resources Research, Chinese Academy of Sciences (https://www.resdc.cn/, accessed on 11 October 2023)
Forest coverage rate2005, 2010, 2015, 2020
Administrative zoning map of China2024China National Geographic Information Public Service Platform (Tiandi Map)
PM2.5 concentration2005, 2010, 2015, 2020University of Washington Atmospheric Composition Analysis Group (https://sites.wustl.edu/acag/datasets/surface-pm2-5/, accessed on 11 October 2023)
Net carbon emission2005, 2010, 2015, 2020[8]
Topographic relief height2005, 2010, 2015, 2020Global Change Science Data Publishing System (https://geodoi.ac.cn/WebCn/doi.aspx?Id=887, accessed on 3 October 2023)
Other data2005, 2010, 2015, 2020Henan Statistical Yearbook (2006–2021), Henan Economic and Social Development Statistical Database
Table 5. Global Moran’s I index.
Year2005 2010 2015 2020
Moran’s I0.1472 0.2052 0.4114 0.2991
p value0.0320 0.0029 0.0000 0.0000
Table 6. Effects of various factors on land green use efficiency in the Zhengzhou metropolitan area from 2005 to 2020.
X1X2X3X4X5X6X7X8
q value0.05890.06730.07410.04300.04920.10820.18560.1119
p value0.01580.01810.00390.04040.01900.00000.00000.0000
Disclaimer/Publisher’s Note: The statements, opinions and data contained in all publications are solely those of the individual author(s) and contributor(s) and not of MDPI and/or the editor(s). MDPI and/or the editor(s) disclaim responsibility for any injury to people or property resulting from any ideas, methods, instructions or products referred to in the content.

