Article

Cooling Effects and Human Comfort of Constructed Wetlands in Desert Cities: A Case Study of Avondale, Arizona

1
School of Geographical Science & Urban Planning, Arizona State University, Tempe, AZ 85281, USA
2
School of Human Evolution and Social Change, Arizona State University, Tempe, AZ 85281, USA
3
School of Sustainability, Arizona State University, Tempe, AZ 85281, USA
*
Author to whom correspondence should be addressed.
Sustainability 2024, 16(13), 5456; https://doi.org/10.3390/su16135456
Submission received: 22 April 2024 / Revised: 30 May 2024 / Accepted: 18 June 2024 / Published: 27 June 2024

Abstract

:
Heat continues to be a hazard in the desert southwestern USA. This study presents the results of a preliminary microclimate field survey in two Avondale, Arizona, neighborhoods developed with artificial wastewater-treatment wetlands and one adjacent desert neighborhood. The preliminary field study reported here measured morning, near-noon, and afternoon air temperatures and, together with other observed variables, calculated mean radiant temperatures (critical to human comfort) at 28 locations across three neighborhoods on a sample day in September of 2018. The aim was to determine cooling effects of blue/green environments and identify benefits for residents. Overall results for September indicate 1–3 °C cooling, which is understandable for this time of year at summer’s end. Mean radiant temperature results are substantially different at lake sites versus dry neighborhood sites (by some 5–20 °C), likely due to the presence of fewer lateral radiant fluxes and cooler exposures at lake sites compared with dry neighborhoods. Cooling benefits likely provide year-round outdoor comfort compared to desert-landscaped communities. The authors reinforce the conclusion that recycled water and treatment systems can reduce local heat island conditions and aid in combating extreme heat in the desert southwest. This study also shows that constructed wastewater-treatment wetlands in desert cities support sustainable residential developments.

1. Introduction

Desert urban dwellers often face many vulnerability challenges. One example is the Urban Heat Island (UHI) effect, especially since more than half the world’s population lives in urban areas. The UHI effect is caused by higher atmospheric and surface temperatures in urban areas than in the surrounding semi-urban and rural regions in peripheral zones [1,2]. The prevalence of surfaces such as asphalt and concrete, which absorb high quantities of solar radiation, contributes significantly to UHI. These materials are typically darker or have a lower albedo and do not reflect solar radiation like lighter-colored surfaces [3,4]. Thus, they keep nighttime temperatures elevated as they release heat absorbed during the day well into the evening [5]. Many of these materials are also impermeable, resulting in reduced evapotranspiration, which further increases air temperatures [6]. In addition, Greenhouse Gas (GHG) emissions produced by the industrial economy, vehicle use, and other factors exacerbate urban temperatures and impact human well-being [7].
The Phoenix metropolitan area experiences significant summer temperatures that can reach 40 °C or higher, climbing up to 50 °C in heat waves. Human health is impacted by extreme heat. For instance, 14,388 people in Arizona visited the emergency room for heat-related illnesses between 2017 and 2021 according to the Arizona Department of Health Services (AZDHS) [8]. From 2006 until 2016, Maricopa County heat-related deaths accounted for 13% of these deaths in the US [9]. AZDHS reported that between 2011 and 2021, 4433 deaths were caused by (1636) or related to (2797) excessive natural heat [10]. Notably, 2020 and 2021 were the deadliest years, with 313 and 302 heat-caused deaths (those where exposure to excessive natural heat is the primary cause of death) and 209 and 250 heat-related deaths (those that note heat on the death certificate, not including heat-caused deaths), respectively [11].
Various studies have demonstrated that green infrastructure in urban landscapes helps reduce UHI [12]. For example, trees reduce UHI through leaf transpiration and shade [9,13]. Bosch et al. (2022) noted that these cooling effects vary based on climatic conditions in each city and the methods used [13]. They call for further research to better understand how land use/land cover patterns impact air temperatures.
Water bodies also influence UHI by cooling the air through evaporation. Consequently, water features can potentially reduce city temperatures [14,15,16,17]. Research conducted in Beijing, China, suggests that water bodies with the most significant mass have the most considerable cooling impact. However, smaller, distributed water bodies can help achieve a balanced cooling effect in urban areas. Sun et al. compared water surfaces to green landscapes and built areas [16,17]. Water areas were 0.10 °C cooler than green landscapes and 3.49 °C cooler than built areas. They also found that temperatures over water surfaces are 1.75 °C/hectometer (HM) lower and 0.54 °C/HM lower over land surfaces close to the water. Despite the cooling ability and positive effects of water and green infrastructure with respect to human well-being [18], research has typically focused on large urban areas. Less attention has been given to residential neighborhoods [19].
The Crystal Gardens neighborhood in the City of Avondale, located in the Phoenix metropolitan area, presents a distinctive opportunity to investigate the influence of water bodies on residential areas. This community features artificial wetlands specifically designed for the treatment of wastewater. The process involves the circulation of recycled wastewater through ponds that contain a combination of wetland vegetation, soils, sedimentation, and microbial ecosystems. These integrated components effectively purify the wastewater, which is then channeled into recharge basins for further filtration into the groundwater aquifer. This innovative nature-based system not only offers cost-effective wastewater treatment solutions but also provides additional benefits to the community. These advantages include opportunities for recreational activities, air filtration, noise reduction, and microclimate regulation, contributing to a sustainable and enjoyable living environment [20].
These wetlands reduce air temperatures without impacting water availability. as they use wastewater rather than potable water [20]. In Ruiz-Aviles 2020 [20], satellite images taken around 10:30 am on May 2014 showed that Crystal Gardens had 5–19 °C cooler surface temperatures compared with Crystal Point, the neighborhood immediately southwest of Crystal Gardens. In the same study, surface temperatures in Crystal Gardens were 1 °C hotter and 6 °C cooler than in Crystal Point at 10:30 pm, depending on the surface material. Crystal Garden homes also have higher property values than nearby communities with similar houses [21,22,23].
This field study is considered a preliminary exploration of the impact of water infrastructure in this desert environment using actual measurements in the area. We analyze and discuss the wetland’s impact on air and mean radiant temperatures. In addition, this study examines the potential of constructed wetlands to mitigate extreme heat as part of a comprehensive study on sustainable green infrastructure, emphasizing its importance for human comfort and showcasing an interdisciplinary approach to address urban challenges.

2. Materials and Methodology

2.1. Study Area

The primary study neighborhood is Crystal Gardens (Figure 1). The Crystal Gardens and Crystal Point neighborhoods in the City of Avondale are located at 33.47° N, 112.30° W 297 m above sea level in the West Valley region of the Phoenix metropolitan area in Maricopa County, Arizona, USA. Due to the neighborhood’s configuration, we divided it into two parts, namely North Crystal Gardens (NCG) and South Crystal Gardens (SCG). These communities are characterized by 21 constructed ponds that act as a wastewater treatment facility, removing toxic waste and recharging the groundwater aquifer [24]. A typical Phoenix neighborhood community without water features near Crystal Gardens was included in the study to observe sites not exposed to the lakes. The dry neighborhood is Crystal Point (CP), located immediately south of NCG and adjacent to SCG to the west. CP consists primarily of desert landscaping and a small grass park near the center of the development that acts as a rain catchment area. The Crystal Gardens neighborhood consists of 905 homes located on 72 acres of wetlands separated into three flow systems [23]. According to the local climate zone (LCZ) scheme [25], the neighborhood is classified as open low-rise. Situated in the Sonoran Desert, Avondale has a semi-arid climate and a mean annual rainfall of 234 mm, most of which occurs during the winter from January to March and during the monsoon season in July and August. Figure 1 shows the neighborhoods and 28 locations where meteorological observations were performed three times daily (0900, 1200, and 1500). It is unknown precisely what surface water temperatures were for the sampling time in September, but a lake of similar depth and size in Tempe reports daily values. At this time of year, temperatures range from 35 °C to 40 °C at Tempe’s town lake [26].

2.2. Monitoring and Measurements

We had the opportunity, with permission from Avondale neighborhoods, to conduct on-site meteorological observations (circled locations in Figure 1) at 0900, 1200, and 1500 on 29 September 2018. Each walking temperature transect took ca. 1 h. Measurements included air temperature, relative humidity, wind speed, globe temperature, dew point, and Wet Bulb Globe Temperature (WBGT) collected using a Kestrel 4400 Heat Stress Meter (Kestrel Instruments, Boothwyn, PA, USA) at a 1.1 m height. The 1.1 m height is the center of gravity of the human body for standing subjects [27]. Surface temperatures were also taken with a DeltaTRAK 15002 infrared thermometer (DeltaTrak, Pleasanton, CA, USA) at each observation point for reference but are not used in this paper. All instruments comply with ISO standards [27] for sensor measurement range and accuracy (Table 1).
We calculated mean radiant temperature (Tmrt, °C) from observed globe temperature (Tg, °C), air temperature (Tair, °C), and wind speed (Va, m/s) for all transect locations at different times of the day using Equation (1).
T m r t = T g + 273.15 4 + 1.1 · 10 8 V a 0.6 D 0.4 T g T a 0.25 273.15
where globe emissivity is ε = 0.95, globe diameter is D = 0.0254 m, and the globe’s mean convection coefficient is 1.1 · 10 8 V a 0.6 [m/s] [28].
A high-quality weather station maintained by the Salt River Project (SRP), the area’s energy and water company, located very near the neighborhoods (less than 1 km to the south) and adjacent to agricultural fields and a freeway was chosen as a reference site. There is significant irrigated agriculture land cover adjacent to the north and west and across a main, paved road to the south and southwest. There is also a sizable fallow field with scattered vegetation to the east. To the southeast are buildings, parking lots, and desert surfaces. Typical morning winds are easterly, switching to southwesterly in the afternoon, meaning agricultural irrigation may impact the site.
Data for 29 September 2018 were accessed through the MesoWest website [29] and consisted of Tair, RH, wind speed, wind direction, and incoming solar radiation on a 5 min basis, with a few 5 min observations missing (Figure 2a,b). We inspected all these variables and report just air temperature and wind direction to interpret our mobile temperature transect results. The chosen day was clear with noon transmittance of incoming solar radiation of 75%, as indicated by a calculation of surface receipt in proportion to the top-of-the-atmosphere values for this date. At the SRP site, Tair ranged from a low of 26.2 °C to a high of 40.7 °C. Referring to normal data for this time of year at this station indicated that the minimum temperature was 8 °C higher, the maximum was 4 °C higher, winds were similar, and humidities were near normal for 29 September 2018. Winds were low, averaging 1.1 m/s in the morning to 2.1 m/s in the afternoon. The wind direction was east and southeast in the morning, switching to more southerly and southwest in the afternoon. It should be noted that wind direction becomes more variable after 1100 h as a transition to general up-valley flow commences, which is typical of the Phoenix area. RH was low, ranging between 15 and 20%, which is also typical for this time of year.

3. Results

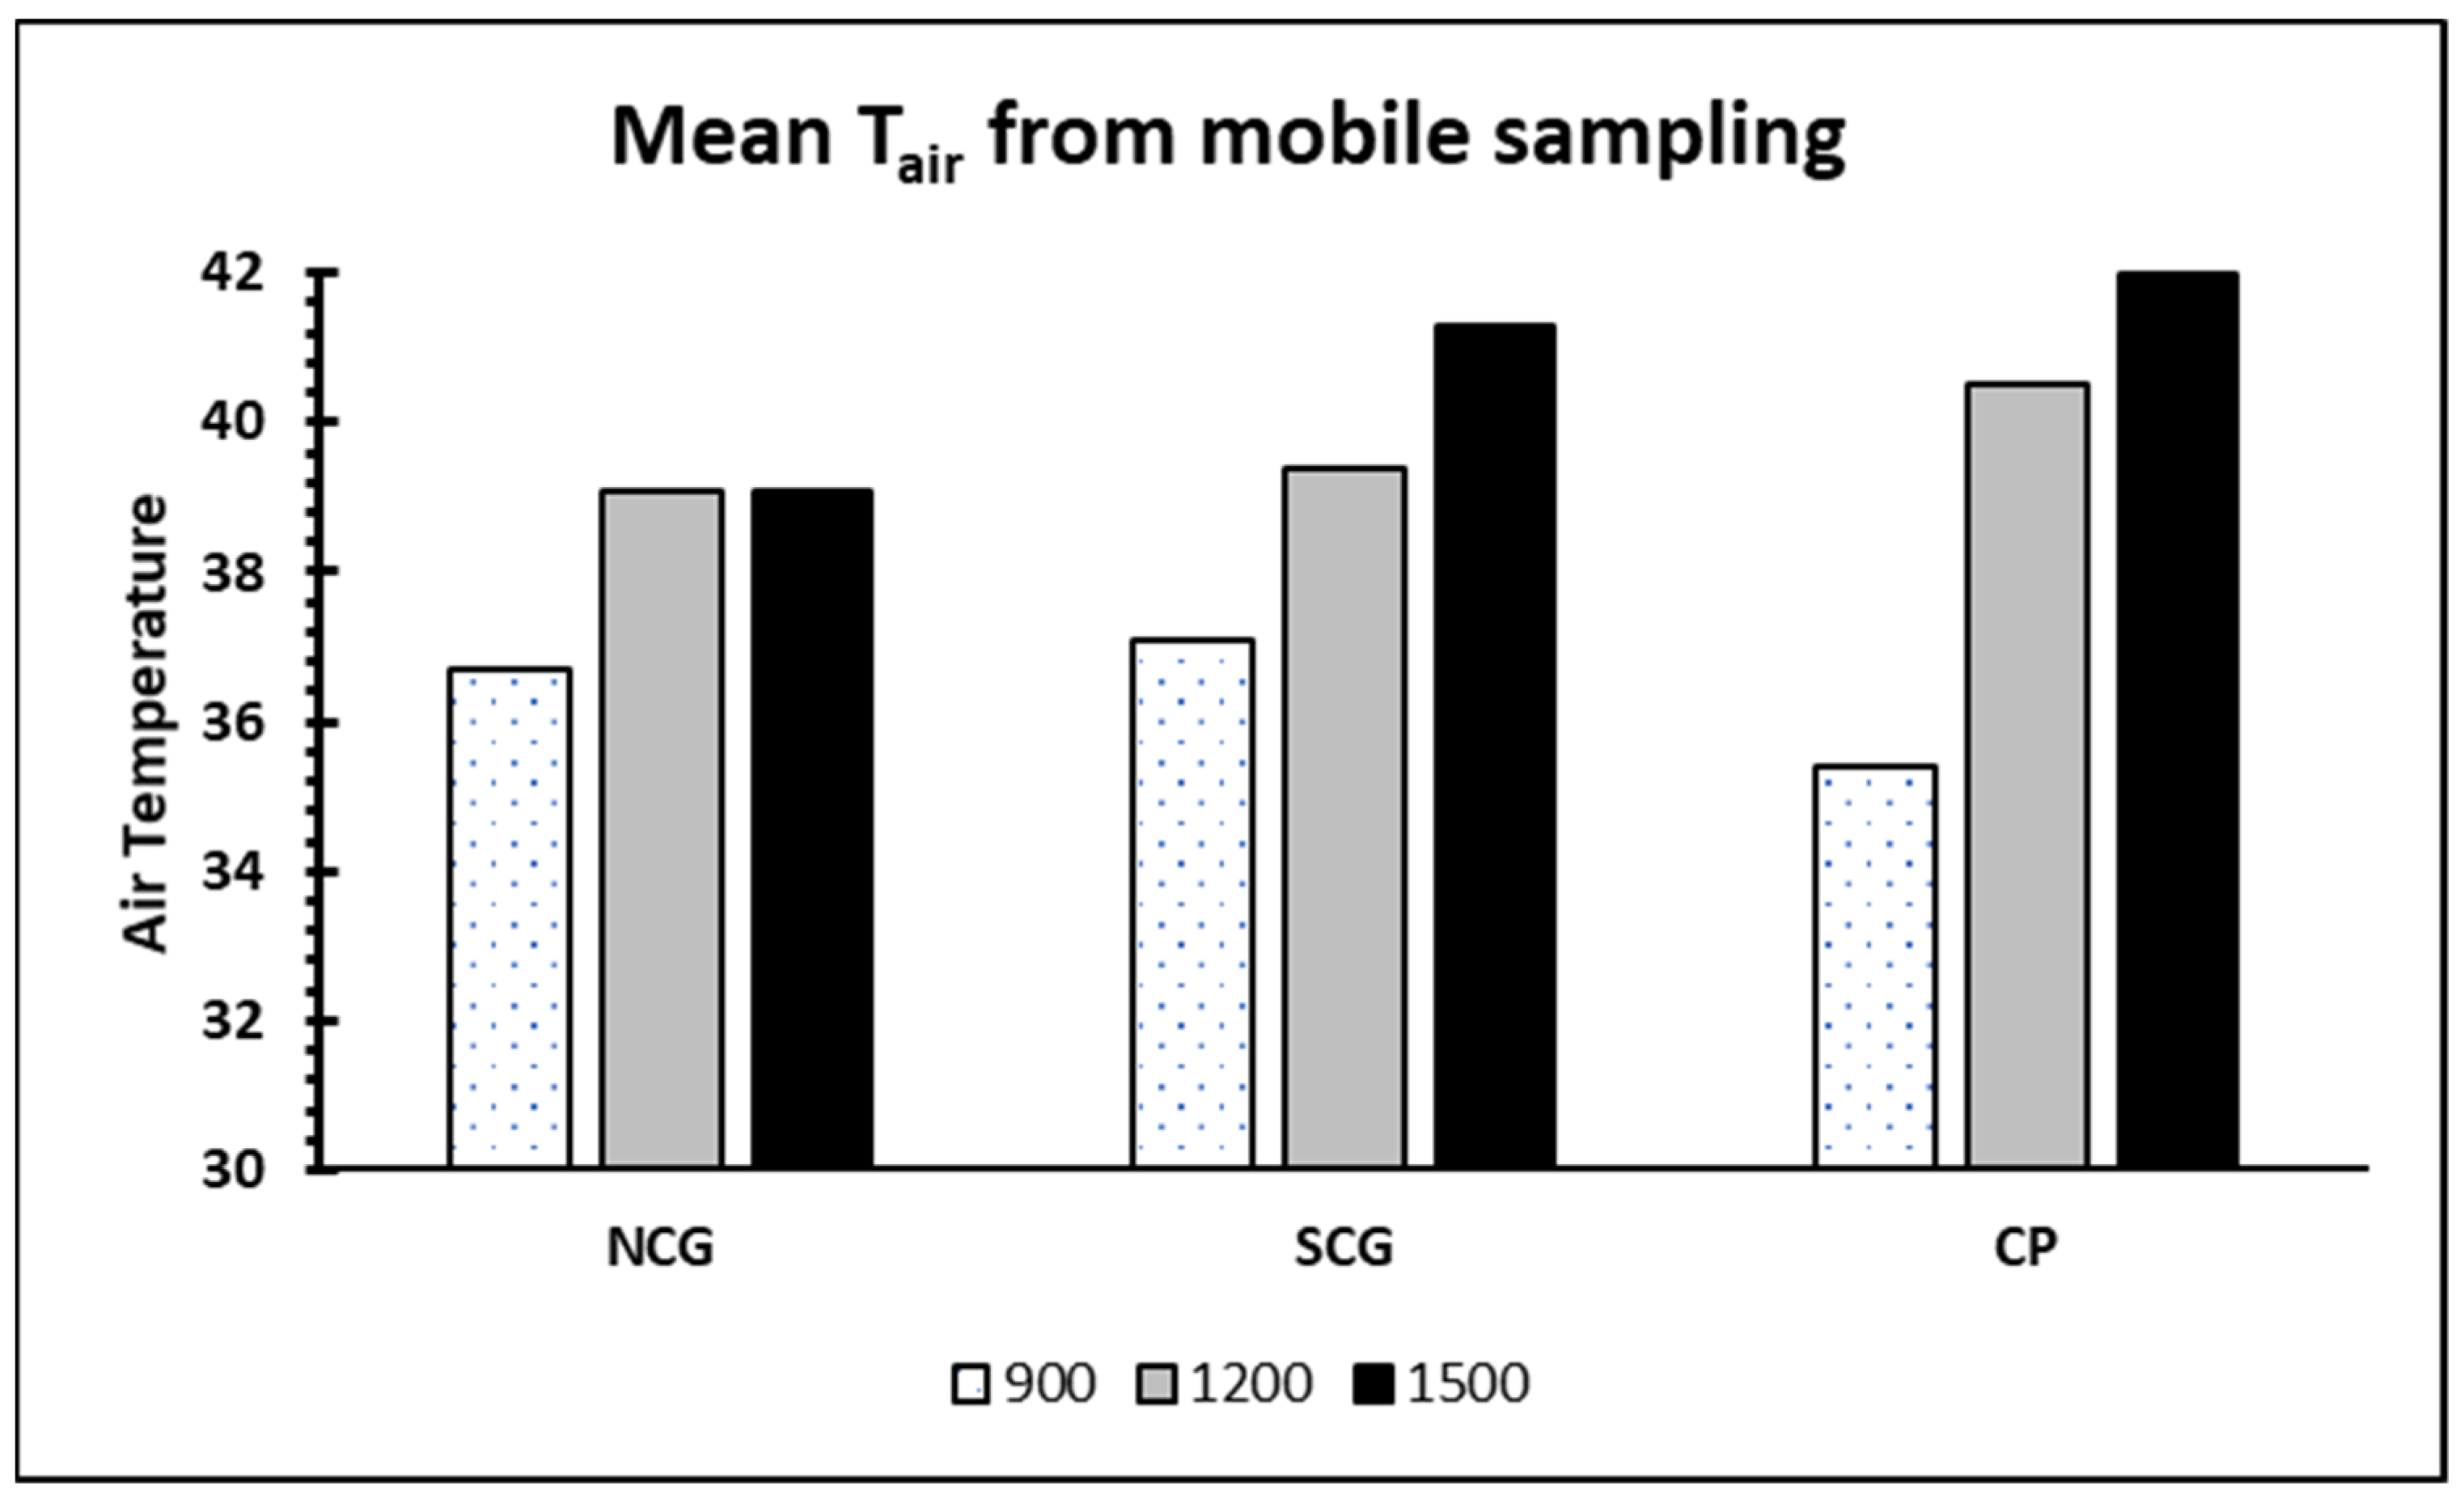
3.1. Overall Mean Air Temperature (Tair)

To generalize the results overall, air temperatures (Tair) for all three times during the day and all neighborhoods were arrayed in columns for all data from NCG, SCG, and CP. An analysis was performed using the difference of means test for ΔTair(NCG–CP) and ∆Tair(SCG–CP) to determine the degree of overall cooling that might have been experienced as a function of the lake environments of the two Crystal Garden areas in comparison to the drier CP neighborhood. Table 2 shows paired statistics obtained using bootstrapping, and Table 3 shows mean differences and significance.
The data confirm that NCG experienced more cooling than SCG and CP (mean of −0.98 °C cooler, sig. at 0.05 level). However, SCG differences from Crystal Point showed no significant differences, although SCG’s data suggest a 0.14 °C cooling effect. The slight differences in Tair among the neighborhoods are expected, given the time of year (late September), as explained by Ruiz-Aviles et al. [20] and as evidenced in a detailed study of Sun City lake environments [28].
In addition to the overall statistical analysis, the fine time resolution (5 min) of SRP observations allowed us to virtually match each of our Tair point measurements from the three-neighborhood walking transects to SRP weather station points in time. This method allowed for a more accurate assessment of how resultant observations could be compared to a “control” site and, thus, to each other for various times of day. This approach is essential in any mobile sampling method that takes time to accomplish and may not be synchronous among sampling locations.
We simply calculated the percentage of sites in the walking tour for the three measurement periods that were lower than the corresponding SRP reference-site temperatures for each of the neighborhoods. We then compared the percentages between SCG and CP and between NCG and CP. We expected to find that the percentages of sites for SCG and NCG cooler than SRP would be higher than those of CP. In fact, the results indicate that for NCG, at 0900, 1200, and 1500, a higher percentage of sites than at CP were cooler than SRP by 33%, 1%, and 21%, respectively. The corresponding percentages at SCG cooler than at the SRP sites in comparison to the CP sites were 7%, 4%, and 18% for the times of 0900, 1200, and 1500, respectively. These findings are consistent with the overall statistics from Table 3 but point out the significance of evaluating the microclimate on a diurnal basis. During the warming phase of the diurnal temperature from the minimum time to noon (during which wind direction is consistently in alignment with major parts of the lakes), higher percentages of sites in NCG and SCG were cooler than in CP compared to SRP temperatures. During the noon to 1300 time period, the differences were minimal among sites; as wind increases, wind direction becomes more variable, and the role of the lakes does not appear to be as significant for all the sites chosen in SCG and NCG compared to CP. After 1500, the cooling phase of the diurnal temperature commences, and the percentage of sites at SCG and NCG that are cooler than SRP temperatures is higher than at CP. We attribute this to the lack of any lake effects in CP and what must be a larger heat storage capacity and sensible heating influence on air temperatures.

3.2. Air Temperatures and Mean Radiant Temperature at Lake Exposed Sites and in the Dry Neighborhood

The mean temperature approach belies significant differences that arise within the day by separating lakeside from non-lakeside sampling points. To estimate the lake exposure effect on Tair and Tmrt, we chose data points exposed to the lakes for the three times of day at NCG and SCG and the corresponding CP observations at respective observation times (no lake exposure, just dense neighborhood housing exposure). The shoreline-exposed sites, in comparison to sites in the dry neighborhood of CP, are depicted in Figure 3 and Figure 4.
The Tair values at both the NCG and SCG sites are slightly warmer than those in the CP neighborhood, as the lake has a slight moderating influence on temperatures in early morning, while the CP sites experience radiative cooling in the absence of lake effects. Note that the SRP site, which is in an exposed field (absent buildings), has a minimum temperature of 26 °C, reaching 32 °C by 0900—some almost 4 °C cooler than the neighborhoods, demonstrating the overall heat island effect in a built neighborhood from early to mid-morning and consistent with other research conducted in Phoenix. However, as the regional temperatures rise from 0900 to 1500, the lake-exposed sites do not heat up as much as the dry CP neighborhood. By 1200 and 1500, lakes moderate temperatures (sites kept cooler by some 1–3 °C), especially noticeable at the NCG lakeside sites.
In dry, hot climates, mean radiant temperature (Tmrt) is an excellent measure of human comfort, providing a more accurate portrayal of comfort than air temperature or any heat index, although it is difficult to accurately assess without using a six-radiometer array to obtain all fluxes [30]. To provide estimates of this parameter, we applied Equation (1) to data registered from the Kestrel instrument (Tg, Tair, and Vair), realizing sizeable errors could be introduced for Tmrt in comparison to the method using the six-radiometer approach, although the two methods have a significant correlation. In [30], use was made of a set of observations collected using a mobile cart labeled MaRTy, which estimates six directional radiative fluxes (shortwave (Ki) and longwave (Li) components), namely downward, upward, and in four cardinal lateral directions. The equation used to derive Tmrt in °C in [30] is expressed as follows:
T M R T = i = 1 δ W i α k K i + α l L i α l σ 4 273.15   K
K refers to the Kelvin scale. Tmrt is calculated from six-directional Ki and Li observations, applying angular factors (Wi) for a standing reference person, where ak = 0.70 and ai = 0.97, which are the absorption coefficients for shortwave and longwave radiant flux densities, σ is the Stefan–Boltzmann constant, Wi = 0.06 for the up and down sensors, and Wi = 0.22 for the sensors pointing in each cardinal direction. Lateral components of the longwave flux make the largest contribution to pedestrian Tmrt so that the lateral surroundings of a person are critical to human comfort, in addition to shade [30].
Although air temperatures indicate effects of the lakes, a more significant measure of neighborhood comfort is the Tmrt parameter. In the morning, noon, and afternoon hours, our Tmrt values in NCG and SCG are lower by 5–10 °C, 15–20 °C, and ca. 15 °C, respectively, than those sites in CP (Figure 5).
These results show an advantage in terms of comfort for lake exposures in NCG and SCG compared to CP, likely for reasons related to surface temperature effects and lateral longwave contributions to Tmrt values. Our diurnal values of Tmrt align with expectations for this time of year, as indicated by results from a broader experiment conducted in the Phoenix area [30]. Although all sites show a degree of heat discomfort for September 29, more comfortable conditions prevail in lakeside areas. We feel that the surrounding lateral radiative environment from the built-up neighborhood sites of CP contributes significantly to higher Tmrt temperatures in comparison to lakeside sites, which have considerably fewer lateral building view factors contributing to Tmrt values.
Recent research has demonstrated the importance of lateral radiant fluxes in the determination of human comfort for a standing person but not that of lake exposure to the best of our knowledge. For example, ref. [30] relates lateral longwave radiant fluxes to 360 degree impervious fractions, illustrating that higher 0.5 higher values of impervious fraction (which would be typical of CP in comparison to NCG and SCG) would increase Tmrt by some 5 °C. Furthermore, the impact of irrigated surface temperatures can account for the 11 °C lower Tmrt than over impervious surfaces. When combined, these two factors may account for the significant differences we observed between lakefront properties and neighborhood conditions with little irrigation and a large, impervious surface cover. Further research in this lake environment with sophisticated mean radiation temperature sensors and calculations of sky view and built environment factors is certainly warranted, especially for sites with different orientations relative to lake and shoreline exposures over the course of a year.

4. Discussion

The present field study is limited to late summer and does not capture any inter-annual variability that occurs. Two past studies, however, shed light on a possible seasonal view of lakeside temperature benefits (cooling) and provide insights into annual impacts. The first is an older study of temperature over differing residential landscapes in a nearby retirement community [28]. The second is a year-round human comfort simulation study of three types of landscapes in the Phoenix area [31].
The first study evaluated three residential landscapes in Sun City, AZ, a retirement community of relatively uniform housing similar to the Avondale communities [28]. Three sites were monitored year-round, beginning in August 1987 through the end of July 1988. The sites included a backyard along a turf golf course, a desert landscape backyard away from the lakes, and a desert landscape backyard along the water. The desert site away from the lakes was similar to our CP sites; the lakeside sites were similar to most NCG and SCG sites.
The mean Tair at 2 m for the three sites illustrates the cooling benefits of turf and lakeside locations. Tair differences in summer peaked at 5.5 °C between desert and turf and 5 °C between desert and lakeside. In late summer, the lakeside site was ca. 1 °C cooler than the desert, similar to our results from Avondale in September. Therefore, our September field survey results appear to be consistent with the September cooling at lake exposures noted in the Sun City study [28]. By September, lake temperatures have peaked from the summer, and air temperatures are declining from mid-summer. Thus, overall differences of lakes vs. neighborhood temperatures are in a declining phase. The Sun City study, however, did not explore diurnal variations of lake effects or the specific human comfort afforded by lake exposure using an accurate measure of human comfort. Our Tmrt observations for September point to substantially lower mean radiant temperatures for NCG and SCG lake sites than in CP, despite overall hot conditions. For a more in-depth comparison, Avondale would need to be monitored year-round.
Some insights into year-round human comfort can be gleaned through the diurnal and seasonal human-comfort simulations conducted by Hartz et al. (2006) as part of the ongoing CAPLTER project on urban ecology in the Phoenix area [31]. That research illustrated the year-round, diurnal cooling and comfort benefits of mesic versus xeric and urban landscapes using typical meteorological year data for Phoenix and a human comfort model. Mesic refers to turf- and water-dominated residential landscapes (such as those found in NCG and SCG). Xeric refers to desert landscape residences (such as those found in CP). Hartz et al. (2006) used an airport site dominated by asphalt and cement for urban human comfort simulations. The simulation used typical human characteristics (height, weight, clothing, etc.) and human energy budget principles [32,33].
The results of the simulation (Figure 5) show the percentage of the population that would experience comfort for various times of day (e.g., 1000 and 1700 h, which are at the beginning and end of our sampling period) and times of year (January to December) for Phoenix.
Early in the day, only mesic landscapes promote some degree of comfort in most months. In late spring–early summer and again in late summer–early fall, more comfort is apparent from mesic landscapes, thus extending comfort during the year. Our Avondale Tmrt results are consistent with these human comfort simulations for September. Early-morning comfort for mesic areas was realized in the simulations, and the observed Tmrt values for Avondale lakeside sites are considerably lower than in the dry CP neighborhood, indicating an increase in comfort. However, the exact human comfort conditions and, thus, year-round cooling benefits for Avondale remain to be investigated in future studies. The Tair results are similar to those reported in [17] and studies reviewed in [32]. The Avondale and Sun City results do align with many of the blue/green research values of seasonal cooling benefits cited by Yu et al. (2020).
The differences between NCG, SCG, and CP found by Ruiz-Aviles et al. (2020) and in this field study help explain a preliminary result of an ongoing social perception study in the area, according to which 35.9% of households consider Crystal Gardens cooler than similar neighborhoods without artificial wetlands. Moreover, this study’s findings could explain the increase in property prices between the construction of the artificial wetlands and today [34], in addition to offering a potential explanation for why property values in Crystal Garden can be about USD 30,000 (14%) higher than other properties in similar neighborhoods. Finally, the lower heat sensation permits residents to enjoy outdoor activities more during the summer when they are impossible in other places due to the heat.

5. Conclusions

Previous research by Ruiz-Aviles (2020) and this preliminary field study confirm the cooling benefits typically cited in the blue/green literature in this extreme desert city environment [24]. Observed Tair values were some 1–3 °C cooler near the lakes, and substantial differences of 5–20 °C in Tmrt were recorded, primarily as a function of nearby cool water, in addition to fewer lateral longwave radiant fluxes from nearby buildings, as likely causes to explain differences in the Tmrt calculations from Kestrel readings. The current study also verifies how incorporating sustainable blue/green landscape features, such as artificial wetlands for wastewater treatment, in arid desert cities can help increase residents’ potential comfort compared to desert landscaping and the surrounding desert conditions. These findings are paramount, as heat is a significant vulnerability issue in this environment. Much research in Phoenix has also considered trade-offs with respect to the amount of water used to maintain vegetation to obtain cooling benefits. However, trade-offs are not as much a consideration for the Crystal Gardens neighborhood, as wastewater is used.
This study contributes to the growing body of knowledge on the interplay between urban ecology and the mitigation of extreme climatic challenges. The emphasis on cooling effects within residential environments is particularly pivotal in an era marked by intensifying global climate variations. The potential of green infrastructure, often advocated for in expansive urban landscapes, finds significant utility within the intricate fabric of residential life, as evidenced by the Avondale case study. Nevertheless, it is imperative to underline that the potential of these findings is not confined to this specific locale. Rather, they accentuate a template that could be adapted and tailored to suit diverse urban contexts grappling with similar climatic challenges.
Finally, the results of this study may be significant when considering the design of a neighborhood in desert cities in a context where the UHI effect can exacerbate the damage caused by heat waves to public health. This means that it is essential to study and implement new urban planning practices, looking for solutions to the UHI effect and the possible longer heat periods that can generate issues associated with human comfort and interruptions in essential services like energy and water, among others.

Author Contributions

Conceptualization, J.M.D., A.B., V.R.-A., B.H. and D.P.; Methodology, B.H., V.R.-A., A.B., J.M.D. and D.P.; Validation, A.B. and V.R.-A.; Formal analysis, A.B. and V.R.-A.; Investigation, V.R.-A., A.B., J.M.D., B.H. and D.P.; Writing—original draft, all authors; Writing—review and editing, V.R.-A., A.B. and D.P.; Project administration, D.P. All authors have read and agreed to the published version of the manuscript.

Funding

This research received no external funding.

Institutional Review Board Statement

Not applicable.

Informed Consent Statement

Not applicable.

Data Availability Statement

The data presented in this study are available on request from the corresponding author.

Acknowledgments

We would like to thank the City of Avondale Planning Department, the Crystal Garden Neighborhood, and those who aided in field data collection. We are also grateful to our colleague, Ariane Middel of Arizona State University, for valuable discussions.

Conflicts of Interest

The authors declare no conflicts of interest.

References

  1. Voogt, J.A. Urban Heat Islands: Hotter Cities. Am. Inst. Biol. Sci. 2004, 1–2. [Google Scholar]
  2. Wilson, B. Urban Heat Management and the Legacy of Redlining. J. Am. Plann. Assoc. 2020, 86, 443–457. [Google Scholar] [CrossRef]
  3. Cordova Saez, K. Impacts of thermal islands or urban heat islands, on the environment and human health: Comparative seasonal analysis: Caracas, October-2009, March-2010. Terra 2011, 27, 95–122. [Google Scholar]
  4. Fadhil, M.; Hamoodi, M.N.; Ziboon, A.R.T. Mitigating urban heat island effects in urban environments: Strategies and tools. IOP Conf. Ser. Earth Environ. Sci. 2023, 1129, 012025. [Google Scholar] [CrossRef]
  5. Reeve, K.; Kingston, R. Green Works for Climate Resilience: A Guide to Community Planning for Climate Change; National Wildlife Federation: Washington, DC, USA, 2014. [Google Scholar]
  6. Li, Z.L.; Wu, H.; Duan, S.B.; Zhao, W.; Ren, H.; Liu, X.; Zhou, C. Satellite remote sensing of global land surface temperature: Definition, methods, products, and applications. Rev. Geophys. 2023, 61, e2022RG000777. [Google Scholar] [CrossRef]
  7. Murphy-Greene, C.; Brown, M.A. Climate Justice and Vulnerable Populations. In Environmental Justice and Resiliency in an Age of Uncertainty; Routledge: New York, NY, USA, 2022; pp. 14–35. [Google Scholar]
  8. Arizona Department of Health Services. Heat-Related Illness Emergency Department & Inpatient Admissions in Arizona by Year (2017–2021)”. ADHS. 2022. Available online: https://www.azdhs.gov/documents/preparedness/epidemiology-disease-control/extreme-weather/pubs/heat-related-illness-emergency-department-and-inpatient-admissions-in-arizona-by-year.pdf (accessed on 23 April 2022).
  9. Ban-Weiss, G.A.; Bala, G.; Cao, L.; Pongratz, J.; Caldeira, K. Climate forcing and response to idealized changes in surface latent and sensible heat. Environ. Res. Lett. 2011, 6, 034032. [Google Scholar] [CrossRef]
  10. Iverson, S.A.; Gettel, A.; Bezold, C.P.; Goodin, K.; McKinney, B.; Sunenshine, R.; Berisha, V. Heat-associated mortality in a hot climate: Maricopa County, Arizona, 2006–2016. Public Health Rep. 2020, 135, 631–639. [Google Scholar] [CrossRef]
  11. Arizona Department of Health Services. Heat-Caused & Heat-Related Deaths in Arizona by Year (2011–2021)”. AZDHS. 2023. Available online: https://www.azdhs.gov/documents/preparedness/epidemiology-disease-control/extreme-weather/pubs/heat-related-mortality-year.pdf (accessed on 21 April 2024).
  12. Lewis, O.V.; LaRoche, P.; Hutchison, J.-M.; Ponce, A. Understanding Efficient Mitigation Strategies for Los Angeles’ Heat Islands using OLS Regression Analysis. 2022. Available online: http://www.arcc-arch.org/wp-content/uploads/2022/05/Lewis-Olivia-Vander-Poel-La-Roche-Pablo-Hutchison-Joey-Michelle-Ponce-Arianne_Understanding-Efficient-Mitigation-Strategies-for-Los-Angeles-Heat-Islands-using-OLS-Regression-Analysis.pdf (accessed on 21 April 2024).
  13. Bosch, M. A spatially-explicit approach to simulate urban heat islands in complex urban landscapes. Geosci. Model Dev. Discuss. 2021, 14, 3521–3537. [Google Scholar] [CrossRef]
  14. Gianniou, S.K.; Antonopoulos, V.Z. Evaporation and energy budget in Lake Vegoritis, Greece. J. Hydrol. 2007, 345, 212–223. [Google Scholar] [CrossRef]
  15. Wang, Y.; Zhang, Y.; Ding, N.; Qin, K.; Yang, X. Simulating the impact of urban surface evapotranspiration on the urban heat island effect using the modified RS-PM model: A case study of Xuzhou, China. Remote Sens. 2020, 12, 578. [Google Scholar] [CrossRef]
  16. Sun, R.; Chen, L. How can urban water bodies be designed for climate adaptation? Landsc. Urban Plan. 2012, 105, 27–33. [Google Scholar] [CrossRef]
  17. Sun, R.; Chen, A.; Chen, L.; Lü, Y. Cooling effects of wetlands in an urban region: The case of Beijing. Ecol. Indic. 2012, 20, 57–64. [Google Scholar] [CrossRef]
  18. Zheng, H.W.; Shen, G.Q.; Song, Y.; Sun, B.; Hong, J. Neighborhood sustainability in urban renewal: An assessment framework. Environ. Plan. B Urban Anal. City Sci. 2017, 44, 903–924. [Google Scholar] [CrossRef]
  19. Wratten, S.D.; Sandhu, H.; Cullen, R.; Costanza, R. Ecosystem Services in Agricultural and Urban Landscapes, 152; Wiley Online Library: Hoboken, NJ, USA, 2013. [Google Scholar]
  20. Ruiz-Aviles, V.; Brazel, A.; Davis, J.M.; Pijawka, D. Mitigation of Urban Heat Island Effects through ‘Green Infrastructure’: Integrated Design of Constructed Wetlands and Neighborhood Development. Urban Sci. 2020, 4, 78. [Google Scholar] [CrossRef]
  21. Abbott, J.K.; Klaiber, H.A.; Smith, V.K. Economic Behavior, Market Signals, and Urban Ecology. Natl. Bur. Econ. Res. 2015. Available online: https://www.nber.org/system/files/working_papers/w20959/w20959.pdf (accessed on 21 April 2024).
  22. City of Avondale. Crystal Gardens Lakes/Wetlands. 2023. Available online: https://www.avondaleaz.gov/government/departments/public-works/water/crystal-gardens-wetlands (accessed on 21 April 2024).
  23. Crystal Gardens HOA. Welcome to Crystal Gardens. 2021. Available online: https://www.crystalgardenshoa.com/ (accessed on 21 April 2024).
  24. World Meteorological Organization. Guidance on Measuring, Modelling and Monitoring the Canopy Layer Urban Heat Island; WMO: Geneva, Switzerland, 2023. [Google Scholar]
  25. Stewart, I.D.; Oke, T.R. Local Climate Zones for Urban Temperature Studies. Bull. Am. Meteorol. Soc. 2012, 93, 1879–1900. [Google Scholar] [CrossRef]
  26. City of Tempe Weather. Available online: https://wx.tempe.gov/ (accessed on 21 April 2024).
  27. International Organization of Standardization. Ergonomics of the Thermal Environment—Instruments for Measuring Physical Quantities; ISO: Geneva, Switzerland, 2023. [Google Scholar]
  28. Brazel, A.J.; Verville, H.J.; Lougeay, R. Spatial-temporal controls on Cooling Degree Hours: An energy demand parameter. Theor. Appl. Climatol. 1993, 47, 81–92. [Google Scholar] [CrossRef]
  29. MesoWest. MesoWest Data. Mesowest. 2023. Available online: https://mesowest.utah.edu/ (accessed on 21 April 2024).
  30. Middel, A.; Krayenhoff, E.S. Micrometeorological determinants of pedestrian thermal exposure during record-breaking heat in Tempe, Arizona: Introducing the MaRTy observational platform. Sci. Total Environ. 2019, 687, 137–151. [Google Scholar] [CrossRef] [PubMed]
  31. Hartz, D.A.; Brazel, A.J.; Heisler, G.M. A case study in resort climatology of Phoenix, Arizona, USA. Int. J. Biometeorol. 2006, 51, 73–83. [Google Scholar] [CrossRef]
  32. Yu, Z.; Yang, G.; Zuo, S.; Jørgensen, G.; Koga, M.; Vejre, H. Critical review on the cooling effect of urban blue-green space: A threshold-size perspective. Urban For. Urban Green. 2020, 49, 126630. [Google Scholar] [CrossRef]
  33. Heisler, G.M.; Wang, Y. Applications of a human thermal comfort model. In Proceedings of the Fourth Symposium on the Urban Environment, Norfolk, VA, USA, 19–24 May 2002; pp. 70–71. [Google Scholar]
  34. Davis, J.; Hagen, B.; Mahid, Y.; Pijawka, D. Evaluating Property Value Impact from Water-Related ‘Green Infrastructure’: A Hedonic Modeling Approach. J. Green Build. 2023, 18, 3–16. [Google Scholar] [CrossRef]
Figure 1. The study area, including NCG (North Crystal Garden), CP (Crystal Point), and SCG (South Crystal Garden). Circles represent ca. 150 m diameter around measurement points, as an estimate of source areas of Tair. The immediate environment of a measurement point remains most important, since microscale effects dominate the temperature signal. Sensors located in areas with densely packed buildings have smaller and more poorly defined thermal source areas (much less than 500 m diameter) and smaller areal representativeness compared to those sited in more open zones [24]. The location of the major weather site run by the Salt River Project company is shown by the initials SRP on map.
Sustainability 16 05456 g001
Figure 2. (a,b) Weather variables for the SRP site on 29 September 2018. Temperature is presented in °C at 2 m, and wind direction is reported in degrees. Data are from the MesoWest website [29].
Sustainability 16 05456 g002
Figure 3. Mean Tair (°C) at lake exposures at 0900–1000 (dotted), 1200–1300 (gray), and 1500–1600 (black) mobile samples for NCG, SCG, and CP.
Sustainability 16 05456 g003
Figure 4. Mean Tmrt (°C) at lake exposures at 0900–1000 (dotted), 1200–1300 (gray), and 1500–1600 (black) mobile samples for NCG, SCG, and CP.
Sustainability 16 05456 g004
Figure 5. Monthly diurnal simulations of % of people comfortable in mesic, xeric, and urban landscapes using a human thermal comfort model called OUTCOMES. Input data from August 2002 to July 2003.
Sustainability 16 05456 g005aSustainability 16 05456 g005b
Table 1. Sensor specifications and measurement height for handheld observation.
SensorVariable (s)RangeAccuracyHeight
Kestrel 4400Air temperature−10 to +55 °C ±0.5 °C 1.1 m
Relative humidity0 to 100% RH±3.0% RH
Globe temperature −10 to +55 °C±1.4 °C
TmrtSee Equation (2)±0.7 °C
Wind speed0.6 to 60.0 ms−1Largest of 3% of reading, least significant digit, or 20 ft/min
DeltaTRAK 15002Surface temperature−40 to 510 °C±2.0 °C1.1 m
Table 2. Descriptive statistics of Tair at NCG, SCG, and CP in °C.
NeighborhoodTair (°C)
NCGMean37.9
N (# of data points)27
Std Dev2.99
SCGMean38.7
N27
Std Dev2.63
CPMean38.9
N27
Table 3. Difference of means test at NCG-CP and SCG-CP (Tair, °C).
Meant ValueSig.
NCG-CP−0.98−2.0120.05
SCG-CP−0.14−0.237Not sig.
Disclaimer/Publisher’s Note: The statements, opinions and data contained in all publications are solely those of the individual author(s) and contributor(s) and not of MDPI and/or the editor(s). MDPI and/or the editor(s) disclaim responsibility for any injury to people or property resulting from any ideas, methods, instructions or products referred to in the content.

