Article

The Impact of Desert Regions on Solar Energy Production with the Evaluation of Groundwater for Maintenance: A Case Study in Morocco

by
Ali Ait Ali
1,*,
Youssef Ouhassan
2,
Mohcine Abouyaakoub
1,
Mbarek Chahboun
1 and
Hicham Hihi
1
1
Laboratory of Engineering, Systems and Applications, National School of Applied Sciences, Sidi Mohamed Ben Abdellah University, Fez, Morocco
2
Laboratory of Electronic Systems, Information Processing, Mechanics and Energy, Department of Physics, Faculty of Sciences, Ibn Tofail University of Kenitra, Kenitra, Morocco
*
Author to whom correspondence should be addressed.
Sustainability 2024, 16(13), 5476; https://doi.org/10.3390/su16135476
Submission received: 19 May 2024 / Revised: 18 June 2024 / Accepted: 21 June 2024 / Published: 27 June 2024
(This article belongs to the Special Issue Renewable Energy, Electric Power Systems and Sustainability)

Abstract

:
The aim of this research work is to investigate the influence of temperature and wind-blown dust on solar energy production in a desert region of Morocco. Moreover, it aims to assess the quality of water, in particular the groundwater used for the maintenance of photovoltaic panels (quality analysis). This region is characterized by very high temperatures and wind-blown dust in the summer, which has a major impact on the production of the photovoltaic panels. Before installing this maintenance system (cooling and cleaning using water), we decided to assess the quality of this water, whose temperature generally varies between 10 and 16 °C at a depth of 4 m, whatever the season. This is an important, stable, and sustainable source of water that can be entirely used to protect the photovoltaic modules from wind-blown dust and temperature in order to improve their efficiency. However, this water can also have a major impact on the quality of the energy. It can be contaminated with limestone and salts, which can cause the photovoltaic panels to block. All the research and studies carried out in the context of maintenance using water do not take into account the nature of this water (whether it is good or bad). After simulating our model on the Matlab-Simulink environment, we can see that the temperature has a significant influence on solar energy production (a reduction of power by 20% at 45 °C) in this region. Moreover, after the assessment of the water quality in our school laboratory, we found that the water, and especially the groundwater in this desert region of Morocco, are suitable for the maintenance of photovoltaic panels.

1. Introduction

Photovoltaic modules lose their efficiency due to a number of factors, including the influence of external factors such as temperature, wind, humidity, and dust accumulation, as well as the characteristics of the photovoltaic system, such as the angle of inclination, altitude, and orientation. One of the main factors affecting the performance and capacity of photovoltaic panels is dust [1]. A part of our research in renewable energies is focused on simulation [2] aimed at optimizing the performance of photovoltaic panels.
A study of an innovative technology to cool photovoltaic modules using their back surface, called IPCoSy (Innovative photovoltaic cooling system). The test results show that using this system, whether in association with a controlled flow or simply with water, produces significant energy benefits of up to 7.63%. The IPCoSy provides remarkable improvements in energy efficiency compared with standard modules, with gains of up to 9.02% compared with modules equipped with limited rear ventilation. What’s more, it can be integrated into existing water heating systems to achieve a maximum thermal efficiency of 55.88% [3]. The deposition of dust on the surface of PV modules and high temperatures are major constraints related to the conditions of photovoltaic systems in the Saharan environment. In fact, the Saharan environment is characterized by frequent and permanent sandstorms. However, the opinions are different on the significant impact on the production of photovoltaic modules. The accumulation of dust on the surface of solar photovoltaic modules results in a reduction in short-circuit current (Isc) and output power, compared with the same parameters for clean modules. The average rate of performance degradation of solar modules exposed to dust is 6.24%, 11.8%, and 18.74% for exposure periods of one day, one week, and one month, respectively [4]. Studies show that light transmission varies according to the type of dust. Laboratory experiments are carried out using various instruments such as microscopes, spectrophotometers, I-V photovoltaic module analyzers, and data loggers equipped with thermocouples. The results obtained show that fluctuations in physical parameters such as grain size and type, light transmission level, and the temperature of the glass lead to changes in the performance of the photovoltaic (PV) panel [5]. The presence of dust results in a 21.57% decrease in photovoltaic module output power for dusty panels compared to clean panels. In addition, a lower reliability of dusty panels compared to their clean counterparts was observed, mainly due to the loss of output power caused by the effect of dust. These results clearly highlight the importance of proper maintenance and service of photovoltaic modules to prevent their degradation due to dust deposits [6]. An approach based on temperature prediction to analyze the performance of photovoltaic systems, considering variations in solar radiance. It proposes a precise method for estimating panel resistances, with an accuracy of less than 0.02% at the maximum PowerPoint. Evaluation of photovoltaic configurations shows that Total-Cross-Tied minimizes losses by up to 12% under imbalance, highlighting its efficiency under real conditions. This approach offers more accurate results when the temperature effect is considered, improving the efficiency of photovoltaic systems [7]. The efficiency of photovoltaic cells decreases by around 0.5% as the temperature of the solar panels rises. To achieve acceptable efficiency, affordable cooling systems are needed, offering potential benefits such as improved electricity production and use of the extracted heat for domestic or industrial purposes. The “Ground-Coupled Central Panel Cooling System” (GC-CPCS), presented in the study, represents an innovation with its focused approach, the use of a ground-coupled heat exchanger [8]. The aim of cooling the photovoltaic module is to lower its surface temperature during operation, which helps to increase the rate of dissipation of the heat generated by photovoltaic modules [9,10,11]. A research study aimed at improving the performance of a thermal dissipater by adjusting various parameters and by replacing aluminum with copper in order to evaluate its properties. The initial model had already reduced the temperature of the photovoltaic cells from 27 °C to 42 °C. Adjustments to the parameters reduced average panel temperatures further to 3.5%, 4%, and 9%, respectively. Copper proved more efficient than aluminum at dissipating heat, even with optimized thermal structure [12]. However, the implementation of a microcontroller-based thermally controlled water spray system using an Arduino board improved the efficiency of the solar cell by up to 16.65% [13]. In addition, a study assesses how dust accumulation and high temperatures affect the performance of photovoltaic (PV) solar panels and suggests a compressed-air-based control method for cleaning and cooling these panels simultaneously. Dynamic compressed air release models are developed to facilitate the design of the control system. Tests confirm the effectiveness of this approach in mitigating the adverse effects of dirt and high temperatures, opening up opportunities to improve PV efficiency and decarbonize the energy industry [14]. A number of cooling methods are available, including classical cooling approaches such as water and air cooling, as well as innovative solutions such as the integration of phase-change materials, thermoelectric cooling, heat pipes, evaporative cooling, and nanofluids. The findings of this study highlight the potential of all these methods to improve the electrical efficiency of photovoltaic solar panels. However, some techniques stand out for their superior performance. In particular, among these approaches, automatic water spraying, ventilated air cooling, phase-change materials, and thermoelectric cooling methods demonstrated the highest levels of energy production. In terms of cost-effectiveness, thermoelectric cooling outperformed evaporative cooling, nanofluid water cooling, and the automatic spray system. In addition, thermoelectric cooling, evaporative cooling, ventilated air, and automatic water spraying reduced CO2 emissions to a minimum. Evaporative cooling, together with thermoelectric and phase-change cooling, also delivered the shortest write-off period [15]. Equally, the use of nanofluids (CuO, Al2O3, TiO2) in a semi-transparent photovoltaic-thermal collector, compared with conventional photovoltaic panels. The tests optimized the concentration and flow rate of the nanofluids, resulting in electrical efficiency improvements of up to 11.2%. Thermal efficiencies are also up to 42.6% more efficient than with water [16]. In this context, a study aims to optimize the performance of solar panels by using nanocoated aluminum fins for passive cooling. By comparing three PV modules, we demonstrate the effectiveness of natural convection, producing a temperature drop of 4.0 °C thanks to the use of a TiO2 nanofluid. This improvement translated into a 5.8% increase in energy production for panels with coated fins, and a 1.1% increase for the others, over a four-month period [17]. The use of the cooling techniques considerably reduced the surface temperature of the PV module compared with the uncooled module. The maximum temperatures recorded were 38, 55, and 58 °C respectively, for water cooling, fin cooling, and the uncooled module. This temperature reduction, achieved by the cooling systems, has a significant impact on photovoltaic module performance. An increase of 10.2% in energy collected per day was observed for modules equipped with counter-current cooling, and 7% for those with fin cooling, compared to modules without cooling. In addition, the performance ratio was significantly improved, reaching 84% and 81%, respectively, for the water-cooled and fin-cooled modules, compared with 77% for the module without cooling [18]. Furthermore, a photovoltaic panel with a cooling system has been developed, integrating a polymer mini-channel exchanger with the photovoltaic cells. These heat exchange units, incorporating mini and micro-channels, offer higher heat transfer capacity than simple pipes and channels, thanks to their increased surface-to-volume ratio. Moreover, by incorporating the heat exchanger into the solar cells during panel manufacture, contact thermal resistance is reduced to a minimum. The circulating heat transfer fluid transfers the heat extracted from the panel to the ground using plastic pipes installed in the ground, renowned for their durability and cost-effectiveness. Test findings confirm that the cooling system is able to dissipate 570 W of heat from the photovoltaic panel to the ground. In this study, a photovoltaic panel is installed with a polymer mini-channel heat exchanger fixed to the back of the photovoltaic cells. The heat exchange fluid circulates and removes the heat from the panel to the subsurface using buried polymer tubes, which are both efficient and durable. Test results show that the cooling system dissipates 570 W of heat from the photovoltaic panel to the ground, resulting in a 10% increase in net daily electricity production [19]. Forced convection and the use of small fans. It examines airflow characteristics and panel temperature distribution using computational fluid dynamics (CFD) simulations. Experimental measurements are undertaken to verify CFD predictions. Three panel configurations are examined, including an uncooled panel as a reference point. The results indicate that cooling with small fans at the rear leads to an improvement of up to 2.1% in efficiency, with an energy saving of 7.9%. The blower cooling method, on the other hand, produces a maximum increase of 1.34% in efficiency, with an energy saving of 4.2% [20]. Also, the experimental results show that it is possible to increase the electricity production of a photovoltaic panel by up to 16.3% in total (with an effective efficiency of 7.7%); as well as to improve its electrical efficiency by 14.1% in total (with an effective efficiency of 5.9%), by using a specific cooling technique under maximum solar irradiation. This approach further reduced the temperature of the panel, from an average of 54 °C (without cooling) to 24 °C when the front and back of the panel are simultaneously cooled [21]. Another study describes a new hybrid solar concentrator system, combining a water-cooled photovoltaic/parabolic concentrator with a conical cavity receiver and a spectral beam splitter. The different configurations of water-cooling pipes have been optimized to maximize heat collection and minimize the operating temperature of the cells, with the triangular section offering the most efficient heat dissipation from the photovoltaic cells [22]. Also, in the context of cooling and cleaning photovoltaic panels, a study examines the effectiveness of a suggested system for cooling and cleaning panels more efficiently. Laboratory tests revealed a 14% improvement in solar panel energy production through this innovative cooling and cleaning method using condensed water [23]. A recent study compares two cooling systems for photovoltaic modules: one incorporates a thermoelectric generator (TEG), while the other uses mini-channels with nanofluid Al2O3. The numerical evaluation of the PV/TEG system with mini-channels shows a significant improvement with a channel containing 5% nanoparticles and a Reynolds of 250, increasing PV electrical power by 8.1%. The temperature of the nanofluid entry also influences the efficiency and power of the PV module, with optimization at a lower temperature [24], A solar poly-generation system with desiccant cooling to provide electricity, heating, cooling, hot water and domestic fresh water to a residential building. The system, modelled in TRNSYS and optimized to minimize the simple payback period, has a total energy efficiency of 0.49 for the solar collectors and 0.16 for the solar panels, with an optimal payback period of 20.68 years, which can be reduced by up to 85% if the energy costs increase [25]. A further system based on numerical model simulations was carried out to accurately determine the location of the foil and helical tubes in a photovoltaic thermal system (PVT) configured for cold water. This model achieves thermal efficiencies of between 43% and 52%, and electrical efficiencies of between 11% and 11.5% [26]. A study examines the use of a passive evaporative cooling method to control overheating of solar panels. By incorporating a layer of synthetic clay, this water evaporation reduces module temperature, with a significant 19.4% increase in output voltage and 19.1% increase in output power, presenting an efficient, economical and environmentally-friendly solution [27]. It is obvious that these studies do not take into account the nature of the water used to cool these panels.
The most important aspect of this study is to assess the quality of the water used to cool and clean the photovoltaic panels (deposits of limestone and saddles on the top of the panels). The principal advantage of this study is to avoid any loss of yield from photovoltaic panels, particularly in dry regions, which are characterized by high temperatures greater than 25 °C throughout the year. The study revealed that using bentonite saturated with Na+ at a concentration of 30 mg/dm3 resulted in a significant reduction in turbidity. Dispersing bentonite with a fully delaminated wafer promotes porous coagulation, leading to the development of flocculent flocs that are effective in removing turbidity by sweep coagulation. The electrical properties of TiO2 particles have little impact on this efficiency [28]. A study has examined the efficiency of Cassia angustifolia (CA) seed gum as an environmentally friendly coagulant for removing coloration from synthetic dyes. Acid Sendula Red and Direct Kahi Green dyes responded well to CA, either alone or in combination with a low dose of poly aluminum chloride (PAC), while PAC proved more effective with the direct dye pH and dosage were identified as crucial factors in achieving optimum performance [29]. The extracts examined showed coagulation capacities, their efficiency being dependent on pH values and initial turbidity values. Extracts from European chestnut seeds showed the highest rates of coagulation activity, attaining around 80% and 70%, respectively, under the low to medium turbidity conditions of the water tested, at a minimum coagulant dose of 0.5 mL/L [30]. The vital need for increased monitoring of water resources for groundwater management in Berrechid, Morocco, is highlighted. This region, faced with significant water stress, needs to develop aquifer management strategies to ensure their sustainability. The analysis shows annual groundwater overexploitation, mainly due to the expansion of irrigated land and intensive farming practices, threatening the viability of water resources and of economic activities. For optimal management, rigorous monitoring and the responsible involvement of all parties in their water use are essential [31].
In this work, we begin with a brief presentation of the study area: its geographical context, its hydrological context (water surfaces and groundwater), and its climatological context, in which we describe the water resources, temperature, and wind. This is followed by a description of the equipment and the method used, then a presentation of the results with a discussion, and finally a conclusion.

2. Materials and Methods

2.1. Geographic Context of the Study Area

The city of Sijilmassa, nowadays called Rissani, is located in the plain of Tafilalet in the extreme south-east of Morocco. It covers approximately 8.44% of Morocco’s surface area (around 60,000 km2). The plain stretches longitudinally between latitudes 30° and 30°31′, and is crossed by the ziz and the gheris valleys, which provide the irrigation of vegetation in oases and the supply of groundwater. Ksar Tabht El khir is a village of Amazigh origin, located precisely (31°10′8.17″ N, 4°25′29.40″ W) 22 km from the centre of Rissani. Figure 1 shows the study area on maps and Morocco’s cartographic division.

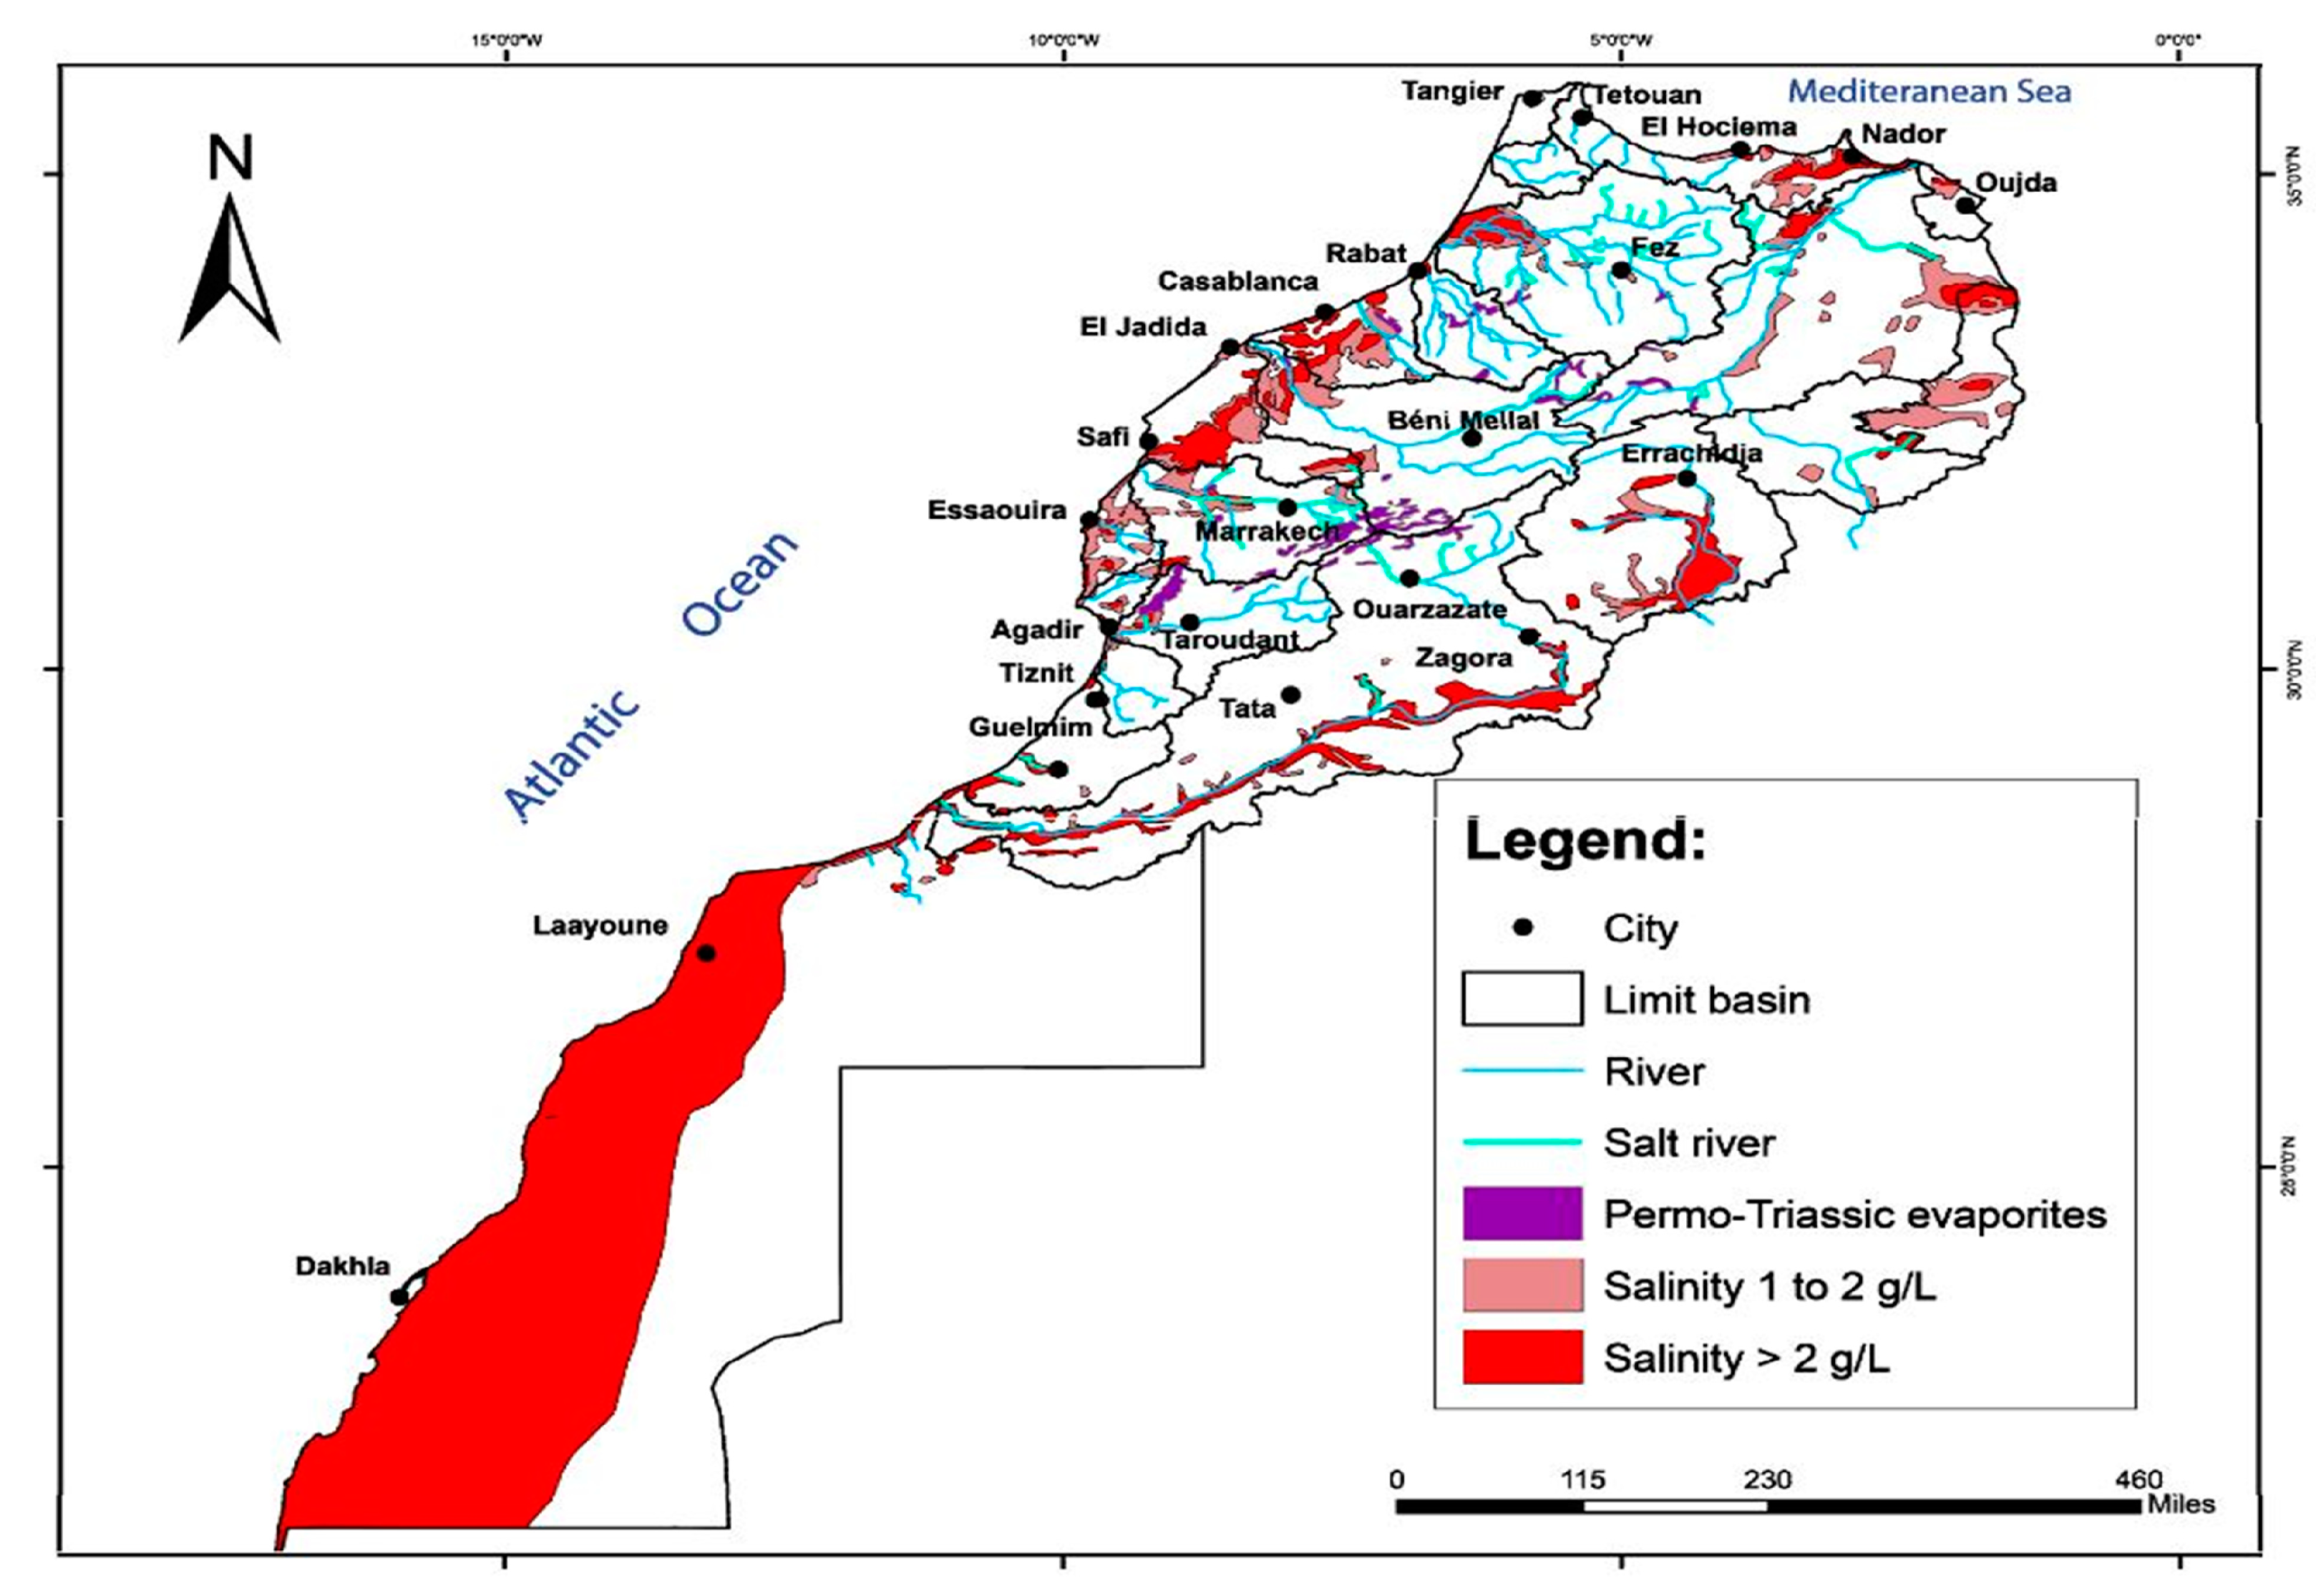
2.2. Hydrological Context

2.2.1. Water Surfaces

The Tafilalet plain is considered to be a practically closed endoreic basin, where all the surface and groundwater of the ziz-gheris basin converge.

2.2.2. The gheris Watershed

The gheris watershed is characterized by its arid climate, which becomes Saharan towards the south. It extends well into the High Atlas to the north, providing its tributaries from the High Atlas with a relatively abundant supply of perennial water, which enables the oases and palm groves of southern Morocco to exist. It is located between latitudinal lines 30°45′ and 31°30′ N, and longitudinal lines 5° and 5°15′ W. The gheris valleys are characterized by periods of low water and a few very violent floods of short duration and very irregular occurrence.

2.2.3. The ziz Watershed

The ziz valley has higher flow due to high flows in autumn and spring. One of the biggest floods in the watershed was that of 2008, which caused massive material losses, especially in the Merzouga tourist region. The maximum flow rate of this flood reached 2600 m3/s [32]. We can conclude that water is the best and least expensive source of cooling for the panels in this region and can be used after cooling to irrigate the plants around the solar panels.

2.2.4. Groundwater

The Tafilalet water table is mainly fed by the infiltration of surface water spread through irrigation methods. Therefore, it can be considered the result of farmers’ work who, for several centuries, through their irrigation methods based mainly on the spreading of floodwater, have helped form an underground reservoir through the inflow of water from outside the region and from floods. This water table, which is a by-product of irrigation, was in a state of permanent artificial oversupply. The results of groundwater research carried out prior to the development of the large-scale hydraulic system in Tafilalet show an average input volume of 70 million m3, of which 45 Mm3 (65%) represents the volume of water infiltrated from irrigation sprays. It should be noted that floodwaters are used in irrigation doses exceeding 2000 m3/ha, and the infiltration coefficient of these waters has been estimated at around 35%. However, groundwater discharge is characterized by irrigation use of no more than 14 Mm3/year and low discharge from natural outlets (approximately 5 Mm3/year). The comparative balance between recharge and discharge shows a volume difference of 51 million m3 between water inflows and direct withdrawals. This average volume corresponds to losses through annual evapotranspiration. The evapotranspiration coefficient is therefore very high, accounting for almost three-quarters of the balance sheet, which explains the particular conditions in Tafilalet. It should also be noted that this volume of evapotranspiration comprises:
A portion of water used for consumption by palm trees, most of which are not irrigated directly but draw water from the aquifer;
Water from the shallow water table, which rises by capillary action and evaporates on bare soil.
The fluctuation regime of the Tafilalet surface water table therefore shows the great preponderance of vertical exchanges between the water table and the surface: more than 80% of water inflow and more than 90% of water discharge from the water table occur via the surface.
In Morocco, the surface area of soil affected by salinity is estimated at over one million hectares. In addition to saline soils, most groundwater is also saline, and its salt content exceeds 2 g/L. Figure 2 presents the distribution of saline groundwater in Morocco [33].

2.3. Climatological Context

Morocco has an average annual irradiation of over 2000 W/m2, making it an ideal location for solar applications. The solar irradiation data used in this study comes from the Meteonorm Global Meteorological Database and Pvsyst. The study site is located near the town of Rissani.

2.3.1. Temperature

The study area is characterized by very low temperatures in summer and very high temperatures in winter, as shown in Figure 3:
According to the standard conditions for the fabrication of photovoltaic panels, the power of the photovoltaic cells decreases when the temperature exceeds 25 °C. Therefore, we can observe the following: the maximum daily temperature exceeds 40 °C. In sequence, it’s necessary to cool these panels in this region all the time between June and July.

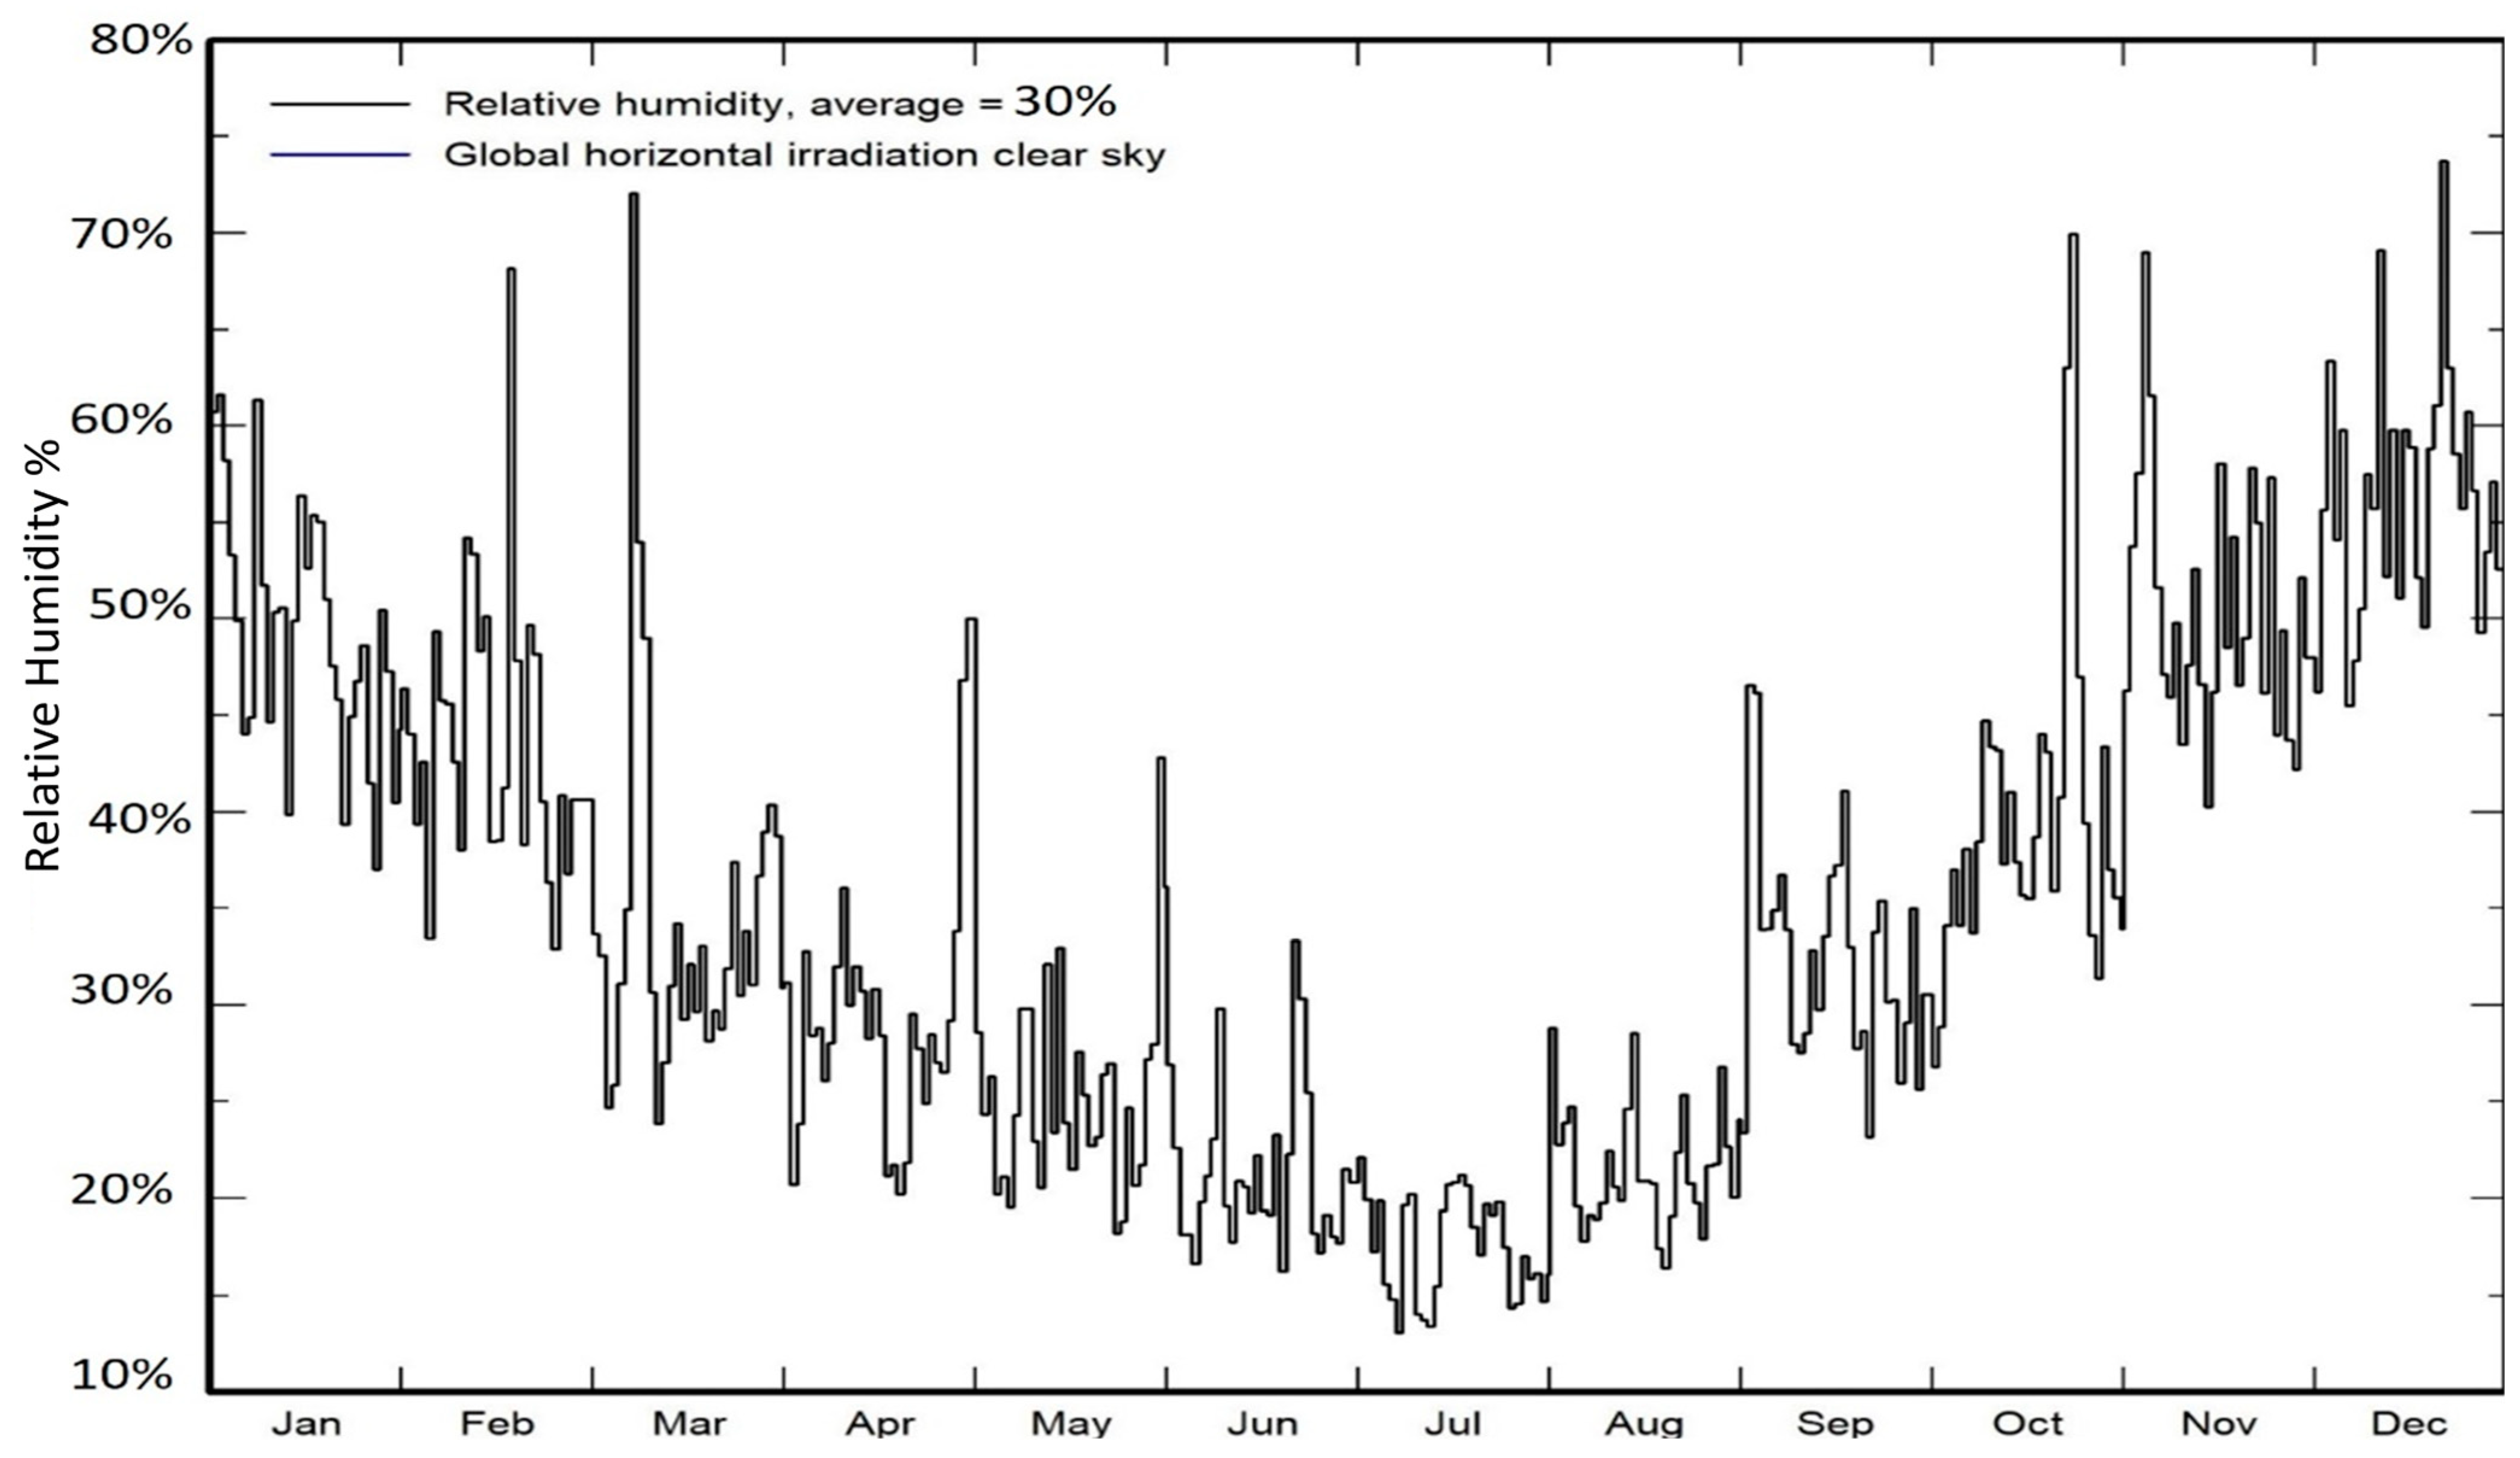
2.3.2. Relative Humidity
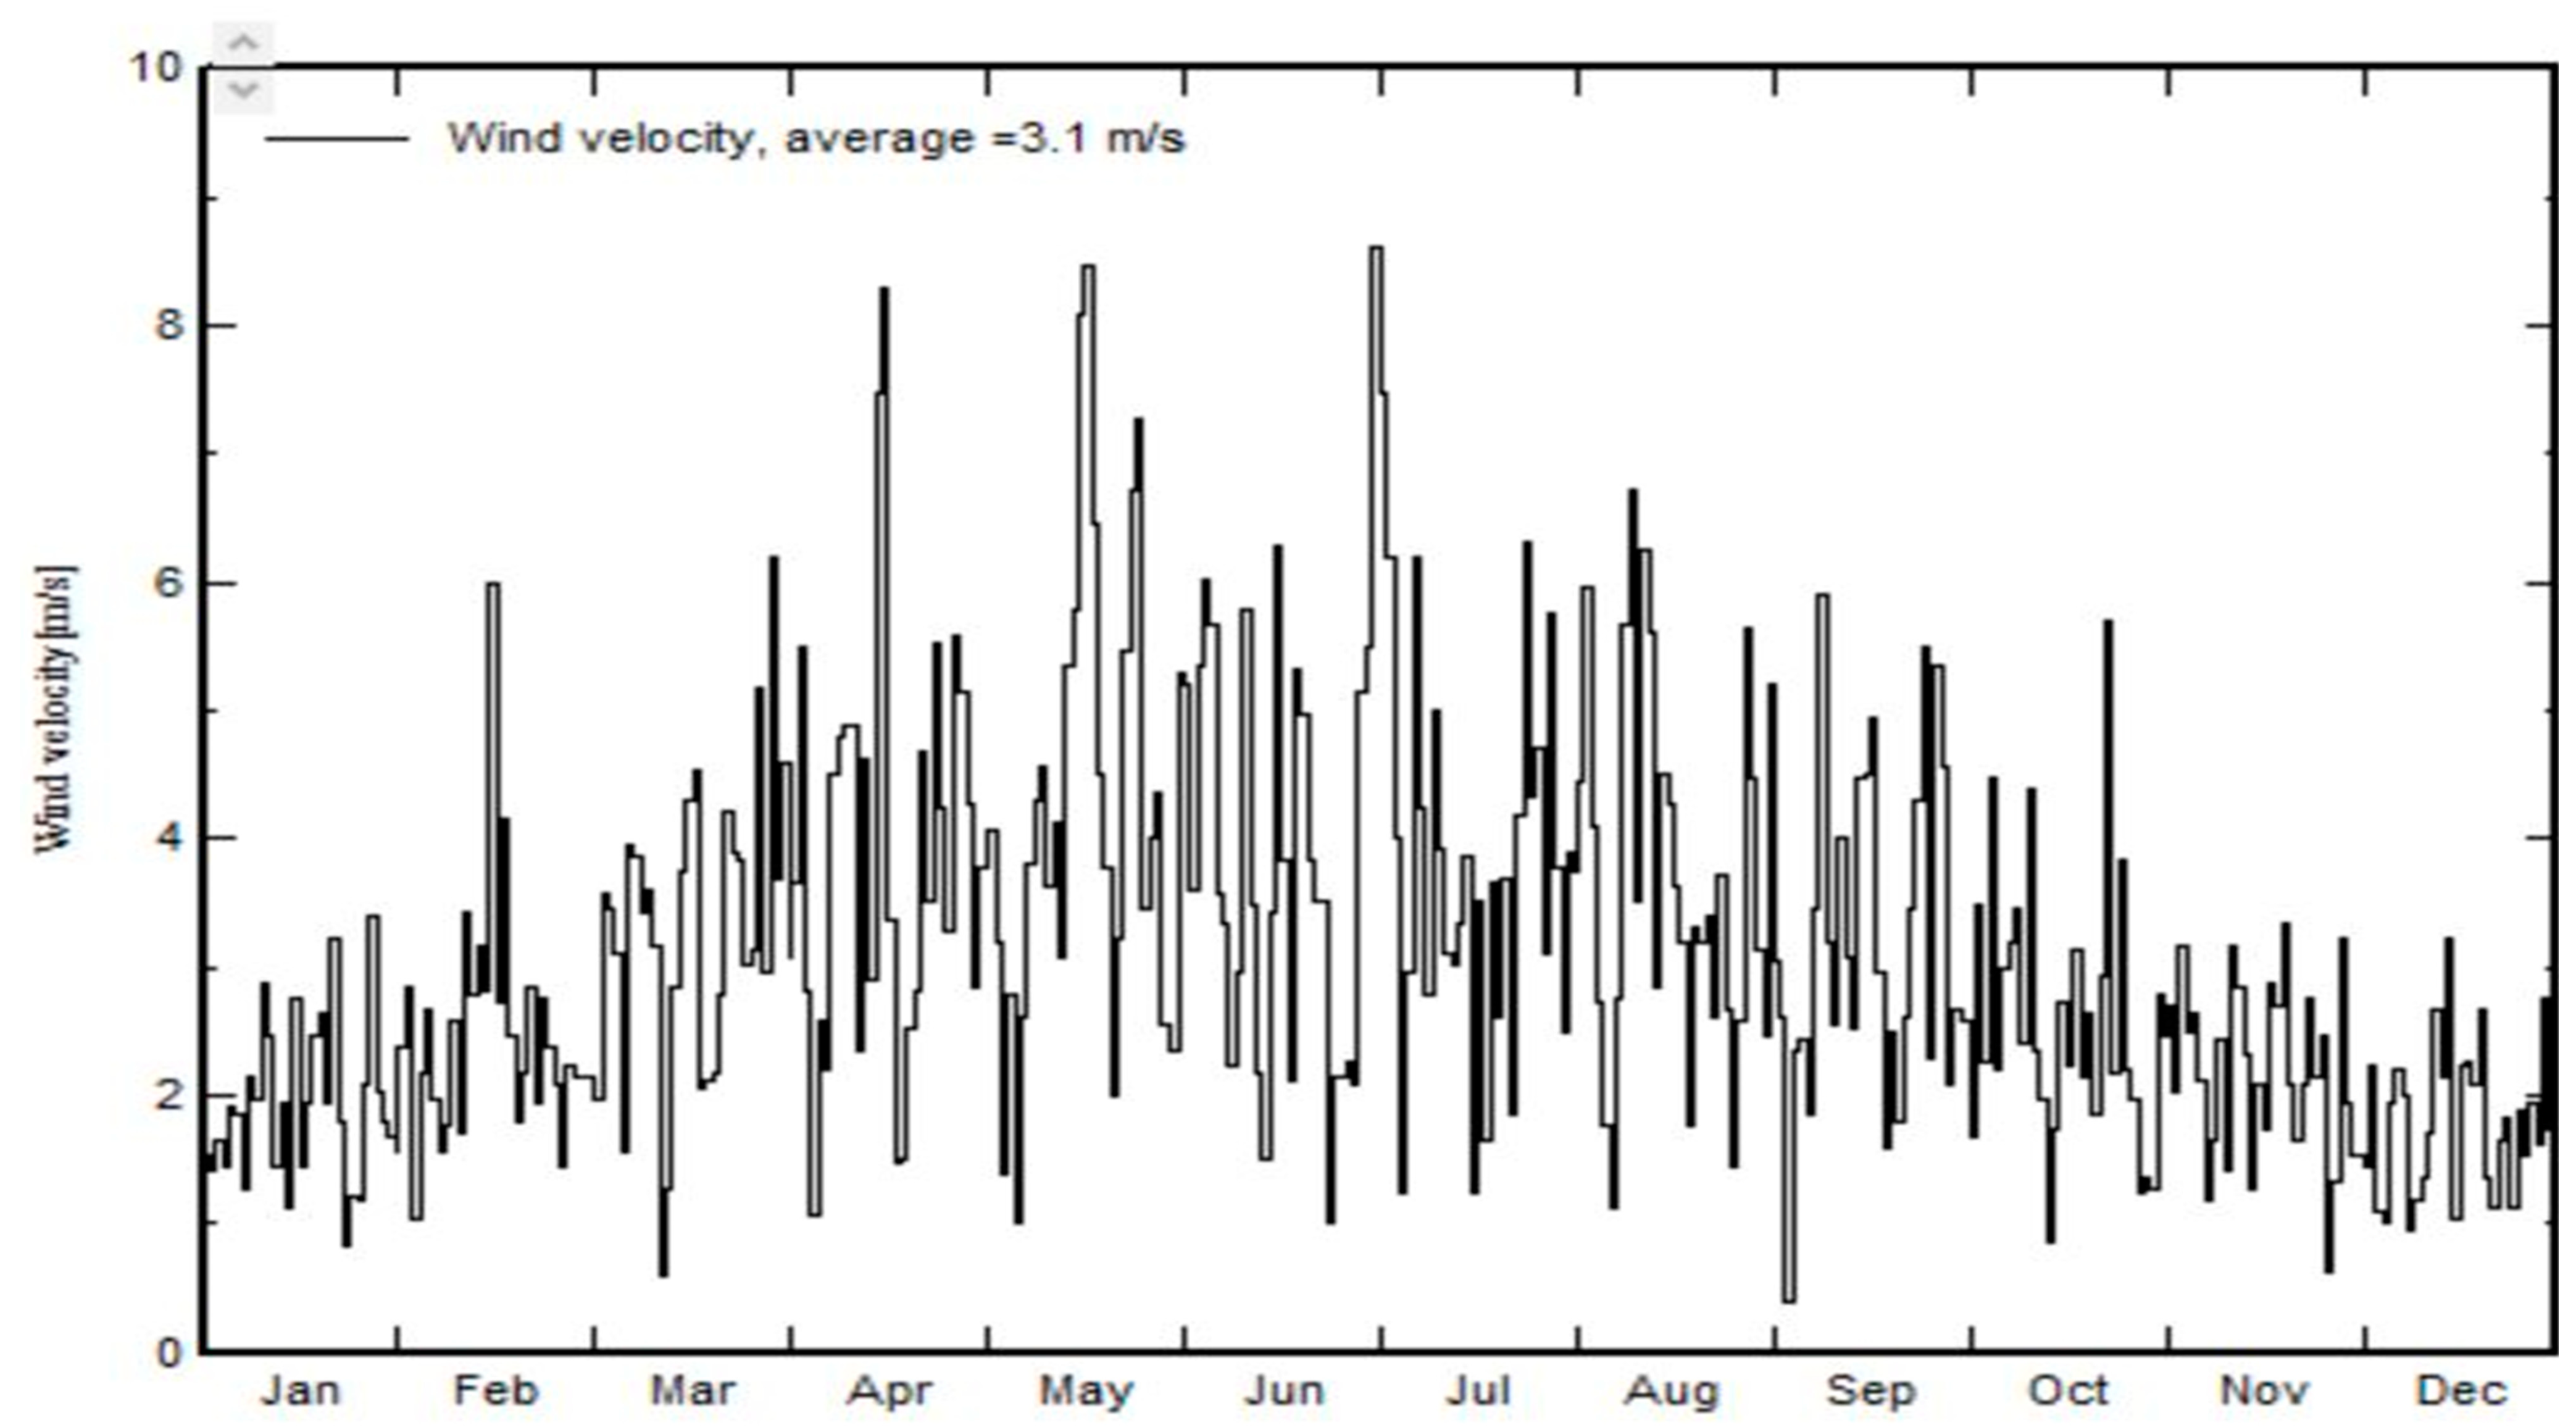
Relative humidity is an important indicator of whether a climate is dry or humid. It expresses the ratio between the quantity of water vapor present in the air and the maximum quantity that the air can contain at a given temperature. Figure 4 shows the variation in relative humidity and global horizontal irradiation throughout the year 2021 in the study area.
We can see that relative humidity varies between its minimum value in July: 14% and its maximum value in December: 75%. The relative humidity, average = 30% dry climate.

2.3.3. The Wind

The wind is another parameter that affects the efficiency of solar panels. The average wind speed is 3.1 m/s, which varies between its minimum value of 1.9 m/s in January and December and its maximum value of 4.4 m/s in May; Figure 5 shows the wind speed in this area.
The wind at this site contains dust, which can affect the efficiency of the solar panels, as shown in Figure 6.

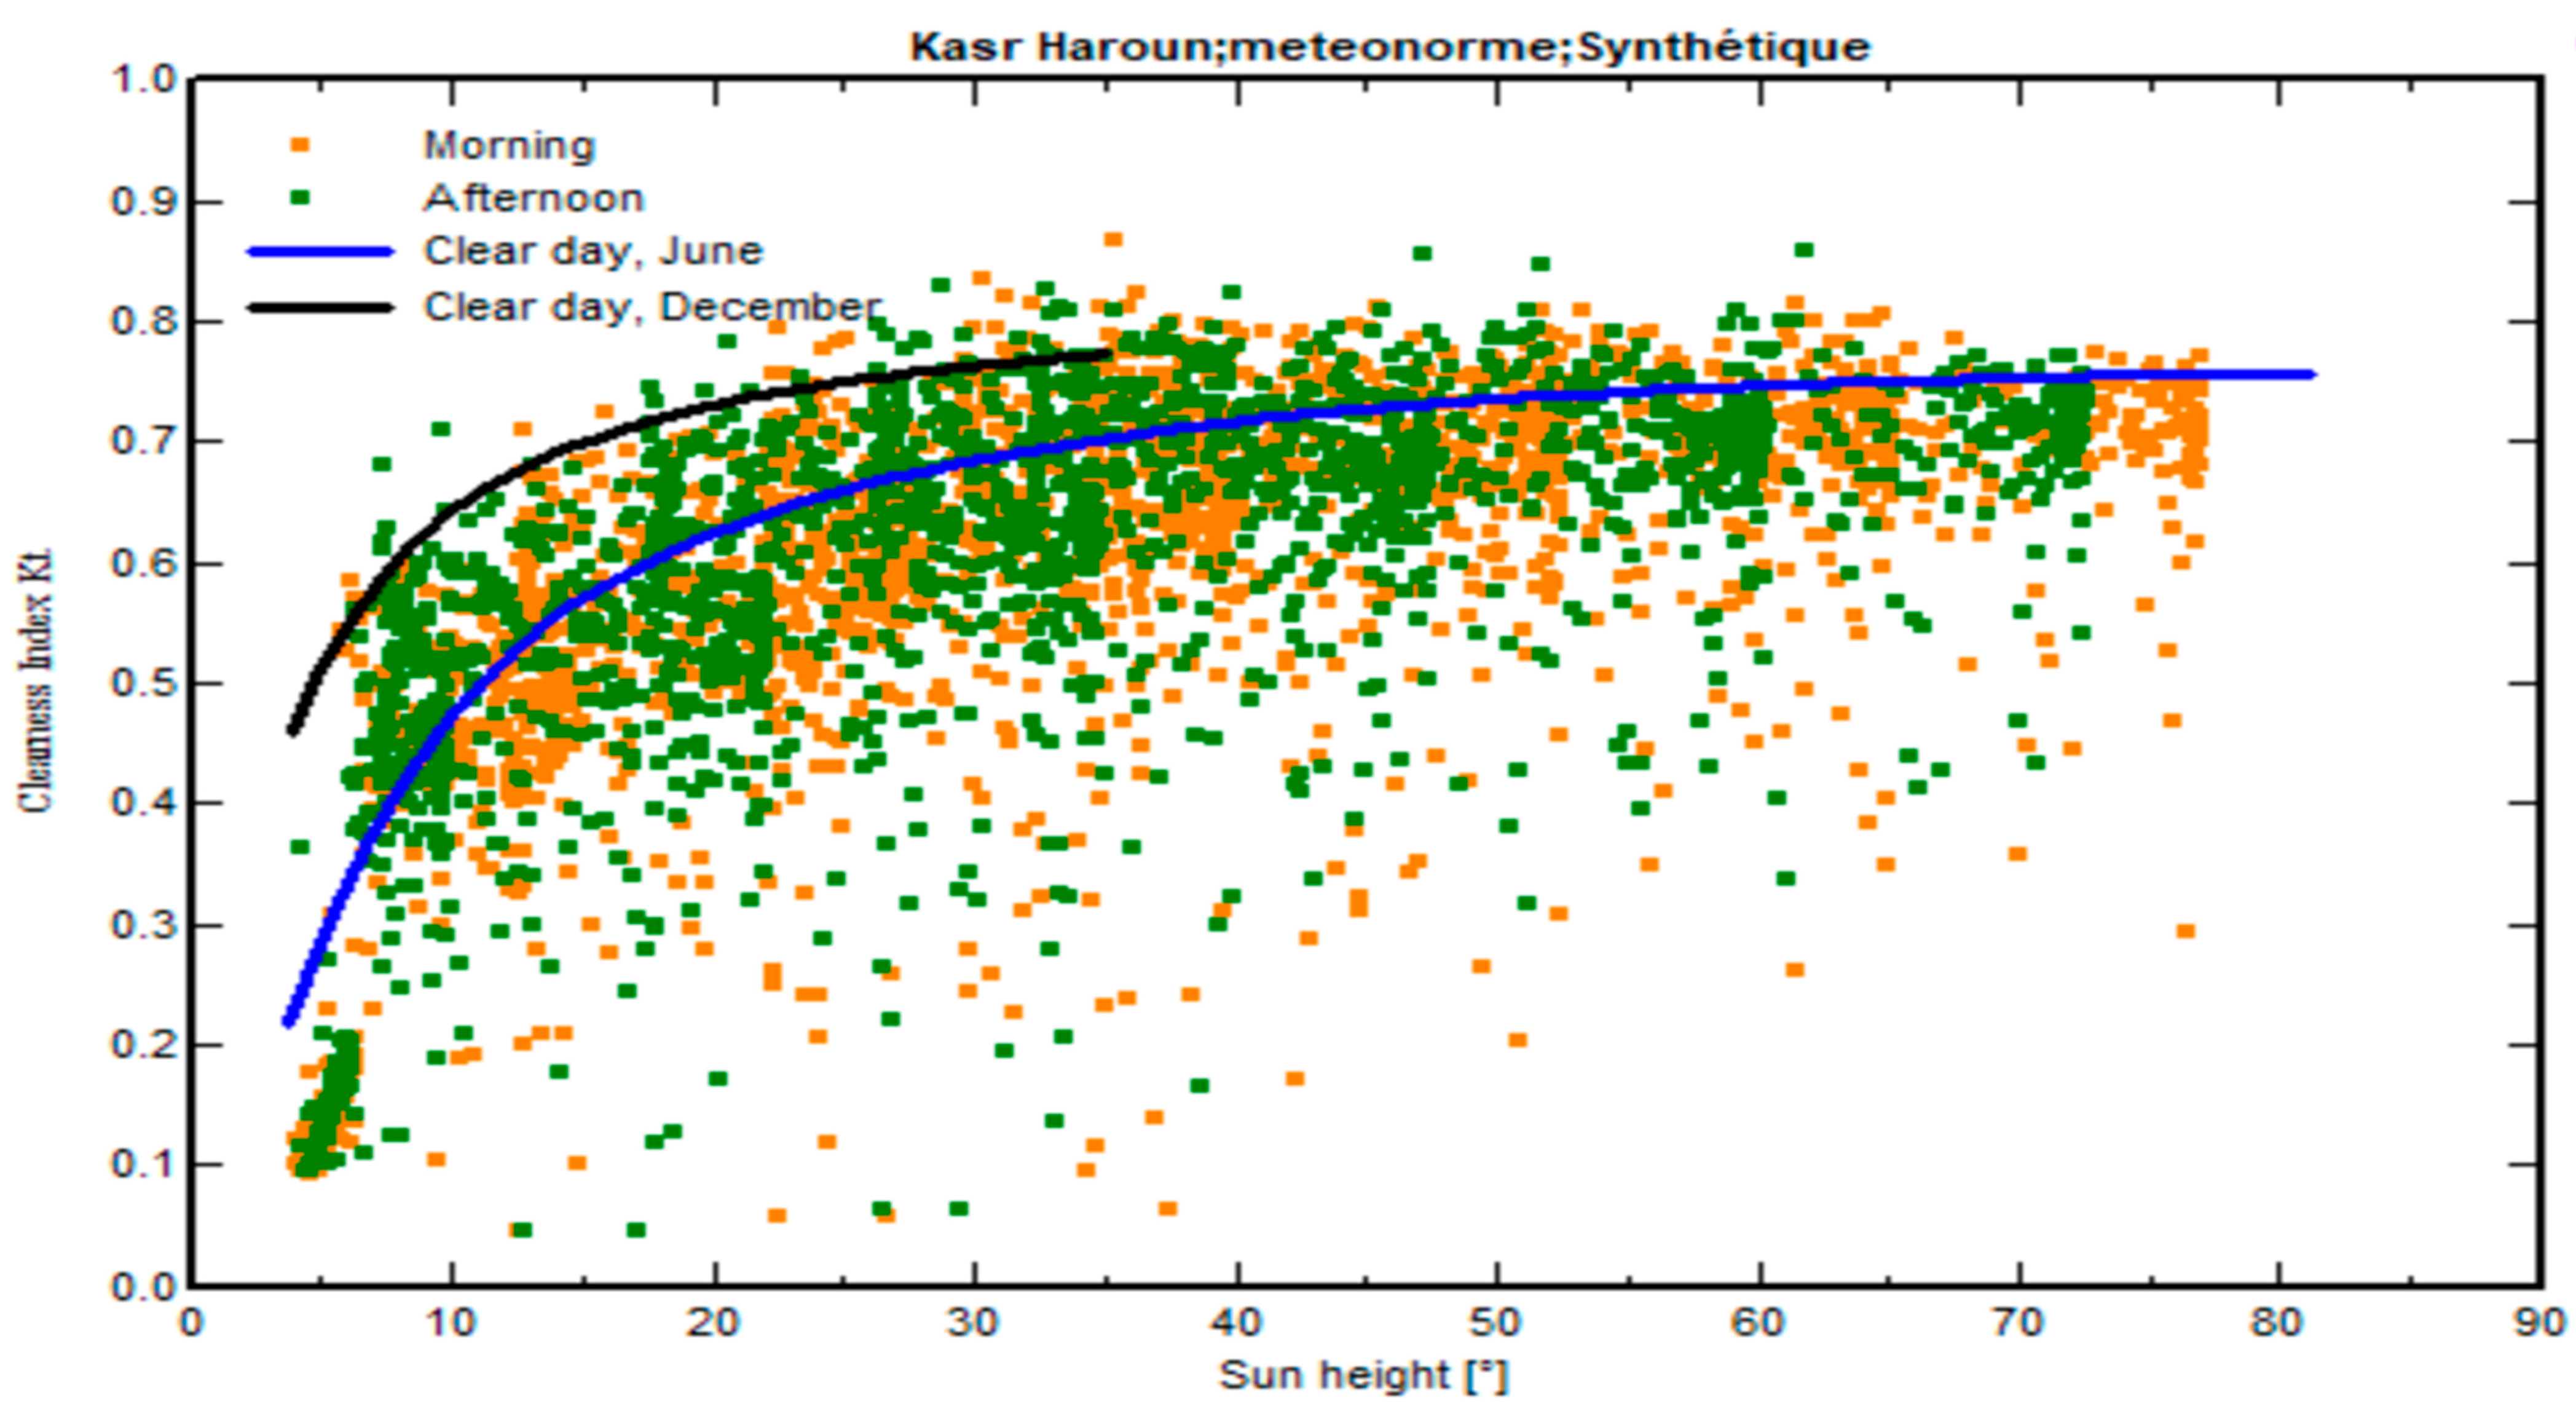
2.3.4. Solar Irradiation

The principal source of the Earth’s natural energy is solar radiation. This has a crucial influence on a multitude of phenomena, both natural and unnatural, as well as on various aspects of human life and society. The climate is an obvious example, but the impact extends to many areas such as plant growth, human health, building design and energy production. The following diagram in Figure 7 shows the variation in solar irradiance.

2.4. Environment MATLAB-Simulink

To store variables V and P, we need to create a workspace for them, which we do by setting (voltage1 = out. V1) and (power1 = out. P1) for T = 25. To run the test for T = 35, first we must change the temperature and then the V and (P) workspace in order to be able to save the result of the simulation as we do for T = 25. Figure 8 illustrates the proposed photovoltaic model configuration in Matlab-Simulink.

2.5. Effect of Scale Deposits in Dust on Transmission

The wind dust contains the sand, which is a solid material containing small particles resulting from the disaggregation of materials of mineral origin, such as calcium and magnesium or calcium and magnesium oxides. When dust on the surface of photovoltaic modules comes into contact with precipitation, a small quantity of calcium and magnesium ions dissolve in the rainwater and settle back onto the glass surface of the photo-voltaic modules. If this accumulation is not cleaned up in time, a hard layer of calcium and magnesium gradually forms on the surface of the photovoltaic modules. Once formed, this scale is difficult to remove, seriously affecting the energy production capacity of the modules and can even cause hot spots and other problems in the photo-voltaic cells.
Figure 9a illustrates the phenomenon of wind in the study area and Figure 9b its influence on the photovoltaic panels.

2.6. Impact of Dust and Limestone on Solar Irradiance

From Figure 9b, the presence of dust on the glass surface has a significant impact on the transmission of solar radiation. Not only does it seriously hamper transmission, but it also leads to significant diffuse reflection of solar radiation, caused by the dust on the surface. For this reason, we proceed to treat the groundwater before installing this maintenance system.

2.7. Moroccan Drinking Water Treatment Standard

Drinking water is that which meets the criteria of “NM 03.7.001: Quality of human drinking water” as approved by the joint order of the Minister of Industry, Trade, and Economic Promotion, the Minister of Infrastructure and Transport, and the Minister of Health No. 221-06 of 3 Muharram 427 (2 February 2006) or any equivalent standard that replaces it. Human drinking water is composed of the following elements:
  • All water intended for drinking, whatever the method of production and distribution Water used for the preparation, packaging, storage, and/or conservation of foodstuffs intended for the public [34].
  • A number of thermal installations require cleaning and/or cooling with water, and photovoltaic panels in particular. This water must meet certain quality criteria to ensure that the photovoltaic panels function properly:
  • Total dissolved solids (TDS) refer to the quantity of organic and inorganic sub-stances contained in a given liquid. They are after the standard (N.M. 03.7.001 ONSSA-MAROC). They are shown in Table 1.
  • Conductivity is the opposite of resistivity and refers to the ability of a material to let current through when a potential difference is applied.

2.8. Collects Ground Water for Cooling Purposes

Before installing the maintenance system: cooling and cleaning photovoltaic panels, which is designed to increase their yield, it is crucial to assess the quality of the water used to clean and cool the panels. For this reason, we carried out an analysis of the water used to cool the photovoltaic panels to evaluate the probability of deposition of salts and residues which cause wear and reduce the absorption of solar radiation. We took a water sample from the well as shown in Figure 10.
The sample taken is stored in accordance with current standards (at a temperature of 4 °C), then transported to the laboratory. Conductivity, pH, and TDS measurements are carried out using an ADWA AD 3000 EC/TDS & Temperature meter, manufactured by ADWA Instruments in China. And Hanna Instruments HI-2210 pH Meter, manufactured in Romania by Hanna Instruments.

3. Results and Discussion

3.1. Simulation Parameter

In this study, we use a specific photovoltaic module, the PV Module: EGE-400W-72M, manufactured by EGE Energy in Turkey, whose parameters are summarized in Table 2.
The performance of the PV module depends on the behavior it exhibits under variations in the atmospheric conditions, such as irradiance and temperature.

3.2. The Effect of Dust and Limestone on the Temperature of Photovoltaic Modules

The dust and scale present on the surface of the tempered glass absorb a portion of the solar irradiation, transforming it into thermal energy, thus raising the operating temperatures of the photovoltaic modules. At the same time, the dust, and scale also act as an isolating cover on the module surface, affecting the thermal dissipation of the module and exacerbating the effect of thermal temperature. Since photovoltaic modules are the key components of the photovoltaic power generation system, their photoelectric conversion efficiency is inversely proportional to temperature. As a result, photovoltaic efficiency decreases with increasing temperature. Since dust and scale, by absorbing thermal energy, can increase the internal temperature of the solar panel, photovoltaic efficiency can decrease accordingly.

3.3. Simulation Result in Matlab-Simulink

At a temperature of 25 °C (under standard conditions), we observe a maximum output of 400 Wp. However, as the temperature rises to 35 °C, production decreases to 360 Wp. Above 45 °C, the reduction continues to stabilize at 325 Wp. Above 55 °C, output is reduced to 275 Wp, and at 75 °C, it again decreases to 250 Wp. Figure 11 shows the impact of temperature on photovoltaic energy production.
Under the effect of wind dust, the voltage, and power of the panels decrease as the temperature increases. For this reason, it is imperative to install a maintenance system (cooling and cleaning) for the photovoltaic panels, using water to reduce the temperature and clean the photovoltaic modules from the wind dust. However, this water must meet certain quality criteria.

3.4. Quality of Water

After collecting the water from the well in a bottle washed with distilled water, we perform a quality analysis in our laboratory of engineering systems and applications at the national school of applied science, Sidi Mohamed Ben Abdellah University, Fez, Morocco, Figure 12 shows a measured pH value of 7.39, and Figure 13 shows the measurement of conductivity of water used to maintain the photovoltaic panels. It is respectively: 1422 µS/cm, and 1500 mg/L; The Table 3 summarizes the results of measurement.
After comparing the results of the groundwater treatment presented in Table 3 with the Moroccan standard for drinking water treatment presented in Table 1, we observe that:
The potential of hydrogen (pH), is very good (pH = 7.39). Therefore, water with a pH between 7.2 and 7.8 is ideal for good health. Consuming liquids that are too acidic or too basic can disturb this delicate balance, resulting in the development and growth of bacteria, viruses, fungi, yeasts, and parasites.
Conductivity Using an electronic instrument to measure the conductivity of a solution, in other words, its ability to conduct current. Conductivity, expressed in siemens per meter (S.m−1), provides important information on water mineralization. In fact, the more ions a solution contains, the more electricity it conducts. Before proceeding with the measurement, a preliminary calibration must be carried out. This should be carried out as soon as the device is used, but only once per use.
Calibration: Start by adjusting the temperature control knob to indicate the ambient temperature. Next, immerse the probe in a reference solution (buffer solution) of known conductivity and use a screwdriver to adjust the adjustment screw so that the value indicated by the conductivity meter corresponds to the value indicated on the bottle of buffer solution.
Measuring the conductivity of a solution:
Before and between two measurements in different solutions, immerse the probe in a beaker of distilled water and then wipe it dry.
Then wipe lightly with absorbent paper. Choose the right gauge. For a good measurement, stir the solution with a magnetic stirrer. Immerse the probe in the solution and read off the conductivity (usually in mS/cm). After measurement, the conductivity value is good (1.4 mS/cm), an indicator of favorable saline conditions for operation.
TDS values are also acceptable, an indicator of favorable saline conditions for operation. In addition, TDS is directly related to water purity, and the quality of water purification systems values are also acceptable, which will not cause deposits of solid substances on the photovoltaic panels. It is therefore valid for cooling and cleaning the photovoltaic panels and consequently does not affect the performance.

4. Conclusions

In this work, we first investigated the impact of temperature on the parameters of photovoltaic (PV) panels using a Matlab-Simulink simulation. We also examined how environmental factors such as ambient temperature affect the module and its output performance. The results obtained indicate clearly that the temperature of the PV panels has a significant influence on energy production. Both the simulation and experimental methods show that high panel temperatures result in a significant decrease in output voltage, which reduces the efficiency of energy production despite the potential increases in output voltage. In addition, the overall operating quality of PV panels decreases with increasing panel temperatures. The effect of wind dust was also studied using outdoor experiments.
The second part of this work is devoted to the analysis of the quality of the water used to maintain photovoltaic panels in a desert region of Morocco. In the laboratory, we analyzed the potential of hydrogen (pH), TDS (total dissolved solids), and conductivity of the water. We also compared the results with the standards for drinking water treatment in Morocco. Our results indicate that the groundwater in this desert region is ideal for the maintenance of photovoltaic panels, especially in the face of dust accumulation caused by wind and the very high ambient temperatures in the summer.
1. The power of photovoltaic panels decreases when the ambient temperature rises, so that when the ambient temperature arrives at 45 °C, the power decreases by 20%.
2. The wind dust has a major influence on the quality of energy in this desert region.
3. In this desert region, groundwater is very appropriate for the maintenance of photovoltaic panels (cooling and cleaning the panels).

5. Recommendations

It is necessary to install a maintenance system (cooling and cleaning the photovoltaic modules) using groundwater, which is characterized by its perfect temperatures. Furthermore, it is preferable to use groundwater directly, without the use of storage tanks, as the water heats up more quickly in the latter, especially in summer. In the next investigation, we will install this maintenance system and compare its efficiency with another system without maintenance in this desert region of Morocco.

Author Contributions

A.A.A.: The owner of the idea and the original project, he is the principal author. Y.O.: Preparation of samples, layout and correction of the article. M.A.: Data collection. M.C.: Laboratory analysis of samples. H.H.: supervisor, reviewer and approver of article. All authors have read and agreed to the published version of the manuscript.

Funding

This research has not received any external funding.

Institutional Review Board Statement

Not applicable.

Informed Consent Statement

Not applicable.

Data Availability Statement

The data used to support the findings of this study are available the principal author upon request.

Conflicts of Interest

No potential conflict of interest was reported by the authors.

References

  1. Nezami Savojbolaghi, M.; Davodian, E.; Bouich, A.; Tlemçani, M.; Mesbahi, O.; Janeiro, F.M. The Impact of Dust Deposition on PV Panels’ Efficiency and Mitigation Solutions: Review Article. Energies 2023, 16, 8022. [Google Scholar] [CrossRef]
  2. Alaoui, M.; Maker, H.; Mouhsen, A.; Hihi, H. High Power PV Array Emulator Based on State Feedback Controller Under Uniform and Non-Uniform Insolation. Trans. Electr. Electron. Mater. 2023, 24, 54–64. [Google Scholar] [CrossRef]
  3. Bugeja, R.; Stagno, L.M.; Niarchos, I. Full-Scale Design, Implementation and Testing of an Innovative Photovoltaic Cooling System (IPCoSy). Sustainability 2023, 15, 16900. [Google Scholar] [CrossRef]
  4. Saidan, M.; Albaali, A.G.; Alasis, E.; Kaldellis, J.K. Experimental study on the effect of dust deposition on solar photovoltaic panels in desert environment. Renew. Energy 2016, 92, 499–505. [Google Scholar] [CrossRef]
  5. Abderrezek, M.; Fathi, M. Experimental study of the dust effect on photovoltaic panels’ energy yield. Sol. Energy 2017, 142, 308–320. [Google Scholar] [CrossRef]
  6. Lasfar, S.; Haidara, F.; Mayouf, C.; Abdellahi, F.M.; Elghorba, M.; Wahid, A.; Kane, C.S.E. Study of the influence of dust deposits on photovoltaic solar panels: Case of Nouakchott. Energy Sustain. Dev. 2021, 63, 7–15. [Google Scholar] [CrossRef]
  7. Mallal, Y.; Sharma, D.K.; El Bahir, L.; Hassboun, T. Temperature prediction-based realistic performance analysis of various electrical configurations of solar PV panels. Sol. Energy 2021, 228, 612–624. [Google Scholar] [CrossRef]
  8. Sahay, A.; Sethi, V.; Tiwari, A.; Pandey, M. A review of solar photovoltaic panel cooling systems with special reference to Ground coupled central panel cooling system (GC-CPCS). Renew. Sustain. Energy Rev. 2015, 42, 306–312. [Google Scholar] [CrossRef]
  9. Skoplaki, E.; Palyvos, J.A. On the temperature dependence of photovoltaic module electrical performance: A review of efficiency/power correlation. Sol. Energy 2009, 83, 614–624. [Google Scholar] [CrossRef]
  10. Radziemska, E.; Klugmann, E. Thermally affected parameters of the current–voltage characteristics of silicon photocell. Energy Convers. Manag. 2002, 43, 1889–1900. [Google Scholar] [CrossRef]
  11. Han, X.; Wang, Y.; Zhu, L. The performance and long-term stability of silicon concentrator solar cells immersed in dielectric liquids. Energy Convers. Manag. 2013, 66, 189–198. [Google Scholar] [CrossRef]
  12. Mankani, K.L.; Chaudhry, H.N.; Calautit, J.K. Optimization of an air-cooled heat sink for cooling of a solar photovoltaic panel: A computational study. Energy Build. 2022, 270, 112274. [Google Scholar] [CrossRef]
  13. Li, D.; King, M.; Dooner, M.S.; Guo, S.; Wang, J. Study on the cleaning and cooling of solar photovoltaic panels using compressed airflow. Sol. Energy 2021, 221, 433–444. [Google Scholar] [CrossRef]
  14. Tian, M.-W.; Khetib, Y.; Yan, S.-R.; Rawa, M.; Sharifpur, M.; Cheraghian, G.; Melaibari, A.A. Energy, exergy and economics study of a solar/thermal panel cooled by nanofluid. Case Stud. Therm. Eng. 2021, 28, 101481. [Google Scholar] [CrossRef]
  15. Ibrahim, T.; Akrouch, M.A.; Hachem, F.; Ramadan, M.; Ramadan, H.S.; Khaled, M. Cooling Techniques for Enhanced Efficiency of Photovoltaic Panels—Comparative Analysis with Environmental and Economic Insights. Energies 2024, 17, 713. [Google Scholar] [CrossRef]
  16. Jidhesh, P.; Arjunan, T.; Gunasekar, N.; Mohanraj, M. Experimental thermodynamic performance analysis of semi-transparent photovoltaic-thermal hybrid collectors using nanofluids. Proc. Inst. Mech.Eng. Part E J. Process Mech. Eng. 2021, 235, 1639–1651. [Google Scholar] [CrossRef]
  17. Al Aboushi, A.; Abdelhafez, E.; Hamdan, M. Finned PV Natural Cooling Using Water-Based TiO2 Nanofluid. Sustainability 2022, 14, 12987. [Google Scholar] [CrossRef]
  18. Gomaa, M.R.; Hammad, W.; Al-Dhaifallah, M.; Rezk, H. Performance enhancement of grid-tied PV system through proposed design cooling techniques: An experimental study and comparative analysis. Sol. Energy 2020, 211, 1110–1127. [Google Scholar] [CrossRef]
  19. Jafari Khoushehmehr, R.; Erkılıç, K.T.; Uğurer, D.; Kanbur, Y.; Yıldız, M.Ö.; Ayhan, E.B. Enhanced photovoltaic panel energy by minichannel cooler and natural geothermal system. Int. J. Energy Res. 2021, 45, 13646–13656. [Google Scholar] [CrossRef]
  20. Hussien, A.A.; Eltayesh, A.; El-Batsh, H.M. Experimental and numerical investigation for PV cooling by forced convection. Alex. Eng. J. 2022, 64, 427–440. [Google Scholar] [CrossRef]
  21. Nižetić, S.; Čoko, D.; Yadav, A.; Grubišić-Čabo, F. Water spray cooling technique applied on a photovoltaic panel: The performance response. Energy Convers. Manag. 2016, 108, 287–296. [Google Scholar] [CrossRef]
  22. Maatallah, T.; Houcine, A.; Saeed, F.; Khan, S.; Ali, S. Simulated Performance Analysis of a Hybrid Water-Cooled Photovoltaic/Parabolic Dish Concentrator Coupled with Conical Cavity Receiver. Sustainability 2024, 16, 544. [Google Scholar] [CrossRef]
  23. Shah, A.H.; Alraeesi, A.; Hassan, A.; Laghari, M.S. A Novel Photovoltaic Panel Cleaning and Cooling Approach through Air Conditioner Condensate Water. Sustainability 2023, 15, 15431. [Google Scholar] [CrossRef]
  24. Selimefendigil, F.; Okulu, D.; Öztop, H.F. Photovoltaic Thermal Management by Combined Utilization of Thermoelectric Generator and Power-Law-Nanofluid-Assisted Cooling Channel. Sustainability 2023, 15, 5424. [Google Scholar] [CrossRef]
  25. Gesteira, L.G.; Uche, J.; Cappiello, F.L.; Cimmino, L. Thermoeconomic Optimization of a Polygeneration System Based on a Solar-Assisted Desiccant Cooling. Sustainability 2023, 15, 1516. [Google Scholar] [CrossRef]
  26. Candra, O.; Kumar, N.B.; Dwijendra, N.K.A.; Patra, I.; Majdi, A.; Rahardja, U.; Kosov, M.; Guerrero, J.W.G.; Sivaraman, R. Energy Simulation and Parametric Analysis of Water Cooled Thermal Photovoltaic Systems: Energy and Exergy Analysis of Photovoltaic Systems. Sustainability 2022, 14, 15074. [Google Scholar] [CrossRef]
  27. Alami, A.H. Effects of evaporative cooling on efficiency of photovoltaic modules. Energy Convers. Manag. 2014, 77, 668–679. [Google Scholar] [CrossRef]
  28. Shen, Y.H. Treatment of Low Turbidity Water by Sweep Coagulation Using Bentonite. J. Chem. Technol. Biotechnol. 2005, 80, 581–586. [Google Scholar] [CrossRef]
  29. Sanghi, R.; Bhatttacharya, B.; Singh, V. Cassia An-Gustifolia Seed Gum as an Effective Natural Coagulant for Decolourisation of Dye Solutions. Green Chem. 2002, 4, 252–254. [Google Scholar] [CrossRef]
  30. Šciban, M.; Klašnja, M.; Antov, M.; Škrbic, B. Removal of Water Turbidity by Natural Coagulants Obtained from Chestnut and Acorn. Bioresour. Technol. 2009, 100, 6639–6643. [Google Scholar] [CrossRef] [PubMed]
  31. El Meknassi Yousoufi, E.; Hammani, A.; Kuper, M.; Bouarfa, S.; Vallée, D. Water accounting in the Berrechid plain (Morocco): A process approach. Irrig. Drain. 2024, 73, 180–197. [Google Scholar] [CrossRef]
  32. Ministry of Equipment and Water Morocco. Available online: http://www.equipement.gov.mahttps://www.equipement.gov.ma/Pages/accueil.aspx (accessed on 20 May 2023).
  33. Hssaisoune, M.; Bouchaou, L.; Sifeddine, A.; Bouimetarhan, I.; Chehbouni, A. Moroccan Groundwater Resources and Evolution with Global Climate Changes. Geosciences 2020, 10, 81. [Google Scholar] [CrossRef]
  34. The National Office of Food Safety Morocco. Available online: https://www.onssa.gov.ma/a-propos-de-lonssa/?lang=en (accessed on 15 April 2024).
Figure 1. Location map of the study area.
Sustainability 16 05476 g001
Figure 2. Location of saline groundwater in Morocco.
Sustainability 16 05476 g002
Figure 3. Shows the temperature variation during the year 2021.
Sustainability 16 05476 g003
Figure 4. Variation in relative humidity and global horizontal irradiation.
Sustainability 16 05476 g004
Figure 5. Wind Speed.
Sustainability 16 05476 g005
Figure 6. Clearness Index for morning and afternoon hours.
Sustainability 16 05476 g006
Figure 7. Variation in global solar irradiance, diffuse.
Sustainability 16 05476 g007
Figure 8. Configuration the photovoltaic system in Simulink environment.
Sustainability 16 05476 g008
Figure 9. (a): the phenomenon of wind in the study area, (b): the influence of the wind dust on the photovoltaic panels.
Sustainability 16 05476 g009
Figure 10. Collecting water from traditional well.
Sustainability 16 05476 g010
Figure 11. Impact of temperature on photovoltaic energy production.
Sustainability 16 05476 g011
Figure 12. Measurement pH value.
Sustainability 16 05476 g012
Figure 13. Measurement of conductivity of water used to cool panels.
Sustainability 16 05476 g013
Table 1. Moroccan standard conductivity and pH Drinking water.
Potential HydrogenUnits pH6.5 < pH < 8.5for the disinfection of water by chlorine to be effective, the pH should preferably
be <8
ConductivityS/cm at 20 °C2700
Table 2. PV module parameters used in this study.
S.NoParametersValues
1Maximum power400 W
2Maximum power Voltage39.92 V
3Maximum Power Current10.02 A
4Open Circuit Voltage48.6 V
5Short Circuit Current10.4 A
6Total series cells72
7Total parallel cells1
8Ideality factor of diode1.3
9Cell Short circuit currenttemperature coefficient of Isc+0.06%/°C
10Cell Short circuit currenttemperature coefficient of Circuit Voltage−0.31%/°C
11Reference temperature25
12Pmax temperature coefficient0.396%/°C
13Solar Irradiance1000 at STC
Table 3. Value measured: (potential of hydrogen (pH), Conductivity and Total dissolved solids (TDS)).
pHConductivity (µS/cm)TDS (mg/L)
7.3914221500
Disclaimer/Publisher’s Note: The statements, opinions and data contained in all publications are solely those of the individual author(s) and contributor(s) and not of MDPI and/or the editor(s). MDPI and/or the editor(s) disclaim responsibility for any injury to people or property resulting from any ideas, methods, instructions or products referred to in the content.

