Abstract
Wetlands are transitional between terrestrial and aquatic environments and have essential ecological functions. Unfortunately, due to anthropogenic activities and climate change, the area covered by wetlands is gradually decreasing worldwide, causing deterioration and loss of their critical and vital ecological functions. One of these degraded wetlands is the Hürmetçi Sazlığı, a nationally important wetland located in the Kayseri Province of Turkey. This study aims to determine the spatial and vertical (depth profile) distribution and the sources of the potentially toxic elements (PTEs) As, Cd, Pb, and Zn in the soils around the Hürmetçi Sazlığı Wetland (HSW) and to evaluate environmental risk factors using various soil quality indicators. According to the results obtained, it was determined that some parts of the wetland soils were significantly polluted in terms of As, Cd, Pb, and Zn. The concentrations (in mg/kg) of these PTEs in the soil around the wetland ranged between 9.12 and 273.9 for As, 0.38 and 1119.46 for Cd, 3.59 and 1807.66 for Pb, and 41.68 and 77,287.5 for Zn. Several soil quality indicators, including the Enrichment Factor (EF), Contamination Factor (CF), Ecological Risk Index (ERI), and Potential Ecological Risk Index (RI), were calculated to determine the quality and pollution levels of the collected soil samples. According to the calculated RI values, 70 out of 77 sites sampled in the area around the HSW are in the “High Risk” class in terms of all studied PTEs. The soil profile samples indicated that the topsoil (0–50 cm) was heavily contaminated by all PTEs, particularly near a zinc processing plant established in 1976. In addition, parts of the wetland further away from the Zn processing plant were also affected by arsenic pollution from geogenic sources, which can be associated with Plio-Quaternary volcanic activity in the region.
1. Introduction
Rapid population growth and economic developments (especially in the mining, metallurgical, textile, and food processing industries) during the past several decades have caused the widespread pollution of nearby natural resources (water and soil) and important ecosystems by significant amounts of potentially toxic elements (PTEs) [1,2,3,4]. One such important ecosystem is wetlands, which are transitional between terrestrial and aquatic environments. Wetlands provide critical ecological functions such as improving water quality through biochemical transformations, providing animal and plant habitats, and storing flood waters [5,6,7]. Unfortunately, because of increasing anthropogenic activities (e.g., agricultural, industrial, and urban developments) and climate change (e.g., increasing temperatures and droughts), the areas covered by wetlands are gradually decreasing around the world, causing deterioration and loss in their critical and vital ecological functions [8]. According to Zedler and Kercher [9], half of the global wetlands have been lost, and most of the remaining ones have been degraded due to constantly increasing pollution loads.
According to Brinson and Malvarez [10], wetland alterations can be divided into four categories: (i) geomorphic and hydrologic; (ii) nutrients and contaminants; (iii) harvests, extinctions, and invasions; (iv) global climate change. Artificial drainage systems in agricultural areas are categorized as geomorphic and hydrologic alteration, which constitutes the leading cause of wetland loss [9]. Recent literature shows that there are many publications related to studies on wetlands [4,7,8,9,11,12,13,14,15,16,17,18,19]. As indicated by these studies, PTE pollution of anthropogenic origin (agricultural, industrial, and mining activities and urban discharges) is prevalent in wetland ecosystems [11,14,20,21]. In these studies, spatial and vertical distributions, chemical forms, and ecological risks of PTEs in sediments/soils were commonly investigated [14]. Most PTEs in wetland environments accumulate as adsorbed on surface sediments or soils [14,22]. The PTEs accumulated in sediments or soils can also contaminate surface and groundwater by biogeochemical processes, which in turn increase the potential ecological risks for aquatic organisms and human beings [14,23,24,25]. The ecological functions of wetland systems are adversely affected by PTEs because of their toxic and nonbiodegradable properties [4,26,27,28,29,30].
The objectives of this study are the following: (i) to determine the spatial and vertical (depth profile) distribution and sources of PTEs, including As, Cd, Pb, and Zn in the soils around the Hürmetçi Sazlığı Wetland in Kayseri (Central Anatolia Region, Turkey); (ii) to evaluate environmental risk factors utilizing commonly used soil quality indicators (i.e., Enrichment Factor, Contamination Factor, Ecological Risk Index, and Potential Ecological Risk Index). Although previous studies conducted in this area recognized the existence of severe PTE pollution [25,31,32,33,34,35,36], none of these studies investigated the spatial and vertical distribution of PTEs in the soils and their effect on the health of the wetland ecosystem. Additionally, all these studies were carried out on soil samples taken from a single sampling point. For example, in the study conducted by Çiftçi [35], the total Cd, Pb, and Zn concentrations in a soil sample were found to be 482, 25,754, and 13,412 mg/kg, respectively. Doğan [33] also determined CdO (4.52%), ZnO (8.96%), and PbO (2.78%) concentrations in a soil sample collected nearby the wetland. There are also a limited number of studies carried out with different methods for the remediation of contaminated soils around the Hürmetçi Sazlığı Wetland [25,34,35,36].
2. Materials and Methods
2.1. Study Area
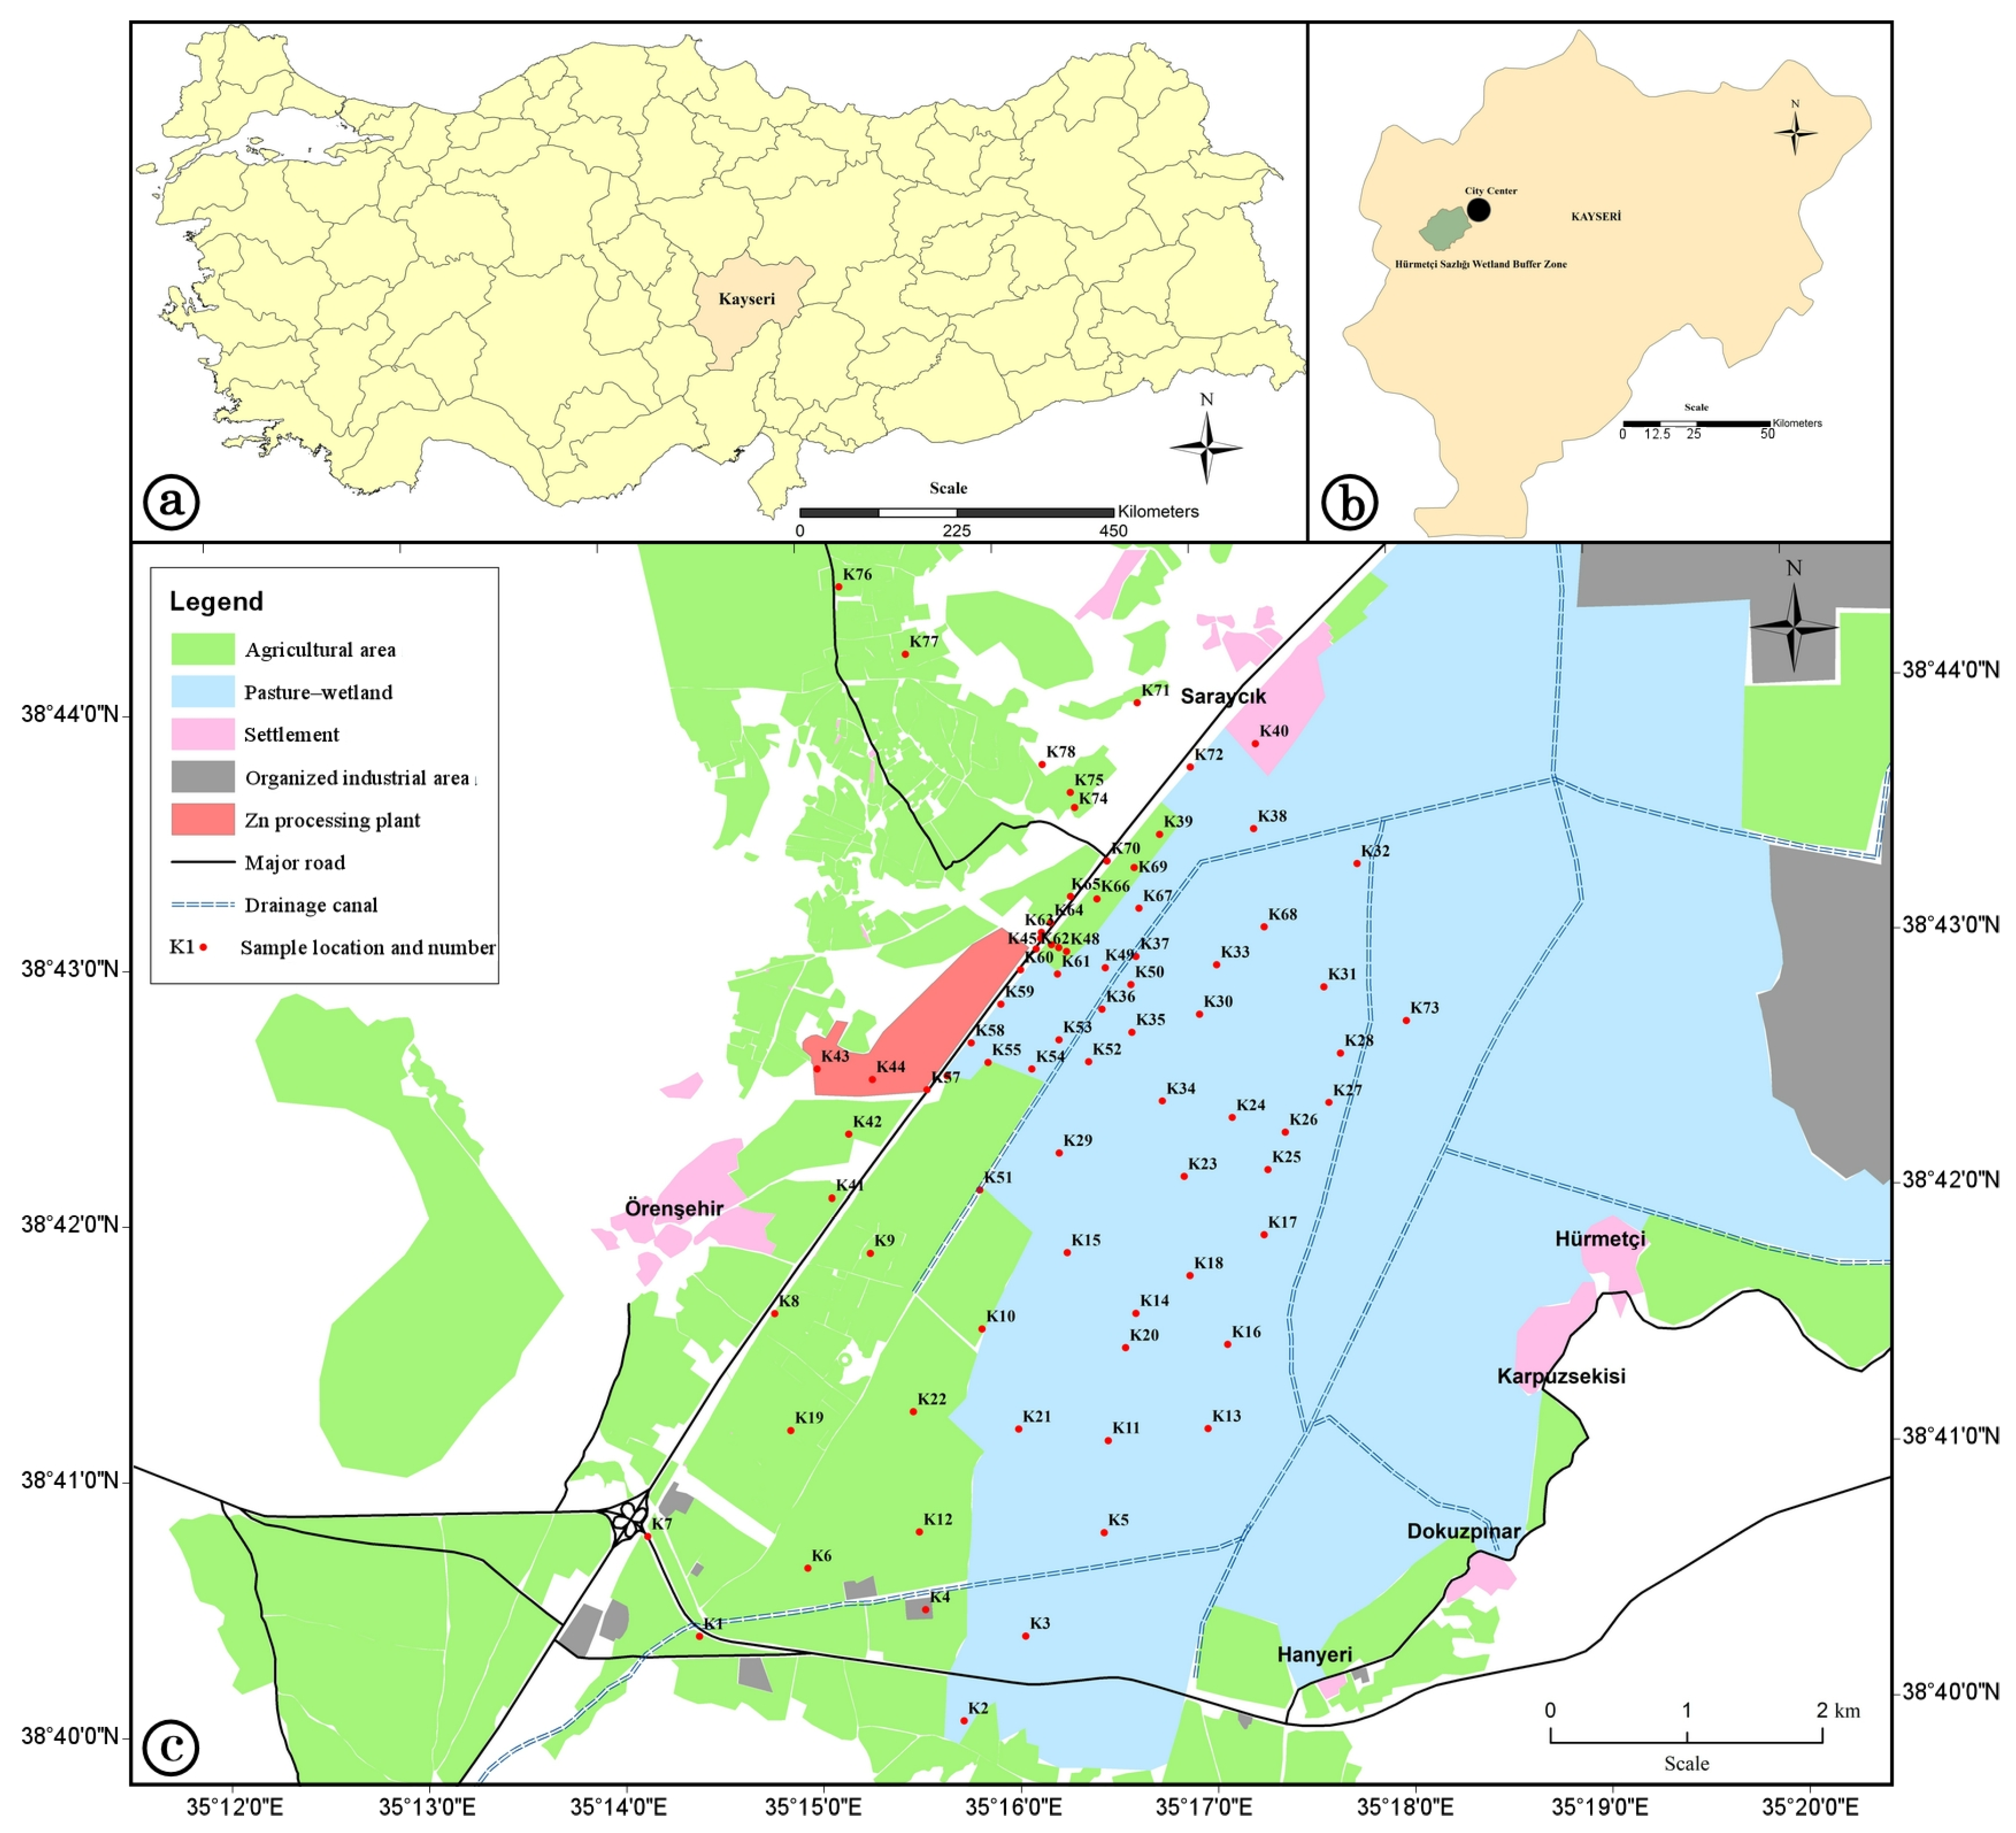
This study was conducted in the area surrounding the nationally significant Hürmetçi Sazlığı Wetland (also known as Karasaz Swamp), located in Karasaz Plain in the Kayseri Province of Turkey (Figure 1). The climate of the study area, located in the Central Anatolia Region of Turkey, is continental; it is cold and snowy during the winter season and hot and dry during the summer season. According to the long-term meteorological records collected between 1975 and 2011, the dominant wind direction in Kayseri is southerly. The Hürmetçi Sazlığı Wetland, covering an area of about 95 km2, is surrounded by the Erciyes mountain (3917 m) in the south, Sultan Marshes in the southwest (SW), an organized industrial zone, and the Kayseri Province in the northwest (NW). A zinc (Zn) processing plant has operated in the area since 1976. Hürmetçi Sazlığı is characterized by a wetland ecosystem consisting of swamps, reeds, and wet meadows and was declared a “Wetland of National Importance” in 2004. Hürmetçi Sazlığı has global importance as it is on the bird migration routes extending to Europe, Asia, and Africa and is on the list of Turkey’s Important Natural Areas [37]. Hürmetçi Sazlığı is a vital wildlife refuge where mammals such as wild horses, ground squirrels, wolves, foxes, badgers, weasels, and hares breed and shelter [37]. Hürmetçi Sazlığı is also used as a pasture area by many villages (e.g., Hürmetçi, Gelbula, Karpuzsekisi, Dokuzpınar, and Hanyeri), where water buffalo farming is an essential source of economic income in the region. The most important water resources in the area are the Vanvanlı Stream and Dokuzpınar Springs, located to the south. Although the water level in the wetland shows seasonal fluctuations, the maximum water depth can reach up to 1 m. While the Karasaz Plain was a semienclosed basin completely covered with reeds until 1957, this area was artificially drained into the Kızılırmak River via the Karasu Stream by State Hydraulic Works (DSİ), and the wetland areas have begun to disappear as a result of a sharp decline in the water levels. Today, remnants of the reeds continue to exist in a very limited area to the NW of the Hürmetçi Sazlığı Wetland. Draining wetland areas was a common government practice in Turkey, especially between the 1960s and the 1970s, during which 50% of the wetlands were dewatered in order to solve public health problems (e.g., considering that these areas were a breeding ground for mosquitoes) and to acquire new agricultural lands [38]. The Hürmetçi Sazlığı area is mainly underlain by Tertiary geological units and was formed in a fault-controlled depression that developed towards the end of the Neogene period. During this period, the area was occupied by a lake, which was later filled with glaciolacustrine clastic materials, intermittent lava flows, and tuff deposits sourced from nearby volcanoes (e.g., Mount Erciyes) [37]. As a result, the Karasaz area was filled with a thick (150–200 m) succession of sediments (clay, sand, and gravel sized) interbedded with tuffs, basalts, and agglomerates [37].

Figure 1.
(a) Simplified map of Turkey; (b) location of the wetland within the Kayseri Province (Central Anatolia Region, Turkey); (c) simplified land use map of the area surrounding the Hürmetçi Sazlığı Wetland and soil sampling locations (represented by red dots).
2.2. Sampling and Analysis
In order to determine the spatial distribution of the selected PTEs in the surface soil, 77 topsoil samples (from 0–20 cm) were collected (in May 2019) from the area around the Hürmetçi Sazlığı Wetland (Figure 1). These samples included one reference (unpolluted) soil sample (sample no K76) collected from a location far from the potential pollution sources. The soil sampling scheme was “simple random sampling”, with soil samples collected in frequent intervals from the sections close to the Zn processing plant and less frequently from the sections far from the Zn processing plant. In addition to the topsoil samples, depth-specific samples were collected from depths of 20–100 cm (four depth intervals with 20 cm increments) in two sampling locations (K14 and K44) and from depths of 20–120 cm (five depth intervals with 20 cm increments) in one sampling location (K63) to determine the vertical variation in the PTEs with the soil profile. On the other hand, one solid waste material sample (K43) was collected from the Zn processing plant (see Figure 1) for comparison purposes. The Zn processing plant, which was built on a land of 0.78 km2, has been operating in the area since 1976. All soil samples were collected by an Edelman hand auger (Eijkelkamp Agrisearch Equipment, The Netherlands) and brought to the laboratory in 1 kg plastic bags. The experimental parts of the present study were carried out in the Department of Environmental Engineering Laboratories and Advanced Technology Education, Research and Application Center (MEİTAM) of Mersin University (Mersin, Turkey). The soil samples were dried in an oven at 100 °C for 1 h and ground in a ring mill at 800 rpm for 15 min. Afterward, 0.1 g of soil sample was weighed and placed in a Teflon crucible for solubilization of the sample. First, 1 mL hydrofluoric acid (HF) (Merck, Darmstadt, Germany) was added into the Teflon crucible on a hot plate set at 270 °C. After HF evaporated completely, 8 mL of an aqua regia solution (2 mL of nitric acid (HNO3) + 6 mL of hydrochloric acid (HCl) (Merck, Germany)) was added into the crucible to dissolve the soil sample completely. Afterwards, the solution in the crucible was transferred into a 50 mL Falcon tube, and the volume was brought to 50 mL with ultrapure water from a Millipore Milli-Q Direct-Q® 3 UV system (Darmstadt, Germany). The dissolved soil samples were analyzed with an Agilent 7500 Inductively Coupled Plasma Mass Spectrometry (ICP-MS) (Tokyo, Japan) instrument for the measurement of the concentrations of selected PTEs (As, Cd, Pb, and Zn). A recovery study was also conducted to test the reliability of the analytical method employed in the study. For this purpose, five samples of a certified soil standard reference material (National Institute of Standards and Technology (NIST) Standard Reference Material (SRM) 2710, Montana Soil) [39] were subjected to the same sample preparation procedures as described previously and analyzed using ICP-MS. The results obtained from the recovery study (see Table 1) using the SRM 2710 soil samples (n = 5) showed satisfactory accuracy, with reasonably high mean recoveries for the selected PTEs (i.e., As, Cd, Pb, and Zn).

Table 1.
Elemental recoveries obtained from the analysis of the NIST SRM 2710 (Montana Soil) soil samples (n = 5).
2.3. Assessment of Soil Quality
2.3.1. Enrichment Factor (EF)
As a soil quality indicator, the EF is an essential tool in assessing the effects of anthropogenic pollution sources on the environment [40]. This simple index has been used in many studies to evaluate the contamination levels of trace elements in sediments and soils [41,42,43,44]. Although the elements used in EF calculations as background generally include Al, Ca, Fe, Mn, Sc, and Ti, elements such as Al, Fe, and Mn are most frequently used in the literature [40]. In this study, the element Al was used as background in EF calculations made using Equation (1):
where Cmetal is the concentration of the trace element, and CAl is the concentration of the background element (i.e., Al in this study) in the soil sample and background (reference) soil sample representing the study area. The present study used a reference (uncontaminated) soil sample (K76) representing the study area as a background sample. The calculated EF values are categorized as EF ≤ 2 (minor enrichment), 2 < EF < 5 (moderate enrichment), 5 < EF < 20 (severe enrichment), 20 < EF < 40 (very severe enrichment), and EF > 40 (extremely severe enrichment) [41,42,43].
2.3.2. Contamination Factor (CF)
In this study, the CF was calculated using Equation (2) to determine the degree of contamination of soils by selected PTEs (metals) [45].
Here, Cmetal is the concentration of the selected trace element in the soil sample, and Cbackground is the concentration of the same trace element in the background (reference) soil sample representing an unpolluted part of the study area. The four pollution categories defined for the CF values are: CF < 2 (uncontaminated to slightly contaminated), 2 < CF < 4 (moderately contaminated), 4 < CF < 6 (significantly contaminated), and CF > 6 (very highly contaminated [45].
2.3.3. Ecological Risk Index (ERI)
The ERI [46] is used to assess the quantitative potential risk posed by trace elements to aquatic ecosystems [43] and is calculated using Equation (3):
Here, Tr is the toxic response factor (for each element) projected by Hakanson [46] (e.g., for As = 10, Cd = 30, Pb = 5, and Zn = 1), and CF is the Contamination Factor described previously (see Equation (2)). The calculated ERI values are divided into five categories as follows: ERI < 20 (low risk), 20 < ERI < 40 (moderate risk), 40 < ERI < 80 (significant risk), 80 < ERI < 160 (high risk), and ERI > 160 (very high risk).
2.3.4. Potential Ecological Risk Index (RI)
The RI is calculated by summing up all risk indices (ERI) for individual trace elements in the soil sample (Equation (4)) [43]:
The calculated RI values are divided into four categories as follows: RI < 30 (low risk), 30 < RI < 60 (moderate risk), 60 < RI < 120 (significant risk), and RI > 120 (high risk).
3. Results
3.1. Spatial Distribution of Selected Trace Elements in the Degraded Wetland Area
Descriptive statistics (i.e., mean, minimum, and maximum) of the concentrations of the selected PTEs (As, Cd, Pb, and Zn) in the topsoil samples (0–20 cm) from the study area (n = 77) are presented in Table 2, and their spatial distribution is shown in Figure 2.
Table 2.
Descriptive statistics of the concentrations (in mg/kg) of selected PTEs in the topsoil samples (0–20 cm) collected from the Hürmetçi Sazlığı Wetland, a reference soil sample (K76), a Zn processing plant solid waste sample (K43), and average shale reported by [47].
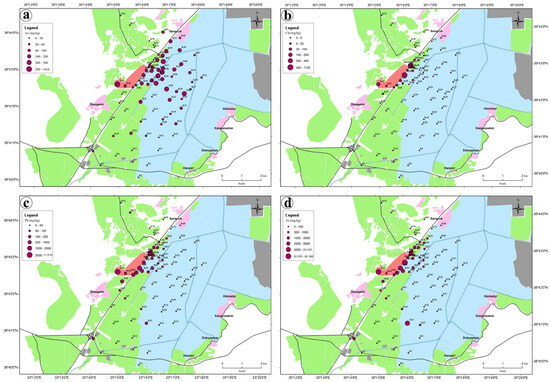
Figure 2.
Spatial distribution of (a) As; (b) Cd; (c) Pb, and (d) Zn concentrations in the topsoil samples (0–20 cm) collected (n = 77) from the area around the Hürmetçi Sazlığı Wetland (the size of the dots is proportional to the element concentrations in the soil samples).
The arsenic (As) concentrations in the topsoil samples from the study area showed more than a 30-fold difference between the minimum and the maximum values, with the mean concentration of As (73.96 mg/kg) being considerably higher than those in the reference soil sample from the area (9.64 mg/kg) and in average shale (13 mg/kg) reported by Turekian and Wedepohl [47] (Table 2). In addition to high As concentrations in pastures and wetlands, extremely high As enrichment in some areas close to the Zn processing plant was observed, indicating more than one source for this PTE (Figure 2a). The measured As concentrations in the solid waste sample collected from the Zn processing plant were more than two orders of magnitude higher than in the reference (unpolluted) soil sample from the study area (Table 2).
The cadmium (Cd) concentrations in the topsoil samples from the study area showed a nearly 3000-fold difference between the minimum and the maximum values, with the mean concentration of Cd (24.8 mg/kg) being considerably higher than those in the reference soil sample from the area (0.61 mg/kg) and in average shale (0.3 mg/kg) reported by [47] (Table 2). These findings indicated the presence of a very high Cd pollution in the study area. The highest Cd concentrations exclusively occurred near the Zn processing plant, as indicated in the map showing the spatial distribution of this PTE (Figure 2b). On the other hand, Cd showed significantly lower concentrations in topsoil samples collected from the agricultural fields and pastures/wetlands away from the Zn processing plant (Figure 2b). Although the Cd concentration measured in the solid waste sample near the Zn processing plant (223.49 mg/kg) was lower than the maximum concentration measured in the topsoil samples (1119.46 mg/kg), the Cd concentrations reported in previous studies for this waste material reached up to 26,000 mg/kg [48]. These results indicate the highly toxic and inhomogeneous nature of the waste material produced by the Zn processing plant.
The lead (Pb) concentrations in the topsoil samples from the study area showed more than a 500-fold difference between the minimum and the maximum values, with the mean concentration of Pb (127.32 mg/kg) being considerably higher than those in the reference soil sample from the area (28.92 mg/kg) and in average shale (20 mg/kg) reported by [47] (Table 2). The Pb concentrations in the topsoil samples collected from the study area were quite high in areas close to the Zn processing plant, while the concentrations in the pasture and wetland areas were generally low, as evidenced by the map showing the spatial distribution of Pb (Figure 2c).
The zinc (Zn) concentrations in the topsoil samples from the study area showed more than an 1850-fold difference between the minimum and the maximum values, with the mean concentration of Zn (1881.49 mg/kg) being considerably higher than those in the reference soil sample from the area (85.97 mg/kg) and in average shale (95 mg/kg) reported by [47] (Table 2). The fact that the mean Zn concentration in the topsoil samples was considerably higher than in average shale indicates the high pollution level in the region. The highly variable distribution of Zn in the topsoil samples, especially near the Zn processing plant (Figure 2d), indicates its anthropogenic (i.e., industrial) origin. In the study area, except for one sampling point (K21), very low Zn concentrations were observed in agricultural lands and pasture areas (Figure 2d).
In order to obtain insights into the pollution sources of the trace elements (i.e., As, Cd, Pb, and Zn) examined in the topsoil samples (0–20 cm), non-parametric Spearman rank correlation coefficients (ρ) were calculated to investigate the relationship between distance (representing the distance of the soil sampling points from the Zn processing plant) and trace element concentrations (see Table 3). As evidenced by the moderately high negative correlation coefficients (ρ) for distance and Cd, Pb, and Zn concentrations (Table 3), the concentrations of these elements increased as the distance from the Zn processing plant decreased. This result shows that these elements most likely originated from the Zn processing plant in the study area’s NW (see Figure 1). The significantly high correlation coefficients (ranging between 0.867 and 0.940) for Cd, Pb, and Zn concentrations indicate that these trace elements derived from the same source. In contrast to the trace elements mentioned above, arsenic (As) showed a very low negative (inverse) correlation with distance (ρ = −0.273) and extremely low correlations with Cd, Pb, and Zn concentrations (Table 3), indicating a dominantly geogenic pollution source for As (e.g., past volcanic activities).
Table 3.
Spearman rank correlation coefficients (ρ) for distance and trace element concentrations in topsoil (0–20 cm) samples (n = 77).
3.2. Vertical Distribution of the Selected Trace Elements in the Soil Sampling Locations
In this study, in addition to the topsoil samples (0–20 cm), soil profile samples were collected from three different locations (K14, K44, and K63) to show the variation in selected PTEs with depth. The sampling points K44 and K63 were chosen close to the Zn processing plant, whereas K14 is located away from this industrial facility (Figure 1). The changes in As, Cd, Pb, and Zn concentrations in the soil profiles at the sampling locations (K14, K44, and K63) are shown graphically in Figure 3.
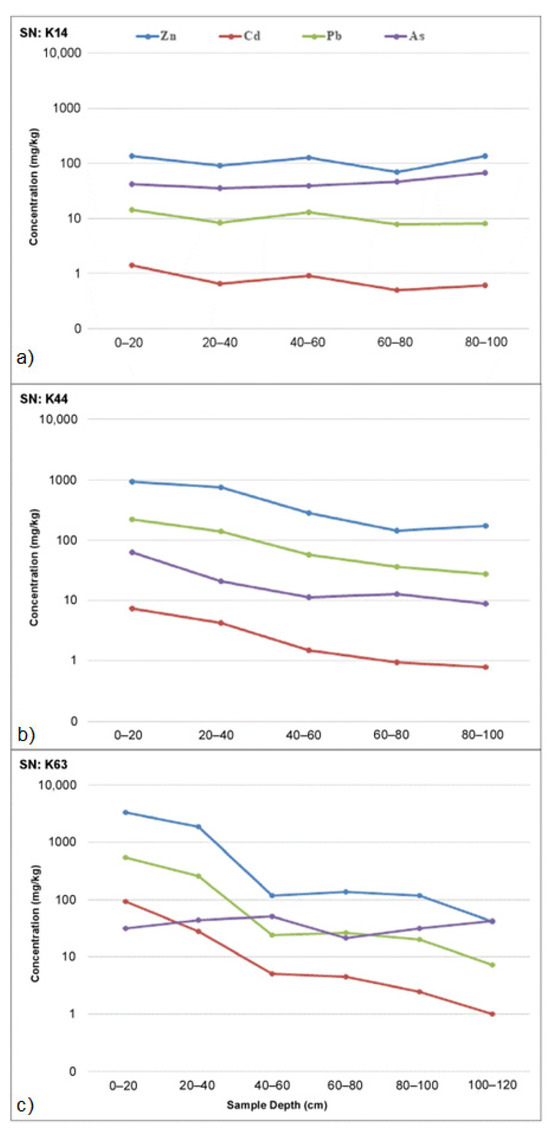
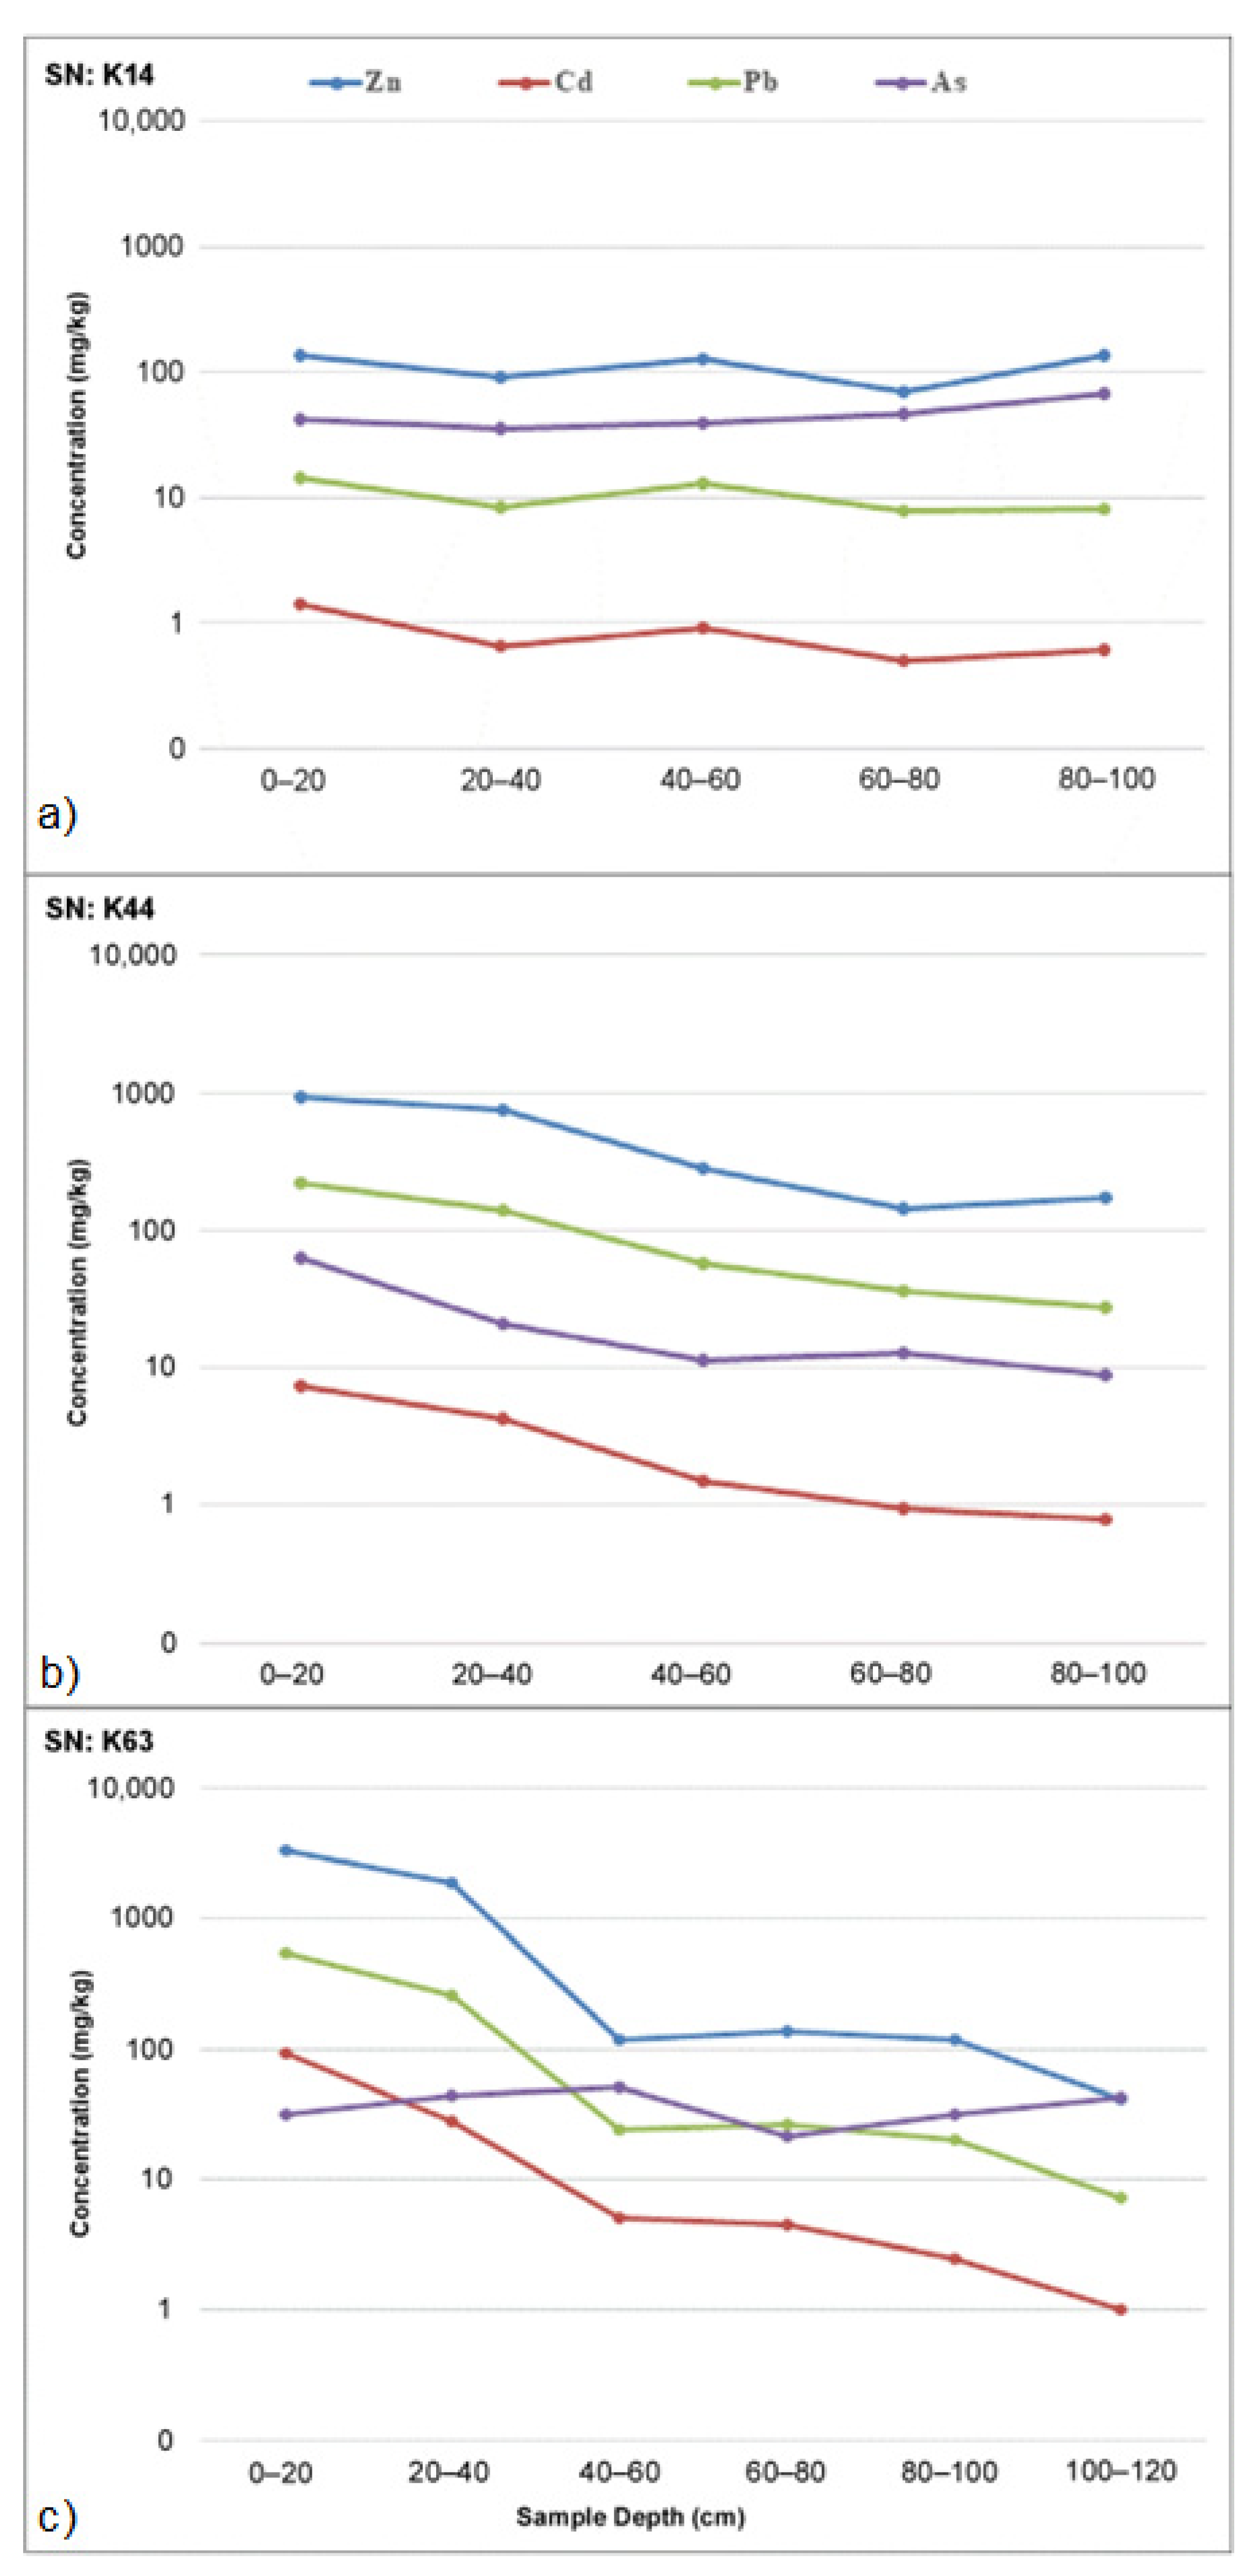
Figure 3.
Variations in As, Cd, Pb, and Zn concentrations along the soil profiles at the K14, K44, and K63 sampling points (the abbreviation SN in the graphs represents the sample number). The distance of the samples K63 and K44 from the Zn processing plant was ~0.1 km, while K14 was at ~2.5 km).
The average concentrations of As, Cd, Pb, and Zn at point K14 (away from the Zn processing plant) were 46.0, 0.82, 10.0, and 111.0 mg/kg, respectively. At this sampling point, there was no significant change in the concentrations of these elements along the soil (depth) profile (Figure 3a). The graph shows that the concentration of As tended to increase slightly in the vertical direction, while the concentration of Cd showed a negligible decrease (Figure 3a). Along the soil profile at point K14, the concentration of As reached up to 68 mg/kg, and its origin can be linked to past volcanic activities in the region. The Cd, Pb, and Zn concentrations at this sampling point (K14) did not change significantly in the vertical direction (Figure 3a).
Figure 3b graphically presents the changes in the As, Cd, Pb, and Zn concentrations along the soil profile at the sampling point K44. At this sampling point (K44), the concentrations of these four elements decreased significantly in the vertical direction, even though the measured As, Pb, and Zn concentrations in the topsoil samples (0–20 cm) were relatively high (Figure 3b).
The changes in the As, Cd, Pb, and Zn concentrations along the soil profile at the sampling point K44 are shown in Figure 3c. At this sampling point, the Cd, Pb, and Zn concentrations reached very high values in the topsoil (0–20 cm). The variations in As concentrations exhibited a parallel trend at the sampling points K14 and K63. Likewise, the vertical distribution of Cd, Pb, and Zn at the sampling points K44 and K63 were similar. They reached very high concentrations along the soil profile (especially at 0–20 cm and 20–40 cm). On the other hand, the Cd, Pb, and Zn concentrations at the sampling points K44 and K63 significantly decreased, especially below a 40 cm soil depth. The sample K14 represents a pasture area far from the Zn processing plant; its PTE concentrations reflect the average concentrations in the region. On the other hand, the samples K44 and K63 were collected from locations close to the Zn processing plant, and the PTE concentrations (i.e., Cd, Pb, and Zn) of the soils at these points, especially at 0–40 cm, were considerably higher than the regional averages. These results indicate that the surface soils near the Zn processing plant were heavily polluted with Cd, Pb, and Zn.
4. Discussion
4.1. Evaluation of Soil Quality in the Study Area
As frequently emphasized in the literature, high trace element concentrations are not always a significant pollution indicator [43,49,50]. In order to characterize pollution, many methods are devised in the literature to evaluate the degree of pollution. In this study, the EF, CF, ERI, and RI indices were calculated, which are soil quality indicators applied to evaluate the PTEs (As, Cd, Pb, and Zn) analyzed in soil samples from the study area. The descriptive statistical results of these soil quality indicators are presented in Table 4. The calculated EF values ranged between 1.00 and 482.48 for As, 0.77 and 3088.73 for Cd, 0.59 and 87.79 for Pb, and 0.61 and 1513.09 for Zn (Table 4). The calculated CF values ranged from 0.70 to 21.07 for As, 1.25 to 3731.54 for Cd, 0.18 to 90.38 for Pb, and 0.44 to 813.55 for Zn (Table 4). The calculated minimum and maximum ERI values were 7.01–210.69 for As, 37.54–111,946.15 for Cd, 0.90–451.92 for Pb, and 0.44–813.55 for Zn (Table 4). The mean, minimum, and maximum RI values, obtained by summing up all risk indices (ERI) for individual trace elements in the soil samples, were 2622.04, 48.54, and 112,980.35, respectively (Table 4).
Table 4.
Descriptive statistics of the soil quality indicators calculated for the selected trace elements in topsoil (0–20 cm) samples (n = 77).
The number of samples in each soil quality class for the soil samples collected from the study area is presented in Table 5. According to the calculated EF values, 38 samples for As, 33 samples for Cd, 7 samples for Pb, and 28 samples for Zn were in the “very severe enrichment” and “extremely severe enrichment” soil quality classes (Table 5). Excluding the first two EF soil quality classes (i.e., EF < 2 and EF = 2–5), the enrichment level of these four elements was Zn > Cd > As > Pb. According to the calculated CF values, 26 samples for As, 39 samples for Cd, 20 samples for Pb, and 21 samples for Zn were classified as “very highly contaminated”. Excluding the first two CF classes (i.e., CF < 2 and CF = 2–4), the contamination level of the studied elements was Cd > As > Zn > Pb. According to the calculated ecological risk index (ERI) values, 21 samples for As, 67 samples for Cd, 7 samples for Pb, and 3 samples for Zn were classified into the “high risk” and “very high risk” soil classes (Table 5 and Figure 4). Excluding the first two ERI soil quality classes (i.e., ERI < 20 and ERI = 20–40), the ecological risk level for these four elements was Cd > As > Pb > Zn. The higher risks posed by the elements As and Cd compared to Pb and Zn can be attributed to their high toxic effects (i.e., As = 10 and Cd = 30) indicated by Hakanson [46]. According to the Potential Ecological Risk Index (RI), considering collectively As, Cd, Pb, and Zn, 6 soil samples out of 77 samples collected within the scope of the present study were classified into the “significant risk”, and 70 samples into “high risk” soil quality classes (Table 5). These results show that nearly all the soil samples collected from the area surrounding the Hürmetçi Sazlığı Wetland indicated a potentially high risk to the ecosystem in the region due to their highly elevated PTE concentrations.
Table 5.
Number of samples (n) within classes defined for each soil quality indicator calculated for topsoil (0–20 cm) samples (n = 77).
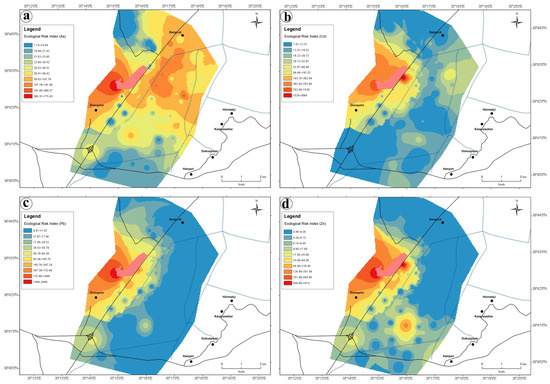
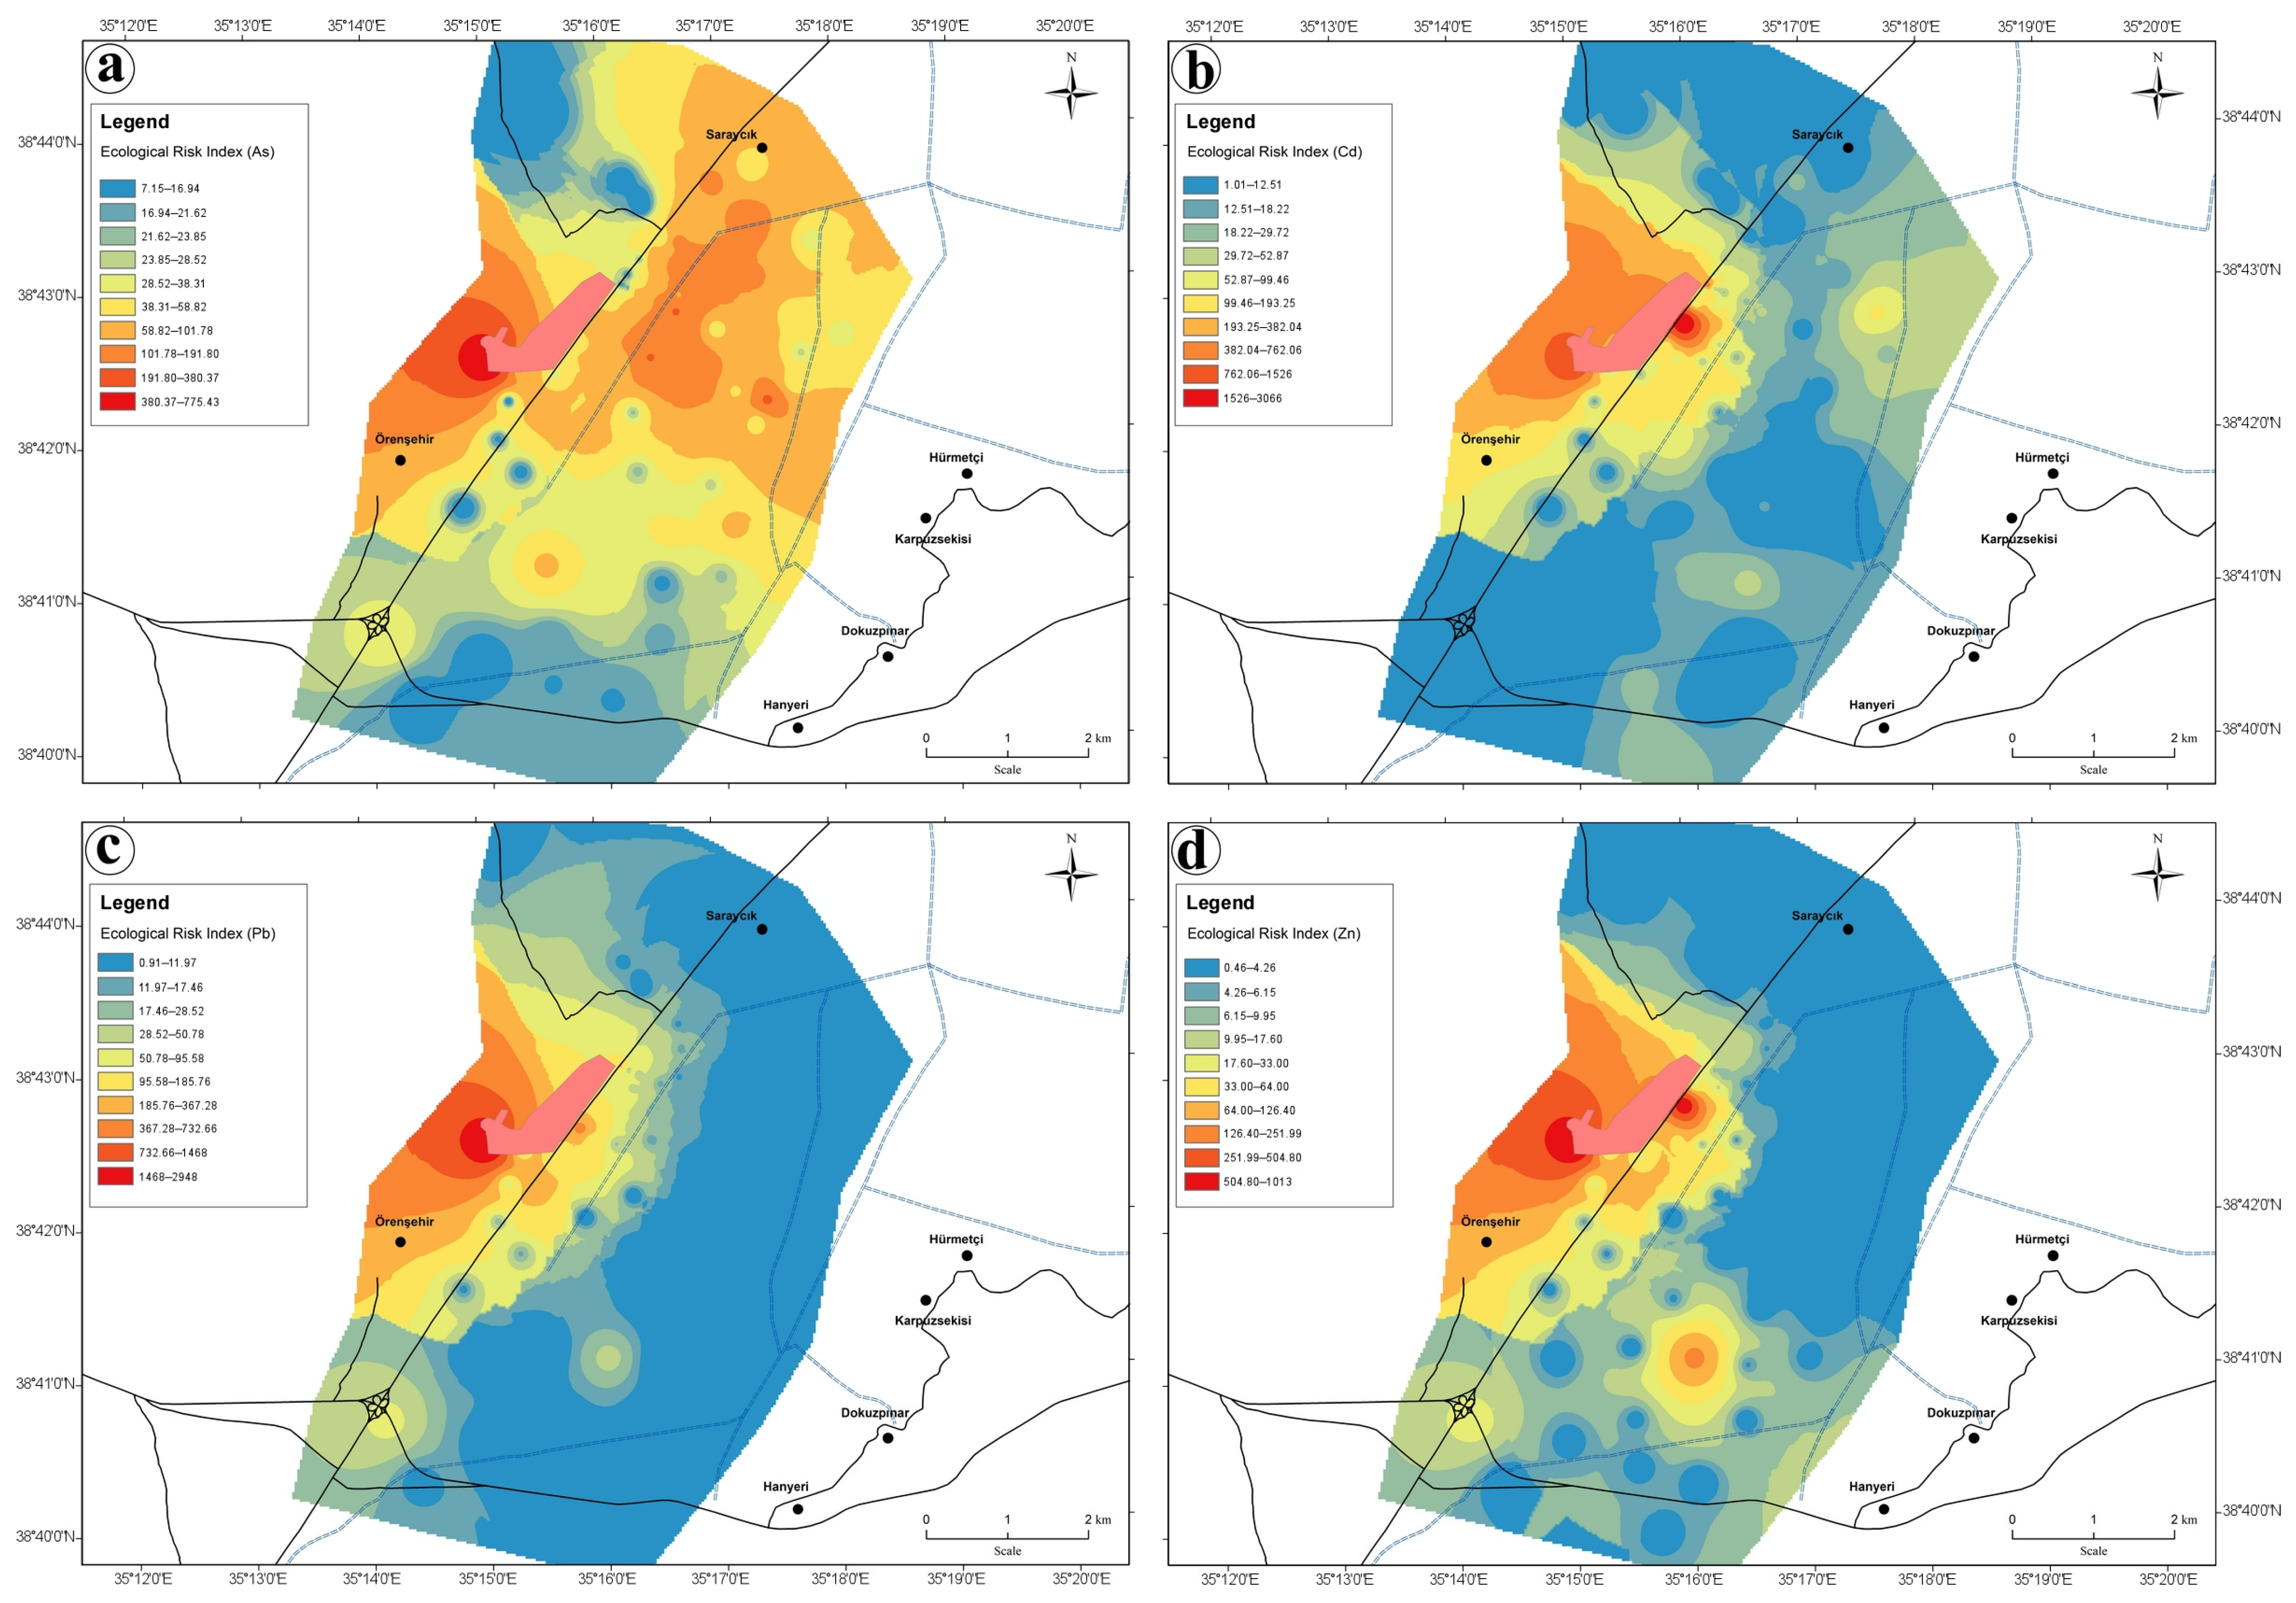
Figure 4.
Spatial distribution of (a) As; (b) Cd; (c) Pb; and (d) Zn ecological risk index values for the topsoil samples (n = 77) from the Hürmetçi Sazlığı Wetland. The spatial distribution maps were interpolated using the inverse distance weighting (IDW) method.
Table 6 compares the EF and RI values of selected wetlands around the world with the values obtained in this study. Kachoueiyan et al. [51] calculated the EF for As (15.58–27.88) and Zn (1.79–2.12) elements in a study conducted in the Gomishan Wetland (Iran) (Table 6). The RI value calculated in this study [51] varied between 62.65 and 97.76. Klubi et al. [52] calculated the EF values for PTEs, including As, Cd, Pb, and Zn, in the Songor Wetland (Ghana) (Table 6). Sreedevi and Harikumar [53] calculated the EF values for Cd, Pb, and Zn in the Ashtamudi Wetland (India) (Table 6). As can be seen in Table 6, the EF values of wetland soils in different regions of the world are considerably lower than the values in the present study. The maximum values of the Potential Ecological Risk Index (RI), which is very important for the ecological life in wetlands, were 97.76 for the Gomishan Wetland (Iran), 634 for the Caohai Wetland (China), 323 for the Huixian Karst Wetland (China), and 112,980 for the Hürmetçi Sazlığı Wetland (Türkiye) (Table 6). The EF and RI values obtained for PTEs in this study are well above the values observed for wetlands in the literature, which reveals the extent of pollution in the Hürmetçi Sazlığı Wetland.
Table 6.
Comparison of EF and RI values of some wetlands in the literature with those in this study.
4.2. Characteristics of Zn Processing Plant Solid Waste
Previous studies stated that the concentrations of Zn and Pb in the waste materials of Zn processing plants can reach up to 15% [54]. The mineralogical characterization of the waste material revealed the presence of mineral phases such as lead sulfate (PbSO4), zinc sulfate heptahydrate (ZnSO47H2O), zinc ferrite (ZnFe2O4), and zinc silicate (2ZnOSiO2) [54], indicating that the PTEs in the waste material were mainly in the form of sulfate compounds. In addition, Balli [48] stated that there was 19.8% Zn and 2.6% Cd in the waste cake produced by the Zn processing plant. In the study area, soil samples with high Cd, Pb, and Zn concentrations were observed in a limited area parallel to the İncesu–Kayseri highway, especially near the Zn processing plant. However, during the field sampling studies, no visible waste material was found in the parts of the study area with high concentrations of PTEs. These findings indicate that waste material may have mixed with the natural soil in these areas in the past several decades. The findings that soil pollution was very high in areas very close to the zinc production plant, no pollution was observed in the soil at far distances from the facility, and the dominant wind direction in the region is southerly showed that wind did not significantly affect the transportation of waste far from the facility.
4.3. Hydrogeological Assessment of the Hürmetçi Sazlığı Wetland
The study area is hydrogeologically a swampy wetland area fed from the surface by the Vanvanlı Stream and Dokuzpınar springs and by mountain front recharge from the Erciyes and Yılanlı mountains. The hydrogeological studies carried out in the region emphasized that the Karasaz Plain aquifer is constantly and regularly fed from a large recharge area consisting of geological units with high hydraulic conductivity [37]. The residence time of groundwater varies from a few months to 75 years through shallow and deep circulation, as indicated by isotope studies [37]. Deep circulation constitutes the groundwater movement, especially fed from the skirts of the Erciyes mountain and under the alluvial units found in the plain. Shallow circulation occurs in the clastic alluvial material in the shallow depths of the plain. While the chemistry of the deep circulating groundwater is mainly determined by the volcanic units, the chemistry of the shallow water is mostly determined by the agricultural and industrial activities carried out in the region. There is also a high potential of PTE (As, Cd, Pb, and Zn) leaching from the polluted surface soils of the area, which can mix with shallow groundwater circulating in these parts. Considering that the Hürmetçi Sazlığı Wetland is an area where water buffalo breeding is an important economic activity, the greatest danger in terms of public health is that PTEs may enter the food chain through the consumption of the meat and milk of these animals. This situation is also an essential danger for the ecosystem and wildlife in the wetland.
4.4. Assessment of Potential Remediation Strategies
Two primary methods, in situ and ex situ, are used to clean contaminated soils. While in situ technologies enable the soil to be cleaned directly where it is contaminated without digging, ex situ technologies are generally carried out by excavating and removing the soil from a contaminated area and then replacing it with cleaned soil. These technologies include isolation and immobilization, mechanical separation, pyrometallurgical, electrokinetic, biochemical, soil washing, and phytoremediation technologies [35]. A few experimental studies [25,33,34,35] were carried out on the cleaning of contaminated soils of the Hürmetçi Sazlığı Wetland. In these studies, it was found that significant treatment efficiency can be achieved in cleaning the contaminated soils of the wetland area. The contaminated soils of the Hürmetçi Sazlığı Wetland must be treated with one of the proposed methods in these studies.
5. Conclusions
The spatial and vertical (soil profile) distribution of PTEs in the soil samples indicates the presence of a high As, Cd, Pb, and Zn contamination in certain parts of the study area. Especially in the sections parallel to the İncesu–Kayseri highway and close to the Zn processing plant, Cd, Pb, and Zn displayed similar distribution and very high concentrations in the soil samples. However, As displayed relatively higher concentrations, especially in pasture areas. It is highly probable that the high As concentrations occurring in the area are caused by the past volcanic activities of Mount Erciyes. On the other hand, the high concentrations of Cd, Pb, and Zn in soil samples originate mainly from the Zn processing plant located within the study area. According to the analysis results of the soil profile sampling from three selected points, it was seen that there was no significant change in the PTE concentrations along the depth profile, especially in the locations outside the influence area of the Zn processing plant (e.g., at K14). On the other hand, in other soil profile points (i.e., K44 and K63), the Cd, Pb, and Zn concentrations reached very high values up to a 40 cm depth and gradually decreased below this depth limit. These findings indicate that PTE pollution occurring in the area is mainly confined to shallow soil depths (0–50 cm). The calculated soil quality indicators (i.e., EF, CF, ERI, and RI) also show very high values in certain parts of the study area, especially along the Kayseri–İncesu highway. According to the calculated Potential Ecological Risk Index (RI) values, it was determined that the ecological risk is very high in 70 out of the 77 sampling points in the study area. As the results of this study show, there is an anthropogenic Cd, Pb, and Zn pollution in the areas close to the Zn processing plant, where site-specific soil remediation methods must be determined and applied urgently to protect the ecological health of this sensitive environment. After the remediation of the polluted area, the drainage channels built to dewater the wetland should be removed, and the area should be allowed to store water again. Along with these studies, monitoring the water chemistry in the wetland in certain periods and intervening in the case of possible pollutant input is very important for the sustainability of this fragile wetland ecosystem.
Author Contributions
Conceptualization, M.A.K., S.Y., C.G., O.G., and Ü.Y.; methodology, M.A.K., C.G., and Ü.Y.; software, M.A.K., C.G., and Ü.Y.; validation, M.A.K., C.G., and Ü.Y.; investigation, M.A.K., C.G., and Ü.Y.; resources, M.A.K., S.Y., C.G., O.G., and Ü.Y.; data curation, M.A.K., C.G., and Ü.Y.; writing—original draft preparation, M.A.K., C.G., and Ü.Y.; writing—review and editing, M.A.K., C.G., and Ü.Y.; visualization, M.A.K., C.G., and Ü.Y.; supervision, M.A.K., C.G., and Ü.Y.; project administration, M.A.K.; funding acquisition, M.A.K. All authors have read and agreed to the published version of the manuscript.
Funding
This research was funded by the Mersin University Scientific Research Projects (BAP) Unit, grant number: 2018-2-TP2-2920.
Institutional Review Board Statement
Not applicable.
Informed Consent Statement
Not applicable.
Data Availability Statement
Requests should be sent to mehmetalikurt@gmail.com and are subject to approval by all named authors participating in this study.
Conflicts of Interest
The authors declare no conflicts of interest.
References
- Güler, C.; Alpaslan, M.; Kurt, M.A.; Temel, A. Deciphering factors controlling trace element distribution in the soils of Karaduvar industrial-agricultural area (Mersin, SE Turkey). Environ. Earth Sci. 2010, 60, 203–218. [Google Scholar] [CrossRef]
- Manoj, K.; Padhy, P.K. Distribution, enrichment and ecological risk assessment of six elements in bed sediments of a tropical river, Chottanagpur Plateau: A spatial and temporal appraisal. J. Environ. Prot. 2014, 5, 1419–1434. [Google Scholar] [CrossRef]
- Arivoli, A.; Mohanraj, R.; Seenivasan, R. Application of vertical flow constructed wetland in treatment of heavy metals from pulp and paper industry wastewater. Environ. Sci. Pollut. Res. 2015, 22, 13336–13343. [Google Scholar] [CrossRef] [PubMed]
- Shi, W.; Li, T.; Feng, Y.; Su, H.; Yang, Q. Source apportionment and risk assessment for available occurrence forms of heavy metals in Dongdahe Wetland sediments, southwest of China. Sci. Total Environ. 2022, 815, 152837. [Google Scholar] [CrossRef] [PubMed]
- Grimm, N.B.; Groffman, P.M. “Accidental” urban wetlands: Ecosystem functions in unexpected places. Front. Ecol. Environ. 2017, 15, 248–256. [Google Scholar] [CrossRef]
- Chen, H.L.; Su, H.T.; Guo, P.Y.; Shen, X.B.; Deng, J.; Zhang, Y.; Wu, Y.; Li, Y. Effects of planting patterns on heavy metals (Cd, As) in soils following mangrove wetlands restoration. Int. J. Phytoremediation 2019, 21, 725–732. [Google Scholar] [CrossRef]
- Hu, B.; Guo, P.; Wu, Y.; Deng, J.; Su, H.; Li, Y.; Nan, Y. Study of soil physicochemical properties and heavy metals of a mangrove restoration wetland. J. Clean. Prod. 2021, 291, 125965. [Google Scholar] [CrossRef]
- Ladhar, S.S. Status of ecological health of wetlands in Punjab, India. Aquat. Ecosyst. Health Manag. 2002, 5, 457–465. [Google Scholar] [CrossRef]
- Zedler, J.B.; Kercher, S. Wetland resources: Status, trends, ecosystem services, and restorability. Annu. Rev. Environ. Resour. 2005, 30, 39–74. [Google Scholar] [CrossRef]
- Brinson, M.M.; Malvarez, A. Temperate freshwater wetlands: Types, status and threats. Environ. Conserv. 2002, 29, 115–133. [Google Scholar] [CrossRef]
- Bai, J.; Xiao, R.; Cui, B.; Zhang, K.; Wang, Q.; Liu, X.; Gao, H.; Huang, L. Assessment of heavy metal pollution in wetland soils from the young and old reclaimed regions in the Pearl River Estuary, South China. Environ. Pollut. 2011, 159, 817–824. [Google Scholar] [CrossRef] [PubMed]
- Xiao, R.; Bai, J.; Gao, H.; Wang, J.; Huang, L.; Liu, P. Distribution and contamination assessment of heavy metals in water and soils from the college town in the Pearl River Delta, China. CLEAN Soil Air Water 2012, 40, 1167–1173. [Google Scholar] [CrossRef]
- Wang, Q.; Mei, D.; Chen, J.; Lin, Y.; Liu, J.; Lu, H.; Yan, C. Sequestration of heavy metal by glomalin-related soil protein: Implication for water quality improvement in mangrove wetlands. Water Res. 2019, 148, 142–152. [Google Scholar] [CrossRef] [PubMed]
- Xiao, H.; Shahab, A.; Li, J.; Xi, B.; Sun, X.; He, H.; Yu, G. Distribution, ecological risk assessment and source identification of heavy metals in surface sediments of Huixian karst wetland, China. Ecotoxicol. Environ. Saf. 2019, 185, 109700. [Google Scholar] [CrossRef] [PubMed]
- Zhang, Z.; Zheng, D.; Xue, Z.; Wu, H.; Jiang, M. Identification of anthropogenic contributions to heavy metals in wetland soils of the Karuola Glacier in the Qinghai-Tibetan Plateau. Ecol. Indic. 2019, 98, 678–685. [Google Scholar] [CrossRef]
- Torbati, S.; Kangarloei, B.A.; Khataee, A. Bioconcentration of heavy metals by three plant species growing in Golmarz wetland, in northwestern Iran: The plants antioxidant responses to metal pollutions. Environ. Technol. Innov. 2021, 24, 101804. [Google Scholar] [CrossRef]
- Xia, P.; Ma, L.; Yi, Y.; Lin, T. Assessment of heavy metal pollution and exposure risk for migratory birds—A case study of Caohai wetland in Guizhou Plateau (China). Environ. Pollut. 2021, 275, 116564. [Google Scholar] [CrossRef] [PubMed]
- Li, C.; Wang, H.; Liao, X.; Xiao, R.; Liu, K.; Bai, J.; Li, B.; He, Q. Heavy metal pollution in coastal wetlands: A systematic review of studies globally over the past three decades. J. Hazard. Mater. 2022, 424, 127312. [Google Scholar] [CrossRef] [PubMed]
- Nabuyanda, M.M.; Kelderman, P.; Bruggen, J.V.; Irvine, K. Distribution of the heavy metals Co, Cu, and Pb in sediments and Typha spp. and Phragmites mauritianus in three Zambian wetlands. J. Environ. Manag. 2022, 304, 114133. [Google Scholar] [CrossRef]
- da Silva, M.R.; Lamotte, M.; Donard, O.F.X.; Soriano-Sierra, E.J.; Robert, M. Metal contamination in surface sediments of mangroves, lagoons and southern bay in Florianopolis Island. Environ. Technol. 1996, 17, 1035–1046. [Google Scholar] [CrossRef]
- Caeiro, S.; Costa, M.H.; Ramos, T.B.; Fernandes, F.; Silveira, N.; Coimbra, A.; Medeiros, G.; Painho, M. Assessing heavy metal contamination in Sado Estuary sediment: An index analysis approach. Ecol. Indic. 2005, 5, 151–169. [Google Scholar] [CrossRef]
- Zhang, H.; Jiang, Y.; Ding, M.; Xie, Z. Level, source identification, and risk analysis of heavy metal in surface sediments from river-lake ecosystems in the Poyang Lake, China. Environ. Sci. Pollut. Res. 2017, 24, 21902–21916. [Google Scholar] [CrossRef] [PubMed]
- Kurt, M.A. Comparison of trace element and heavy metal concentrations of top and bottom soils in a complex land use area. Carpathian J. Earth Environ. Sci. 2018, 13, 47–56. [Google Scholar] [CrossRef]
- Mondal, P.; Reichelt-Brushett, A.J.; Jonathan, M.P.; Babu, S.S. Pollution evaluation of total and acid-leachable trace elements in surface sediments of Hooghly River Estuary and Sundarban Mangrove Wetland (India). Environ. Sci. Pollut. Res. 2018, 25, 5681–5699. [Google Scholar] [CrossRef] [PubMed]
- Delil, A.D.; Köleli, N. Investigation of a combined continuous flow system for the removal of Pb and Cd from heavily contaminated soil. Chemosphere 2019, 229, 181–187. [Google Scholar] [CrossRef] [PubMed]
- Malekmohammadi, B.; Blouchi, L.R. Ecological risk assessment of wetland ecosystems using Multi Criteria Decision Making and Geographic Information System. Ecol. Indic. 2014, 41, 133–144. [Google Scholar] [CrossRef]
- Islam, M.S.; Ahmed, M.K.; Raknuzzaman, M.; Habibullah-Al-Mamun, M.; Islam, M.K. Heavy metal pollution in surface water and sediment: A preliminary assessment of an urban river in a developing country. Ecol. Indic. 2015, 48, 282–291. [Google Scholar] [CrossRef]
- Chen, H.; Wang, J.; Chen, J.; Lin, H.; Lin, C. Assessment of heavy metal contamination in the surface sediments: A reexamination into the offshore environment in China. Mar. Pollut. Bull. 2016, 113, 132–140. [Google Scholar] [CrossRef]
- Liang, J.; Yang, Z.; Tang, L.; Zeng, G.; Yu, M.; Li, X.; Wu, H.; Qian, Y.; Li, X.; Luo, Y. Changes in heavy metal mobility and availability from contaminated wetland soil remediated with combined biochar-compost. Chemosphere 2017, 181, 281–288. [Google Scholar] [CrossRef]
- Zhao, G.Y.S.; Yuan, H.; Ding, X.; Wang, J. Surface sediment properties and heavy metal pollution assessment in the Pearl River Estuary, China. Environ. Sci. Pollut. Res. 2017, 24, 2966–2979. [Google Scholar] [CrossRef]
- Kılıçel, F. Çinkur Çevresindeki Topraklarda Ağır Metal Kirliliğinin (Cu, Ni, Cd, Pb, Mn, Zn) Atomik Absorpsiyon Spektrometri Yöntemiyle Tayini. Master’s Thesis, Erciyes University, Kayseri, Türkiye, 1992. (In Turkish). [Google Scholar]
- Aksoy, A.; Şahin, U. Elaeagnus angustifolia L. as a biomonitor of heavy metal pollution. Turk. J. Bot. 1999, 23, 83–87. Available online: https://journals.tubitak.gov.tr/botany/vol23/iss2/2 (accessed on 10 July 2023).
- Doğan, B.S. İki Farklı Yıkama Çözeltisi (EDTA ve HCl) Ile Ağır Metal Giderimi Sonucu Toprak Yapısındaki Değişimlerin Araştırılması. Master’s Thesis, Mersin University, Mersin, Türkiye, 2012. (In Turkish). [Google Scholar]
- Demir, A. Topraktan Kurşun Ile Kadmiyum Ekstraksiyonu ve Elektrokimyasal Gideriminin Sürekli Akımlı Bir Sistemde Araştırılması. Ph.D. Thesis, Mersin University, Mersin, Türkiye, 2013. (In Turkish). [Google Scholar]
- Çiftçi, A. Çoklu Metal (Kadmiyum, Kurşun ve Çinko) ile Kirlenmiş bir Toprağın Arıtımında Yabani Hint Yağı (Ricinus communis) ve Aspir (Carthamus tinctorius) Bitkilerinin Fitoremediasyon Kapasitesinin Araştırılması. Ph.D. Thesis, Mersin University, Mersin, Türkiye, 2016. (In Turkish). [Google Scholar]
- Delil, A.D.; Köleli, N. The removal of Pb and Cd from heavily contaminated soil in Kayseri, Turkey by a combined process of soil washing and electrodeposition. Soil Sediment Contam. 2018, 27, 469–484. [Google Scholar] [CrossRef]
- MFWM (Ministry of Forestry and Water Management). Hürmetçi Sazlığı Wetland Revised Management Plan; Republic of Türkiye, Ministry of Forestry and Water Management VII; Regional Directorate Kayseri Branch Directorate: Ankara, Türkiye, 2017; (unpublished report, In Turkish).
- Abacı-Bayan, A.A.; Yılmaz, K. Investigation of physical properties of some wetland soils. Nevşehir J. Sci. Technol. 2017, 6, 52–62. [Google Scholar] [CrossRef]
- NIST (National Institute of Standards and Technology). Certificate of Analysis, Standard Reference Material 2710 (Montana Soil); National Institute of Standards and Technology: Gaithersburg, MD, USA, 2003.
- Ferreira, S.L.C.; da Silva Junior, J.B.; dos Santos, I.F.; de Oliveira, O.M.C.; Cerda, V.; Queiroz, A.F.S. Use of pollution indices and ecological risk in the assessment of contamination from chemical elements in soils and sediments—Practical aspects. Trends Environ. Anal. Chem. 2022, 35, e00169. [Google Scholar] [CrossRef]
- Sutherland, R.A. Bed sediment-associated trace metals in an urban stream, Oahu, Hawaii. Environ. Geol. 2000, 39, 611–627. [Google Scholar] [CrossRef]
- Soyol-Erdene, T.O.; Lin, S.; Tuuguu, E.; Daichaa, D.; Huang, K.M.; Bilguun, U.; Tseveendorj, E.A. Spatial and temporal variations of sediment metals in the Tuul River, Mongolia. Environ. Sci. Pollut. Res. 2019, 26, 32420–32431. [Google Scholar] [CrossRef]
- Kaya, T.N.A.; Sarı, E.; Kurt, M.A. Sedimentary records of trace elements contamination in sediment core from the Gulf of Gemlik, Marmara Sea, Turkey: History, contamination degree, and sources. Turk. J. Earth Sci. 2022, 31, 452–466. [Google Scholar] [CrossRef]
- Dominech, S.; Albanese, S.; Guarino, A.; Yang, S. Assessment on the source of geochemical anomalies in the sediments of the Changjiang River (China), using a modified enrichment factor based on multivariate statistical analyses. Environ. Pollut. 2022, 313, 120–126. [Google Scholar] [CrossRef]
- Sarı, E.; Gümüş, U.; Çağatay, M.N.; Kurt, M.A.; Kılıç, Ö.; Arslan, T.N. Distribution and environmental risk evaluation of metals in sediment cores from Marmara Ereğlisi shelf, Marmara Sea, Turkey. Arab. J. Sci. Eng. 2020, 45, 261–273. [Google Scholar] [CrossRef]
- Hakanson, L. An ecological risk index for aquatic pollution control. A sedimentological approach. Water Res. 1980, 14, 975–1001. [Google Scholar] [CrossRef]
- Turekian, K.K.; Wedepohl, K.H. Distribution of the elements in some major units of the Earth’s crust. Geol. Soc. Am. Bull. 1961, 72, 175–192. [Google Scholar] [CrossRef]
- Balli, C. Çinkur Fabrikası liç Atıklarından Germanyumun Emülsiyon Tipi Sıvı Membranlarla Ayrılması. Master’s Thesis, Sakarya University, Sakarya, Türkiye, 2007. (In Turkish). [Google Scholar]
- Young, G.; Chen, Y.; Yang, M. Concentrations, distribution, and risk assessment of heavy metals in the iron tailings of Yeshan National Mine Park in Nanjing, China. Chemosphere 2021, 271, 129546. [Google Scholar] [CrossRef] [PubMed]
- Yüksel, B.; Ustaoğlu, F.; Arıca, E. Impacts of a garbage disposal facility on the water quality of Çavuşlu Stream in Giresun, Turkey: A health risk assessment study by a validated ICP-MS assay. Aquat. Sci. Eng. 2021, 36, 181–192. [Google Scholar] [CrossRef]
- Kachoueiyan, F.; Karbassi, A.; Nasrabadi, T.; Rashidiyan, M.; De-la-Torre, G.E. Speciation characteristics, ecological risk assessment, and source apportionment of heavy metals in the surface sediments of the Gomishan wetland. Mar. Pollut. Bull. 2024, 198, 115835. [Google Scholar] [CrossRef]
- Klubi, E.; Adotey, D.K.; Addo, S.; Abril, J.M. Assessment of metal levels and pollution indices of the Songor Wetland, Ghana. Reg. Stud. Mar. Sci. 2021, 46, 101875. [Google Scholar] [CrossRef]
- Sreedevi, M.A.; Harikumar, P.S. Occurrence, distribution, and ecological risk of heavy metals and persistent organic pollutants (OCPs, PCBs, and PAHs) in surface sediments of the Ashtamudi wetland, south-west coast of India. Reg. Stud. Mar. Sci. 2023, 64, 103044. [Google Scholar] [CrossRef]
- Rüşen, A. Recovery of Zinc and Lead From Çinkur Leach Residues by Using Hydrometallurgical Techniques. Master’s Thesis, Middle East Technical University, Ankara, Türkiye, 2007. [Google Scholar]

Disclaimer/Publisher’s Note: The statements, opinions and data contained in all publications are solely those of the individual author(s) and contributor(s) and not of MDPI and/or the editor(s). MDPI and/or the editor(s) disclaim responsibility for any injury to people or property resulting from any ideas, methods, instructions or products referred to in the content. |
© 2024 by the authors. Licensee MDPI, Basel, Switzerland. This article is an open access article distributed under the terms and conditions of the Creative Commons Attribution (CC BY) license (https://creativecommons.org/licenses/by/4.0/).