Article

Synthesis and Characterization of Biochars and Activated Carbons Derived from Various Biomasses

1
School of Chemistry and Life Sciences, Hanoi University of Science and Technology, No. 1 Dai Co Viet, Hai Ba Trung, Hanoi 113000, Vietnam
2
Institute of Sustainability for Chemicals, Energy, and Environment (ISCE2), Agency for Science, Technology and Research (A*STAR), 1 Pesek Road, Jurong Island, Singapore 627833, Singapore
*
Author to whom correspondence should be addressed.
Sustainability 2024, 16(13), 5495; https://doi.org/10.3390/su16135495
Submission received: 28 April 2024 / Revised: 21 June 2024 / Accepted: 24 June 2024 / Published: 27 June 2024
(This article belongs to the Special Issue Recovery and Recycling from Waste Streams)

Abstract

:
Reducing CO2 emissions is urgently needed to slow down the impacts of climate change. CO2 capture using an amine solution has been developed and implemented at pilot and commercial scales. However, amine scrubbing, in particular, produces a lot of degraded solvents as waste and is energy intensive. Solid sorbents have been used to overcome these drawbacks. In this work, waste biomass-derived carbon materials were developed and characterized. Advanced thermal chemical processes, i.e., hydrothermal and pyrolysis processes, were applied to produce materials from agrifood waste, such as soybean and okara. It was found that functional groups (-C=O and -OH) appeared in the synthesized materials, implying the generation of surface oxygenated groups. Preliminary results showed that synthesized activated carbons were obtained with good yields and relatively high surface areas, which may be applied as CO2 adsorption materials to solve CO2 emission problems.

1. Introduction

CO2 emissions have been a global concern for decades [1] due to the increase in emissions into the atmosphere [2,3,4,5]. For instance, in 2022, globally, fossil fuel combustion and cement manufacturing sectors generated 36.1 ± 0.3 GtCO2 that was emitted into our global atmosphere—an increase of 1.5% compared to the global CO2 emissions for 2021, which amounted to 35.5 GtCO2 [6]. Many countries, stakeholders, and organizations are working towards CO2 reductions and are committed to net-zero targets, including Vietnam. In 2022, Vietnam’s CO2 emissions amounted to 343.61 million tons and are estimated to quadruple by 2050 if no action is taken. To combat the climate change problem, CO2 needs to be captured and long-term stored. CO2 capture using an amine solution has been developed and implemented at pilot and commercial scales. However, aqueous amine solutions and amine scrubbing, in particular, produce a lot of degraded solvents as waste, are energy-intensive, and are not very economical during the regeneration process [7]. Using solid adsorption materials is an important approach to cutting down CO2 emissions [2], since such materials overcome the drawbacks of aqueous amine-based solutions [1]. Currently, the solid materials that are most widely used for CO2 adsorption include zeolites, metal–organic frameworks (MOFs), carbon materials (activated carbon, graphite, graphene, carbon nanotubes, biochar, and hydrochar) [2,7], and amine-skeleton solid-amine materials [8]. Some other materials, such as alumina, amine-based materials, metal oxides [9], silica, porous crystalline solids [10], and polymers can also be used [2,7,8,11,12,13].
Biomass is the major sustainable source for generating activated carbon, biochar, hydrochar [14,15], and biomaterials [2,16]. Popular biomass sources include rice husks, rice straw, and coffee waste. Lately, there have been several studies on CO2 adsorption materials derived from these common biomass sources, such as works on the synthesis of CO2-absorbent materials derived from rice straw, lotus leaves, biomass waste, bamboo, waste coffee grounds, and rice husks [17,18,19,20,21,22].
Okara powder waste, or soy pulp, “doufu zha” or “dou zha” in Chinese, and “bã đậu phụ” in Vietnamese, consists of insoluble residues [23] and is a by-product of soy milk (after soy slurry is filtered into soy milk) and tofu preparation. It is estimated that for every kilogram of dry soybeans processed into soy milk or tofu, one kilogram of okara power is produced [24]. Okara contains crude fibers which are mainly composed of cellulose, hemicellulose, and lignin. These fibers can be used in food industries, e.g., for making bakery products [25].
Worldwide, most okara is utilized as food for livestock, such as hogs and cows [26]. The rest of the okara is used for making natural fertilizers or producing compost for gardening or agricultural purposes since it is fairly rich in nitrogen. A small amount of okara is used in cooking. Owing to the high fiber content of okara and its availability, okara is a good raw material for producing high-fiber foods and is also used for making dietary foods for people who want to avoid diabetes and obesity [27].
To convert common biomass and okara in particular into adsorbent materials, thermochemical processes such as pyrolysis and hydrothermal carbonization are often used. Pyrolysis is a thermal decomposition process performed in an inert, i.e., N2, environment at an elevated temperature range of 500–600 °C. It is commonly used for producing carbon-rich materials from organic matter, e.g., biomass. This process produces liquids (known as bio-oils, condensable volatiles); gases such as CO, CO2, H2, and gaseous hydrocarbons [6,28]; and solids (known as biochar). Biochar is a popular adsorbent for environmental remediation, e.g., for removing heavy metal(oids) from wastewater [29,30]. Better adsorption is obtained when nanoadsorbent biochar surface areas are increased [29]. The proportion of these fractions depends on pyrolysis operation conditions, namely, heating rate, temperature [31], holding time, type of reactor [32,33,34], particle size, and the nature of feedstock used [35,36]. To maximize the solid fraction, it was found [13] that the heating rate of the pyrolysis process should be below 1.0 °C/min [31], the operating temperature should be around 550 °C [31], and the residence time should be below 2 h [31].
The hydrothermal carbonization method (known as HTC) is a thermal chemical reaction using water as a solvent in a sealed pressured vessel in a temperature range of 180–300 °C (corresponding to a pressure of 2–6 MPa) for 5 to 240 min [37,38,39]. The hydrothermal technology is suitable for wet feedstock, eliminating the energy-intensive drying step to produce carbon-rich solids known as “hydrochars” [40]. Hydrochars can be used for pollutant treatment [41] and bioenergy [42], or as precursors for preparing activated carbons [43]. The hydrothermal process is favorable in lowering ash contents, as a significant proportion of inorganics are dissolved in the aqueous phase [43]. Zeolites, which include metal and metal oxide-supported catalysts, have been proven to increase biomass conversion selectivity and efficiency [28]. Natural zeolites can have thermally stable carbon and higher surface areas and pore volumes, which are advantageous for the hydrothermal carbonization of biomass [44].
Though there has been a lot of research undertaken to develop CO2-adsorbent materials from biomass sources, such as corn cobs (CCs), date seeds (DSs), peanut shells (PSs), pomegranate peels (PPs), and rice husks (RHs) in the work of Mumtaz H [19] and lotus stalks in that of Yang P [45], no research has been carried out on the synthesis of CO2-absorbent materials from okara powder waste. In terms of environmental implications and cost-effectiveness, okara can be considered an ideal biomass source for activated carbon, hydrochar, and biochar production for CO2 adsorption. This research aimed to use simple, low-cost, and environmentally friendly methods to obtain activated carbon via a chemical thermal process, namely, slow pyrolysis and hydrothermal synthesis of okara-derived materials, for CO2 adsorption. In the context of global CO2 emissions and sustainable development [46], this research is useful since these experiments offer new insights into the potential application of okara powder waste.

2. Materials and Methods

Okara powder waste was collected from local tofu producers in Hanoi. The okara powder waste collected in Hanoi is naturally white in color and water-absorbing in its powder phase and is often sold by tofu producers to livestock farmers or gardeners as animal feed or as a supplement for flower and ornamental plant growers. Okara powder waste was brought to the lab and dried naturally under sunlight for 7–10 days. Next, the okara powder waste was dried in a Contherm Thermotec 2000 oven (Lower Hutt, New Zealand) at 100 °C for 4–6 h, while the okara powder waste was drained of water and turned into a solid porous phase. Then, the dried biomass was ground into small particles to achieve uniform particles of 0.2–0.45 mm. Ethanol (C2H5OH 99%), KOH, and melamine (C3H6N6) were purchased from Xilong Chemical Inc. (China). Potato peels, shrimp shells, and coffee waste were collected from household sources, while rice husks and rice straw were collected from rice fields in Hanoi municipal areas. All of these biomass sources (shrimp shells, coffee waste, and rice straw) were washed and then dried in sunlight and in an oven (100 °C) until completely dry before they were ground into particle sizes of 0.2–0.45 mm and subjected to pyrolysis or hydrothermal carbonization processes. The shrimp shells were washed and dried in an oven (100 °C), while the coffee waste and rice straw were dried in an oven and ground into particle sizes of 0.2–0.45 mm before they were subjected to pyrolysis or HTC processes.
To achieve reliable results, several samples were replicated during the experimental steps. Three replicates were performed for pyrolysis experiments using sample OPW3, while two replicates were performed for samples OPW5 and OPW10.

2.1. Preparation of Activated Carbon (AC) from Okara Powder Waste

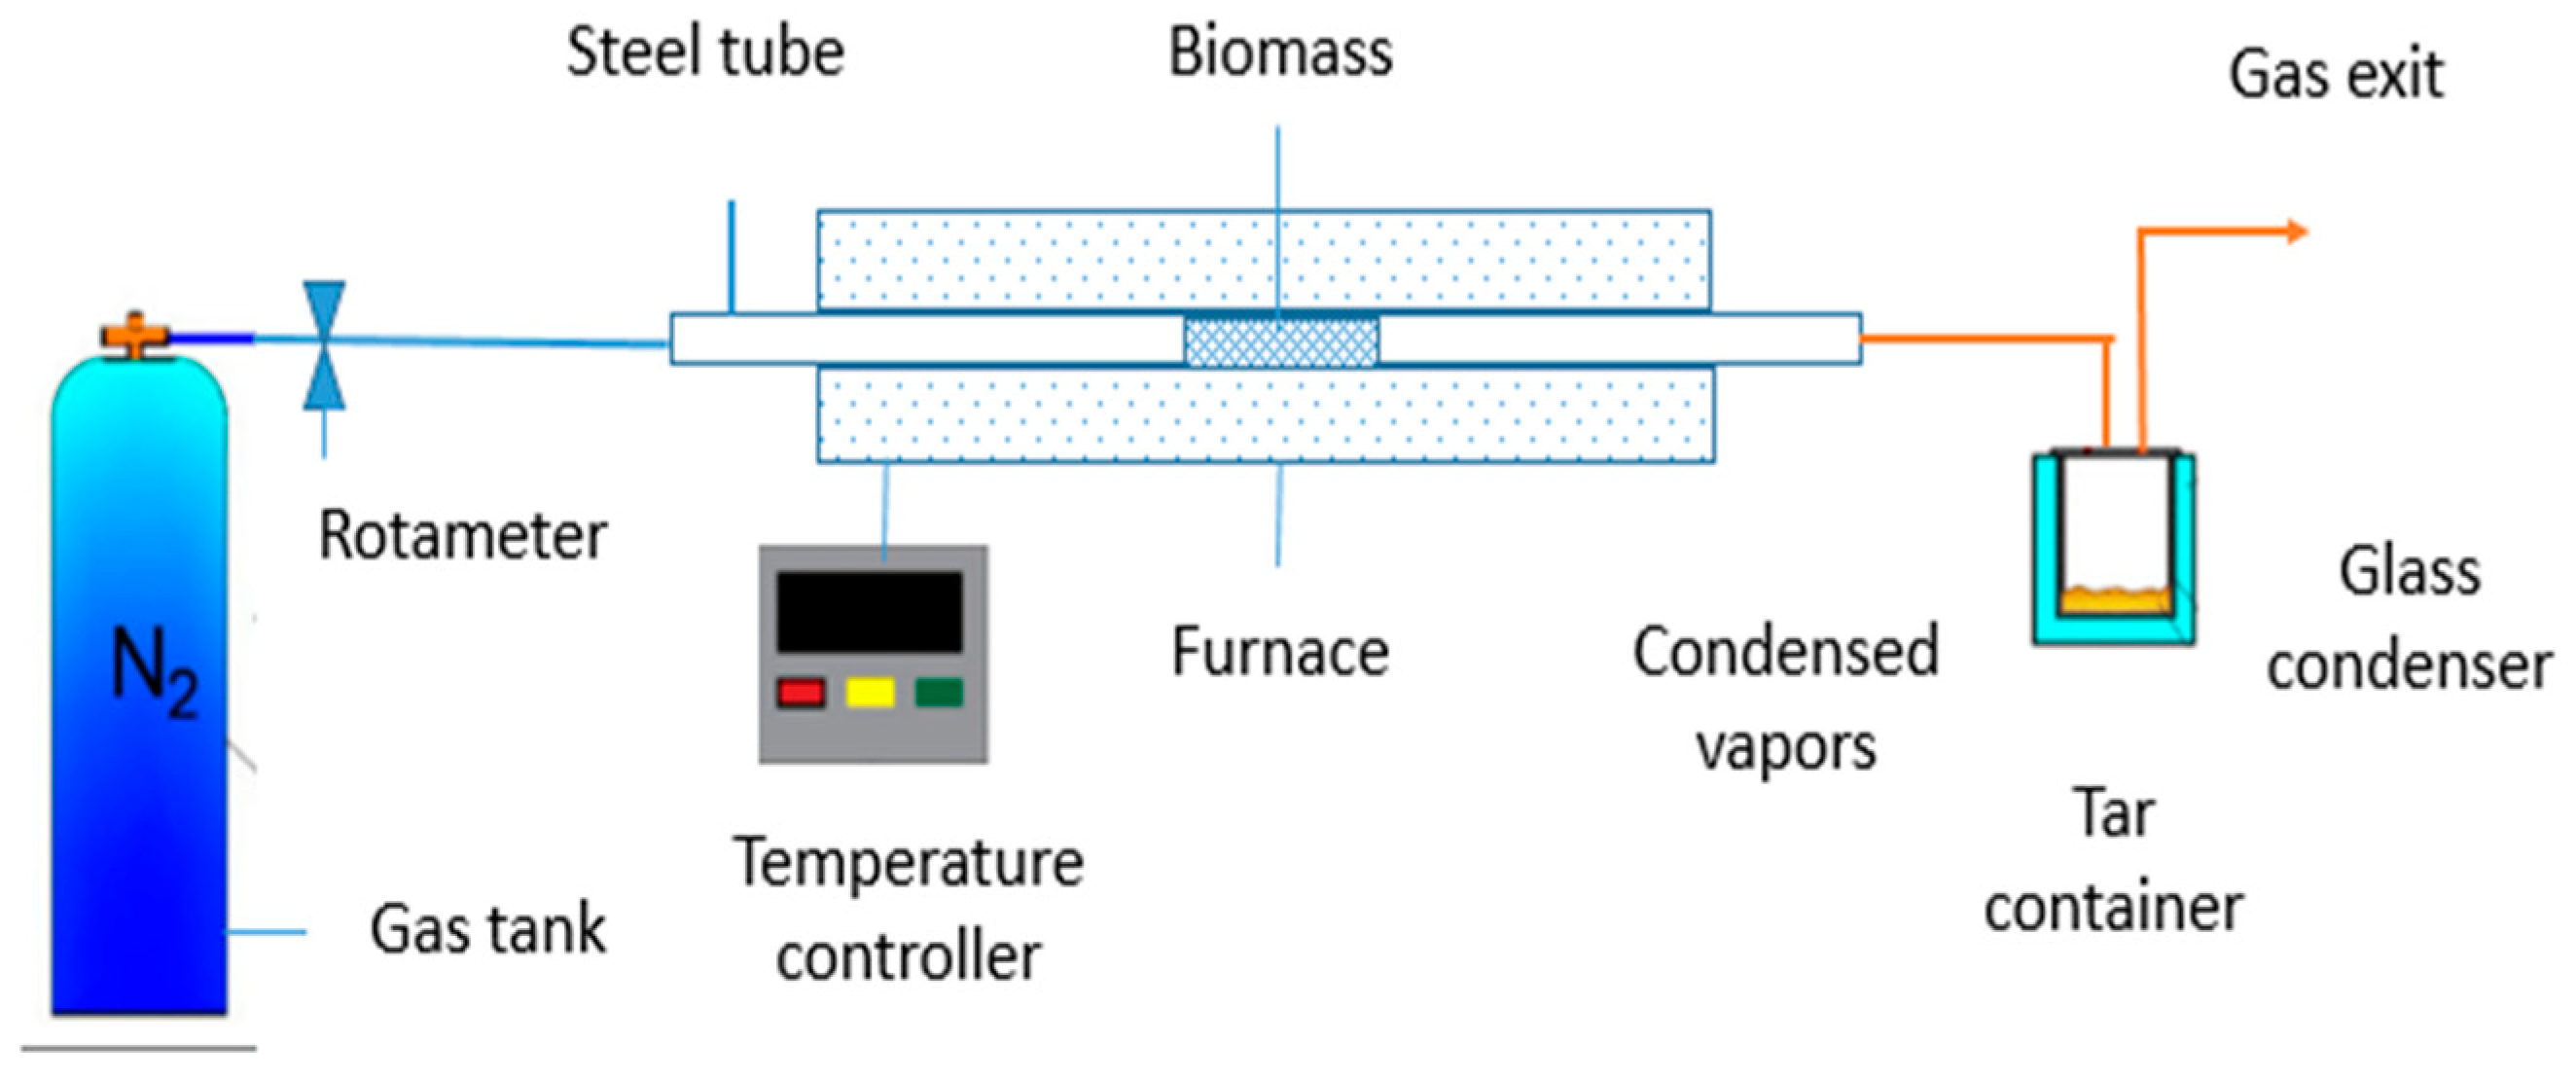
2.1.1. Pyrolysis Experimental Setup

In the experiments, several samples were coded OPWi, where i is the experiment conducted.
The pyrolysis experiments were carried out in a tubular furnace, as shown in Figure 1 and Figure 2. In this research, we used N2 as an inert gas during the pyrolysis experiments. A horizontal furnace (Lenton Thermal, Hope Valley, United Kingdom) was used. The okara powder waste was injected into a tube of the furnace where a N2 flow was supplied. In our pyrolysis experiment, dried biomass or okara was supplied, and a high temperature of 600 °C was used to carbonize a significant amount of feedstock; the heating rate was maintained at 3 °C/min, and the residence time was maintained for 1 h.
The final products (i.e., biochar) were approximately the same in the two designs in terms of outside color, structure, burn-off, and conversion ratio, since pyrolysis conditions were maintained during the pyrolysis experiments. The vertical pyrolysis design was used for samples OPW1–OPW6 (code explanations are given in Table 1), while the horizontal pyrolysis design was used for the rest of the samples (OPW7–OPW10) (code explanations are given in Table 1; see the Section 3 below).

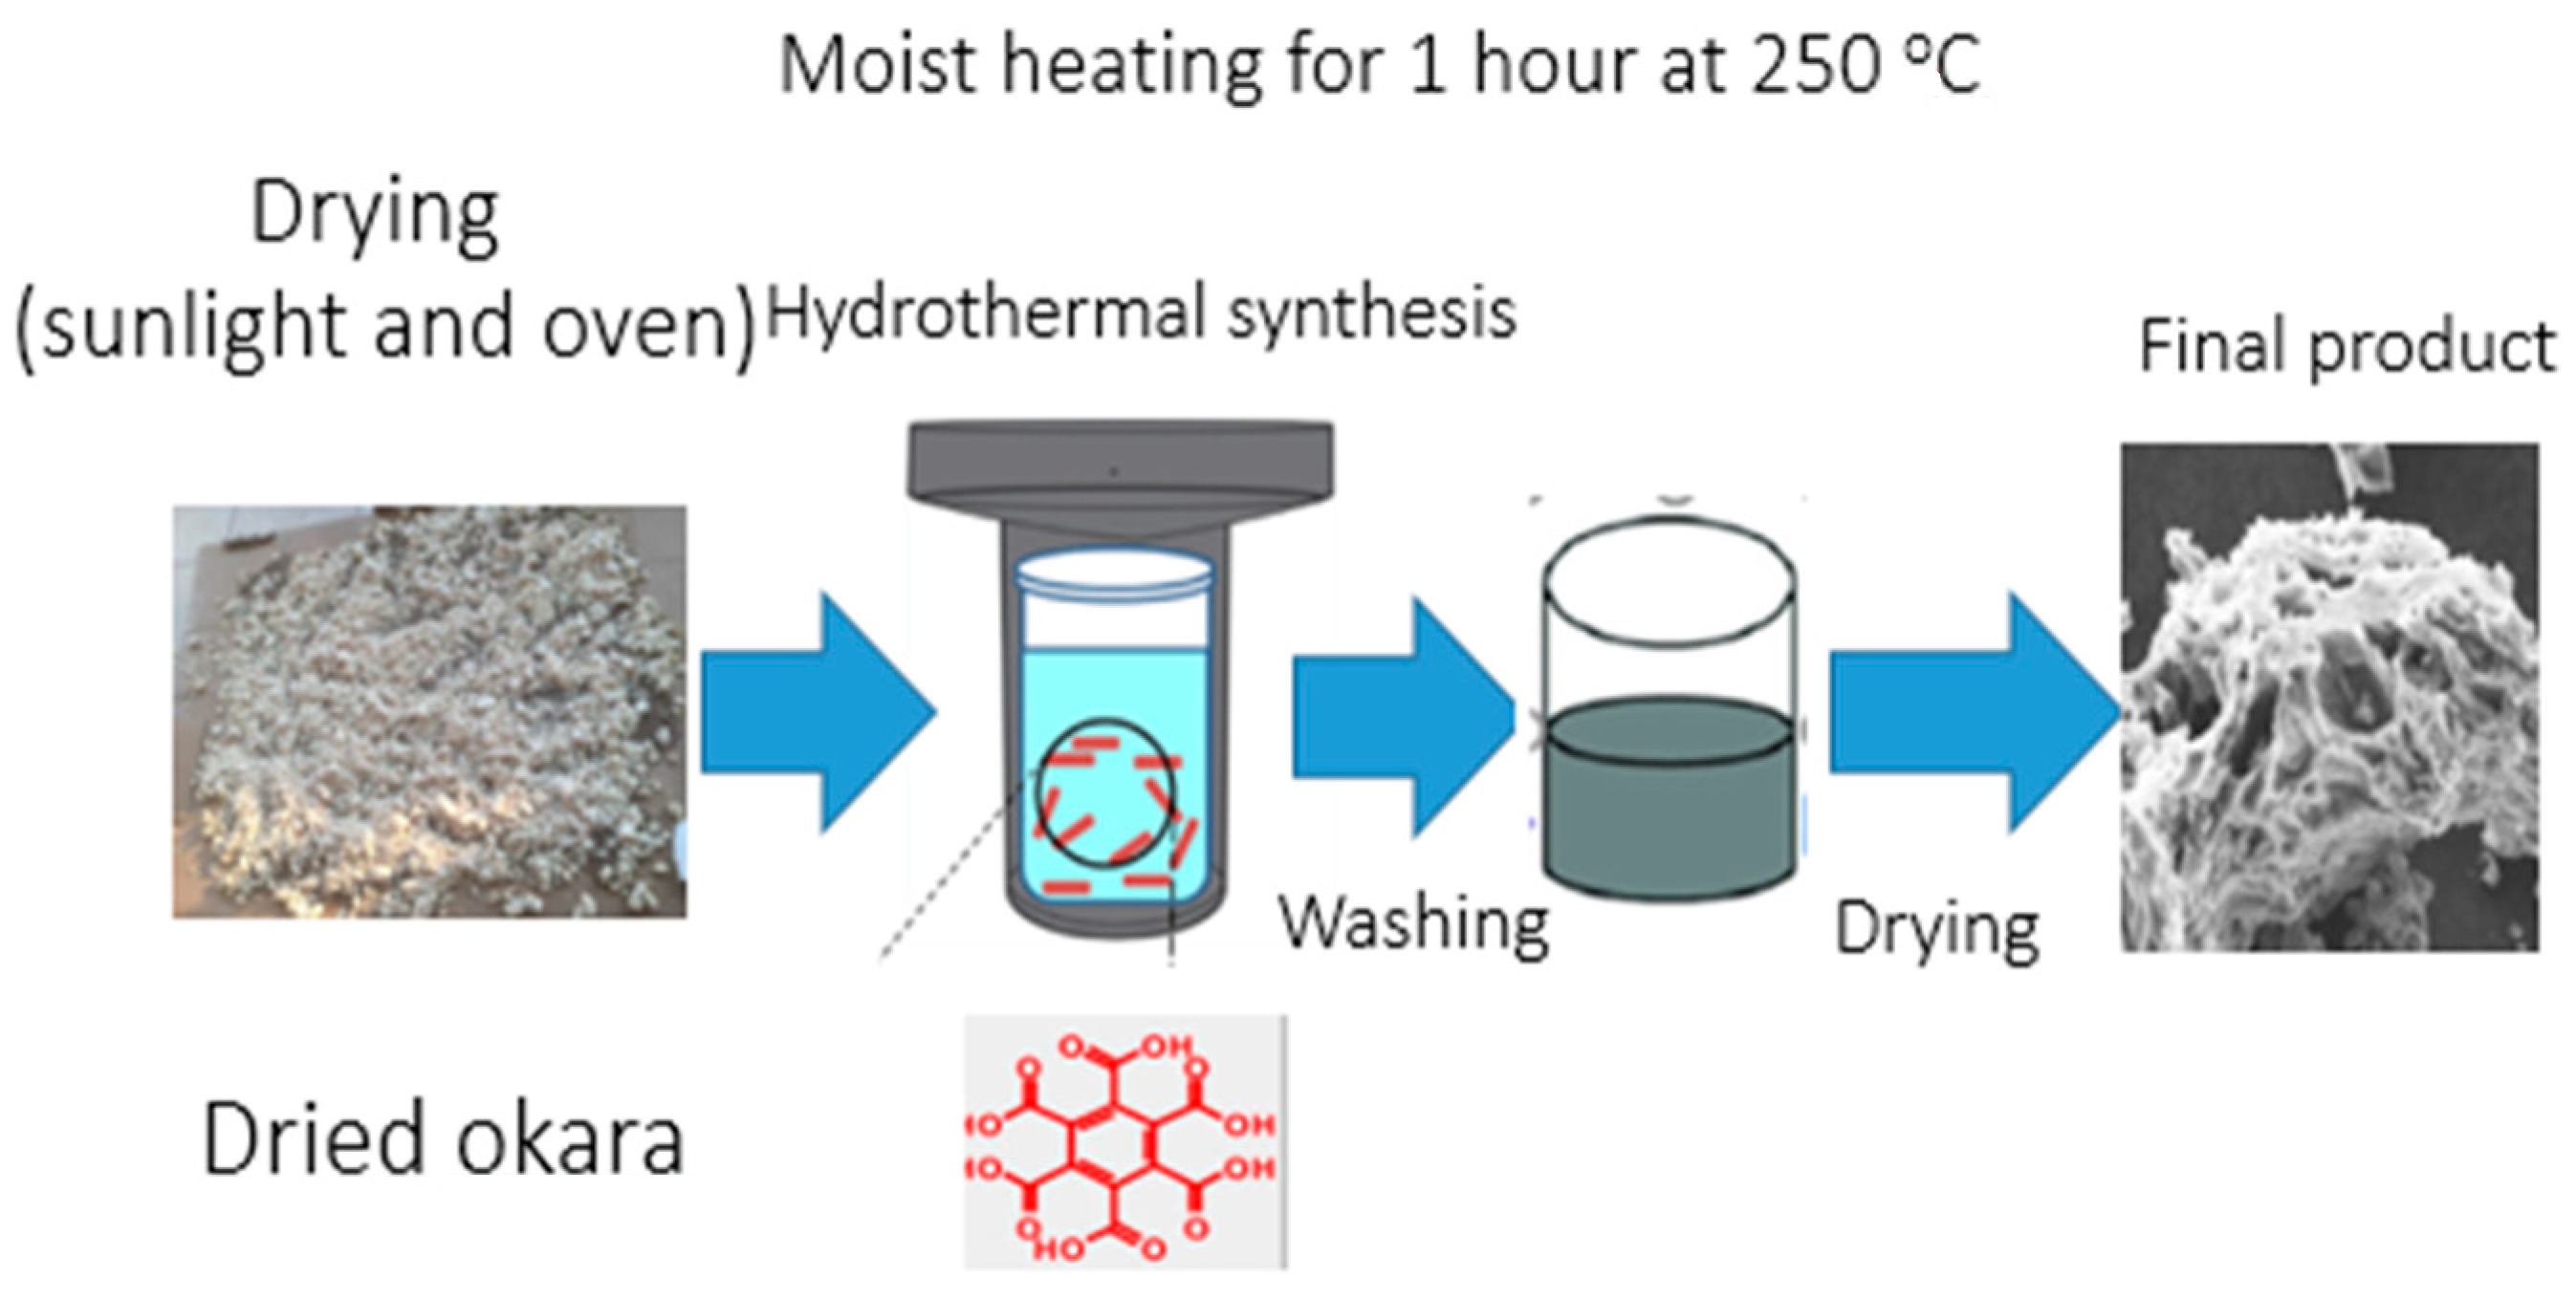
2.1.2. Preparation of Activated Carbon via the Hydrothermal Carbonization Method

In this study, HTC was performed at 200 °C, during which biomass feedstocks were submerged in water and heated in a closed system (a steel autoclave) under pressure (2–6 MPa) for 240 min. An amount of 12.8 g of okara powder waste and 40 mL of water (equivalent to two-thirds of the volume of a medium-sized stainless-steel autoclave) was placed in a stainless-steel autoclave. Then this autoclave was heated up to 200 °C, and this temperature was kept for 4 h; then, the stainless-steel autoclave was left to cool down overnight. The next day, the sample was filtered with filter paper, and then the obtained product or hydrochar was washed with distilled water to an about neutral pH. The HTC method used to prepare the hydrochar is illustrated in Figure 3.

2.1.3. Activation of Biochar/Hydrochar

For some samples (e.g., sample OPW6), the activated carbons were prepared from the bichar/hydrochar of dried okara through physiochemical activation processes. The biochar, obtained from a 600 °C pyrolysis temperature experiment, or hydrochar, produced by 200 °C hydrothermal treatment, was used for further treatment to produce a high-porosity product with less tar impurity [47]. The biochar/hydrochar was mixed with KOH and water with a mass ratio of biochar/KOH/water of 1:4:5. This sample was then kept in a beaker at room temperature for 48 h. After this KOH impregnation step, the mixture was dried in an oven at 100 °C overnight. Then, the dried mixture was again pyrolyzed at 600 °C for 1 h, with the heating rate set at 3 °C/min under a N2 gas flow (99.99% purity) of 1.5 L/min.
After this pyrolysis step, the activated carbons were washed with hot, aqueous HCl to remove excess KOH and impurities until the pH value of the drained liquid was neutral. Finally, the activated carbons were dried in an oven and stored in zipper bags. The sizes of the activated carbons were smaller than 0.25 mm because of the biomass precursor’s size. A list of the synthesized samples is presented in Table 1, above.

2.2. Characterization of the Materials

The porous carbon materials were examined by scanning electron microscopy (SEM) using a JEOL JCM-7000 microscope (Tokyo, Japan). EDS analyses were performed with a 15 kV accelerating voltage. Brunauer–Emmett–Teller (BET) surface area values were measured using a Micromeristics ASAP 2060 device (Norcross, GA, USA). TGA and DSC were performed using NETZSCH (STA 449 F5 Jupiter, Germany) equipment. FTIR spectrum analysis was performed using a Thermal Scientific NICOLET iS50 (Waltham, MA, USA). All absorbance spectra were recorded using the transmittance method in the 4000–400 cm−1 region, with 100 sample scans and a 1.0 cm−1 resolution.

2.3. Calculation of the Biomass Conversion

Two factors that measure the efficiency of AC production and mass loss are burn-off and carbon yield. Burn-off measures the mass lost after activation and is calculated using Equation (1) [48].
b u r n   o f f w t . % = w o w A C w o · 100 % ,
where wo is the initial weight and wAC is the dry weight of resulting activated carbons after activation (the mass of the final activated carbon).
The carbon yield of each stage is determined using Equation (2) [49,50]:
C a r b o n y i e l d w t . % = w C w f · 100 % = m a s s   o f   c a r b o n   m a t e r i a l s   a f t e r   p y r o l y s i s m a s s   o f   o k a r a   p o w d e r   w a s t e   f e e d s t o c k 100 % ,
where wC is the weight of carbon (g) and wf is the weight of the feed (g).

3. Results and Discussion

3.1. Characterizations of the Biomass Materials

3.1.1. EDX Analysis of Various Biomasses

EDX analysis was used to examine the elements of the biomasses. The elemental composition of different biomasses is presented in Table 2. The table shows that the biomasses had 18.91% to 57.35% Carbon weights, 42% to 55% Oxygen weights, and 1.74 to 5.77% K weights. Other elements, such as N, may also have existed in the biomasses but in small amounts beyond the detectable limit (0.1%) of the EDX analysis equipment, which can only penetrate a few nanometers of the surface, and therefore they may not have been detectable here. Research has shown that the lignin percentage in biomass contributes highly to the porous structure and surface areas of biochars. These high-C-content biomasses are positive attributes of biochars in pyrolysis and of hydrochars in HTC experiments [51]. Hence, the coffee waste, potato peels, and okara powder waste, as shown in the table, had the highest C contents (57.35%, 48.12%, and 45.43%, respectively). They are good biomass candidates for producing biochar and hydrochar by pyrolysis or hydrothermal carbonization processes [51]. Moreover, regarding biofuel applications, the most important elements are carbon, hydrogen, and oxygen. With high C and lower oxygen contents, the calorific value of biomass feedstock can be improved [52].
Regarding the okara powder waste, it had a 45.73% carbon mass, a 52.53% oxygen weight, and a 1.74% K mass. It can be seen that okara powder possesses an average carbon mass compared to other biomasses, but it is one of the two biomasses containing K, which may help in the activation process for improving surface area and for the adsorption of CO2. Moreover, okara waste is abundant and has a low economic value (it is only used for planting and fodder), so it may be a good selection for pyrolysis processes.
An EDX image of the okara waste is shown in Figure 4. The elemental composition shows the presence of a high percentage of different oxygenated groups on the surfaces of the raw biomass and the presence of K, whose content was 1.74%. According to the literature, Cl, Ca, Na, Cu, Mg, K, Ni, Si, and P contents in the different biomasses are between 0.09 and 1.21% [31,32].

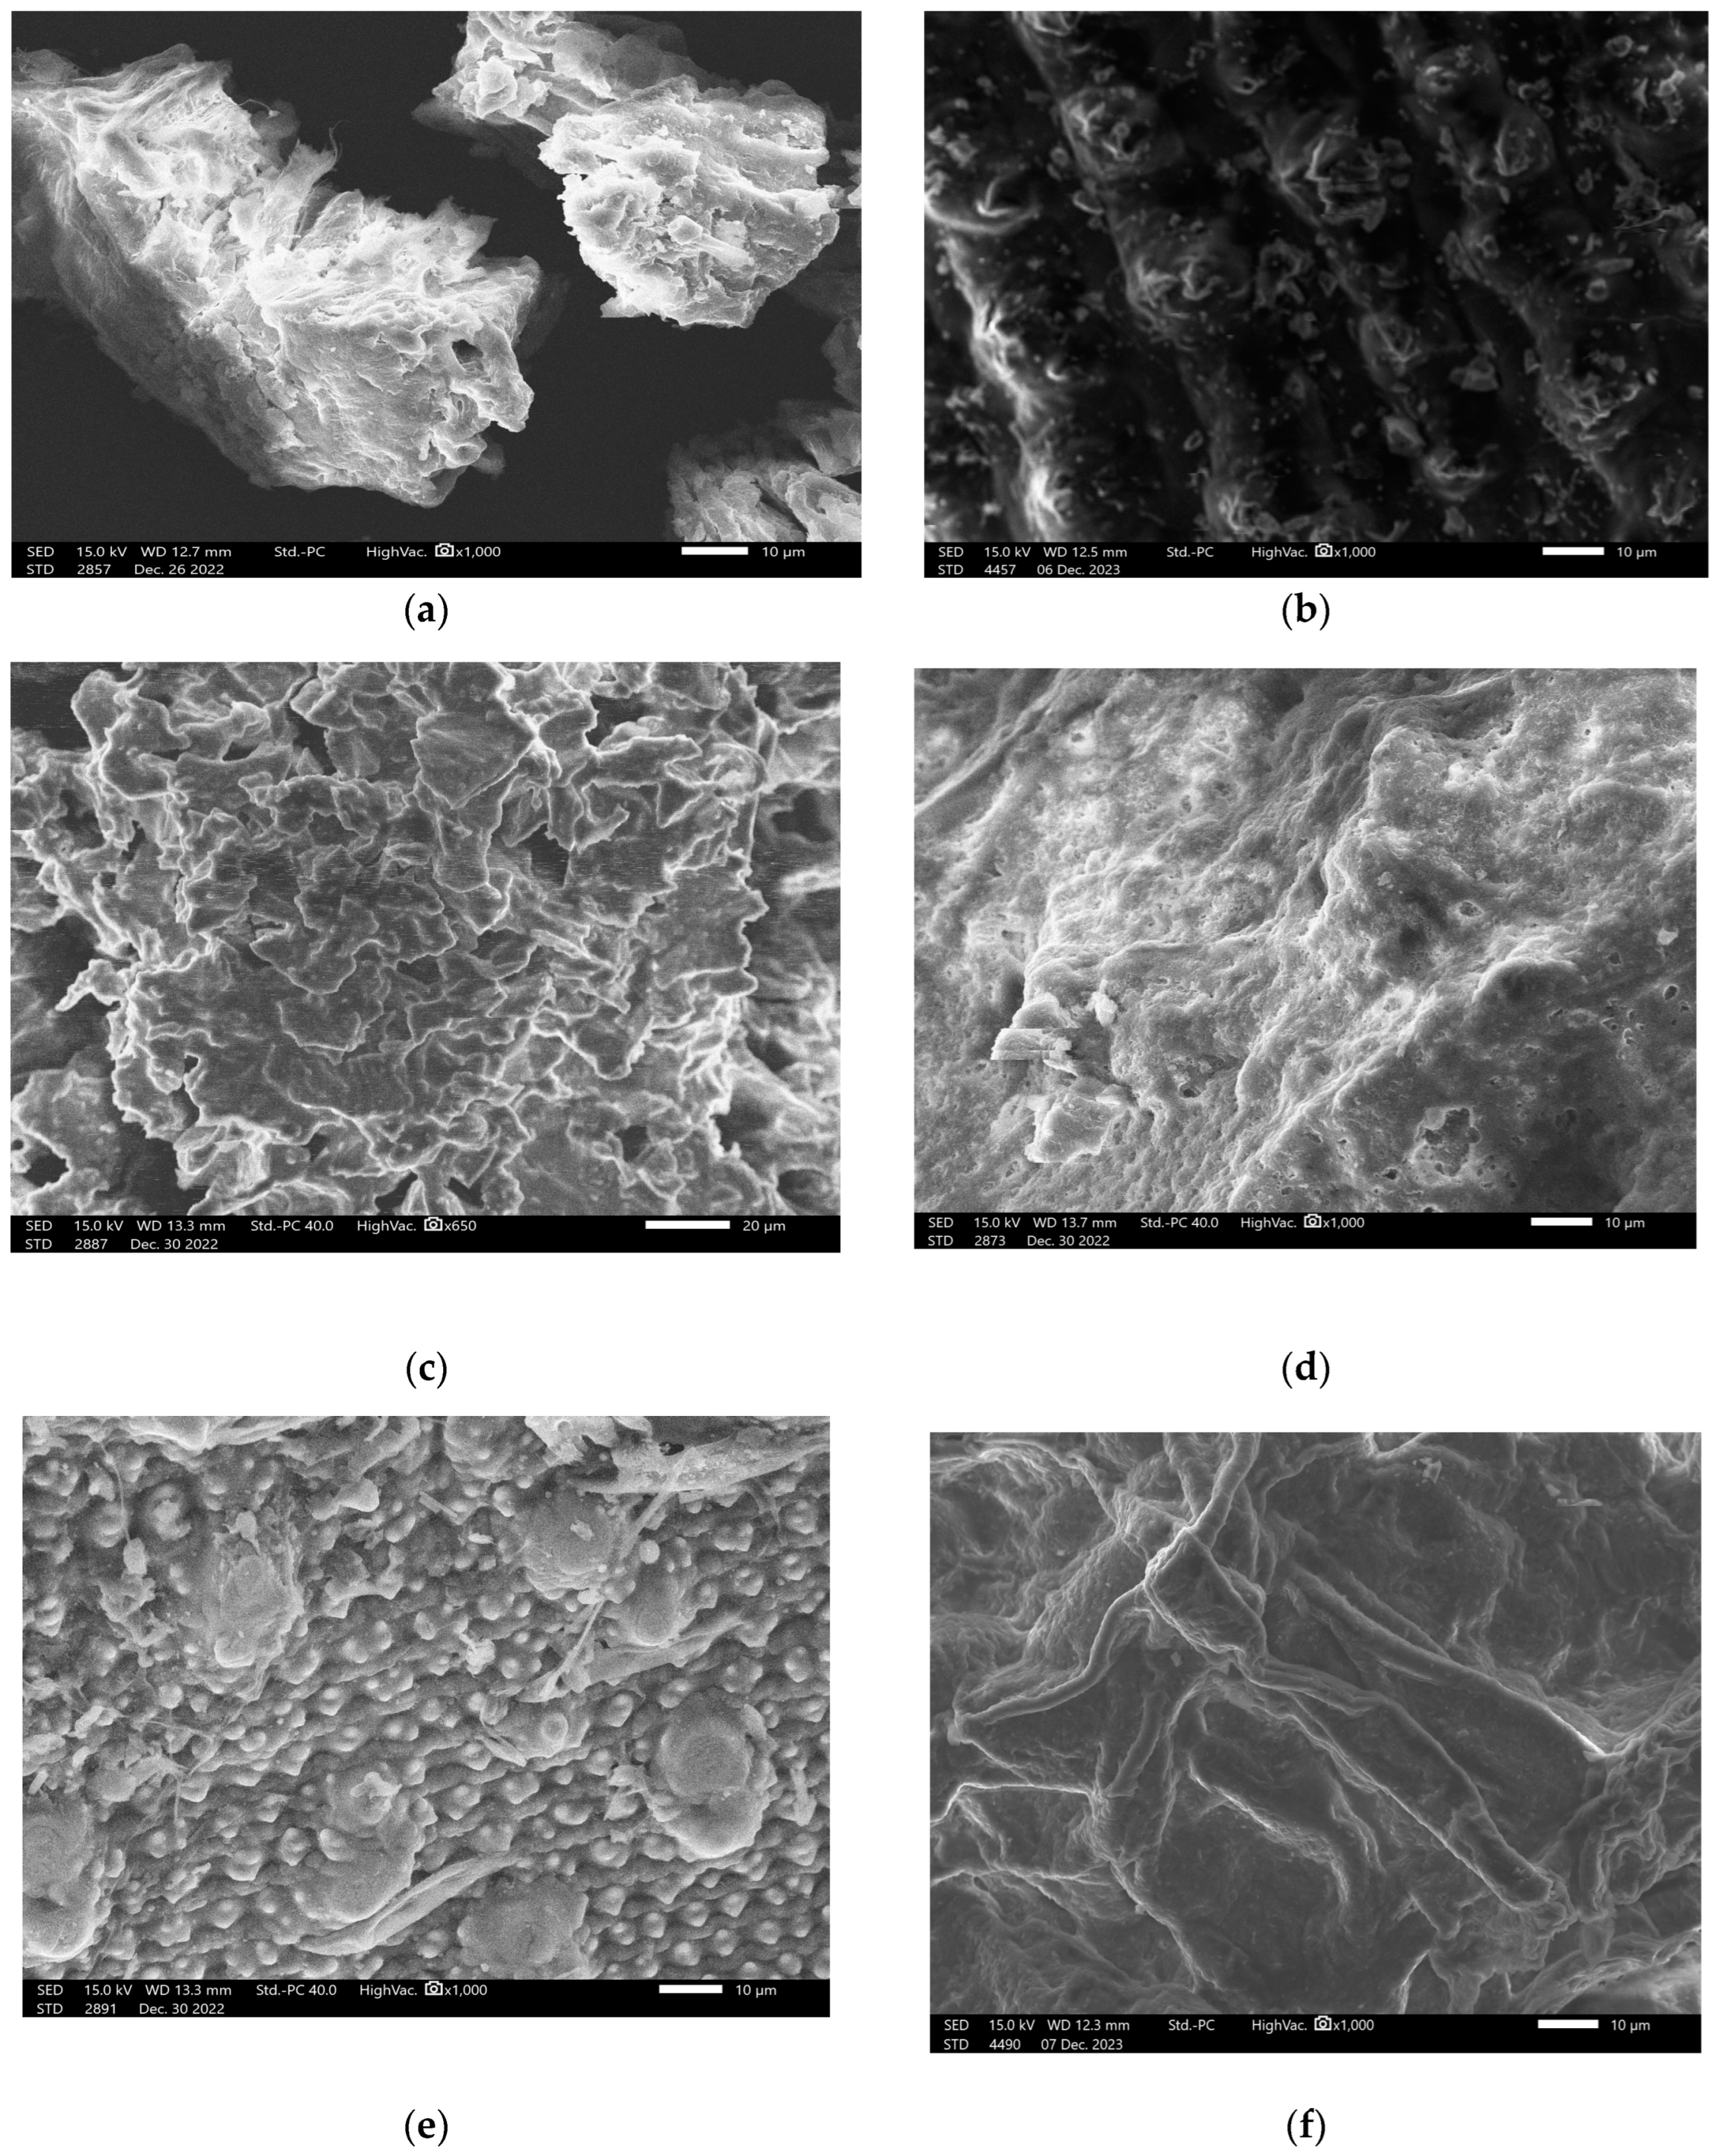
3.1.2. SEM Images of Different Biomasses

SEM analysis was performed to observe the surface morphology as well as the porous structure of the precursor materials. As shown in Figure 5, the surface morphology properties of the biomass precursors were remarkably influenced by the different types of biomass feedstock. The surface morphology of samples (b,c,e) was intricately changed and the pores gradually opened with deep holes, while the surface morphologies of samples (d,f) were relatively flat and simple. Large pores and cavities were also evident in the case of coffee waste.

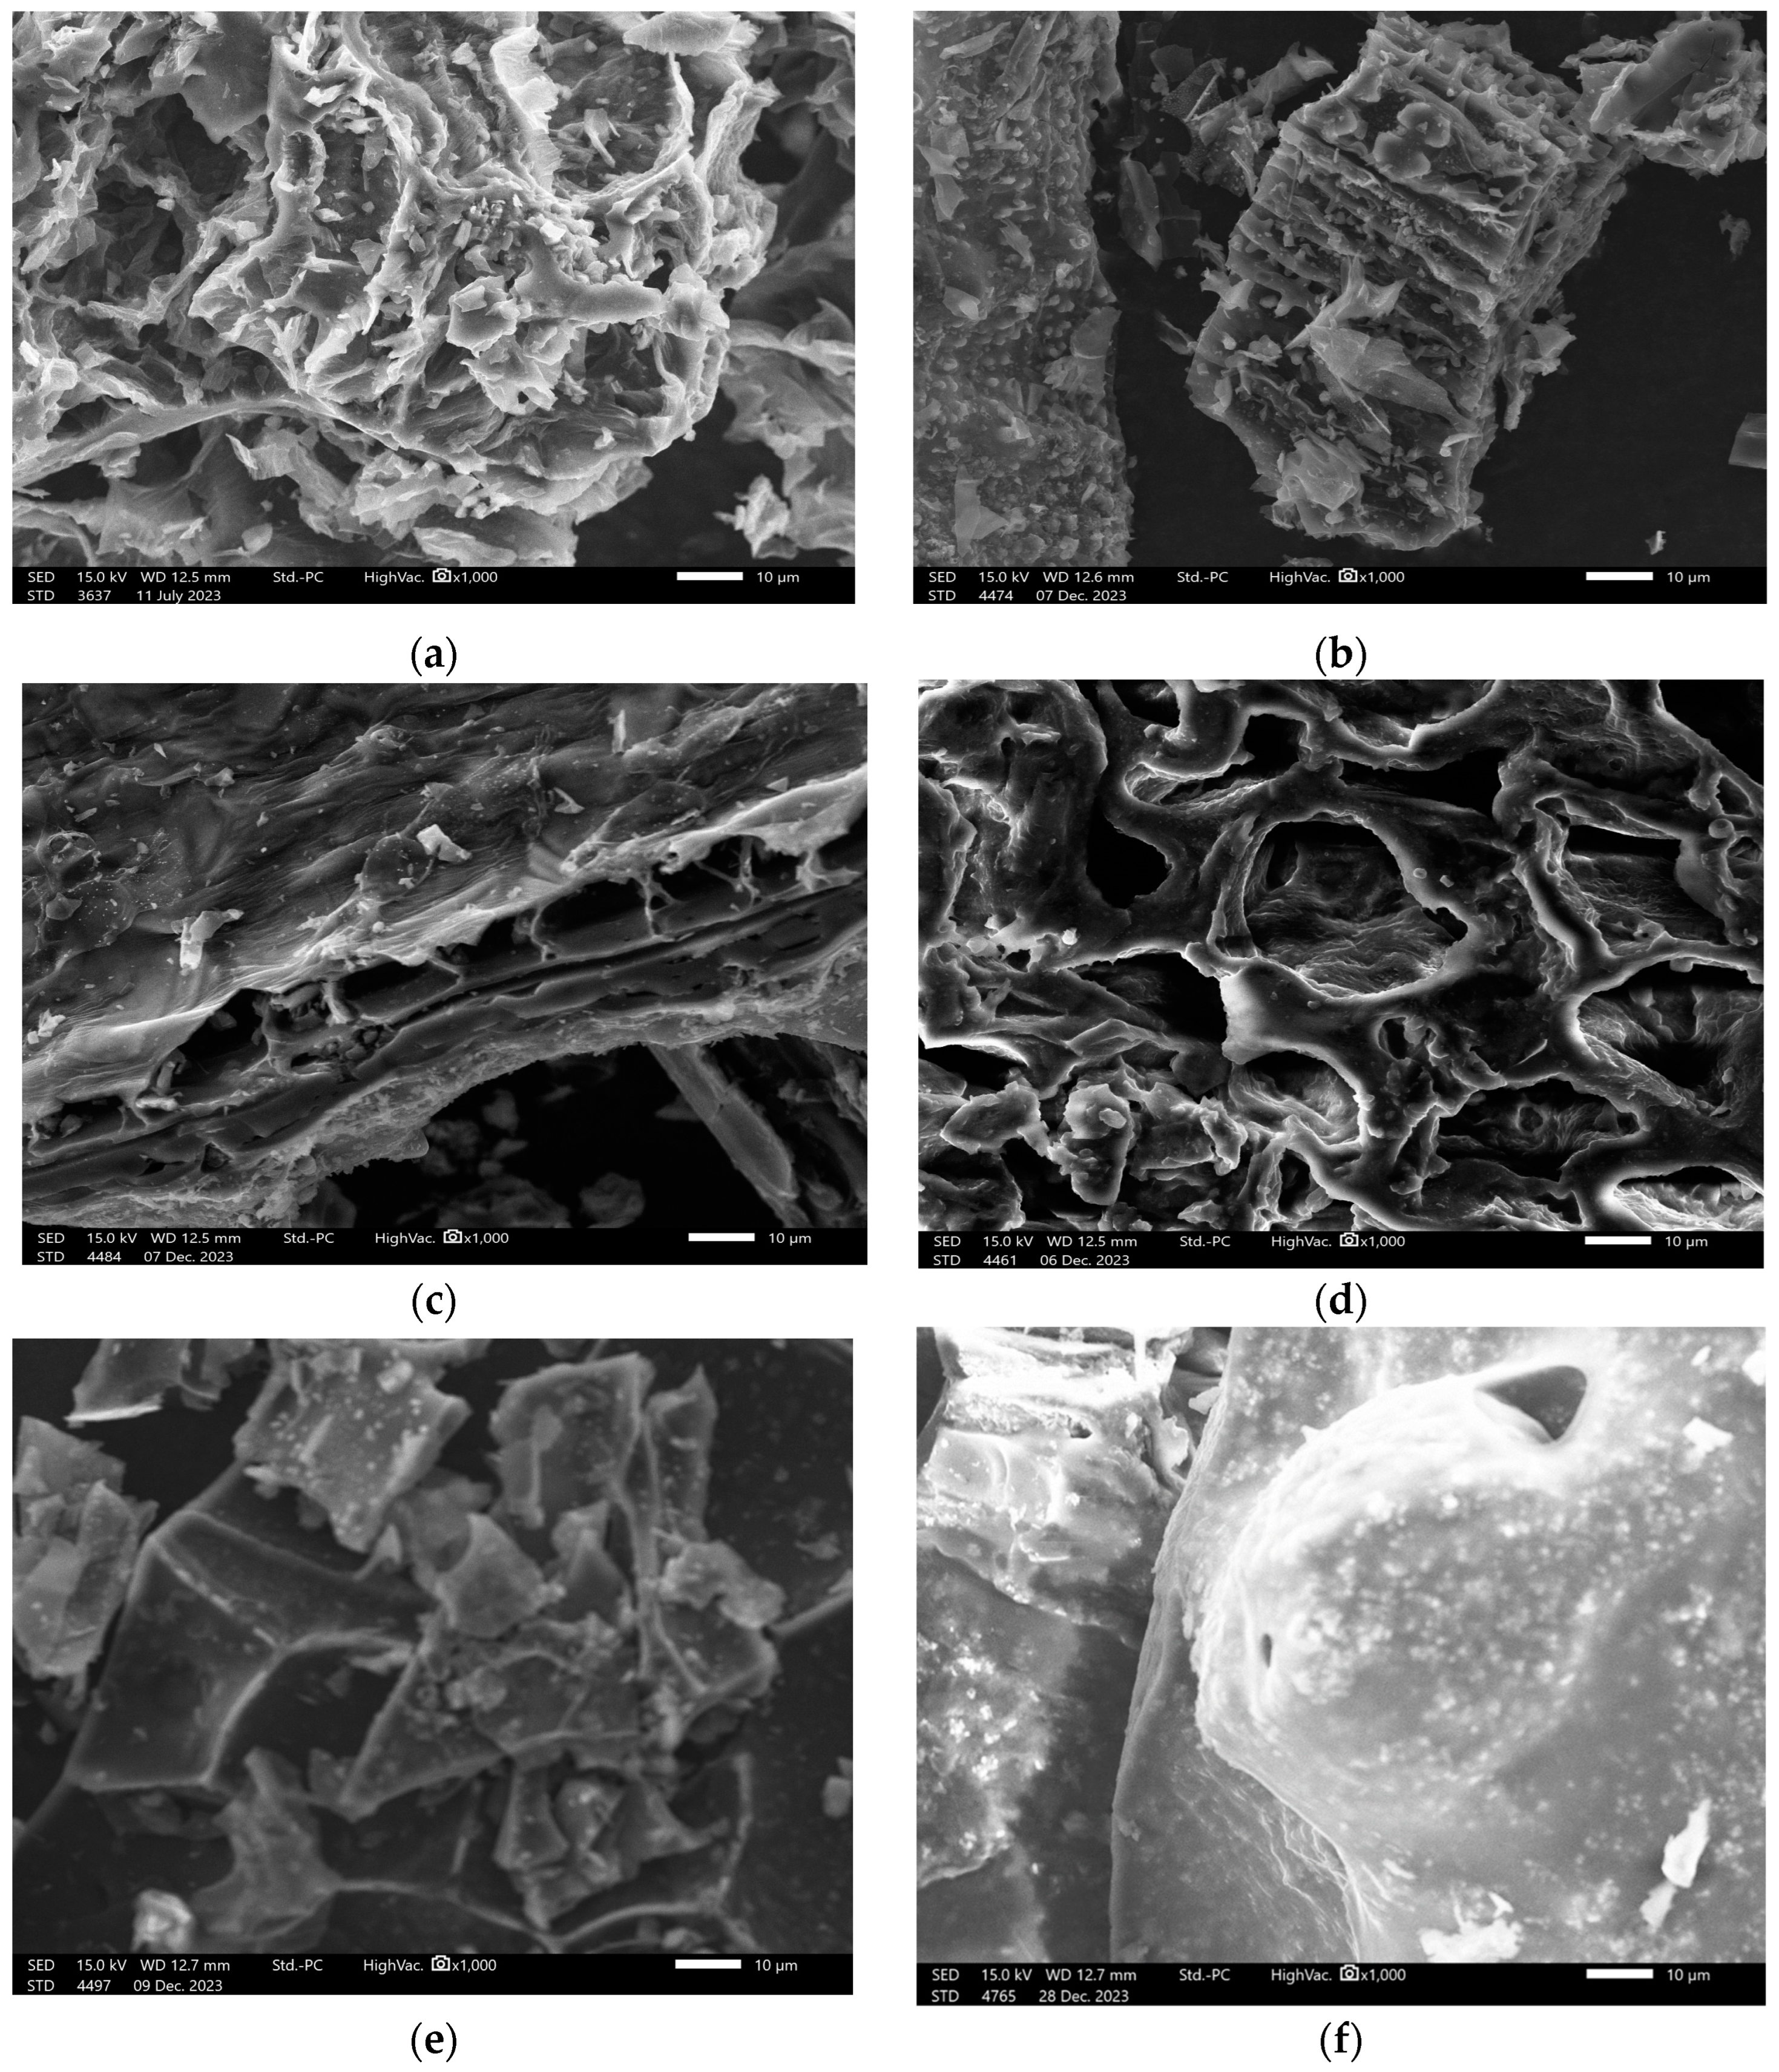
3.1.3. SEM Images of Activated Carbons Synthesized from Different Biomasses

SEM images of activated carbons obtained after pyrolysis experiments are shown in Figure 6.
The SEM images exhibited clear pores and shapes on the biochar surfaces. The okara biochar surface structure looks more porous, rough, and wrinkled, which makes the surface area greater and possibly enhances the adsorption capacity. This is possibly because of the development of internal pores, while tars were removed from inside the biochar by the activating agents via physicochemical activation. Higher porosity is crucial and expected for the latter CO2 uptake processes of our study, and these images demonstrate the porous surface area of the biochar. It could also be observed that this biochar presented as a conglomeration of spheres. The surface topology differed strongly between raw okara powder waste and biochar, which is in good correlation with previous publications [33]. The surfaces of the biochar materials, particularly the okara biochar, were shown to be layered; the increase in the surface areas created perfect surface pores for CO2 diffusion and adsorption inside the structure of the materials in the latter phase of the research.

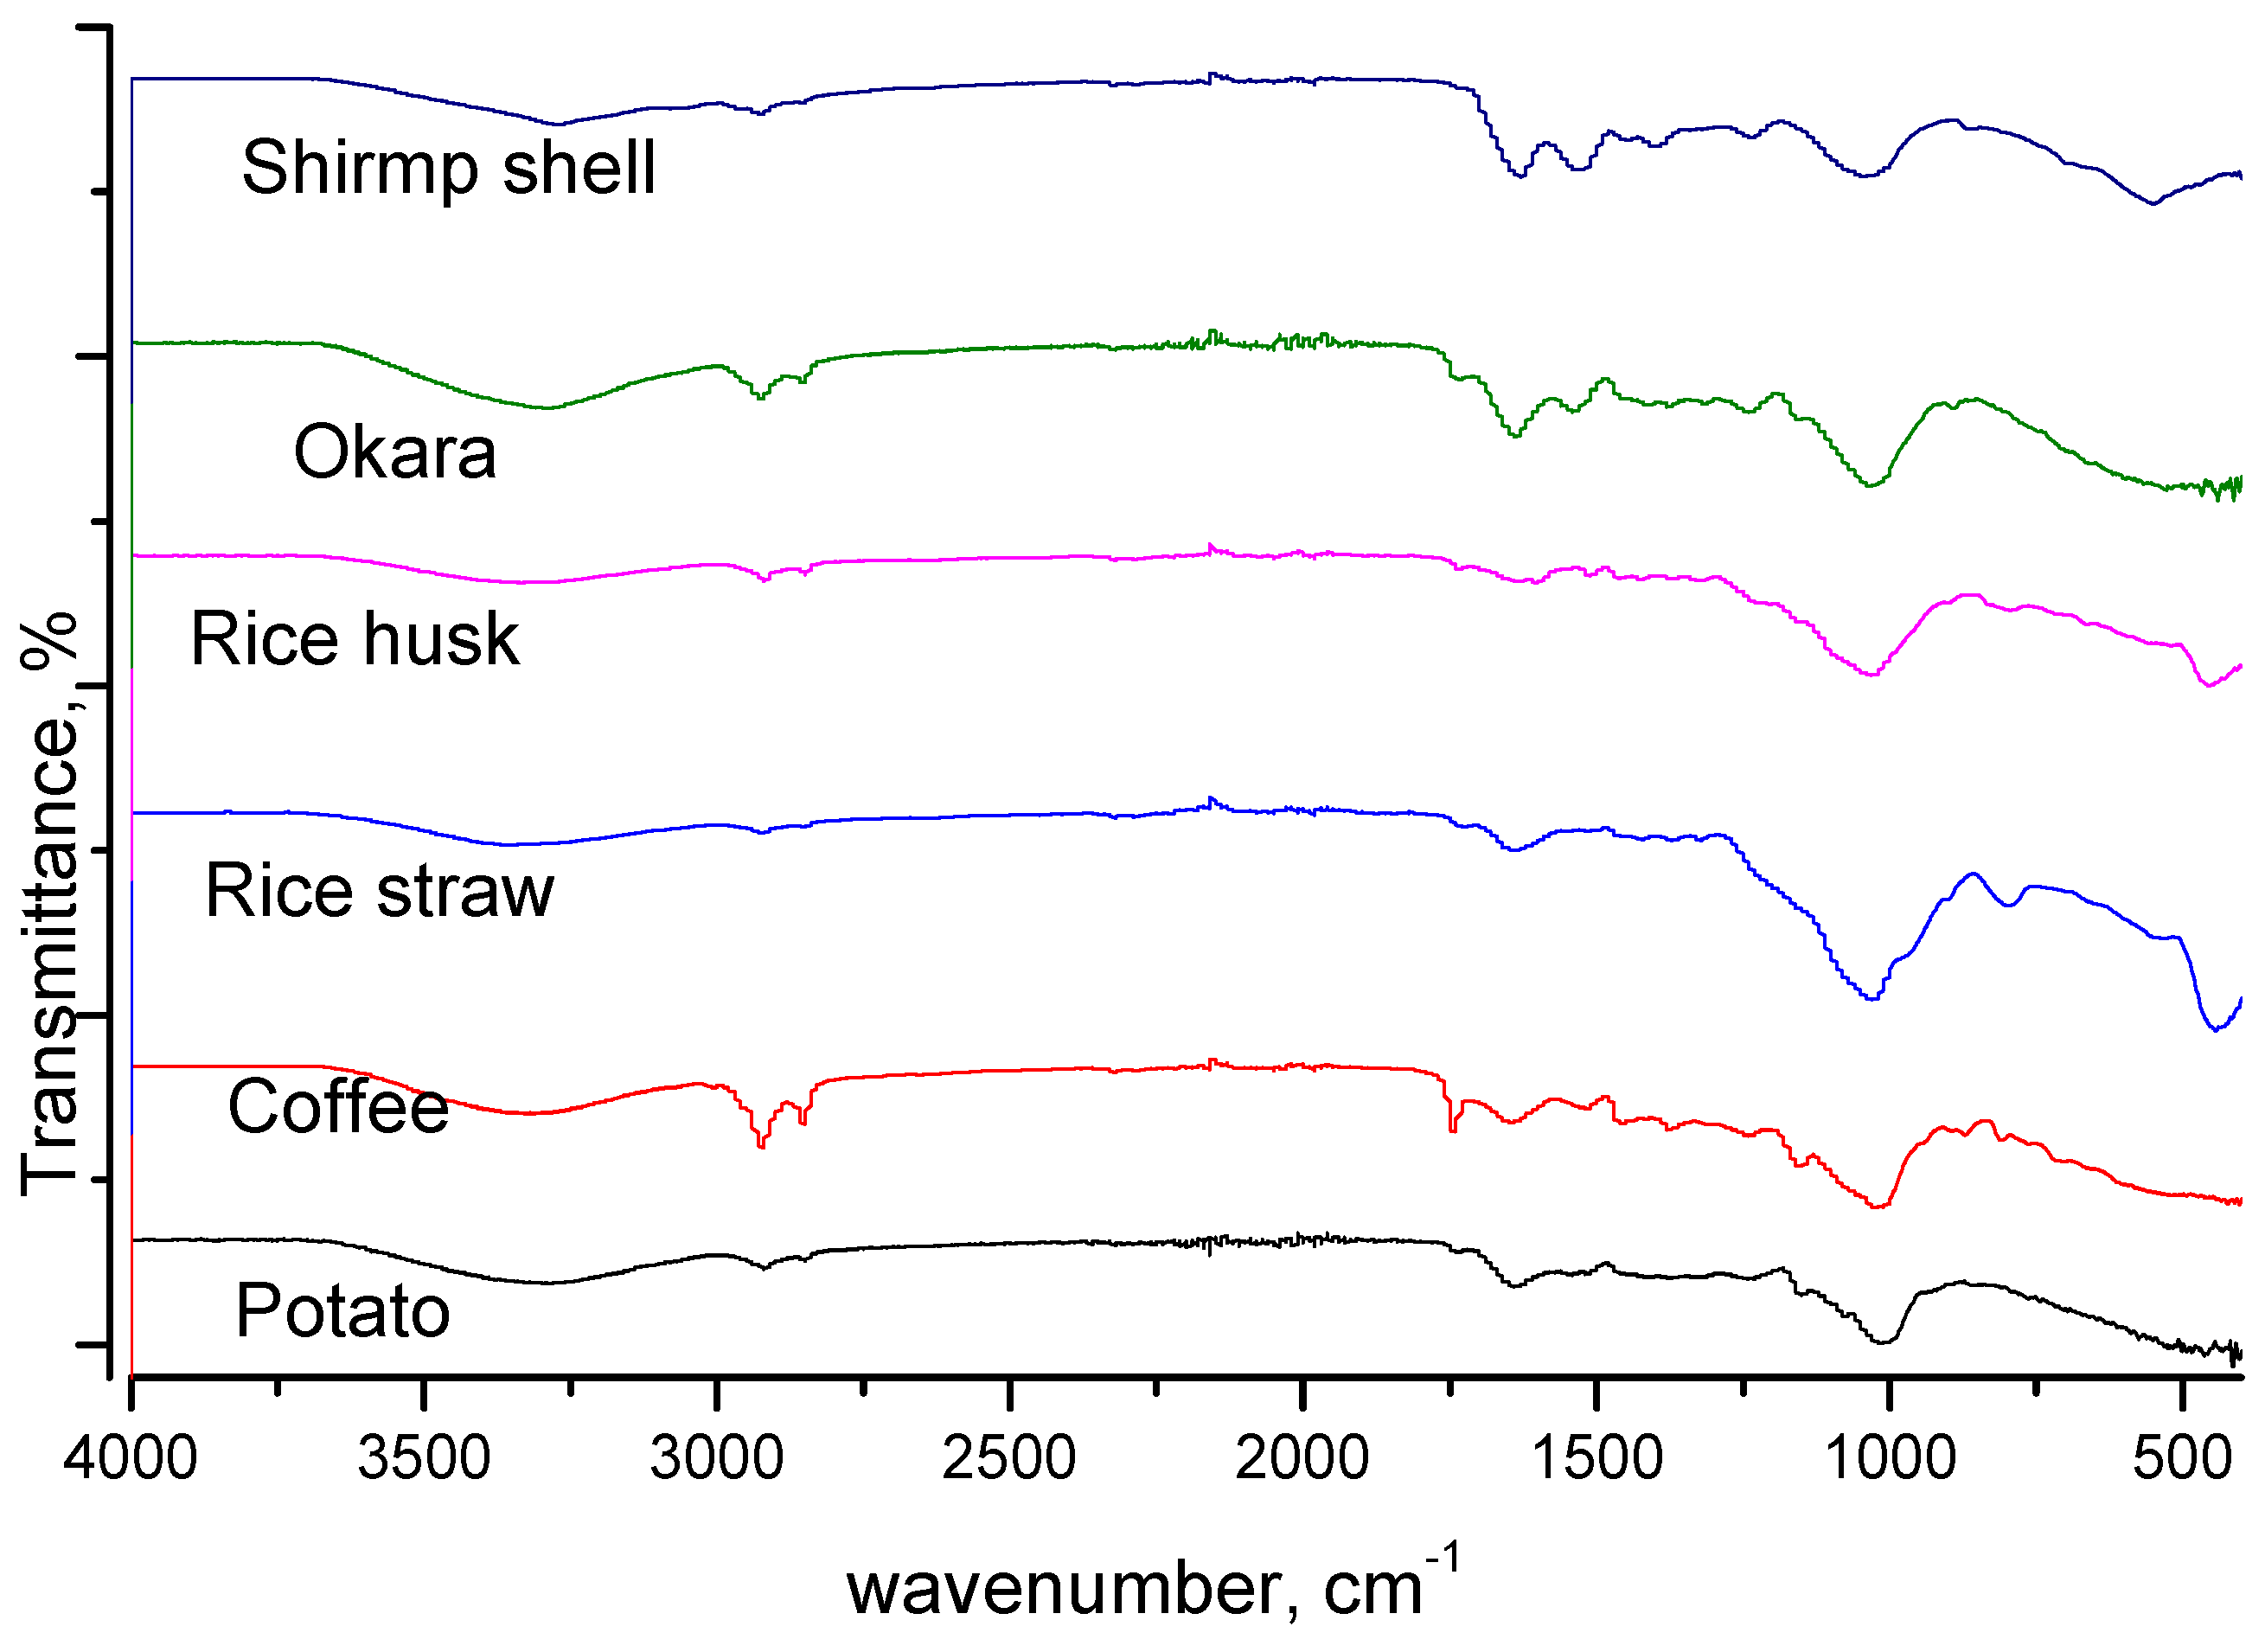
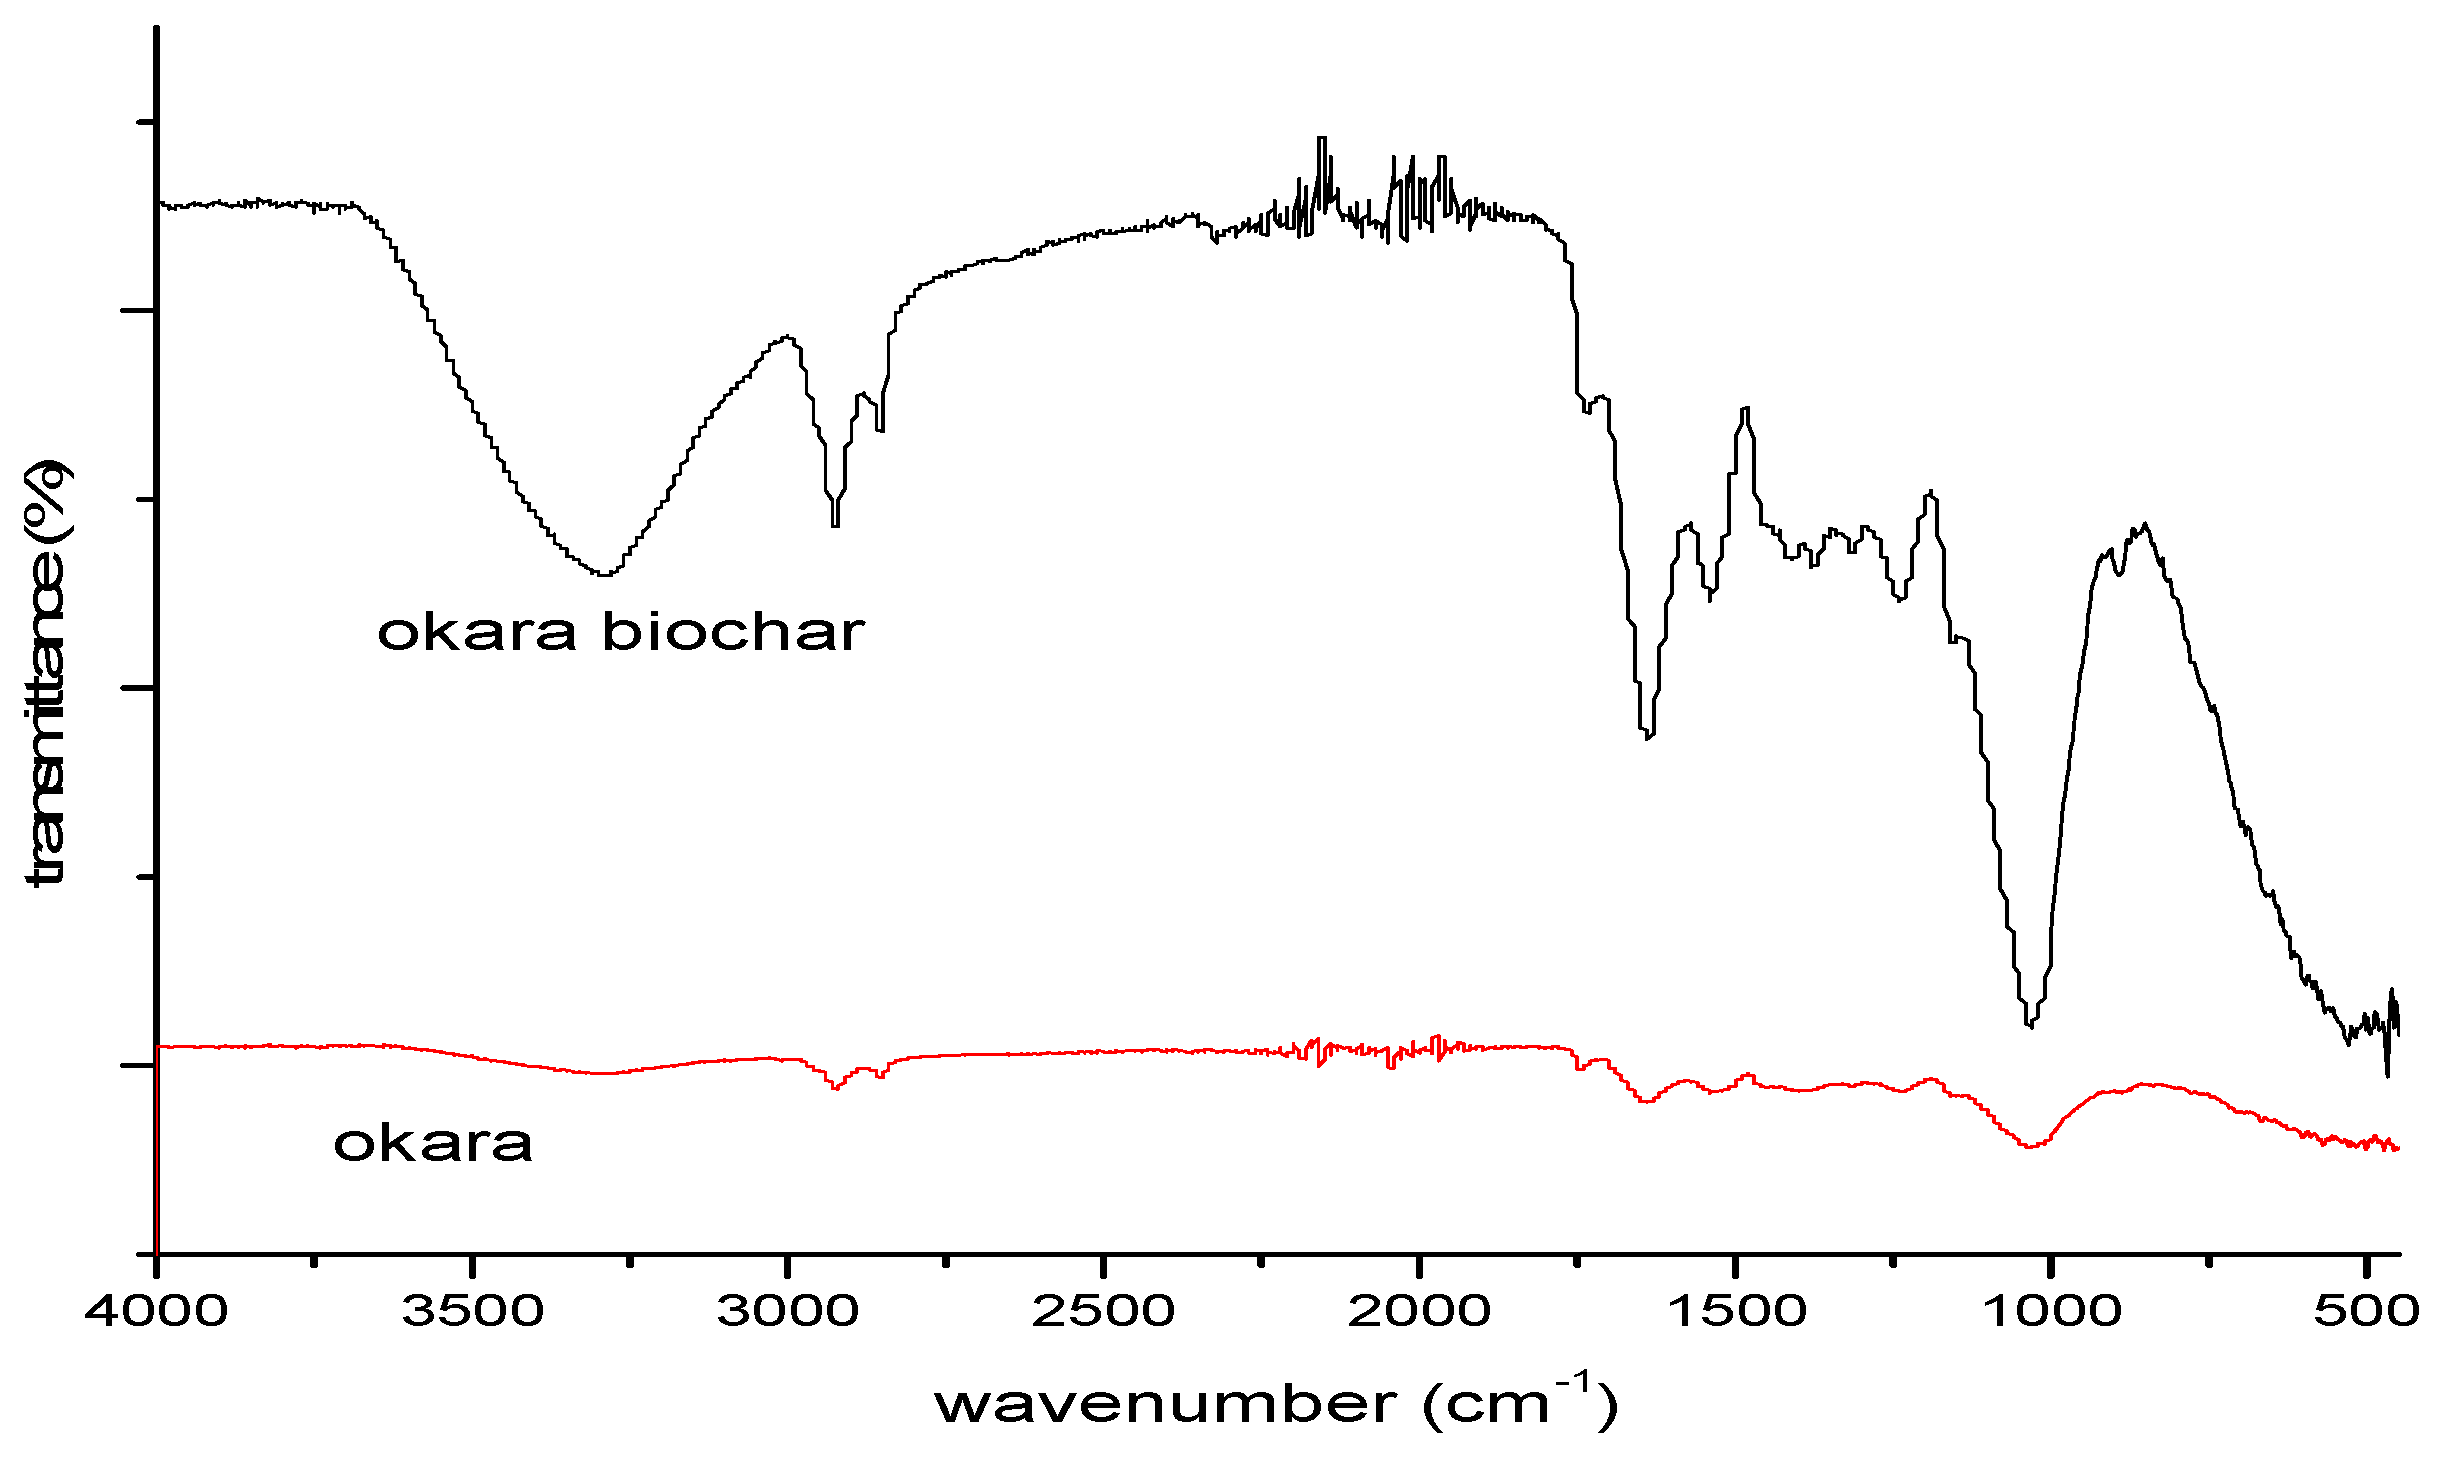
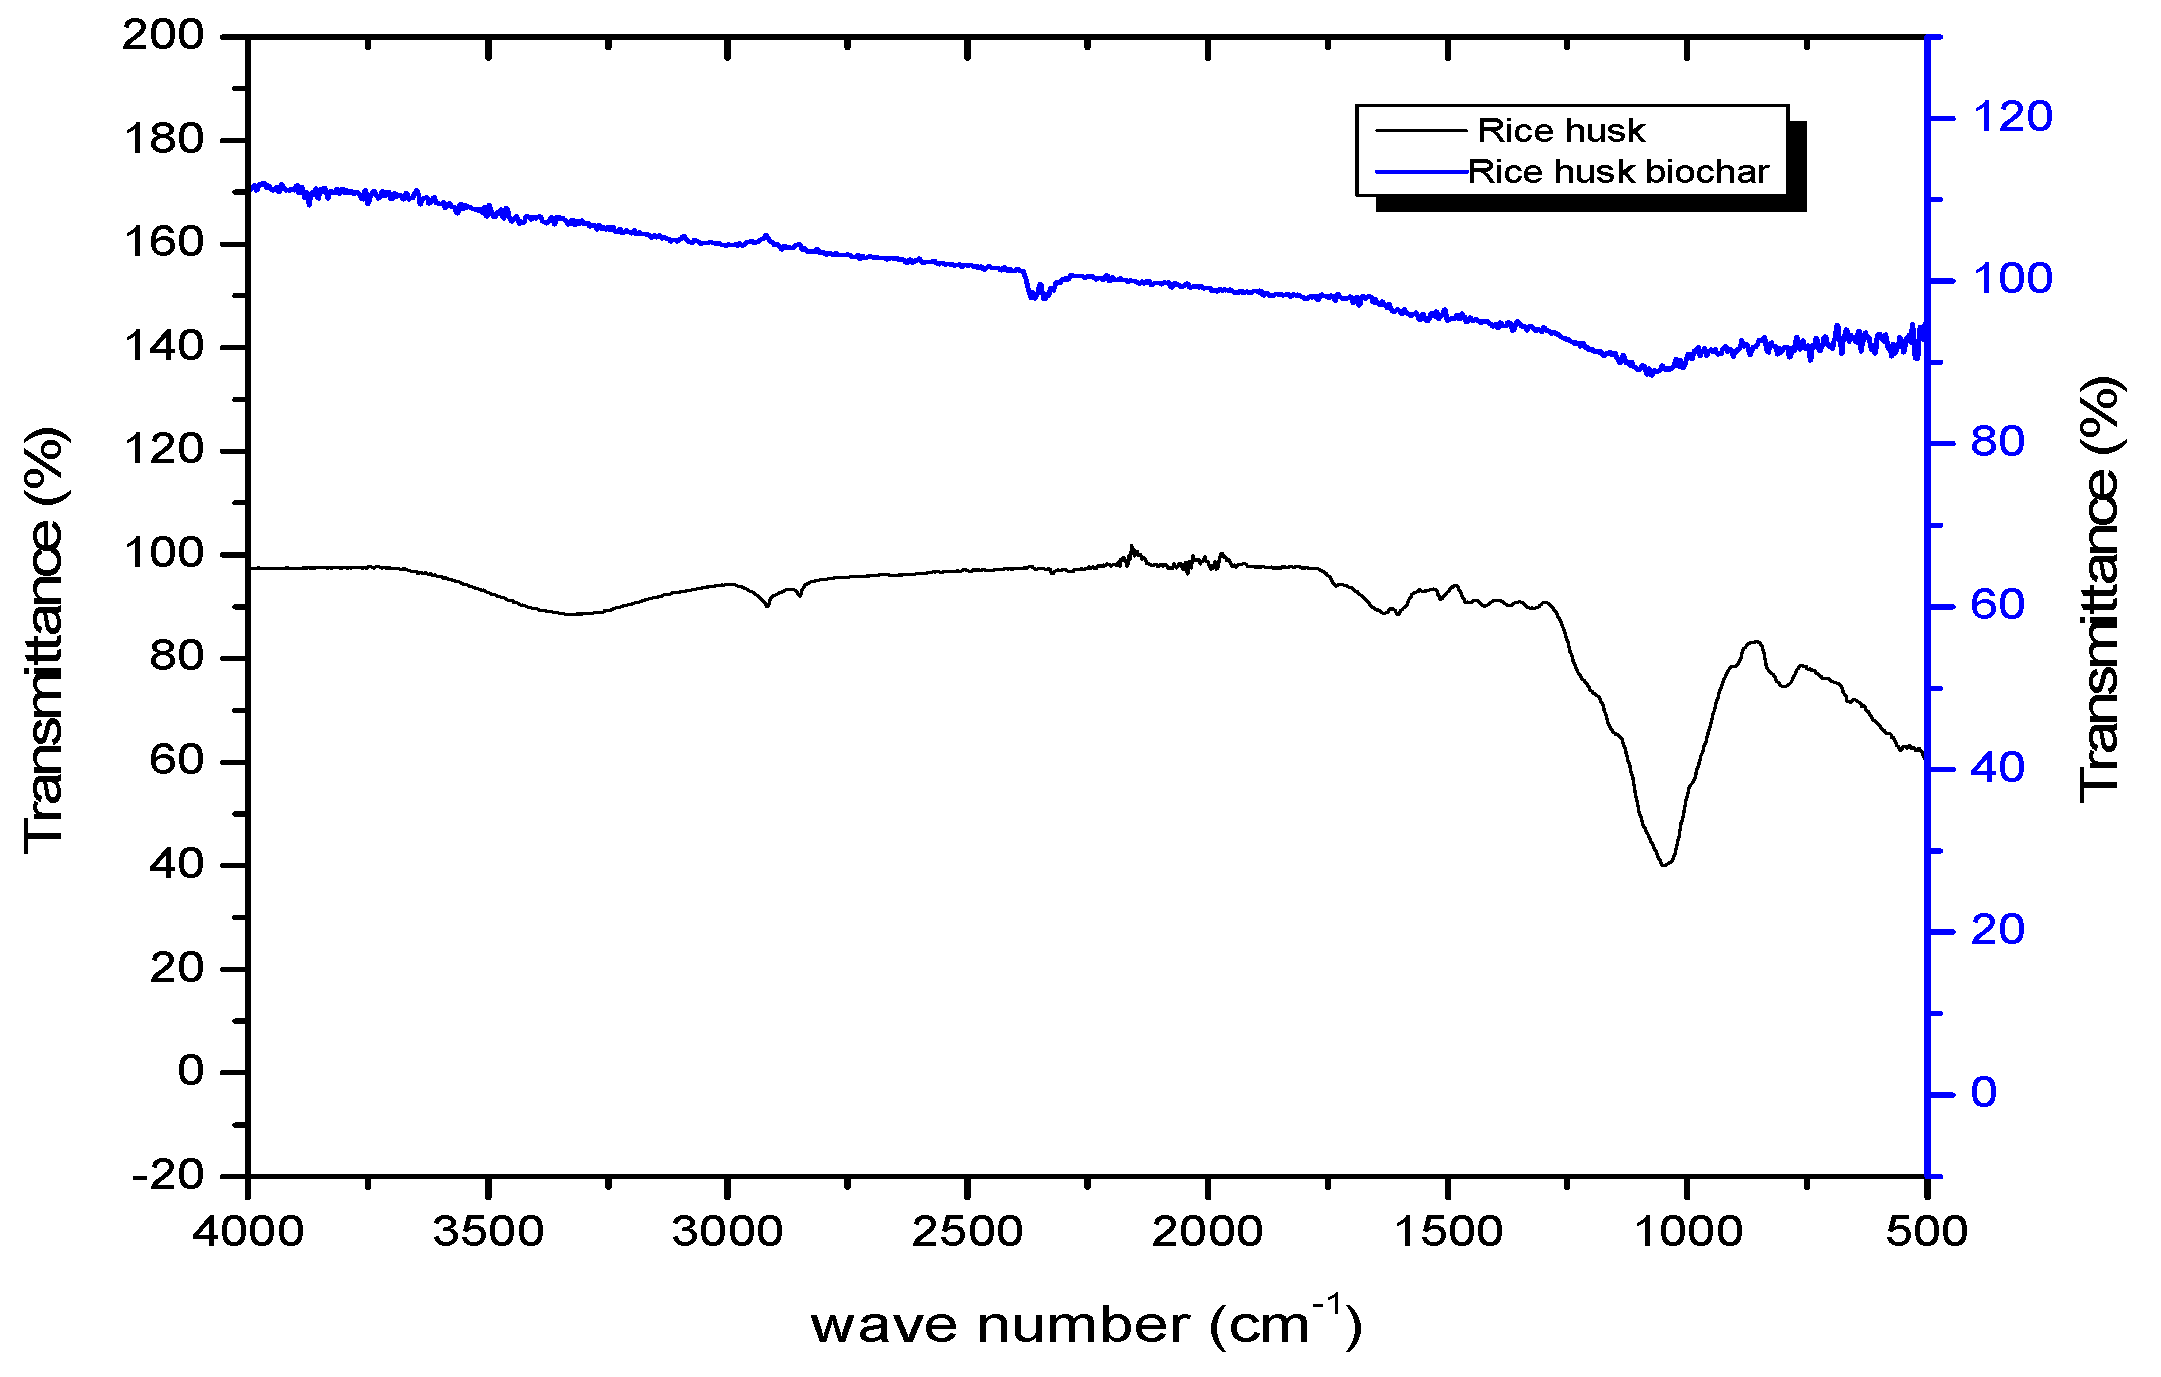
3.1.4. FTIR Analysis

Infrared spectrum analysis was performed to determine the functional groups and complexes present in the biomasses. The FTIR spectra of different raw biomasses are shown in Figure 7.
The absorption bands at 1800–1600 cm−1 (centered at 1567 cm−1) correspond to the stretching vibrations of νC=O and νC=C [53] in the biomass samples. These vibrations around 1800–1600 cm−1 were observed not only for okara but for all the investigated biomass samples. The peaks at 1000 cm−1 (centered at 1000 cm−1) were recorded as νC–O stretching vibrations, which may be attributed to the C-H, R-CO-OR, and R-O-R’ functional groups in the biomass samples [53]. Figure 7 displays different biomasses containing some different vibrations, confirming the chemical structures of the different biomasses. Around the 892 cm−1 band, all six investigated biomass samples showed a broad peak that belongs to the glucosic structure of cellulose and C-H deformation of cellulose.
Figure 7 also shows that, though the six biomass fractions were inherently different, their FTIR features in the 4000–400 cm−1 region were interestingly quite similar visually. This is possibly due to all six analyzed raw natural biomasses being mainly composed of various kinds of carbohydrates, such as cellulose, hemicellulose, lignins, and other organic/inorganic components. The appearance of C-O stretching vibration bands (around 1000 cm−1) was detectable for all biomasses. Furthermore, though these six biomasses exhibited quite similar FTIR spectra comparatively, their positions and intensities were different. For instance, in the high-frequency band around 2900 cm−1, there was an obvious peak related to the stretching vibration of alkyl groups in the coffee and okara samples, which decreased gradually in intensity, while no peak or very small peaks appeared in the samples of rice straw, rice husks, shrimp shells, and potato peels. In the region around 1000 cm−1, the intensity of rice straw seems to be stronger than that of the other investigated biomasses.
Also, in Figure 7, around 1500 cm−1, there are several clear peaks in the spectra of shrimp shells, okara, and coffee, while, around this band, no peak appears in the spectrum of rice straw. In the range of 1600 cm−1 to 1100 cm−1, several small peaks that occur in the spectra of shrimp shells, okara, and coffee were associated with the bending and stretching of C-H in these samples, while, in this range, only weak peaks were shown in rice husk, rice straw, and potato peel samples.
Figure 8 illustrates the Fourier transform infrared spectra of okara biomass and okara biochar. The spectra of both samples were recorded using the transmittance method in the 4000–500 cm−1 region, and, visually, the FTIR spectra of these two samples look different, implying that absorbance patterns in the infrared region are different. From the FTIR spectrum of okara biochar, we can see O-H stretching vibrations (alcohol and ketones) at 3310 cm−1 [54], and these are only detectable in the okara biochar sample, while, around this band, almost no peak appears in the okara sample. The peak at 3010 cm−1 in the okara biochar sample corresponds to the stretching vibrations of =C-H groups [55]. At around 1500 cm−1, both the okara biochar and okara samples display some peaks but with different intensities; in the okara sample, in particular, several peaks are quite weak, while in the okara biochar sample, the peaks are strong. Around 851 cm−1, there is a strong peak in the case of okara biochar, while, around this band, corresponding to vibration of C-H groups, no or very broad peaks occur in the case of the okara sample.
In Figure 8, the small peaks at 1570 and 1480 cm−1 may be attributed to the vibrations of C=O groups (acetyl or esters) of the hemicellulose present in the okara and the aromatic C=C bonds of lignin [54,56]. The presence of a peak at 1640 cm−1 evidenced a weak C=C bond of alkene and aromatics present in the biochar [54,57]. The absorption peaks at 1040 cm−1 may correspond to C-O-C pyranose ring stretching vibrations and C-O stretching in lignin, cellulose, and hemicellulose [54,56,57]. By contrast, with the original okara powder, before any treatment, the peaks rarely appeared, showing the changes in chemical structure after the pyrolysis.
Structural changes could also be seen in other biomass samples, e.g., rice husk biochar, as seen from the FTIR spectra of rice husks in Figure 9. Figure 9 shows that the FTIR spectra of rice husks and rice husk biochar in the region of 4000 cm−1 to 500 cm−1 are quite different due to different vibrations arising from different structures. At 1047.40 cm−1, a deep peak corresponding to alcohol groups appears in the FTIR spectrum of the rice husk sample, while a very low peak also occurs around this band in the FTIR spectrum of the rice husk biochar. At 795.76 cm−1, one more deep peak appears which corresponds to the aromatic group in the rice husk sample, while almost no peak appears in the rice husk biochar sample. In contrast, the FTIR spectrum of rice husk biochar shows that a small peak appears at 1074.43 cm−1, corresponding to alcohol groups.

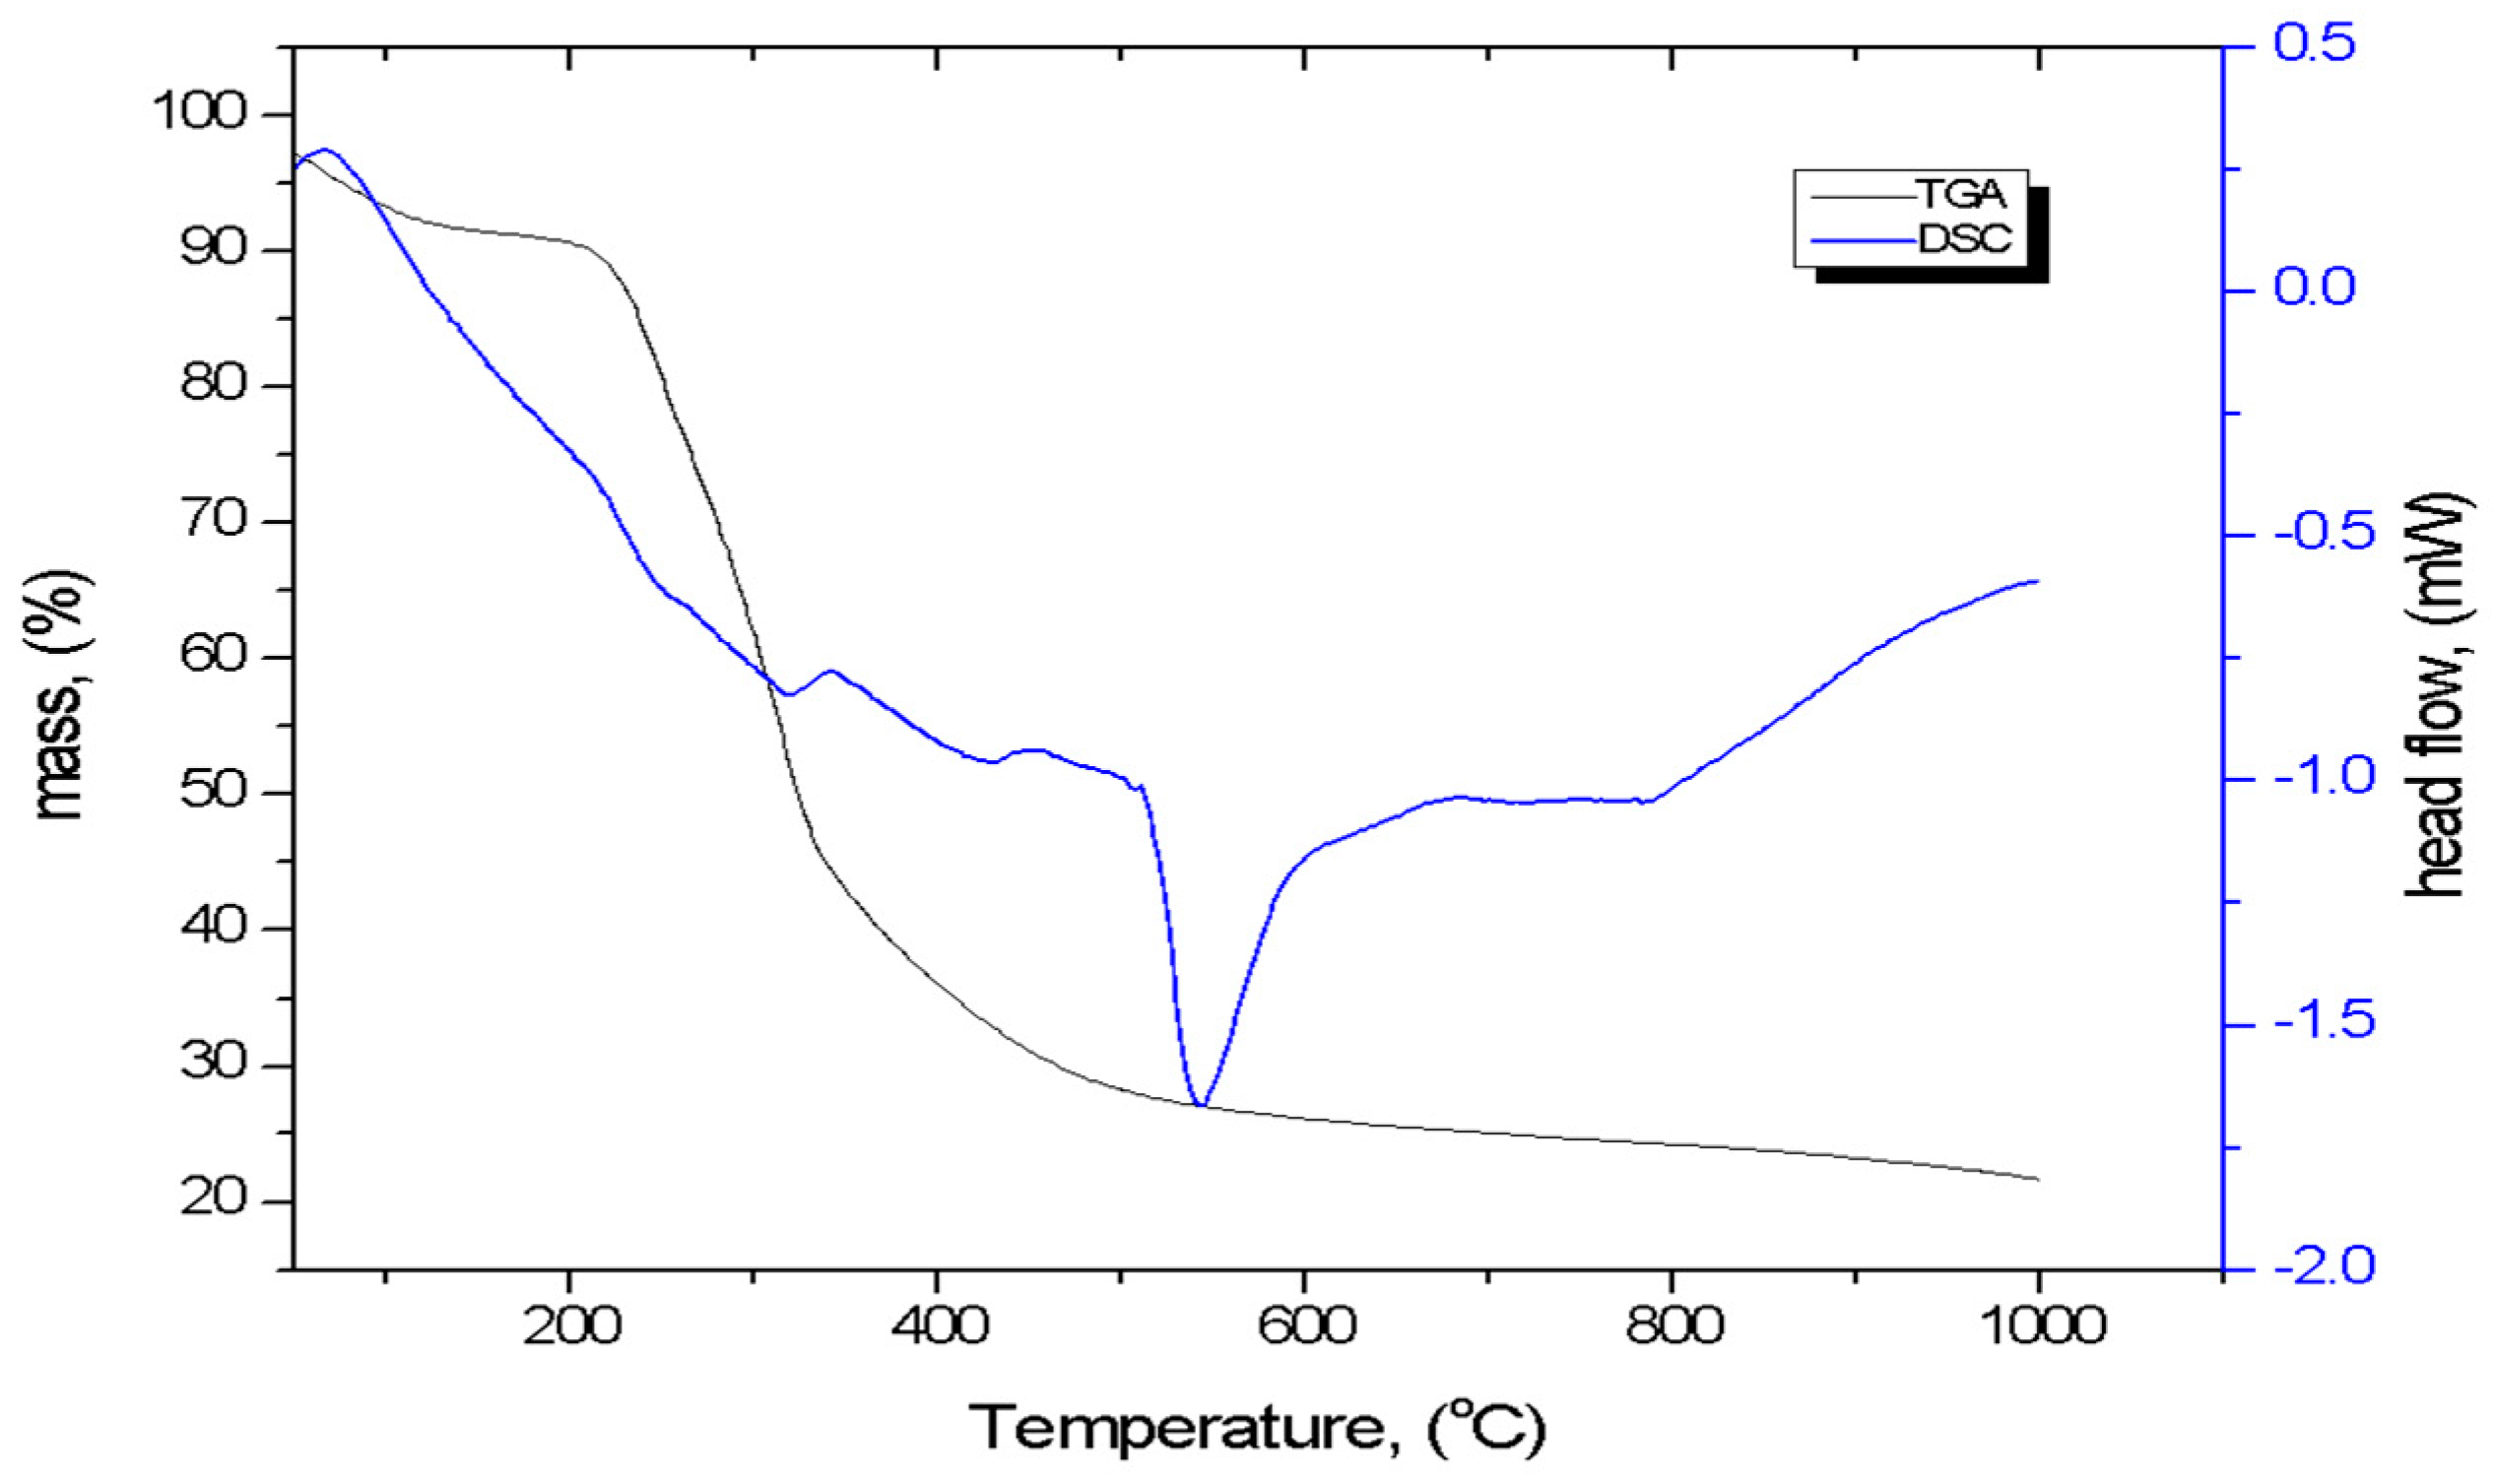
3.1.5. TG-DSC Analysis

The thermogravimetry (TG) method was used to measure the mass change of okara powder under pyrolysis conditions. A sample weighing 3–4 mg was placed in a crucible, which was placed on a sling balance. The analysis parameters were set to an initial temperature of 25 °C, a heating rate of 10 °C/min, a termination temperature of 600 °C, and a nitrogen flow of 50 mL/min. The mass changes were recorded continuously to form thermogravimetric curves. DSC measurement was performed at the same time.
The TGA-DSC profile of the okara powder waste is presented in Figure 10. It can be seen that the sample mass decreases slightly during the first minutes of measurement when temperatures are lower than 200 °C (the first stage), decreases significantly from the temperature of 200 °C up to 400 °C (the second stage), and slightly decreases again when the temperature rises from 400 °C up to 1000 °C (the third stage). The first stage is the drying stage, when free water and crystal water inside the okara fibers evaporate. The second stage, or carbonization stage, happens due to the thermal decomposition or degradation of cellulose and hemicellulose in the okara. The third stage, or combustion stage, happens when the temperature exceeds 400 °C, and the thermogravimetric curve becomes stable due to the gradual decomposition of the residual sample into carbon and ash [6]. Thus, at a pyrolysis temperature of 600 °C, the decomposition of the biomass is considered to be complete. The total mass lost is about 75%.
DSC analysis was performed as a complementary and supplementary technique to TGA to determine the transition temperatures of the samples as a function of heat flow. The DSC plot in Figure 10 indicates that the okara sample displayed some endothermic peaks. The first peak appears at 319.8 °C, −0.8254 mW/mg, and a deep peak occurs at 542.8 °C, −1.665 mW/mg. The formation of the endothermic peaks evidenced the decomposition of functional groups inside the okara sample. The heat flow values also indicate that before 542 °C, the heat flow reduces significantly, while from this transition temperature at 542 °C upward, the heat flow increases gradually [58].
The TGA-DSC profile of hydrochar obtained from okara powder waste by the HTC method (OPW4) is presented in Figure 11. The DSC analysis performed on the okara powder waste hydrochar displays an evident endothermic peak. The very large endothermic peak appearing in the high-temperature region (over 500 °C) is linked to the decomposition of remaining functional groups inside the okara sample after the HTC treatment. No exothermic peak is displayed. The results suggest that the DSC curves of dried okara biomass and its hydrochar samples, as shown, are significantly different and that the HTC treatment was not able to decompose all of the functional groups inside the okara sample, while the temperature for the pyrolysis of okara should be more than 550 °C to decompose functional groups completely.
Thermogravimetric experiments on okara powder waste showed that okara powder waste is a quite reactive material compared to its hydrochar obtained by HTC, as the total mass lost due to the decomposition of hydrochar was only 32%, while it was 75% for the okara waste powder. This means that during the HTC process, about 43% of the mass is lost and that the decomposition of the materials during calcination at high temperatures in N2 flow is less heavy.
The TGA-DSC profile of another biomass, namely, rice husks (sample RH), is illustrated in Figure 12. The sample mass decreases slightly during the first minutes of measurement when temperatures are lower than 250 °C (the first stage, also known as the initial mass loss phase, when moisture is released inside the rice husk sample). After this stage, the mass decreases significantly from the temperature of 250 °C up to 350 °C (the second stage, or the decomposition phase, when the maximum weight loss is obtained). And then the mass again slightly decreases when the temperature rises from 350 °C up to 800 °C (the third stage). The DSC analysis performed on the rice husk sample demonstrates two evident endothermic peaks. The first endothermic peak appearing in the temperature region of 460 °C is linked to the decomposition of remaining functional groups inside the rice husk sample. It can be seen that the decomposition of rice husks is quite similar to that of okara; at the pyrolysis temperature of 600 °C, most of the organic bonds have been broken to form biochar.

3.2. Biomass Pyrolysis Products and Their Properties

Biomass pyrolysis produces several bioproducts. These include condensable vapors like bio-oil or tar, carbon-rich solid residues or biochar, and non-condensable gases known as pyro-gases [28,59]. Bio-oil is the key constituent of pyrolysis substances, also known as pyrolysis liquid; it is a dark brown liquid made up of 15–30% water and organic matter like acids, aldehydes, phenols, ethers, and nitrogen compounds, and it has a strong odor. Bio-oil is extremely polar, hydrophilic, and has a high oxygen content. Biochar is the porous carbonaceous substance left over from biomass pyrolysis. The pyrolysis process conditions, as well as the biomass precursors used, will determine the biochar properties. The non-condensable gases include carbon dioxide, carbon monoxide, methane, ethylene, hydrogen, and others. These pyro-gases have heating values of about 6.4–9.8 MJ/kg. Lower-temperature pyrolysis will produce higher levels of CO2 and CO [28].

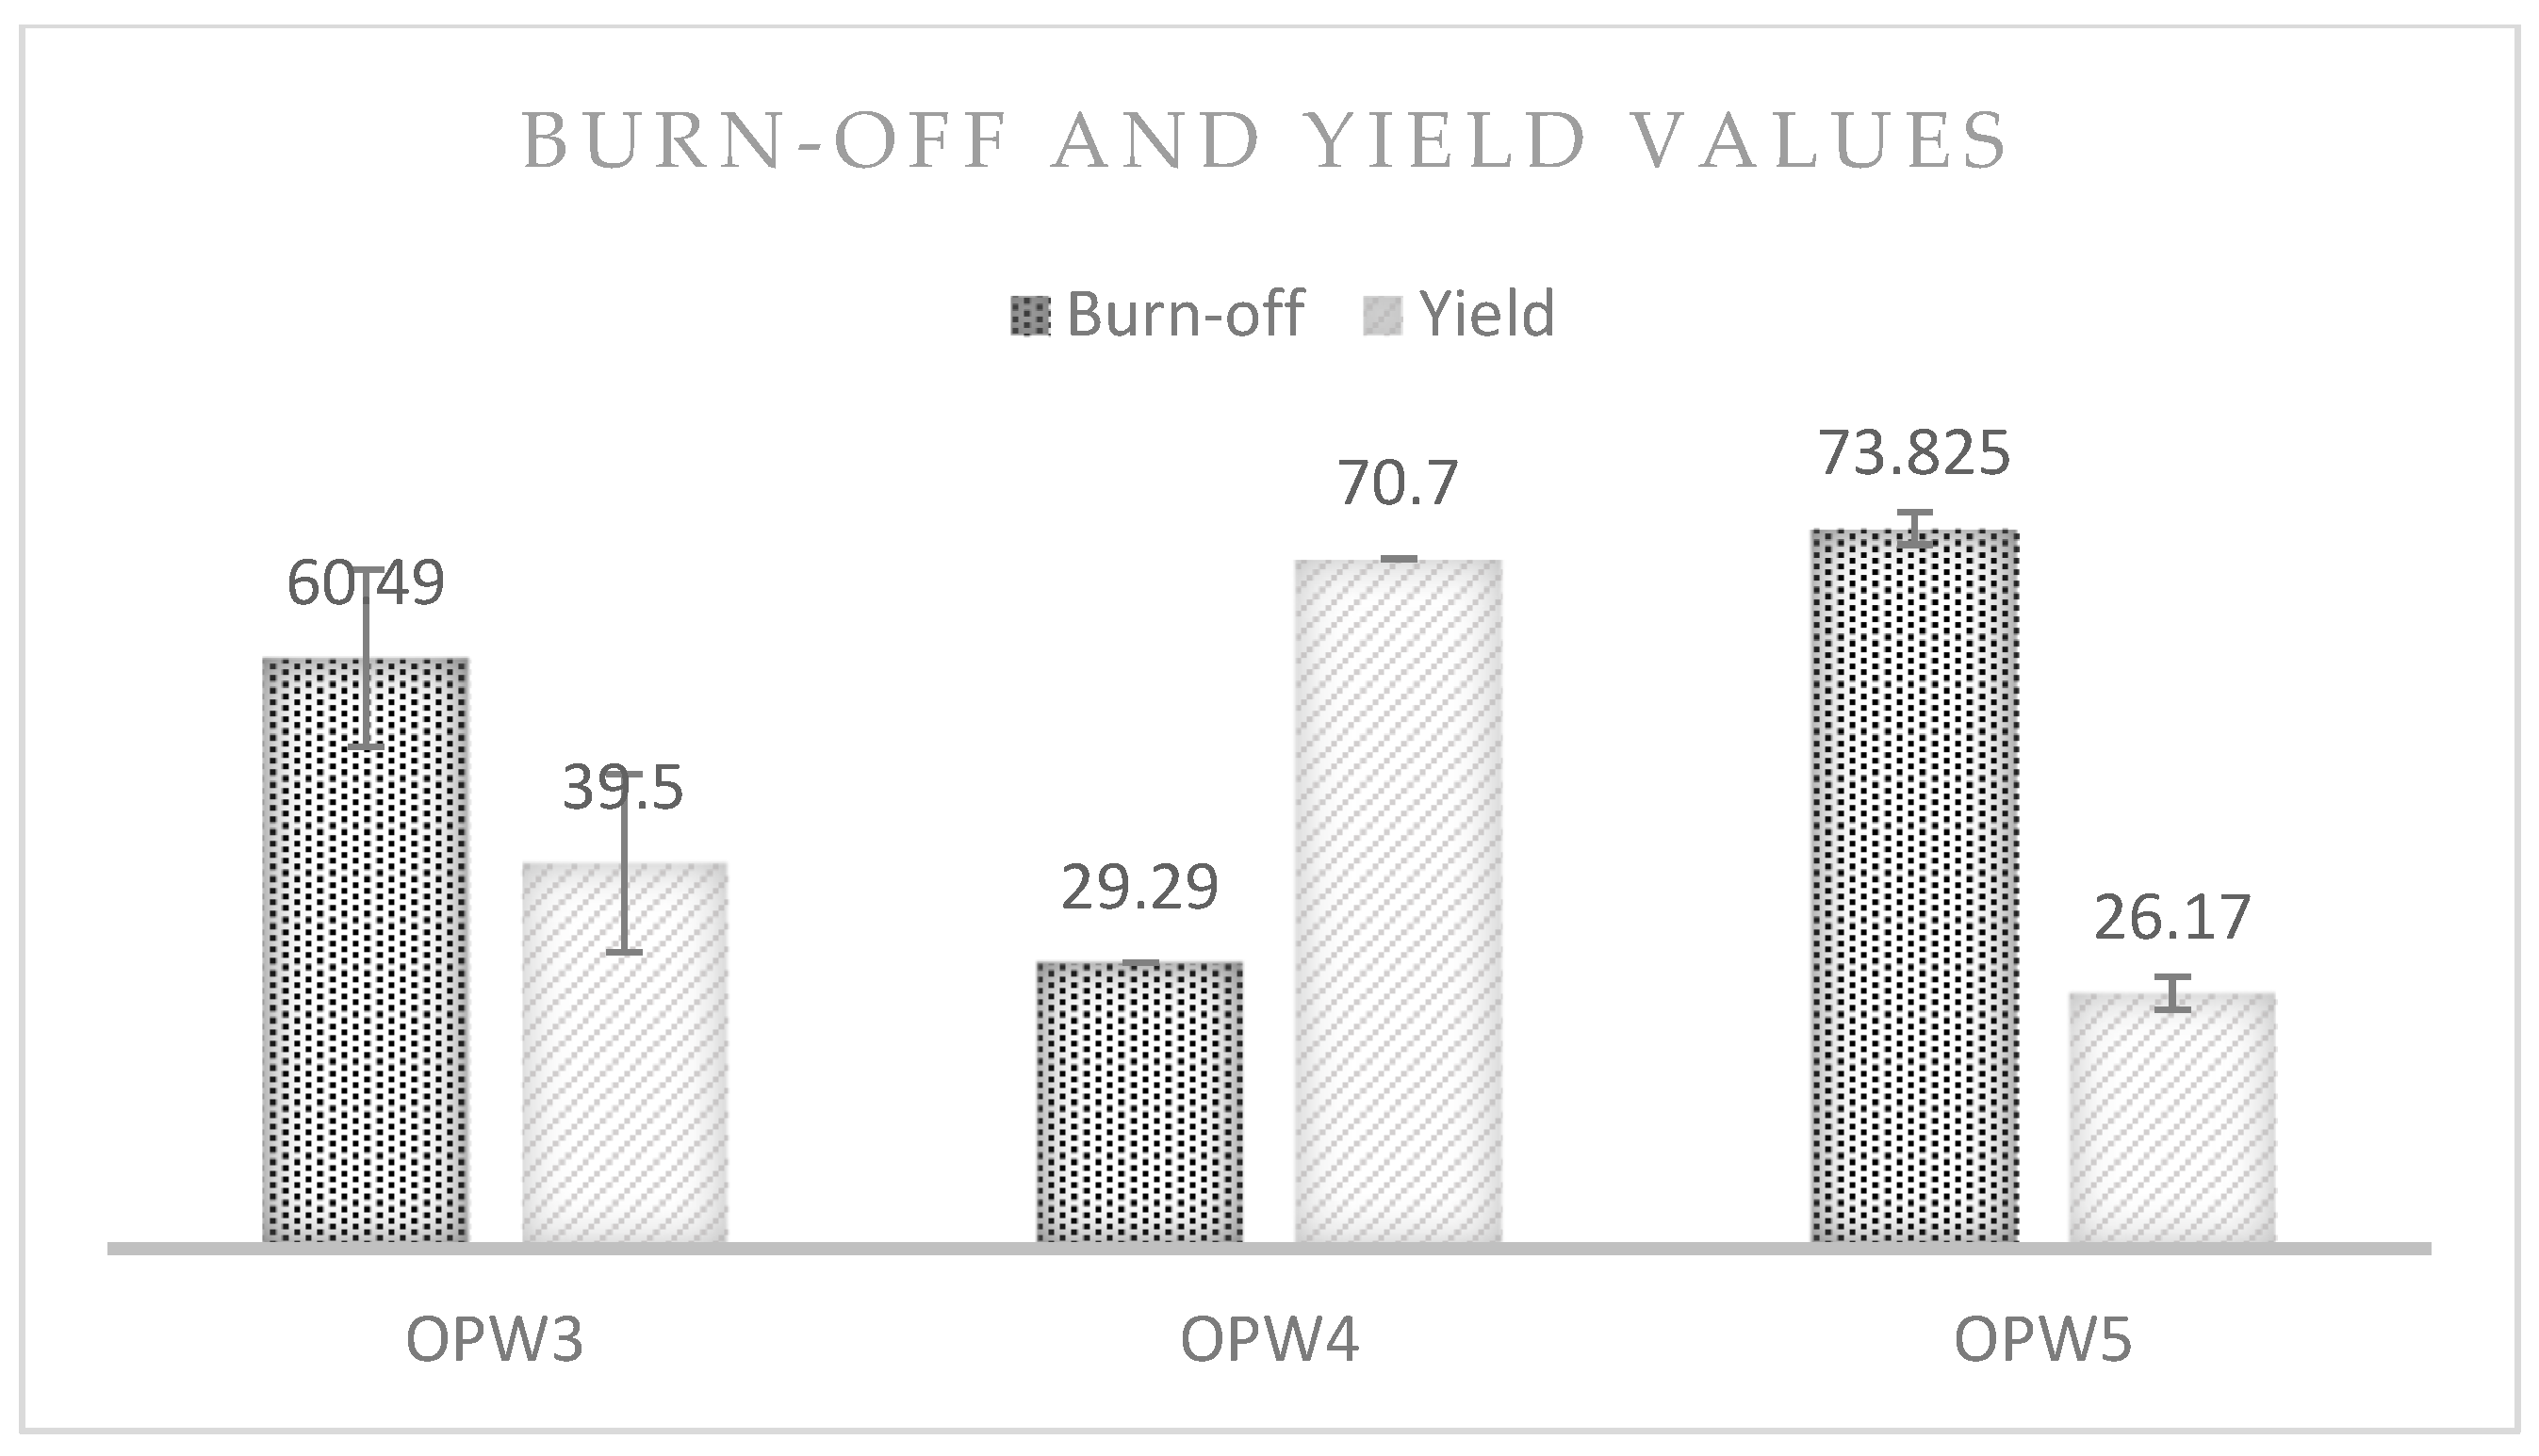
3.2.1. Biochar and Hydrochar Yield and Burn-Off

The carbon yield is commonly used to measure the effectiveness of a process conversion. Carbon yield and burn-off results of several pyrolysis experiments are presented in Figure 13.
Regarding the samples used in this study, the burn-off values of samples OPW 3, OPW4, and OPW5 were 60.49 ± 9.0, 29 ± indefinite, and 73.8 ± 1.6, respectively. The yield values of samples OPW 3, OPW4, and OPW5 were 39.5 ± 9.0, 70.7 ± indefinite, and 26.1 ± 1.6, respectively. For the OPW3 sample, the result was in good agreement with the TGA result. For the hydrothermal process without zeolite (OPW4), the burn-off was much less, indicating that the carbonization was not completed. However, with the use of a zeolite catalyst, the burn-off increased significantly to the same value as the carbonization at 600 °C. Thus, the use of zeolite enhances the carbonization to help the process occur at lower temperatures.

3.2.2. Surface Areas (SBET) and Pores

Several samples were analyzed to verify their surface areas. Table 3 is a summary of the samples we tested and their SBET values in comparison with results reported in the literature.
The results show that the pyrolysis temperature influences the surface area of biochar; when the temperature exceeds 600 °C, the surface area is very small (about 1 m2/g). A surface area of 20.73 m2/g was obtained for the sample carbonized at 600 °C; however, it was still too small to be used as an adsorbent.
The surface area of hydrochar is a little higher than that of biochar obtained at high temperatures (above 650 °C), especially when zeolite and KOH and melamine are used to catalyze the decomposition, but the surface area is only 14 m2/g.
Regarding the 10 samples analyzed and the SBET results listed above, the OPW10 sample achieved the highest SBET value (594.08 m2/g). The second-highest SBET value was achieved with sample OPW8 (212.60 m2/g). In contrast, the sample OPW2 had the smallest SBET value (1.06 m2/g). The second-smallest SBET value was attributed to the OPW1 sample (1.16 m2/g). The other samples, OPW4, OPW5, OPW3, OPW6, OPW7, OPW9, and RH, provided low to medium SBET values.
The addition of KOH to biochar possibly created small holes deep in the activated carbon surface. Thus, the SBET results for the porous ACs after activation increased up to 104 m2/g (OPW7) compared to the pre-activated carbon process, for which the SBET values were only 14 and 20 m2/g. When the ratio of KOH increased, the surface area increased (OPW10), since KOH reacted with C to form CO2 [18,62], resulting in more pores for the ACs, so with a suitable amount of KOH, the surface area can reach almost 600 m2/g.
KOH was also mixed with okara biochar without using water and stabilized for a few days (OPW8 and OPW9). In these cases, the surface areas of ACs were also improved but only reached around 200 m2/g; therefore, it is important to stabilize biochar and KOH for several days to allow the KOH to interact homogenously with the whole carbon sample to make it convenient for the following reaction during the next calcination at 600 °C:
4KOH + C → K2CO3 + K2O + 2H2
For comparison, rice husks were also simply carbonized at 600 °C (without activation with KOH), but the surface area of the obtained ACs only reached the medium value—175.48 m2/g. With the highest surface area of 594.08 m2/g, it was revealed that okara waste could produce ACs with a suitable surface area to serve as adsorbents, but it may not be an excellent candidate to produce extremely high-surface-area adsorbents.

4. Conclusions and Outlook

In the context of global warming mitigation, sustainable development, and net-zero targets [63], agricultural residues are promising sources for synthesizing biomaterials with various applications, such as energy storage, aqueous environmental remediation, biofuels, and CO2 capture [2,16,29,64,65,66,67]. This study utilized biomass sources for synthesizing useful products, namely, porous carbon materials—CO2 adsorbents—using the slow pyrolysis and hydrothermal processes. More importantly, okara powder waste was chosen to be focused on because it is cheap, very available in Asian countries, and easy to collect.
The adsorbent materials synthesized by pyrolysis and hydrothermal processes in this study showed porous characteristics. To investigate the adsorption of the activated carbon, thermal chemical activation was performed. When no activating agent was used, the surface areas of the adsorbents were small, but when activated agents were added in a combined pyrolysis and chemical activation method, the SBET values of the adsorbents significantly increased. Carbon yields ranged from 30% to 70% for slow pyrolysis processes. Pyro-gases included mainly CO2, CO, CH4, and H2. Regarding the pyrolysis and HTC methods, we conclude that HTC is not sufficient; solid acid catalysts (zeolite) could accelerate the carbonization in HTC (as evidenced by the TGA analysis). Pyrolysis without an activating agent (or activator) resulted in low surface areas. Activator addition (wet vs. dry thermal chemical processes) increased surface areas. The addition of a suitable amount of a wet activator (KOH) increased the BET surface area.
The results on activated carbons synthesized from okara and other biomasses having been reported here, future research should continue to examine CO2 uptake in these materials. Okara waste, which has never been studied previously, can produce ACs with a suitable surface area (about 600 m2/g) to serve as adsorbents, but they may not be excellent candidates to produce extremely high-surface-area adsorbents. Further studies on CO2 capture using the activated carbon materials developed are needed.

Author Contributions

Conceptualization, T.-D.H., M.T.L. and Y.L.; methodology, T.-D.H., M.T.L. and Y.L.; validation, T.-D.H., M.T.L. and Y.L.; formal analysis, T.-D.H.; investigation, T.-D.H., M.T.L. and Y.L.; resources, T.-D.H., M.T.L. and Y.L.; data curation, T.-D.H., M.T.L. and Y.L.; writing—original draft preparation, T.-D.H.; writing—review and editing, T.-D.H.; visualization, T.-D.H.; supervision, M.T.L.; project administration, M.T.L.; funding acquisition, T.-D.H. and M.T.L. All authors have read and agreed to the published version of the manuscript.

Funding

This research was funded by the German Academic Exchange Service (DAAD, no. 57315854). The APC was funded by MDPI.

Institutional Review Board Statement

Not applicable.

Informed Consent Statement

Not applicable.

Data Availability Statement

The data presented in this study are available in the article. Data supporting reported results can be provided upon request.

Acknowledgments

T.D.H sincerely thanks the RoHan Project funded by the German Academic Exchange Service (DAAD, no. 57315854) and to the Federal Ministry for Economic Cooperation and Development (BMZ) of Germany inside the framework of the “SDG Bilateral Graduate School program” for funding so that he can carry out this research at the GeViCat center, HUST, Vietnam.

Conflicts of Interest

The authors declare no conflicts of interest concerning the research, authorship, and/or publication of this article. The funders had no role in the design of the study; in the collection, analyses, or interpretation of data; in the writing of the manuscript; or in the decision to publish the results.

References

  1. Friedlingstein, P.; Houghton, R.A.; Marland, G.; Hackler, J.; Boden, T.A.; Conway, T.J.; Canadell, J.G.; Raupach, M.R.; Ciais, P.; Le Quéré, C. Update on CO2 emissions. Nat. Geosci. 2010, 3, 811–812. [Google Scholar] [CrossRef]
  2. Hoang, T.D.; Bandh, S.A.; Malla, F.A.; Qayoom, I.; Bashir, S.; Peer, S.B.; Halog, A. Carbon-Based Synthesized Materials for CO2 Adsorption and Conversion: Its Potential for Carbon Recycling. Recycling 2023, 8, 53. [Google Scholar] [CrossRef]
  3. Yoro, K.O.; Daramola, M.O. CO2 emission sources, greenhouse gases, and the global warming effect. In Advances in Carbon Capture, 1st ed.; Mohammad, R.R., Mohammad, F., Mohammad, A.M., Eds.; Woodhead Publishing: Cambrigde, UK, 2020; pp. 3–28. [Google Scholar]
  4. Gao, J.; Shiong, S.C.S.; Liu, Y. Reduction of CO2 to chemicals and Fuels: Thermocatalysis versus electrocatalysis. J. Chem. Eng. 2023, 472, 145033. [Google Scholar] [CrossRef]
  5. Etheridge, D.M.; Steele, L.P.; Langenfelds, R.L.; Francey, R.J.; Barnola, J.M.; Morgan, V.I. Natural and anthropogenic changes in atmospheric CO2 over the last 1000 years from air in Antarctic ice and firn. J. Geophys. Res. 1996, 101, 4115–4128. [Google Scholar] [CrossRef]
  6. Liu, J.; Chen, X.; Chen, W.; Xia, M.; Chen, Y.; Chen, H.; Zeng, K.; Yang, H. Biomass pyrolysis mechanism for carbon-based high-value products. Proc. Combust. Inst. 2023, 39, 3157–3181. [Google Scholar] [CrossRef]
  7. Dziejarski, B.; Serafin, J.; Andersson, K.; Krzyżyńska, R. CO2 capture materials: A review of current trends and future challenges. Mater. Today Sustain. 2023, 24, 100483. [Google Scholar] [CrossRef]
  8. Chen, Y.; Lin, G.; Chen, S. Preparation of a solid amine micro spherical adsorbent with high CO2 adsorption capacity. Langmuir 2020, 36, 7715–7723. [Google Scholar] [CrossRef] [PubMed]
  9. Hakim, A.; Marliza, T.S.; Abu Tahari, N.M.; Wan Isahak, R.W.; Yusop, R.M.; Mohamed Hisham, W.M.; Yarmo, A.M. Studies on CO2 adsorption and desorption properties from various types of iron oxides (FeO, Fe2O3, and Fe3O4). Ind. Eng. Chem. Res. 2016, 55, 7888–7897. [Google Scholar] [CrossRef]
  10. Horike, S.; Shimomura, S.; Kitagawa, S. Soft porous crystals. Nat. Chem. 2009, 1, 695–704. [Google Scholar] [CrossRef]
  11. Pinto, M.L.; Mafra, L.; Guil, J.M.; Pires, J.; Rocha, J. Adsorption and activation of CO2 by amine-modified nanoporous materials studied by solid-state NMR and 13CO2 adsorption. Chem. Mater. 2011, 23, 1387–1395. [Google Scholar] [CrossRef]
  12. Chanapattharapol, K.C.; Krachuamram, S.; Youngme, S. Study of CO2 adsorption on iron oxide doped MCM-41. Microporous Mesoporous Mater. 2017, 245, 8–15. [Google Scholar] [CrossRef]
  13. Wang, L.; Zhang, Y.S.; Jiang, H.R.; Wang, H. Carbonyl-incorporated aromatic hyper-cross-linked polymers with microporous structure and their functional materials for CO2 adsorption. Ind. Eng. Chem. Res. 2020, 59, 15955–15966. [Google Scholar] [CrossRef]
  14. Furuvik, N.C.; Wang, L.; Jaiswal, R.; Thapa, R.; Eikeland, M.S.; Moldestad, B.M. Experimental study and SEM-EDS analysis of agglomerates from gasification of biomass in fluidized beds. Energy 2022, 252, 124034. [Google Scholar] [CrossRef]
  15. Hoang, T.D.; Nghiem, N. Recent developments and current status of commercial production of fuel ethanol. Fermentation 2021, 7, 314. [Google Scholar] [CrossRef]
  16. Sezali, N.A.A.; Ong, H.L.; Villagracia, A.R.; Hoang, T.D. Bio-based nanomaterials for energy application: A review. Vietnam J. Chem. 2024, 62, 1–12. [Google Scholar] [CrossRef]
  17. Li, Q.; Liu, S.; Wang, L.; Chen, F.; Shao, J.; Hu, X. Efficient nitrogen doped porous carbonaceous CO2 adsorbents based on lotus leaf. J. Environ. Sci. 2021, 103, 268–278. [Google Scholar] [CrossRef] [PubMed]
  18. Zhang, C.; Sun, S.; He, S.; Wu, C. Direct air capture of CO2 by KOH-activated bamboo biochar. J. Energy Inst. 2022, 105, 399–405. [Google Scholar] [CrossRef]
  19. Mumtaz, H.; Farhan, M.; Amjad, M.; Riaz, F.; Kazim, A.H.; Sultan, M.; Farooq, M.; Mujtaba, M.A.; Hussain, I.; Imran, M.; et al. Biomass waste utilization for adsorbent preparation in CO2 capture and sustainable environment applications. Sustain. Energy Technol. Assess. 2021, 46, 101288. [Google Scholar] [CrossRef]
  20. Huang, Y.F.; Chiueh, T.; Shih, C.H.; Lo, S.L.; Sun, L.; Zhong, Y.; Qiu, C. Microwave pyrolysis of rice straw to produce biochar as an adsorbent for CO2 capture. Energy 2015, 84, 75–82. [Google Scholar] [CrossRef]
  21. Travis, W.; Gadipelli, S.; Guo, Z. Superior CO2 adsorption from waste coffee ground derived carbons. RSC Adv. 2015, 5, 29558–29562. [Google Scholar] [CrossRef]
  22. Wang, S.; Lee, Y.R.; Won, Y.; Kim, H.; Jeong, S.E.; Hwang, B.W.; Cho, A.R.; Kim, J.Y.; Park, Y.C.; Nam, H.; et al. Development of high-performance adsorbent using KOH-impregnated rice husk-based activated carbon for indoor CO2 adsorption. J. Chem. Eng. 2022, 437, 135378. [Google Scholar] [CrossRef]
  23. Fan, H.; Zhang, Y.; Swallah, M.S.; Wang, S.; Zhang, J.; Fang, J.; Lu, J.; Yu, H. Structural characteristics of insoluble dietary fiber from okara with different particle sizes and their prebiotic effects in rats fed high-fat diet. Foods 2022, 11, 1298. [Google Scholar] [CrossRef] [PubMed]
  24. Liu, K. Food use of whole soybeans. In Soybeans, 1st ed; Lawrence, A., Johnson, J.W., Richard, G., Eds.; AOCS Press: Champaign, IL, USA, 2008; pp. 441–481. [Google Scholar]
  25. Xiao, C.W. Functional soy products. In Functional Foods, 2nd ed.; Maria, S., Ed.; Woodhead Publishing: Cambrigde, UK, 2011; pp. 534–556. [Google Scholar]
  26. Rahman, M.M.; Mat, K.; Ishigaki, G.; Akashi, R. A review of okara (soybean curd residue) utilization as animal feed: Nutritive value and animal performance aspects. Anim. Sci. J. 2021, 92, e13594. [Google Scholar] [CrossRef] [PubMed]
  27. Li, B.; Qiao, M.; Lu, F. Composition, nutrition, and utilization of okara (soybean residue). Food Rev. Int. 2012, 28, 231–252. [Google Scholar] [CrossRef]
  28. Abi Bianasari, A.; Khaled, M.S.; Hoang, T.D.; Reza, M.S.; Bakar, M.S.A.; Azad, A.K. Influence of combined catalysts on the catalytic pyrolysis process of biomass: A systematic literature review. Energy Convers. Manag. 2024, 309, 118437. [Google Scholar] [CrossRef]
  29. Tran, T.K.; Huynh, L.; Nguyen, H.L.; Nguyen, M.K.; Lin, C.; Hoang, T.D.; Hung, N.T.Q.; Nguyen, X.H.; Chang, S.W.; Nguyen, D.D. Applications of engineered biochar in remediation of heavy metal (loid) s pollution from wastewater: Current perspectives toward sustainable development goals. Sci. Total Environ. 2024, 926, 171859. [Google Scholar] [CrossRef] [PubMed]
  30. Komkiene, J.; Baltrenaite, E. Biochar as adsorbent for removal of heavy metal ions [Cadmium (II), Copper (II), Lead (II), Zinc (II)] from aqueous phase. Int. J. Environ. Sci. Technol. 2016, 13, 471–482. [Google Scholar] [CrossRef]
  31. Amalina, F.; Abd Razak, A.S.; Krishnan, S.; Sulaiman, H.; Zularisam, A.W.; Nasrullah, M. Biochar production techniques utilizing biomass waste-derived materials and environmental applications—A review. J. Hazard. Mater. Adv. 2022, 7, 100134. [Google Scholar] [CrossRef]
  32. Miranda, N.T.; Motta, I.L.; Maciel Filho, R.; Maciel, M.R.W. Sugarcane bagasse pyrolysis: A review of operating conditions and products properties. Renew. Sustain. Energy Rev. 2021, 149, 111394. [Google Scholar] [CrossRef]
  33. Kan, T.; Strezov, V.; Evans, T.J. Lignocellulosic biomass pyrolysis: A review of product properties and effects of pyrolysis parameters. Renew. Sustain. Energy Rev. 2016, 57, 1126–1140. [Google Scholar] [CrossRef]
  34. Vuppaladadiyam, A.K.; Vuppaladadiyam, S.S.V.; Sikarwar, V.S.; Ahmad, E.; Pant, K.K.; Murugavelh, S.; Pandey, A.; Bhattacharya, S.; Sarmah, A.; Leu, S.Y. A critical review on biomass pyrolysis: Reaction mechanisms, process modeling and potential challenges. J. Energy Inst. 2023, 108, 101236. [Google Scholar] [CrossRef]
  35. Lee, S.Y.; Sankaran, R.; Chew, K.W.; Tan, C.H.; Krishnamoorthy, R.; Chu, D.T.; Show, L. Waste to bioenergy: A review on the recent conversion technologies. BMC Energy 2019, 1, 4. [Google Scholar] [CrossRef]
  36. Ghodake, G.S.; Shinde, S.K.; Kadam, A.A.; Saratale, R.G.; Saratale, G.D.; Kumar, M.; Palem, R.R.; AL-Shwaiman, H.A.; Elgorban, A.M.; Syed, A.; et al. Review on biomass feedstocks, pyrolysis mechanism and physicochemical properties of biochar: State-of-the-art framework to speed up vision of circular bioeconomy. J. Clean. Prod. 2021, 297, 126645. [Google Scholar] [CrossRef]
  37. Sharma, R.; Jasrotia, K.; Singh, N.; Ghosh, P.; Srivastava, S.; Sharma, N.R.; Singh, J.; Kanwar, R.; Kumar, A. A comprehensive review on hydrothermal carbonization of biomass and its applications. Chem. Afr. 2020, 3, 1–19. [Google Scholar] [CrossRef]
  38. Bach, Q.-V.; Skreiberg, Ø. Upgrading biomass fuels via wet torrefaction: A review and comparison with dry torrefaction. Renew. Sustain. Energy Rev. 2016, 54, 665–677. [Google Scholar] [CrossRef]
  39. Yoganandham, S.T.; Sathyamoorthy, G.; Renuka, R.R. Emerging extraction techniques: Hydrothermal processing. In Sustainable Seaweed Technologies, 1st ed.; Maria, D.T., Stefan, K., Herminia, D., Eds.; Elsevier: Amsterdam, The Netherlands, 2020; pp. 191–205. [Google Scholar]
  40. Marzbali, M.H.; Kundu, S.; Halder, P.; Patel, S.; Hakeem, I.G.; Paz-Ferreiro, J.; Madapusi, S.; Surapaneni, A.; Shah, K. Wet organic waste treatment via hydrothermal processing: A critical review. Chemosphere 2021, 279, 130557. [Google Scholar] [CrossRef] [PubMed]
  41. Hossain, N.; Nizamuddin, S.; Griffin, G.; Selvakannan, P.; Mubarak, N.M.; Mahlia, T.M.I. Synthesis and characterization of rice husk biochar via hydrothermal carbonization for wastewater treatment and biofuel production. Sci. Rep. 2020, 10, 18851. [Google Scholar] [CrossRef]
  42. Ullah, H.; Lun, L.; Riaz, L.; Naseem, F.; Shahab, A.; Rashid, A. Physicochemical characteristics and thermal degradation behavior of dry and wet torrefied orange peel obtained by dry/wet torrefaction. Biomass Convers. Biorefin. 2021, 13, 7993–8009. [Google Scholar] [CrossRef]
  43. Rodríguez Correa, C.; Ngamying, C.; Klank, D.; Kruse, A. Investigation of the textural and adsorption properties of activated carbon from HTC and pyrolysis carbonizates. Biomass Convers. Biorefin. 2018, 8, 317–328. [Google Scholar] [CrossRef]
  44. Mumme, J.; Titirici, M.M.; Pfeiffer, A.; Luder, U.; Reza, M.T.; Masek, O. Hydrothermal carbonization of digestate in the presence of zeolite: Process efficiency and composite properties. ACS Sustain. Chem. Eng. 2015, 3, 2967–2974. [Google Scholar] [CrossRef]
  45. Yang, P.; Rao, L.; Zhu, W.; Wang, L.; Ma, R.; Chen, F.; Lin, G.; Hu, X. Porous carbons derived from sustainable biomass via a facile one-step synthesis strategy as efficient CO2 adsorbents. Ind. Eng. Chem. Res. 2020, 59, 6194–6201. [Google Scholar] [CrossRef]
  46. Hoang, T.D.; Ky, N.M.; Thuong, N.T.N.; Nhan, H.Q.; Ngan, N.V.C. Artificial intelligence in pollution control and management: Status and future prospects. In Artificial Intelligence and Environmental Sustainability. Algorithms for Intelligent Systems, 1st ed.; Ong, H.L., Doong, R., Naguib, R., Lim, C.P., Nagar, A.K., Eds.; Springer: Singapore, 2022; pp. 23–43. [Google Scholar]
  47. Reza, M.S.; Afroze, S.; Kuterbekov, K.; Kabyshev, A.; Bekmyrza, K.Z.; Taweekun, J.; Ja’afar, F.; Saifullah Abu Bakar, M.; Azad, A.K.; Roy, H.; et al. Ex situ catalytic pyrolysis of invasive Pennisetum purpureum grass with activated carbon for upgrading bio-oil. Sustainability 2023, 15, 7628. [Google Scholar] [CrossRef]
  48. Lee, S.M.; Roh, J.S. Pore development process according to burn-off of activated carbon black with CO2 gas. Fuller. Nanotub. Carbon Nanostruct. 2020, 28, 808–814. [Google Scholar] [CrossRef]
  49. Bedia, J.; Peñas-Garzón, M.; Gómez-Avilés, A.; Rodriguez, J.J.; Belver, C. A review on the synthesis and characterization of biomass-derived carbons for adsorption of emerging contaminants from water. C 2018, 4, 63. [Google Scholar] [CrossRef]
  50. Menya, E.; Olupot, W.; Storz, H.; Lubwama, M.; Kiros, Y. Synthesis and evaluation of activated carbon from rice husks for removal of humic acid from water. Biomass Convers. Biorefin. 2020, 12, 3229–3248. [Google Scholar] [CrossRef]
  51. Giri, B.S.; Goswami, M.; Kumar, P.; Yadav, R.; Sharma, N.; Sonwani, R.K.; Yadav, S.; Singh, R.P.; Rene, E.R.; Chaturvedi, P.; et al. Adsorption of patent blue V from textile industry wastewater using Sterculia alata fruit shell biochar: Evaluation of efficiency and mechanisms. Water 2020, 12, 2017. [Google Scholar] [CrossRef]
  52. Reza, M.S.; Taweekun, J.; Afroze, S.; Siddique, S.A.; Islam, M.S.; Wang, C.; Azad, A.K. Investigation of thermochemical properties and pyrolysis of barley waste as a source for renewable energy. Sustainability 2023, 15, 1643. [Google Scholar] [CrossRef]
  53. Lazzari, E.; Schena, T.; Marcelo, M.C.A.; Primaz, C.T.; Silva, A.N.; Ferrao, M.F.; Bjerk, T.; Caramao, E.B. Classification of biomass through their pyrolytic bio-oil composition using FTIR and PCA analysis. Ind. Crops Prod. 2018, 111, 856–864. [Google Scholar] [CrossRef]
  54. Adeniyi, A.G.; Ighalo, J.O.; Onifade, D.V. Production of biochar from elephant grass (Pernisetum purpureum) using an updraft biomass gasifier with retort heating. Biofuels 2019, 12, 1283–1290. [Google Scholar] [CrossRef]
  55. Téllez, G.L.; Vigueras-Santiago, E.; Hernández-López, S. Characterization of linseed oil epoxidized at different percentages. Superf. Vacío 2009, 22, 5–10. [Google Scholar]
  56. Wu, M.; Feng, Q.; Sun, X.; Wang, H.; Gielen, G.; Wu, W. Rice (Oryza sativa L.) plantation affects the stability of biochar in paddy soil. Sci. Rep. 2015, 5, 10001. [Google Scholar] [CrossRef] [PubMed]
  57. Suratman, A.; Astuti, D.N.; Kusumastuti, P.; Sudiono, S. Okara biochar immobilized calcium-alginate beads as eosin yellow dye adsorbent. Results Chem. 2024, 7, 101268. [Google Scholar] [CrossRef]
  58. Anukam, A.I.; Berghel, J.; Frodeson, S.; Famewo, E.B.; Nyamukamba, P. Characterization of pure and blended pellets made from Norway spruce and pea starch: A comparative study of bonding mechanism relevant to quality. Energies 2019, 12, 4415. [Google Scholar] [CrossRef]
  59. Hoang, A.T.; Ong, H.C.; Fattah, I.R.; Chong, C.T.; Cheng, C.K.; Sakthivel, R.; Ok, Y.S. Progress on the lignocellulosic biomass pyrolysis for biofuel production toward environmental sustainability. Fuel Process. Technol. 2021, 223, 106997. [Google Scholar] [CrossRef]
  60. Nguyen, T.N.; Le, A.; Phung, V.B.T. Facile green synthesis of carbon quantum dots and biomass-derived activated carbon from banana peels: Synthesis and investigation. Biomass Convers. Biorefin. 2022, 12, 2407–2416. [Google Scholar] [CrossRef]
  61. Xie, L.; Sun, G.; Su, F.; Guo, X.; Kong, Q.; Li, X.; Huang, X.; Wan, L.; Li, K.; Lv, C.; et al. Hierarchical porous carbon microtubes derived from willow catkins for supercapacitor applications. J. Mater. Chem. A 2016, 4, 1637–1646. [Google Scholar] [CrossRef]
  62. Wang, K.; Xu, S. Preparation of High Specific Surface Area Activated Carbon from Petroleum Coke by KOH Activation in a Rotary Kiln. Processes 2024, 12, 241. [Google Scholar] [CrossRef]
  63. Malla, F.A.; Dung, T.; Bandh, S.A.; Malla, A.A.; Wani, S.A. Circular Economy to Decarbonize Electricity. In Renewable Energy in Circular Economy, 1st ed.; Bandh, S.A., Malla, F.A., Hoang, A.T., Eds.; Springer International Publishing: Cham, Switzerland, 2023; pp. 71–87. [Google Scholar]
  64. Hoang, T.D.; Ha, T.; Halog, A.B.; Malla, F.A.; Bandh, S.A. Biofuel Projects and Current Environmental Policies: Vietnam’s Case and Neighboring Asian Countries. In Biofuels in Circular Economy, 1st ed.; Bandh, S.A., Malla, F.A., Eds.; Springer Nature: Singapore, 2023; pp. 73–88. [Google Scholar]
  65. González, A.S.; Plaza, M.G.; Rubiera, F.; Pevida, C. Sustainable biomass-based carbon adsorbents for post-combustion CO2 capture. J. Chem. Eng. 2013, 230, 456–465. [Google Scholar] [CrossRef]
  66. Karimi, M.; Rodrigues, A.E.; Silva, J.A. Biomass as a source of adsorbents for CO2 capture. In Advances in Bioenergy and Microfluidic Applications, 1st ed.; Mohammad, R.R., Reza, K., Mohammad, A.M., Mohammad, K.D.M., Eds.; Elsevier: Amsterdam, The Netherlands, 2021; pp. 255–274. [Google Scholar]
  67. Bandh, S.A.; Malla, F.A.; Hoang, T.D.; Qayoom, I.; Mohi-Ud-Din, H.; Bashir, S.; Betts, R.; Le, T.T.; Nguyen Le, D.T.; Linh Le, N.V.; et al. Track to reach net-zero: Progress and pitfalls. Energy Environ. 2024. [Google Scholar] [CrossRef]
Figure 1. Schematic design of the vertical batch pyrolysis system setup (for samples OPW1–OPW6).
Sustainability 16 05495 g001
Figure 2. Schematic design of the horizontal batch pyrolysis experimental setup.
Sustainability 16 05495 g002
Figure 3. HTC method and procedure used to prepare hydrochar.
Sustainability 16 05495 g003
Figure 4. EDX spectrum of okara powder waste.
Sustainability 16 05495 g004
Figure 5. SEM images of (a) okara powder waste, (b) rice husk, (c) coffee waste, (d) shrimp shell, (e) rice straw, and (f) potato peel.
Sustainability 16 05495 g005
Figure 6. SEM images of various biochars (synthesized at 600 °C over 1 h): (a) okara biochar (OPW3) (b), rice straw biochar, (c) rice husk (RH) biochar, (d) coffee grounds biochar, (e) potato peel (PP) biochar, and (f) shrimp shell biochar at 1000 magnifications.
Sustainability 16 05495 g006
Figure 7. The FTIR spectra of different raw biomasses.
Sustainability 16 05495 g007
Figure 8. Fourier transform infrared spectra of okara biomass and okara biochar.
Sustainability 16 05495 g008
Figure 9. Fourier transform infrared spectra of rice husks and rice husk biochar.
Sustainability 16 05495 g009
Figure 10. TGA-DSC analysis of okara powder waste under N2 flow.
Sustainability 16 05495 g010
Figure 11. DSC and TGA analysis of okara powder waste hydrochar under N2 flow (sample OPW 4).
Sustainability 16 05495 g011
Figure 12. DSC and TGA analysis of rice husks under N2 flow (sample RH).
Sustainability 16 05495 g012
Figure 13. Carbon yield and burn-off results of different experiments.
Sustainability 16 05495 g013
Table 1. The synthesized samples and detailed pretreatment methods.
Biomass PrecursorSample CodePretreatment MethodsActivating Agent
Okara powder wasteOPW1Carbonization at 800 °C in an Ar gas flow for 1 hNo activating agent
Okara powder wasteOPW2Carbonization at 650 °C in a N2 gas flow for 1 hNo activating agent
Okara powder wasteOPW3Carbonization at 600 °C in a N2 gas flow for 1 hNo activating agent
Okara powder wasteOPW4Hydrothermal carbonization at 200 °C; the heating rate was 60 °C/h; a temperature of 200 °C was maintained for 4 h; the weight ratio of OPW/water was 12.8 g: 40 mLNo activating agent
Okara powder wasteOPW5Hydrothermal carbonization at 200 °C; the weight ratio was 12.8 g OPW: 6.4 g zeolite (4 mm in size): 40 mL water; a temperature of 200 °C was maintained for 4 h; the heating rate was 60 °C/hNo activating agent
Okara powder wasteOPW6Hydrothermal carbonization at 200 °C, with a heating rate of 60 °C/hour and the temperature kept at 200 °C for 4 h; then, the sample was mixed with KOH and melamine with a mass ratio of hydrochar/KOH/melamine = 1:4:2, and pyrolysis (a two-step process) was performed at 600 °C in a N2 flow for 1 h with a N2 flow rate of 1 L/minKOH and melamine (weight ratio of KOH/melamine = 2:1)
Okara powder wasteOPW7Carbonization was performed at 600 °C in N2 for 1 h to make biochar; after that, the biochar was mixed with KOH and water; then, the sample was kept under stirring for 48 h with a biochar/KOH/water weight ratio of 1:4:5, after which it was filtered and dried, then calcined at 600 °C in N2 for 1 hKOH
Rice huskRHCarbonization at 600 °C in N2 for 1 hNo activating agent
Okara powder wasteOPW8Carbonization at 600 °C in N2 for 1 h, followed by a dry mixing process with KOH (ratio of biochar/KOH = 1.3), then drying at 120 °C and carbonization at 600 °C KOH
Okara powder wasteOPW9Carbonization at 600 °C in N2 for 1 h, followed by a dry mixing process with KOH (ratio of biochar/KOH = 1.4), then drying at 120 °C and carbonization at 600 °CKOH
Okara powder wasteOPW10Carbonization at 600 °C in N2 for 1 h, followed by mixing with a biochar/KOH/water ratio of 1:5:10; then, the sample was kept for 5 days, filtered, dried, and calcined at 600 °CKOH
Table 2. EDX elemental analysis of different biomass samples.
ElementCoffee WasteOkara Powder WasteRice StrawShrimp ShellsRice HusksPotato Peels
Mass%Atom%Mass%Atom%Mass%Atom%Mass%Atom%Mass%Atom%Mass%Atom%
C57.3564.1745.7353.3637.8856.5644.3853.418.9126.4448.1256.79
O42.6535.8352.5346.029.9711.1848.944.1755.4858.2446.6241.31
K 1.740.625.772.65 5.261.91
Ca 6.722.42
Si 46.3729.61 55.6115.31
Total100 100 100100100100100100100100
Table 3. Comparison of this study’s experimental details with those of other studies in the literature.
Biomass Precursor Sample CodePretreatment MethodsActivating AgentSBET (m2/g)References
Okara powder wasteOPW2Carbonization at 650 °C in a N2 gas flow for 1 hNo activating agent1.06This work
Okara powder wasteOPW1Carbonization at 800 °C in an Ar flow for 1 hNo activating agent1.16This work
Lotus leaves-Carbonization at 500 °C in N2 flow for 1 hNo activating agent3.82[17]
Lotus leaves-Carbonization at 500 °C in N2 flow for 1 hMelamine4.32[17]
Okara powder wasteOPW4Hydrothermal carbonization at
200 °C; heating rate of 60 °C/h; temperature of 200 °C, maintained for 4 h; weight ratio of OPW/water of 12.8 g: 40 mL
No activating agent7.01This work
Okara powder wasteOPW5Hydrothermal
carbonization at
200 °C; weight ratio of 12.8 g OPW: 6.4 g zeolite 4 mm: 40 mL water; temperature of 200 °C, maintained for 4 h; heating rate of 60 °C/h
Zeolite (4 mm in size)14.0This work
Okara powder wasteOPW3Carbonization at 600 °C in a N2 gas flow for 1 hNo activating agent20.73This work
Okara powder wasteOPW6Hydrothermal carbonization at 200 °C and then pyrolysis (two-step process) at 600 °C, with a low N2 flow for 1 h and a N2 flow rate of 1 L/mKOH and melamine 22.04This work
Okara powder wasteOPW7Carbonization at 600 °C in N2 for 1 h to make biochar; after that, biochar was mixed with KOH and water; then, the sample was kept for 48 h, dried at 120 °C, and calcined at 600 °C in a N2 flow (1 L/min)KOH (weight ratio of biochar/KOH/water was 1:4:5)104.32This work
Okara powder wasteOPW9Carbonization at 600 °C in N2 for 1 h; dry mixing process with KOHKOH (mass ratio of OPW:KOH = 1/4)147.85This work
Rice huskRHCarbonization at 600 °C in N2 for 1 hNo activating agent175.48This work
Okara powder wasteOPW8Carbonization at 600 °C in N2 for 1 h; dry mixing process with KOHKOH (mass ratio of OPW: KOH = 1/3)212.60This work
Banana peels-Hydrothermal treatment at 200 °C for 24 hNo activating agent294.6[60]
Elephant grass,-Carbonization at 600 °C in a N2 flow for 1 hKOH407[47]
Okara powder wasteOPW10Carbonization at 600 °C in N2 for 1 h, then mixed with KOH, with a biochar/KOH/water mass ratio of 1:5:10, and the sample kept for 5 daysKOH (with a biochar/KOH/water ratio of 1:5:10, with the sample kept for 5 days)594.08This work
Lotus leaf-Carbonization at 500 °C in N2 for 1 hMelamine and KOH687[17]
Firewood-Carbonization at 850 °CNa2CO3/K2CO3818[61]
Disclaimer/Publisher’s Note: The statements, opinions and data contained in all publications are solely those of the individual author(s) and contributor(s) and not of MDPI and/or the editor(s). MDPI and/or the editor(s) disclaim responsibility for any injury to people or property resulting from any ideas, methods, instructions or products referred to in the content.

