
The Asymmetric Role of Financial Commitments to Renewable Energy Projects, Public R&D Expenditure, and Energy Patents in Sustainable Development Pathways
 , , , ,
  and
and
Abstract
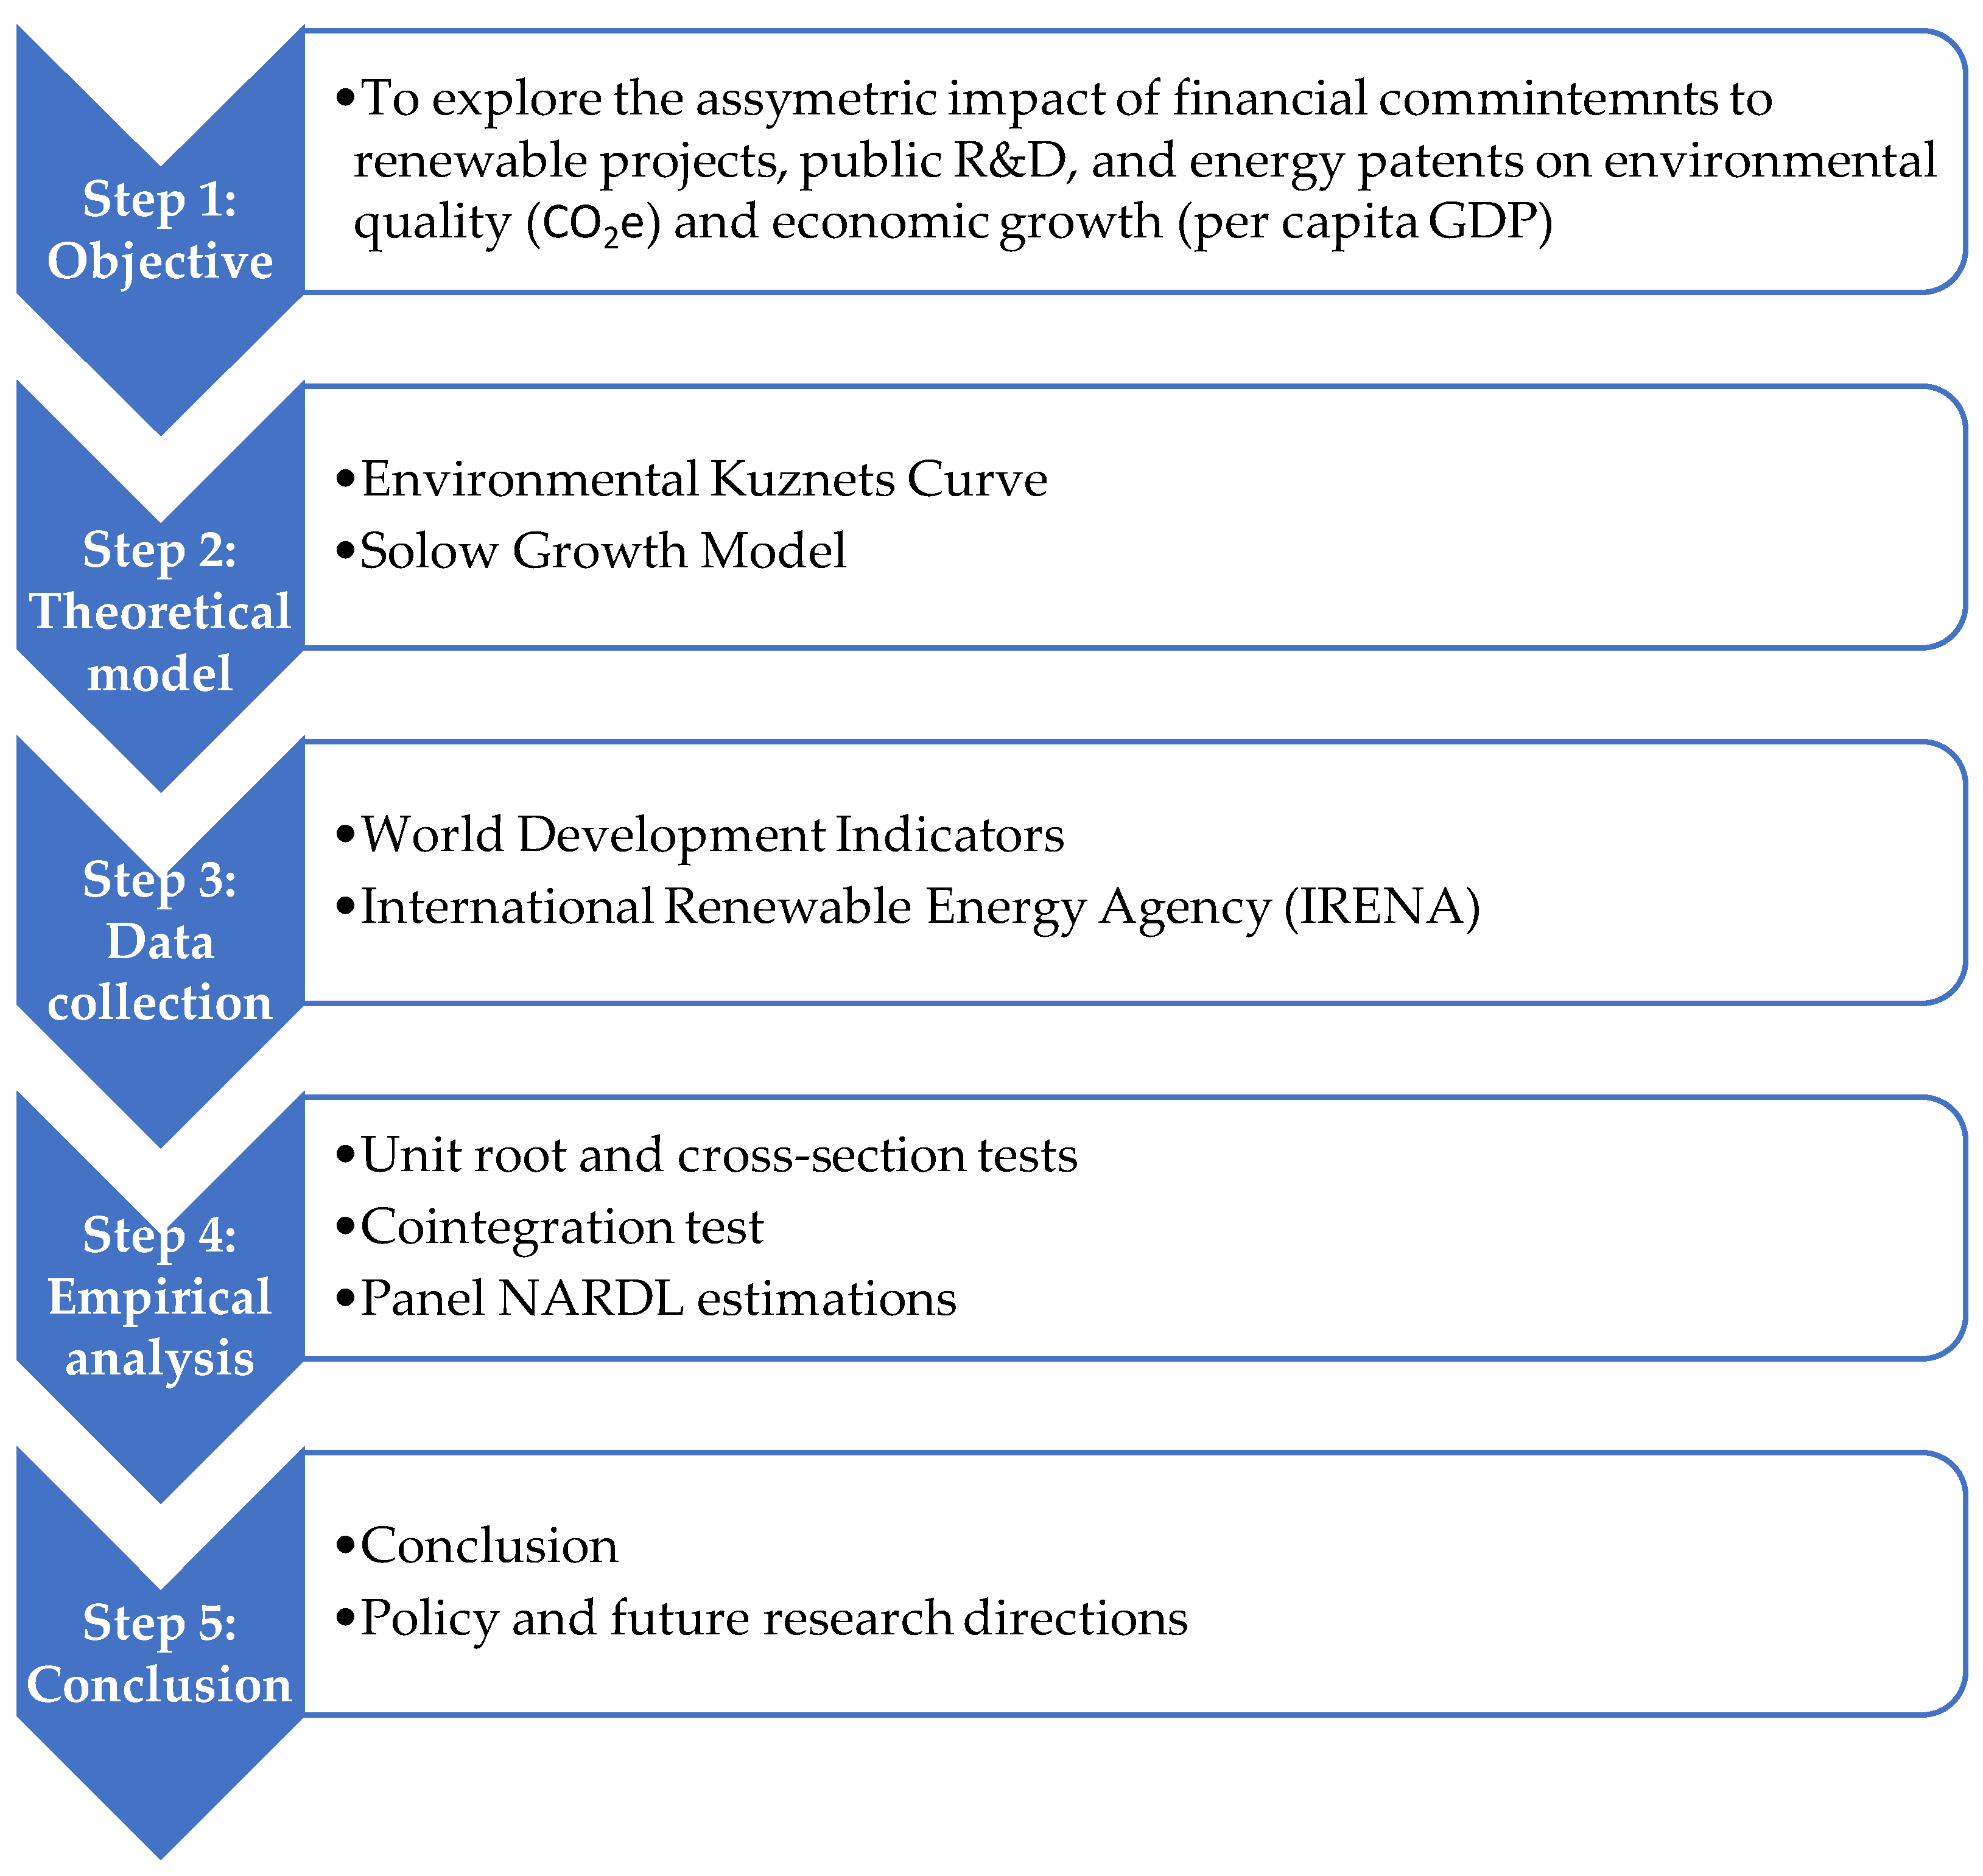
:1. Introduction
- RQ1: How do environment quality and economic growth respond to the ascending and descending movements in financial commitments to the investment in renewable energy enterprises?
- RQ2: What is the impact of the rise and fall in the public R&D budget on economic and environmental sustainability?
- RQ3: How do positive and negative shocks in energy technology innovations affect environmental quality?
2. Literature Review
2.1. Green Investment, Environmental Sustainability, and Economic Growth
2.2. Technological Innovation and Environmental Sustainability
2.2.1. Total Patent Index and Environmental Impact
2.2.2. Public R&D Expenditure and Environmental Sustainability
2.2.3. Energy Patent Index and Environmental Impact
3. Theoretical Framework and Model Construction
4. Materials and Methods
5. Results and Discussion
5.1. Preliminary Analysis
5.2. Panel Unit Root and Cointegration Tests
5.3. Nonlinear Panel ARDL Results
5.3.1. Environmental Sustainability Model
5.3.2. Economic Growth Model
6. Conclusions and Policy Implications
6.1. Concluding Remarks
6.2. Policy Insights
Author Contributions
Funding
Institutional Review Board Statement
Informed Consent Statement
Data Availability Statement
Conflicts of Interest
References
- Fang, G.; Tian, L.; Yang, Z. The construction of a comprehensive multidimensional energy index. Energy Econ. 2020, 90, 104875. [Google Scholar] [CrossRef]
- Dogan, E.; Majeed, M.T.; Luni, T. Analyzing the impacts of geopolitical risk and economic uncertainty on natural resources rents. Resour. Policy 2021, 72, 102056. [Google Scholar] [CrossRef]
- Fang, G.; Yang, K.; Tian, L.; Ma, Y. Can environmental tax promote renewable energy consumption?—An empirical study from the typical countries along the Belt and Road. Energy 2022, 260, 125193. [Google Scholar] [CrossRef]
- Udemba, E.N.; Magazzino, C.; Bekun, F.V. Modeling the nexus between pollutant emission, energy consumption, foreign direct investment, and economic growth: New insights from China. Environ. Sci. Pollut. Res. 2020, 27, 17831–17842. [Google Scholar] [CrossRef] [PubMed]
- Jia, Z.; Lin, B. How to achieve the first step of the carbon-neutrality 2060 target in China: The coal substitution perspective. Energy 2021, 233, 121179. [Google Scholar] [CrossRef]
- Liu, Z.; Deng, Z.; He, G.; Wang, H.; Zhang, X.; Lin, J.; Qi, Y.; Liang, X. Challenges and opportunities for carbon neutrality in China. Nat. Rev. Earth Environ. 2022, 3, 141–155. [Google Scholar] [CrossRef]
- Altıntaş, H.; Kassouri, Y. The impact of energy technology innovations on cleaner energy supply and carbon footprints in Europe: A linear versus nonlinear approach. J. Clean. Prod. 2020, 276, 124140. [Google Scholar] [CrossRef]
- IRENA. Global Landscape of Renewable Energy Finance [Internet]. 2020. Available online: https://www.irena.org/Data/View-data-by-topic/Finance-and-Investment/Investment-trends (accessed on 22 December 2023).
- Hoque, M.E.; Soo-Wah, L.; Bilgili, F.; Ali, M.H. Connectedness and spillover effects of US climate policy uncertainty on energy stock, alternative energy stock, and carbon future. Environ. Sci. Pollut. Res. 2023, 30, 18956–18972. [Google Scholar] [CrossRef]
- Polzin, F.; Egli, F.; Steffen, B.; Schmidt, T.S. How do policies mobilize private finance for renewable energy?—A systematic review with an investor perspective. Appl. Energy 2019, 236, 1249–1268. [Google Scholar] [CrossRef]
- Batool, Z.; Raza, S.M.F.; Ali, S.; Abidin, S.Z.U. ICT, renewable energy, financial development, and CO2 emissions in developing countries of East and South Asia. Environ. Sci. Pollut. Res. 2022, 29, 35025–35035. [Google Scholar] [CrossRef]
- Bilgili, F.; Kuskaya, S.; Magazzino, C.; Khan, K.; Hoque, M.E.; Alnour, M.; Khan, K.; Onderl, S. The mutual effects of residential energy demand and climate change in the United States: A wavelet analysis. Environ. Sustain. Indic. 2024, 22, 100384. [Google Scholar] [CrossRef]
- Bilgili, F.; Önderol, S.; Alnour, M.; Balsalobre-lorente, D. Renewable energy and technology adoption: Mitigating CO2 emissions through implementation strategies. Nat. Resour. Forum 2024, 1–58. [Google Scholar] [CrossRef]
- Shah, W.U.H.; Hao, G.; Yan, H.; Yasmeen, R.; Padda, I.U.H.; Ullah, A. The impact of trade, financial development and government integrity on energy efficiency: An analysis from G7-Countries. Energy 2022, 255, 124507. [Google Scholar] [CrossRef]
- Muğaloğlu, E.; Kuşkaya, S.; Aldieri, L.; Alnour, M.; Hoque, M.E.; Magazzino, C.; Bilgili, F. Dynamic regime differences in the market behavior of primary natural resources in response to geopolitical risk and economic policy uncertainty. Resour. Policy 2023, 87, 104340. [Google Scholar] [CrossRef]
- Fang, G.; Yang, K.; Chen, G.; Tian, L. Environmental protection tax superseded pollution fees, does China effectively abate ecological footprints? J. Clean. Prod. 2023, 388, 135846. [Google Scholar] [CrossRef]
- Sinha, A.; Sengupta, T.; Alvarado, R. Interplay between technological innovation and environmental quality: Formulating the SDG policies for next 11 economies. J. Clean. Prod. 2020, 242, 118549. [Google Scholar] [CrossRef]
- Alnour, M.; Awan, A.; Hossain, M.E. Towards a green transportation system in Mexico: The role of renewable energy and transport public-private partnership to curb emissions. J. Clean. Prod. 2024, 442, 140984. [Google Scholar] [CrossRef]
- Min, S.; Kim, J.; Sawng, Y.-W. The effect of innovation network size and public R&D investment on regional innovation efficiency. Technol. Forecast. Soc. Chang. 2020, 155, 119998. [Google Scholar]
- Yumei, H.; Iqbal, W.; Irfan, M.; Fatima, A. The dynamics of public spending on sustainable green economy: Role of technological innovation and industrial structure effects. Environ. Sci. Pollut. Res. 2022, 29, 22970–22988. [Google Scholar] [CrossRef]
- Bilgili, F.; Balsalobre-Lorente, D.; Kuşkaya, S.; Alnour, M.; Önderol, S.; Hoque, M.E. Are research and development on energy efficiency and energy sources effective in the level of CO2 emissions? Fresh evidence from EU data. Environ. Dev. Sustain. 2023, 1–37. [Google Scholar] [CrossRef]
- Yasmeen, R.; Hao, G.; Ye, Y.; Hassan Shah, W.U.; Kamal, M.A. The role of governance quality on mobilizing environmental technology and environmental taxations for renewable energy and ecological sustainability in belt and road economies: A methods of Moment’s quantile regression. Energy Strateg. Rev. 2023, 50, 101258. [Google Scholar] [CrossRef]
- Huang, J.; Li, X.; Wang, Y.; Lei, H. The effect of energy patents on China’s carbon emissions: Evidence from the STIRPAT model. Technol. Forecast. Soc. Chang. 2021, 173, 121110. [Google Scholar] [CrossRef]
- Rokhmawati, A. The nexus among green investment, foreign ownership, export, greenhouse gas emissions, and competitiveness. Energy Strateg. Rev. 2021, 37, 100679. [Google Scholar] [CrossRef]
- Saeed Meo, M.; Karim, M.Z.A. The role of green finance in reducing CO2 emissions: An empirical analysis. Borsa Istanb. Rev. 2022, 22, 169–178. [Google Scholar] [CrossRef]
- Zhou, S.; Tong, Q.; Pan, X.; Cao, M.; Wang, H.; Gao, J. Research on low-carbon energy transformation of China necessary to achieve the Paris agreement goals: A global perspective. Energy Econ. 2021, 95, 105137. [Google Scholar] [CrossRef]
- Luo, R.; Ullah, S.; Ali, K. Pathway towards sustainability in selected asian countries: Influence of green investment, technology innovations, and economic growth on CO2 emission. Sustainability 2021, 13, 12873. [Google Scholar] [CrossRef]
- Shen, Y.; Su, Z.W.; Malik, M.Y.; Umar, M.; Khan, Z.; Khan, M. Does green investment, financial development and natural resources rent limit carbon emissions? A provincial panel analysis of China. Sci. Total Environ. 2021, 755, 142538. [Google Scholar] [CrossRef] [PubMed]
- Sharif, A.; Saqib, N.; Dong, K.; Khan, S.A.R. Nexus between green technology innovation, green financing, and CO2 emissions in the G7 countries: The moderating role of social globalisation. Sustain. Dev. 2022, 30, 1934–1946. [Google Scholar] [CrossRef]
- Wang, L.; Su, C.W.; Ali, S.; Chang, H.L. How China is fostering sustainable growth: The interplay of green investment and production-based emission. Environ. Sci. Pollut. Res. 2020, 27, 39607–39618. [Google Scholar] [CrossRef]
- Wan, Y.; Sheng, N. Clarifying the relationship among green investment, clean energy consumption, carbon emissions, and economic growth: A provincial panel analysis of China. Environ. Sci. Pollut. Res. 2022, 29, 9038–9052. [Google Scholar] [CrossRef]
- Li, Z.-Z.; Li, R.Y.M.; Malik, M.Y.; Murshed, M.; Khan, Z.; Umar, M. Determinants of carbon emission in China: How good is green investment? Sustain. Prod. Consum. 2021, 27, 392–401. [Google Scholar] [CrossRef]
- Caglar, A.E.; Avci, S.B.; Ahmed, Z.; Gökçe, N. Assessing the role of green investments and green innovation in ecological sustainability: From a climate action perspective on European countries. Sci. Total Environ. 2024, 928, 172527. [Google Scholar] [CrossRef] [PubMed]
- Sun, Y.; Guan, W.; Razzaq, A.; Shahzad, M.; Binh An, N. Transition towards ecological sustainability through fiscal decentralization, renewable energy and green investment in OECD countries. Renew. Energy 2022, 190, 385–395. [Google Scholar] [CrossRef]
- Ren, S.; Hao, Y.; Wu, H. How Does Green Investment Affect Environmental Pollution? Evidence from China. Environ. Resour. Econ. 2022, 81, 25–51. [Google Scholar] [CrossRef]
- Lyeonov, S.; Pimonenko, T.; Bilan, Y.; Štreimikienė, D.; Mentel, G. Assessment of Green Investments’ Impact on Sustainable Development: Linking Gross Domestic Product Per Capita, Greenhouse Gas Emissions and Renewable Energy. Energies 2019, 12, 3891. [Google Scholar] [CrossRef]
- D’Angelo, V.; Cappa, F.; Peruffo, E. Green manufacturing for sustainable development: The positive effects of green activities, green investments, and non-green products on economic performance. Bus. Strateg. Environ. 2023, 32, 1900–1913. [Google Scholar] [CrossRef]
- He, L.; Zhang, L.; Zhong, Z.; Wang, D.; Wang, F. Green credit, renewable energy investment and green economy development: Empirical analysis based on 150 listed companies of China. J. Clean. Prod. 2019, 208, 363–372. [Google Scholar] [CrossRef]
- Khan, A.N.; En, X.; Raza, M.Y.; Khan, N.A.; Ali, A. Sectorial study of technological progress and CO2 emission: Insights from a developing economy. Technol. Forecast. Soc. Chang. 2020, 151, 119862. [Google Scholar] [CrossRef]
- Chatti, W. Moving towards environmental sustainability: Information and communication technology (ICT), freight transport, and CO2 emissions. Heliyon 2021, 7, 08190. [Google Scholar] [CrossRef]
- Demircan Çakar, N.; Gedikli, A.; Erdoğan, S.; Yıldırım, D.Ç. A comparative analysis of the relationship between innovation and transport sector carbon emissions in developed and developing Mediterranean countries. Environ. Sci. Pollut. Res. 2021, 28, 45693–45713. [Google Scholar] [CrossRef]
- Awan, A.; Alnour, M.; Jahanger, A.; Chukwuma, O.J. Do technological innovation and urbanization mitigate carbon dioxide emissions from the transport sector? Technol. Soc. 2022, 71, 102128. [Google Scholar] [CrossRef]
- Rej, S.; Bandyopadhyay, A.; Das, N.; Hossain, M.E.; Islam, M.S.; Bera, P.; Yeediballi, T. The asymmetric influence of environmental-related technological innovation on climate change mitigation: What role do FDI and renewable energy play? Environ. Sci. Pollut. Res. 2023, 30, 14916–14931. [Google Scholar] [CrossRef] [PubMed]
- Hossain, M.R.; Rana, M.J.; Saha, S.M.; Haseeb, M.; Islam, M.S.; Amin, M.R.; Hossain, E. Role of energy mix and eco-innovation in achieving environmental sustainability in the USA using the dynamic ARDL approach: Accounting the supply side of the ecosystem. Renew. Energy 2023, 215, 118925. [Google Scholar] [CrossRef]
- Das, N.; Gangopadhyay, P.; Alam, M.M.; Mahmood, H.; Bera, P.; Khudoykulov, K.; Dey, L.; Hossain, E. Does greenwashing obstruct sustainable environmental technologies and green financing from promoting environmental sustainability? Analytical evidence from the Indian economy. Sustain. Dev. 2024, 32, 1069–1080. [Google Scholar] [CrossRef]
- Ganda, F. The impact of innovation and technology investments on carbon emissions in selected organisation for economic Co-operation and development countries. J. Clean. Prod. 2019, 217, 469–483. [Google Scholar] [CrossRef]
- Ahmed, Z.; Cary, M.; Ali, S.; Murshed, M.; Ullah, H.; Mahmood, H. Moving toward a green revolution in Japan: Symmetric and asymmetric relationships among clean energy technology development investments, economic growth, and CO2 emissions. Energy Environ. 2021, 33, 0958305X211041780. [Google Scholar] [CrossRef]
- Jiao, Z.; Sharma, R.; Kautish, P.; Hussain, H.I. Unveiling the asymmetric impact of exports, oil prices, technological innovations, and income inequality on carbon emissions in India. Resour. Policy 2021, 74, 102408. [Google Scholar] [CrossRef]
- Ma, Q.; Murshed, M.; Khan, Z. The nexuses between energy investments, technological innovations, emission taxes, and carbon emissions in China. Energy Policy 2021, 155, 112345. [Google Scholar] [CrossRef]
- Petrović, P.; Lobanov, M.M. The impact of R&D expenditures on CO2 emissions: Evidence from sixteen OECD countries. J. Clean. Prod. 2020, 248, 119187. [Google Scholar]
- Li, L.; McMurray, A.; Li, X.; Gao, Y.; Xue, J. The diminishing marginal effect of R&D input and carbon emission mitigation. J. Clean. Prod. 2021, 282, 124423. [Google Scholar]
- Wang, B.; Sun, Y.; Wang, Z. Agglomeration effect of CO2 emissions and emissions reduction effect of technology: A spatial econometric perspective based on China’s province-level data. J. Clean. Prod. 2018, 204, 96–106. [Google Scholar] [CrossRef]
- Cheng, Y.; Yao, X. Carbon intensity reduction assessment of renewable energy technology innovation in China: A panel data model with cross-section dependence and slope heterogeneity. Renew. Sustain. Energy Rev. 2021, 135, 110157. [Google Scholar] [CrossRef]
- Wang, Z.; Zhu, Y. Do energy technology innovations contribute to CO2 emissions abatement? A spatial perspective. Sci. Total Environ. 2020, 726, 138574. [Google Scholar] [CrossRef] [PubMed]
- Wang, Z.; Yang, Z.; Zhang, Y.; Yin, J. Energy technology patents–CO2 emissions nexus: An empirical analysis from China. Energy Policy 2012, 42, 248–260. [Google Scholar] [CrossRef]
- Kuznets, S. Economic growth and income inequality. Am. Econ. Rev. 1955, 45, 1–28. [Google Scholar]
- Ulucak, R.; Bilgili, F. A reinvestigation of EKC model by ecological footprint measurement for high-, middle-, and low-income countries. J. Clean. Prod. 2018, 188, 144–157. [Google Scholar] [CrossRef]
- Alnour, M. Do Innovation in Environmental- Related Technologies and Renewable Energies Mitigate the Transport-Based CO2 Emissions in Turkey? Front. Environ. Sci. 2022, 10, 1–20. [Google Scholar] [CrossRef]
- Romer, D. Advanced Macroeconomics, 4th ed.; McGraw-Hill: New York, NY, USA, 2012. [Google Scholar]
- Orea Sánchez, L.; Álvarez Pinilla, A.M. Alternative specifications of human capital in production functions. Econ. Bus. Lett. 2022, 11, 172–179. [Google Scholar] [CrossRef]
- Agrrawal, P. An automation algorithm for harvesting capital market information from the web. Manag. Financ. 2009, 35, 427–438. [Google Scholar]
- Jia, Z.; Wen, S.; Sun, Z. Current relationship between coal consumption and the economic development and China’s future carbon mitigation policies. Energy Policy 2022, 162, 112812. [Google Scholar] [CrossRef]
- Shin, Y.; Yu, B.; Greenwood-Nimmo, M. Modelling asymmetric cointegration and dynamic multipliers in a nonlinear ARDL framework. In Festschrift in Honor of Peter Schmidt; Springer: Berlin/Heidelberg, Germany, 2014; pp. 281–314. [Google Scholar]
- Alnour, M.; ALTINTAŞ, H.; Rahman, M.N. Unveiling the asymmetric response of global food prices to the energy prices shocks and economic policy uncertainty. World Dev. Sustain. 2023, 3, 100083. [Google Scholar] [CrossRef]
- Tolliver, C.; Keeley, A.R.; Managi, S. Policy targets behind green bonds for renewable energy: Do climate commitments matter? Technol. Forecast. Soc. Chang. 2020, 157, 120051. [Google Scholar] [CrossRef]
- IRENA. Renewable Energy Finance Flows [Internet]. Abu Dhabi. 2023. Available online: https://www.irena.org/Energy-Transition/Finance-and-investment/Investmen (accessed on 22 December 2023).
- Ulucak, R.; Danish; Kassouri, Y. An assessment of the environmental sustainability corridor: Investigating the non-linear effects of environmental taxation on CO2 emissions. Sustain. Dev. 2020, 28, 1010–1018. [Google Scholar]
- Kocak, E.; Alnour, M. Energy R&D expenditure, bioethanol consumption, and greenhouse gas emissions in the United States: Non-linear analysis and political implications. J. Clean. Prod. 2022, 374, 133887. [Google Scholar]
- Alvarez-Herranz, A.; Balsalobre-Lorente, D.; Shahbaz, M.; Cantos, J.M. Energy innovation and renewable energy consumption in the correction of air pollution levels. Energy Policy 2017, 105, 386–397. [Google Scholar] [CrossRef]
- Al-Mulali, U.; Solarin, S.A.; Ozturk, I. Investigating the presence of the environmental Kuznets curve (EKC) hypothesis in Kenya: An autoregressive distributed lag (ARDL) approach. Nat. Hazards 2016, 80, 1729–1747. [Google Scholar] [CrossRef]
- Nguyen, H.M. The relationship between urbanization and economic growth: An empirical study on ASEAN countries. Int. J. Soc. Econ. 2018, 2, 316–339. [Google Scholar] [CrossRef]

| Variable | Description | Source |
|---|---|---|
| CO2 | “CO2 emissions (metric tons per capita) | World Bank (World Development Indicators) |
| TFC | The financial commitments in this context refer to the monetary transactions (measured in 2020 USD million) made as commitments from public institutions, such as governments, multilateral development banks, and other public finance institutions. These commitments are formal agreements to allocate financial resources to one or more countries. The reported flows are adjusted to account for currency exchange rates and inflation, bringing them to a standardized base year. | International Renewable Energy Agency (IRENA) |
| R&D | Public research and development expenditure, measured in millions of dollars | World Bank (World Development Indicators) |
| EPT | Patents on environmental technologies | World Bank (World Development Indicators) |
| Y | Gross domestic product per capita (constant 2015 USD) | World Bank (World Development Indicators) |
| URB | Urban population growth rate (annual %) | World Bank (World Development Indicators)” |
| Variables | Mean | Std. Dev. | Min. | Max. |
|---|---|---|---|---|
| Y | 18,582.94 | 19,685.52 | 966.15 | 76,005.21 |
| TFC | 299.29 | 995.53 | 0.0012 | 11,354.11 |
| CO2 | 5.84 | 3.82 | 0.76 | 17.43 |
| R&D | 1.13 | 0.96 | 0.08 | 3.39 |
| EPT | 12.02 | 5.75 | 2.75 | 55.29 |
| URB | 1.32 | 1.39 | −1.62 | 12.77 |
| Variable | CD-Test | p-Value | Corr. | Abs (Corr) |
|---|---|---|---|---|
| LCO2 | 11.51 | 0.01 | 0.12 | 0.56 |
| LY | 41.60 | 0.00 | 0.58 | 0.77 |
| LY2 | 41.60 | 0.00 | 0.58 | 0.77 |
| LTFC | 10.63 | 0.02 | 0.11 | 0.24 |
| LR&D | 11.37 | 0.01 | 0.22 | 0.43 |
| LEPT | 13.27 | 0.00 | 0.18 | 0.34 |
| PP—Fisher Chi-Square | ADF—Fisher Chi-Square | |||
|---|---|---|---|---|
| Level | First-Difference | Level | First-Difference | |
| LCO2 | 97.99 (0.01) * | 179.24 (0.00) * | 82.10 (0.11) | 108.56 (0.001) * |
| LY | 55.47 (0.86) | 152.53 (0.00) * | 36.98 (0.99) | 115.01 (0.000) * |
| LY2 | 49.34 (0.96) | 134.95 (0.00) * | 33.13 (0.99) | 107.27 (0.001) * |
| LTFC | 160.52 (0.00) * | 302.12 (0.00) * | 73.91 (0.001) * | 79.42 (0.00) * |
| LR&D | 160.52 (0.00) * | 302.13 (0.00) * | 73.91 (0.00) * | 79.42 (0.00) * |
| LEPT | 105.95 (0.00) * | 290.98 (0.00) * | 63.07 (0.43) | 119.22 (0.00) * |
| Pedroni Test | Environmental Model | Economic Growth Model | ||
|---|---|---|---|---|
| Statistic | p-Value | Statistic | p-Value | |
| “Modified Phillips–Perron t | 6.08 | 0.00 | 6.40 | 0.00 |
| Phillips–Perron t | −1.87 | 0.03 | −0.22 | 0.41 |
| Augmented Dickey–Fuller t | −3.24 | 0.00 | −2.49 | 0.00 |
| Kao test | ||||
| Modified Dickey–Fuller t | 2.76 | 0.00 | 3.94 | 0.00 |
| Dickey–Fuller t | 2.00 | 0.02 | 3.67 | 0.00 |
| Augmented Dickey–Fuller t | 2.52 | 0.00 | 3.64 | 0.00 |
| Unadjusted Modified Dickey–Fuller t | 0.49 | 0.32 | 3.38 | 0.00 |
| Adjusted Dickey–Fuller t” | −0.32 | 0.37 | 2.78 | 0.00 |
| Variable | Coef. | Std. Err. | Z | P > Z | [95% Conf. Interval] | |
|---|---|---|---|---|---|---|
| 0.0012481 | 0.0001959 | 6.37 | 0.000 | 0.0008641 | 0.001632 | |
| 0.0003351 | 0.0000611 | 5.49 | 0.000 | 0.0002154 | 0.000454 | |
| −0.0001732 | 0.000024 | −7.21 | 0.000 | −0.0002203 | −0.00012 | |
| −1.84 | 1.85 | −9.95 | 0.000 | −2.20 | −1.48 | |
| −0.4055122 | 0.06801 | −5.96 | 0.000 | −0.5388093 | −0.27221 | |
| −0.0027711 | 0.0063226 | −0.44 | 0.661 | −0.0151631 | −0.009620 | |
| −0.0002685 | 0.0015033 | −0.18 | 0.858 | 0.0032148 | −0.002677 | |
| 0.0006952 | 0.0004596 | 1.51 | 0.130 | 0.0002056 | 0.001596 | |
| 1.39 | 7.40 | 0.19 | 0.851 | −2.20 | −1.48 | |
| 3.683747 | 0.7250567 | 5.08 | 0.000 | 2.262662 | 0.104832 | |
| Log Likelihood: | 178.2417 | Hausman 3.53 (0.1708) | ||||
| Wald LR: | 30.30 (0.0000) | |||||
| Wald SR: | 0.84 (0.3588) | |||||
| Model with R&D | ||||||
| −2.249939 | 0.1382759 | −16.27 | 0.000 | −2.520955 | −1.97892 | |
| −2.190718 | 0.1343457 | −16.31 | 0.000 | −2.45403 | −1.92740 | |
| −0.3400508 | 0.0606919 | −5.60 | 0.000 | −0.4590046 | −0.22109 | |
| 0.0055994 | 0.0121095 | 0.46 | 0.644 | −0.0181347 | 0.029333 | |
| 0.0055759 | 0.0111451 | 0.50 | 0.617 | −0.0162681 | 0.027419 | |
| 2.011629 | 0.3630252 | 5.54 | 0.000 | 1.300112 | 2.723145 | |
| Log Likelihood: | 169.4319 | Hausman 0.30 (0.8599) | ||||
| Wald LR: | (4.21) | (0.0402) | ||||
| Wald SR: | (0.62) | (0.4292) | ||||
| Variable | Coef. | Std. Err. | Z | P > I z I | [95% Conf. Interval] | |
|---|---|---|---|---|---|---|
| −3.858376 | 0.3468152 | −11.13 | 0.000 | −4.538121 | −3.17863 | |
| −1.44266 | 0.3303983 | −4.37 | 0.000 | −2.090229 | −0.795091 | |
| 5870.268 | 116.8475 | 50.24 | 0.000 | 5641.251 | 6099.285 | |
| 0.0456333 | 0.0269012 | 1.70 | 0.090 | −0.0070921 | 0.0983587 | |
| −17.03118 | 16.8422 | −1.01 | 0.312 | −50.04129 | 15.97893 | |
| 0.2769759 | 0.2185172 | 1.27 | 0.205 | −0.15131 | 0.7052618 | |
| 522.5783 | 349.5142 | 1.50 | 0.135 | −162.457 | 1207.614 | |
| −85.02652 | 807.1955 | −0.11 | 0.916 | −1667.101 | 1497.048 | |
| Log Likelihood: | −1709.617 | |||||
| Wald LR: | 89.84 (0.000) | |||||
| Wald SR: | 1.06 (0.3588) | |||||
| Model with EPT | ||||||
| −4.999979 | 3.058467 | −1.63 | 0.102 | −10.99446 | 0.9945061 | |
| −2.717644 | 2.756065 | −0.99 | 0.324 | −8.119431 | 2.684144 | |
| −0.0637964 | 0.0412281 | −1.55 | 0.122 | −0.144602 | 0.0170092 | |
| 10.77495 | 23.44446 | 0.46 | 0.646 | −35.17533 | 56.72524 | |
| 10.3029 | 21.61027 | 0.48 | 0.634 | 32.05245 | 52.65824 | |
| 899.2992 | 649.0195 | 1.39 | 0.166 | −372.7557 | 2171.354 | |
| Log Likelihood: | 2171.354 | |||||
| Wald LR: | 0.60 (0.4382) | |||||
| Wald SR: | 0.78 (0.3762) | |||||
Disclaimer/Publisher’s Note: The statements, opinions and data contained in all publications are solely those of the individual author(s) and contributor(s) and not of MDPI and/or the editor(s). MDPI and/or the editor(s) disclaim responsibility for any injury to people or property resulting from any ideas, methods, instructions or products referred to in the content. |
© 2024 by the authors. Licensee MDPI, Basel, Switzerland. This article is an open access article distributed under the terms and conditions of the Creative Commons Attribution (CC BY) license (https://creativecommons.org/licenses/by/4.0/).
Share and Cite
Alnour, M.; Önden, A.; Hasseb, M.; Önden, İ.; Rehman, M.Z.; Esquivias, M.A.; Hossain, M.E. The Asymmetric Role of Financial Commitments to Renewable Energy Projects, Public R&D Expenditure, and Energy Patents in Sustainable Development Pathways. Sustainability 2024, 16, 5503. https://doi.org/10.3390/su16135503
Alnour M, Önden A, Hasseb M, Önden İ, Rehman MZ, Esquivias MA, Hossain ME. The Asymmetric Role of Financial Commitments to Renewable Energy Projects, Public R&D Expenditure, and Energy Patents in Sustainable Development Pathways. Sustainability. 2024; 16(13):5503. https://doi.org/10.3390/su16135503
Chicago/Turabian StyleAlnour, Mohammed, Abdullah Önden, Mouad Hasseb, İsmail Önden, Mohd Ziaur Rehman, Miguel Angel Esquivias, and Md. Emran Hossain. 2024. "The Asymmetric Role of Financial Commitments to Renewable Energy Projects, Public R&D Expenditure, and Energy Patents in Sustainable Development Pathways" Sustainability 16, no. 13: 5503. https://doi.org/10.3390/su16135503