Article

Environmental Impact and Sustainability of Bioplastic Production from Food Waste

by
Katerina Synani
1,
Konstadinos Abeliotis
2,*,
Kelly Velonia
3,
Angeliki Maragkaki
4,
Thrassyvoulos Manios
4 and
Katia Lasaridi
1
1
Department of Geography, Harokopio University of Athens, 17676 Kallithea, Greece
2
Department of Economics and Sustainable Development, Harokopio University of Athens, 17676 Kallithea, Greece
3
Department of Materials Science and Engineering, University of Crete, 70013 Heraklion, Greece
4
Department of Agriculture, Hellenic Mediterranean University, 71410 Heraklion, Greece
*
Author to whom correspondence should be addressed.
Sustainability 2024, 16(13), 5529; https://doi.org/10.3390/su16135529
Submission received: 26 April 2024 / Revised: 21 June 2024 / Accepted: 24 June 2024 / Published: 28 June 2024

Abstract

:
Plastic generation exacerbates the challenge of solid waste management. Moreover, plastics emit substantial amounts of microplastics, which infiltrate the environment and food chain, posing significant environmental risks. Compounded by their production from fossil fuels, such as crude oil and natural gas, plastics present a formidable environmental concern. As a result, bioplastics are an attractive alternative to fossil-based plastics since they use renewable energy sources, aim to alleviate worries about reliance on fossil fuels, and are biodegradable, further enhancing their environmental appeal. Along similar lines, the utilization of food waste to produce bioplastics is attracting international interest. The current study presents the results of a life cycle assessment conducted on bioplastic production from food waste, carried out in a pilot-scale reactor located in Greece. The objective was to ascertain the comparative sustainability of recovering food waste for bioplastic production versus utilizing cultivable raw materials. To this end, an equivalent amount of polylactic acid was produced from corn. The findings revealed a reduction in climate change, eutrophication, and ecotoxicity as a result of the study process. Despite these environmental benefits, the study highlighted that energy consumption throughout the process poses a significant environmental burden. This aspect calls for attention and modification to enhance the entire sustainability of the process.

1. Introduction

The escalation of concerns surrounding solid waste management correlates with the global surge in population and affluence [1], further fueled by the escalating demand for plastic products and packaging. In 2021, global plastic production increased by 4% to exceed 390.7 million tonnes, underscoring the persistent and robust demand for plastics. During the same period, the EU27 + 3 utilized 5.5 million tonnes of post-consumer recycled plastics, marking a 20% increase over 2018, and constituting around 10% of recycled content in plastics conversion [2]. Forecasts indicate that plastic consumption is expected to quadruple by 2060 [3].
Conversely, conventional plastic waste disposal methods remain insufficient, particularly in developing countries [4,5]. Plastic manufacturing accounts for 4% of total global CO2 emissions. Non-biodegradable plastics endanger ecosystems and human health [6], with their degradation producing micro- and nano-plastics [7], impacting ecosystem quality, human health [8], and climate change [9].
The linear consumption methods prevalent in industrialized countries, termed ‘throw-away’ [10] and ‘take-make-dispose’ [11], have led to the global proliferation of plastic waste [12]. This issue has been exacerbated by supply chain globalization [13], mass consumption, and the COVID-19 epidemic [14].
The European Commission [15] has developed a circular economy plan for plastics to optimize resource utilization and extend product lifetimes through multiple use cycles [16]. This concept combines economic approaches with biological aspects, offering the potential for sustainable change [17]. Bioplastics, also known as biomass-based biopolymers, are a viable alternative to petroplastics since they are biodegradable and compostable [18], effectively closing the carbon cycle [19]. Despite representing only 1.5% of the plastics market, bioplastics are estimated to increase their market share [20]. Their growing market share can contribute to reducing reliance on fossil fuels [21], and facilitate the transition to a circular economy [22]. However, this will require a steady supply of bioplastic raw materials [23], and the implementation of appropriate recycling and recovery technologies [24]. Bio-waste, including food waste, holds potential as a carbon feedstock for bio-based commodities and biomaterials [16], which reduces the cost of bioplastic production [25].
The diversion of food waste from landfills to innovative processing mechanisms for converting waste into valuable products or raw materials has seen significant progress in recent years [25]. Furthermore, with the depletion of fossil resources and the challenges posed by climate change, there is an urgent need for a transition to renewable and low-carbon production methods [26].
This has led to the production of bioplastics like polylactic acid (PLA), polyhydroxyalkanoate (PHA), and bio-polypropylene [27], which are derived from food or biomass resources like starch, corn, sugarcane, and lignocellulosic components. These bioplastics play a vital role in transitioning towards a circular economy [28], reducing mineral extraction and lowering carbon footprints, potentially mitigating end-of-life environmental burdens [16].
The raw materials for bioplastics are categorized into three generations based on their state of development. First-generation feedstocks typically include carbohydrate-rich plants suitable for human or animal consumption, such as corn, which is abundant in starch and readily available [29]. First-generation raw materials are based on intensive agriculture, compete with food and feed, and have detrimental effects on humans and the environment [27]. Consequently, alternative raw materials have been tested. Second-generation raw materials comprise basic ingredients unsuitable for food or feed. These may include non-edible crops (e.g., cellulose) or byproducts of first-generation feedstocks, such as corn “hulls” or sugarcane molasses. Separately collected food waste, i.e., that has not ended up in the municipal waste stream, is a second-generation feedstock for bioplastics production [30]. The third-generation raw materials are the most innovative, still in the early stages of development. It contains both algal biomass and industrial or municipal waste, which are being transformed into raw materials through improved processes [31].
The utilization of alternative biomass sources holds promise for producing biomass-based commodities with reduced environmental and socioeconomic implications without competing with the food industry [32]. While food waste represents a valuable raw material for bioplastic production [33], it requires pre-treatment to enhance or modify its physicochemical and biological properties. Proper conversion of such wastes into value-added products can prevent significant economic [34] and energy losses [35].
Despite advancements, industrial-scale production of bioplastics still faces challenges that need addressing. Factors like techno-economics, profitability, raw material availability [36], and market demands must be considered for large-scale manufacturing. The environmental benefits of bioplastics are driving their adoption and promotion [37], with bioplastic production from food waste emerging as a sustainable alternative [38]. Private undertakings need to accurately quantify and demonstrate these benefits to avoid misleading claims [39].
A range of studies have explored the conversion of food waste into bioplastics, highlighting the potential for sustainable and environmentally friendly production. Sakai et al. [40] and Yu et al. [41] both propose innovative methods for this conversion. Sakai et al. [40] focus on the production of high-quality poly-L-lactate (PLLA) biodegradable plastics from food waste, while Yu et al. [41] investigate the use of various carbohydrates and malt wastes as carbon sources for bioplastic production. Moreover, Perotto et al. [42] contribute to the field by introducing a water-based process for converting vegetable waste into bioplastic films, which are biodegradable and environmentally friendly. However, there are significant knowledge gaps in this area, particularly in the environmental assessment of bioplastic properties and their impact on food packaging. Kakadellis and Harris [43] emphasize the need to consider the entire life cycle of food packaging and the trade-offs involved. The potential of converting food waste into bioplastic is a promising path for addressing both environmental and waste management challenges [44]. Bagnani et al. [45] specifically demonstrate the feasibility of producing bioplastics from soy waste on an industrial scale. Furthermore, the lack of standardized methodologies for assessing the biodegradability of bio-based polymers, a key aspect of bioplastic assessment, is highlighted [44]. These gaps underscore the need for further research to optimize the conversion of food waste into bioplastic and ensure its environmental sustainability.
The present research delves into the environmental impact assessment of converting food waste into bioplastic, conducted within the framework of the A2UFood Project [46]. The project aimed to reduce food waste by developing bioplastic production from food waste, aligning with the principles of the circular economy [47]. Tools such as life cycle assessment (LCA) provide valuable insights into the environmental repercussions of a material or product across its full life cycle, from raw material acquisition to disposal [32]. Recently, Ali et al. [16] reviewed several LCA studies that compare the environmental impacts of specific bioplastics to those of petrochemical plastics. LCA studies on bioplastics demonstrate significant differences in selected environmental impacts [30].
The novelty of the study lies in the fact that we employed life cycle assessment (LCA) to examine the environmental impact of producing bioplastic from food waste in a pilot scale unit for the first time in Greece, in addition to the environmental benefits of diverting the same quantity of food waste from landfills. Following the ISO 14040 family standards, LCA investigates environmental consequences across a product’s value chain, including goal and scope definition, inventory analysis, impact assessment, and interpretation. Depending on the assessment’s aims, LCA might include all system inputs and outputs, such as materials, resources, energy, and emissions [48].

2. Methodology

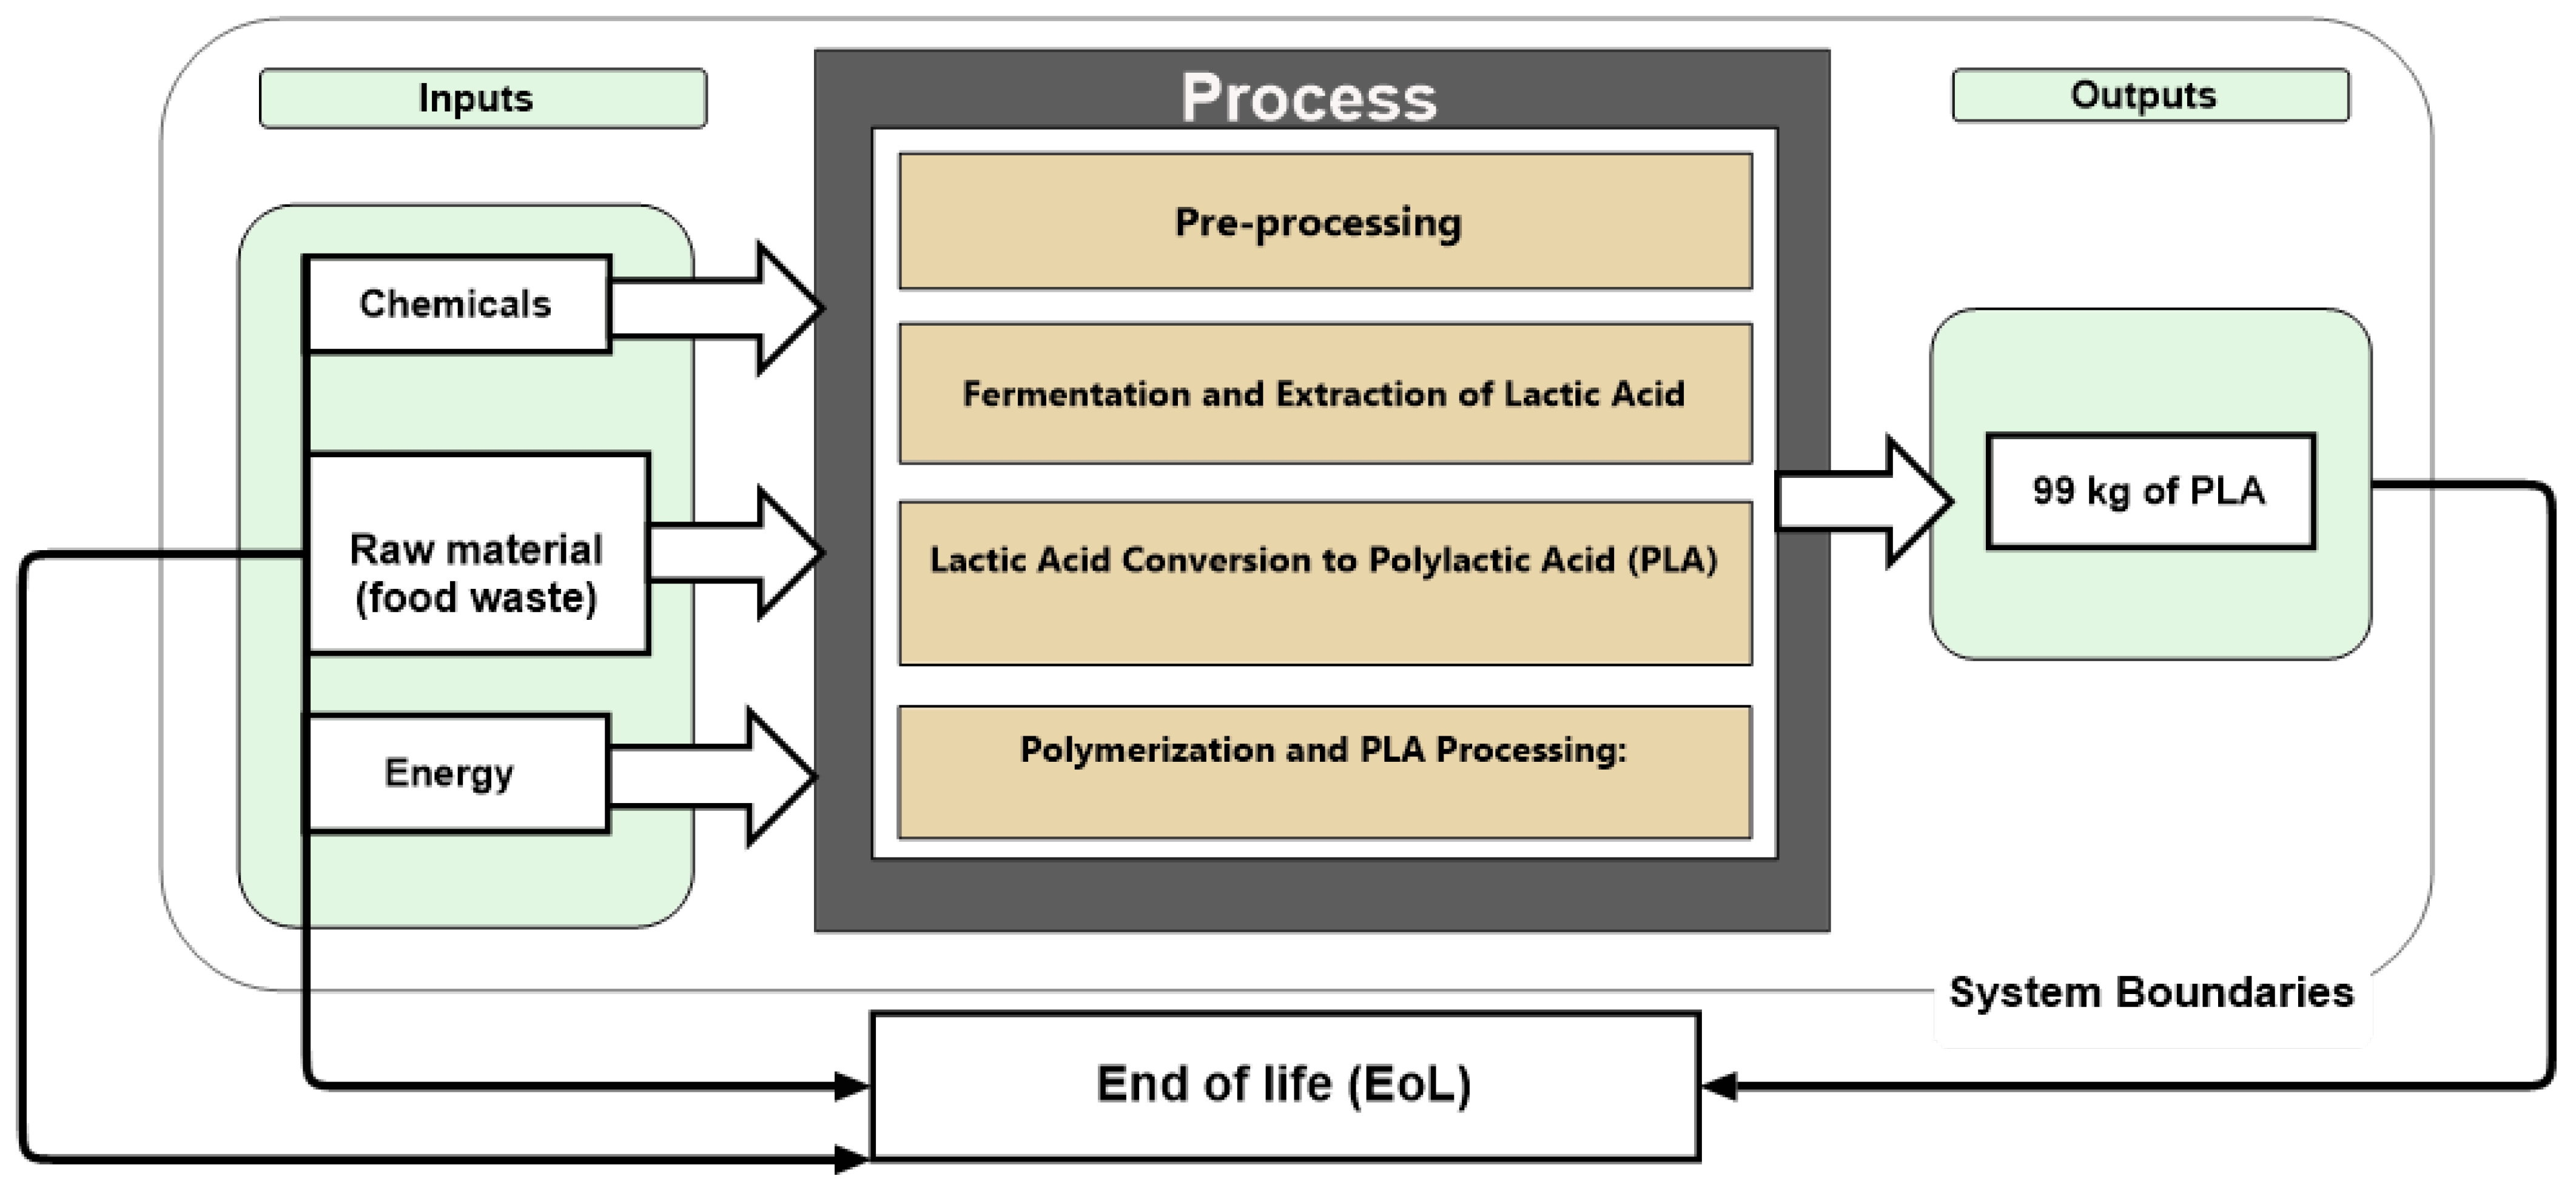
2.1. Goal and Scope, System Boundaries

The goal of the study is to assess the environmental impact of converting food waste into bioplastic. This assessment is based on the quantity of PLA produced using food waste as feedstock, specifically from the 11 batch operating cycles carried out during the A2UFood Project. In each operating cycle, 65 kg of sorted food waste were utilized, obtained after manual sorting from 125 kg of untreated food waste, resulting in the production of 9 kg of PLA. Thus, the functional unit is defined as the production of 99 kg of PLA. The graphical representation of the system boundaries is shown in Figure 1.
The scope focuses solely on the environmental costs directly associated with the conversion of food waste into bioplastics and does not consider the environmental impacts of food production. However, the conversion process effectively diverts food waste from landfills. Therefore, in this particular model, the diversion of food waste from landfills is regarded as an environmental benefit. This positive impact is factored into the study by subtracting the associated variables from the overall impacts demonstrated by the model. In addition, the assessment excludes the construction of the pilot plant or the operational energy requirements related to cleaning or maintenance of the facilities.

2.2. Life Cycle Inventory

2.2.1. Raw Material Acquisition

The study assessed the selection, extraction, conversion, and processing steps involved in the PLA production process from food waste [49]. The food waste used in this study was gathered from the Hellenic Mediterranean University’s student restaurant. The food waste composition was determined to be 80% raw-fresh foods (vegetables), 10% fruits, and 10% salads (on a wet basis) [50]. The assessment also includes the electricity consumption and the chemicals used in the conversion (Appendix A, Table A1).

2.2.2. Pilot Unit Description

Pretreatment and processing, which encompassed receiving and processing equipment such as conveyor belts, conveyor screws, shredders, pulpers, and monopumps, were thoroughly examined in the present study. Additionally, the energy demands for fermentation processes, including bioreactors, filter systems, heating systems, and low-temperature burners, were recorded. Polymerization, involving polymerization devices, was also covered. Figure 2 depicts the flow chart for the whole process of producing bioplastic in the pilot unit.
Energy consumption was a major consideration in the current assessment. To evaluate the energy requirements for the overall PLA production, a complete inventory of processes requiring power was performed. Energy requirements for the building’s fans were also considered, as they were necessary to maintain low ambient temperatures during the production process. The analysis of production energy requirements highlights the significant energy consumption across various operational equipment and systems within an industrial facility. Specifically, the receiving and processing equipment, including conveyor belts, conveyor screws, shredders, pulpers, and monopumps, require 411.8 kWh for 2 h of operation in every 8 h shift across 11 batches with an 85% operational rate. Bioreactor R1 operates continuously for 4 days per batch, consuming 449 kWh, while bioreactor R2, with 4 h of operation over 1 day per batch, uses 18.7 kWh. The filter system, operating 2 h per day for 1 day per batch, consumes 10.3 kWh. The low-temperature cooling system for R1 requires a substantial 3430.5 kWh over 3.5 days per batch. Burners for R1 and R2 consume 3.9 kWh and 1.3 kWh, respectively. Polymerization devices, operating for 6 h per day over 1 day per batch, consume 126.2 kWh. Building air circulation fans, running 8 h daily for 55 days, require 74.8 kWh. Overall, the total energy needs amount to 4451.7 kWh (Appendix A, Table A2).
Regarding the energy sources, the electricity mix in Greece in 2020, according to the Hellenic Ministry of Energy and Environment, consisted of oil at 7.22%, natural gas at 43.32%, lignite at 9.48%, renewable energy sources at 28.85%, nuclear energy at 3.21%, and other sources at 7.92%. To ensure a representative evaluation, a custom record for the electricity mix was developed, as no ready-made library specific to Greece was available.

2.2.3. Avoided Landfilling

The present study adopts a gate-to-gate LCA approach [51], focusing solely on the pilot-scale unit for the production of PLA and excluding end-of-life processing and food waste considerations. Biodegradable plastics are an interesting alternative for major questions in materials engineering. Nevertheless, PLA microplastics can pose a threat under specific conditions [52]. End-of-life impacts of bioplastics include the release of microplastics into the natural environment [52]. However, the present study excludes the environmental impacts associated with the disposal or end-of-life processing of the PLA product because it bases its impact assessment on ready-made models, as discussed in the impact assessment Section 2.3 that follows. These models do not include the impacts of microplastics, either in the natural environment or in human health. This is clearly identified by the authors of the present study as a limitation of the applied LCA methodology that requires further research. Furthermore, the production of food that ended up as food waste was not taken into account because it would have been produced regardless of its usage for PLA production.
This study explores the option of diverting food waste disposal to landfills, which is the primary method of waste disposal in Greece, comprising approximately 78% of the total waste generation [53]. Special attention is given to the reduction in methane emissions, with an emphasis on the kilograms of methane not emitted. By diverting 715 kg of food waste from landfills, a reduction of 26.8 kg in methane emissions was achieved. This reduction is based on the understanding that food waste contributes to 58% of methane emissions emitted into the atmosphere in municipal solid waste landfills [54].

2.3. Life Cycle Impact Assessment

SimaPro version 9.5 was used to generate the life cycle assessment model, which adhered to the ISO 14040 series of standards [55] The chosen impact assessment method is the Ecological Footprint method 3.0 (adapted) V1.00/EF 3/excluding infrastructure processes, which incorporates sixteen impact categories with their respective units: Climate change (CC)-[kg CO2 eq.], Ozone depletion (OD)-[kg CFC11 eq.], Ionizing radiation (IR)-[kBq U-235 eq.], Photochemical ozone formation (POF)-[kg NMVOC eq.], Particulate matter (PM)-[disease inc.], Human toxicity, non-cancer (HT-nc)-[CTUh], Human toxicity, cancer (HT-c)-[CTUh], Acidification (A)-[mol H+ eq.], Eutrophication, freshwater (E-f)-[kg P eq.], Eutrophication, marine (E-m)-[kg N eq.], Eutrophication, terrestrial (E-t)-[mol N eq.], Ecotoxicity, freshwater (ECoX-f)-[CTUe], Land use (LU)-[Pt], Water use (WU)-[m3 depriv.], Resource use, fossils (RU-f)-[MJ], Resource use, minerals and metals (RU-mm)-[kg Sb eq.]. All of the above impact categories are presented in terms of characterization and normalization results. Characterization in life cycle assessment (LCA) research entails modeling direct consequences for human health and other categories [56]. Furthermore, normalization helps in understanding the relative significance of improvements or reductions achieved in specific impact categories, enabling the evaluation of the effectiveness of mitigation efforts or the environmental benefits gained by avoiding certain materials or processes [57].

2.4. Alternative Feedstock Scenario

PLA is a bioplastic primarily derived from starch raw ingredients [58]. Given that starch is the principal feedstock for PLA manufacturing [27], a precise quantification of the starch content within the food waste sample was conducted. Based on this result and upon a review of pertinent literature, corn emerged as a prominent raw material [59]. Consequently, an alternative scenario was explored, utilizing corn for the production of an equivalent mass of bioplastic. Thus, “the production of 304 kg of corn, which served as the alternative raw material, has been avoided by producing bioplastic from food waste”.
This illustrates the twofold nature of prevention: one aspect involves diverting food waste from landfills, while the other aspect entails preventing the production of an equivalent amount of corn. An important step was the detailed analysis of the food waste sample composition, with its distribution based on components representing the general variation of food waste composition. This was followed by matching the sample with the starch content, based on the Woodlands Healing Research Center nutritional guide, and one more study [60]. The analytical amounts of these components are listed in Appendix A, Table A3. The next step was to relate the amount of starch contained in the sample to the equivalent amount of corn. Therefore, the use of an equivalent amount of corn, based on its starch content, represents the alternative scenario for the incoming raw material to be used to produce an equal amount of bioplastic.

2.5. Interpretation

The present study on PLA production from food waste provides valuable insights into environmental implications and critical aspects. The findings can aid in decision-making to optimize production processes and reduce environmental effects. At all phases of the life cycle, data collection, measurement, and analysis are crucial for sustainable PLA production. Opportunities for improvement include optimizing the production procedures, reducing energy consumption, reducing garbage output, and developing alternative waste disposal methods. The findings are presented in the results and discussion modules, which include the assessment, limitations, and some recommendations for addressing environmental problems.

2.6. Sensitivity and Uncertainty Analysis

A sensitivity analysis of Greece’s electricity mix, considering the environmental impact data presented earlier, indicates the possible repercussions of adjusting the balance of energy sources. Greece has increasingly turned to renewable energy sources [61], comprising over 30% of the electricity mix [62], alongside considerable contributions from natural gas and lignite. However, as sustainability gains prominence and environmental concerns mount, there is an opportunity to rethink this composition. Shifting away from natural gas and lignite in favor of developing renewable energy sources could decrease greenhouse gas emissions [63] as well as other harmful pollutants, thus contributing to global climate change mitigation [64]. Furthermore, prioritizing contributions from nuclear and hydroelectric sources while phasing out carbon-intensive sources could yield lasting benefits regarding environmental protection and energy security [65]. By reevaluating and optimizing the electricity mix, Greece can move towards a more sustainable and resilient energy future. Specifically, according to the Hellenic Ministry of Energy and Environment [66], the energy mix in Greece in 2023 consisted of natural gas at 35.1%, lignite at 9.5%, renewable energy sources at 40.3%, nuclear energy at 3.4%, and hydroelectric energy at 11.7%.
A systematic method for analyzing and minimizing uncertainty in research findings is essential for increasing their reliability [67]. This assessment focuses on the consistency and variability of the data and assumptions used in the LCA process. As indicated in prior research, changes in food waste composition, processing efficiency, and energy utilization have a significant impact on the interpretation of the LCA results. Furthermore, Hong et al. [68] note that meticulously quantifying these uncertainties helps researchers assess the amount of confidence in their results, identify critical areas that require more precise data, and improve the overall dependability of the study’s findings. In this regard, an uncertainty analysis was performed using SimaPro software version 9.5 and the Monte Carlo [69] technique (which is incorporated by default in the software) for the total avoidance product in the alternative feedstock scenario.

3. Results and Discussion

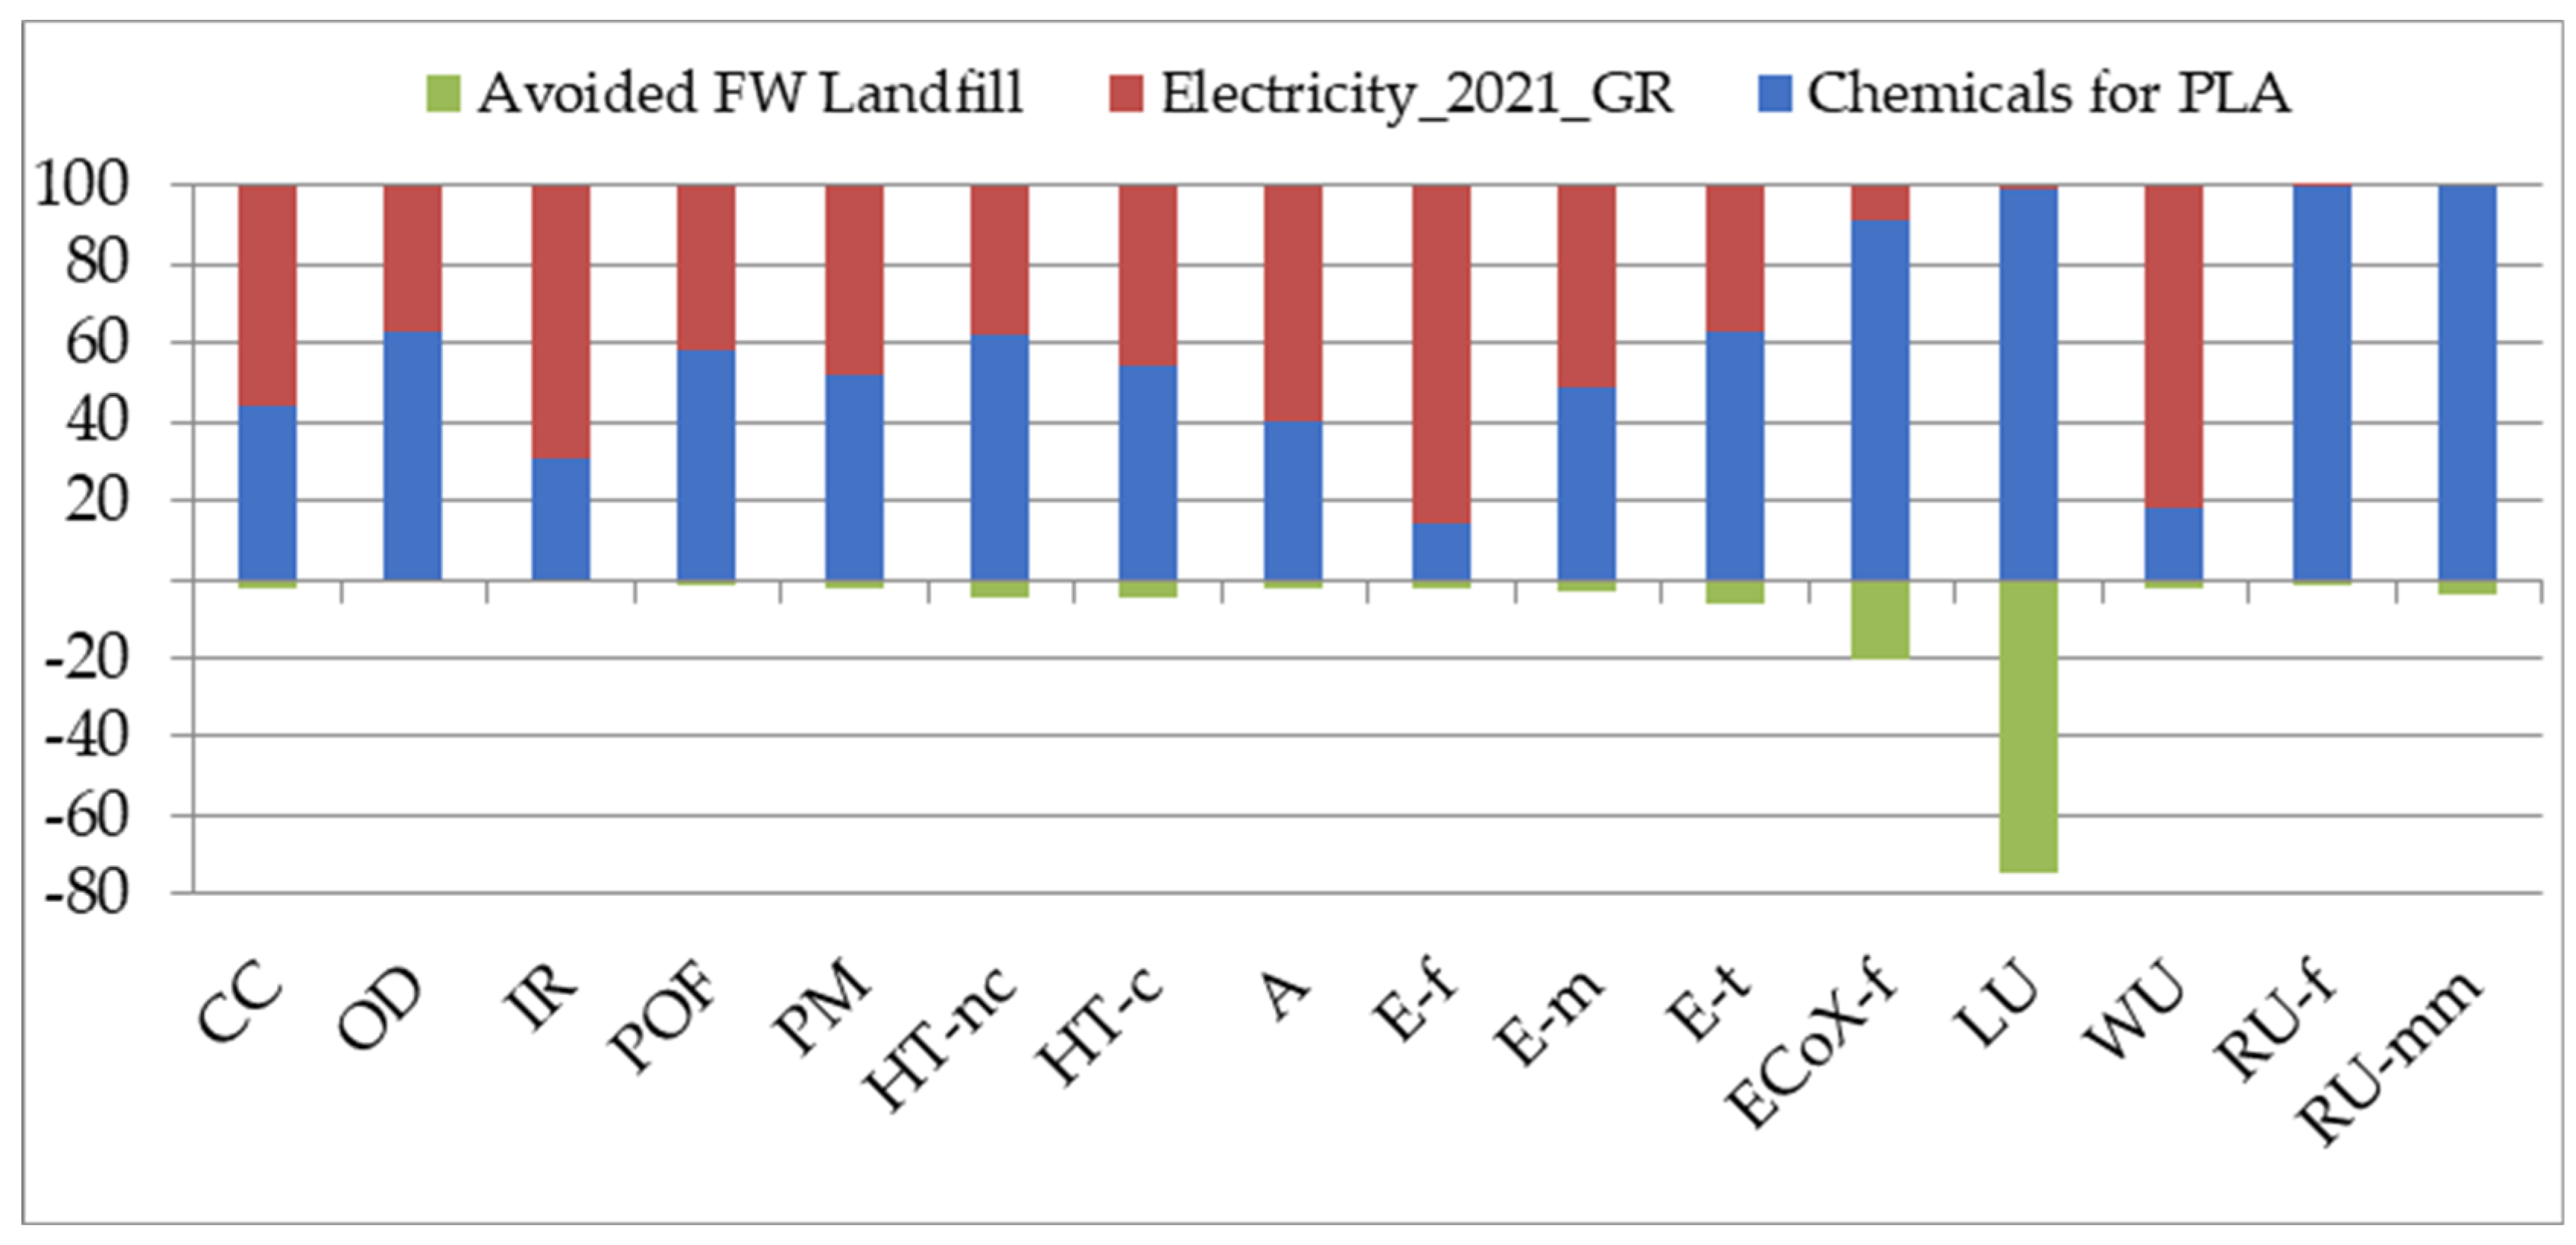
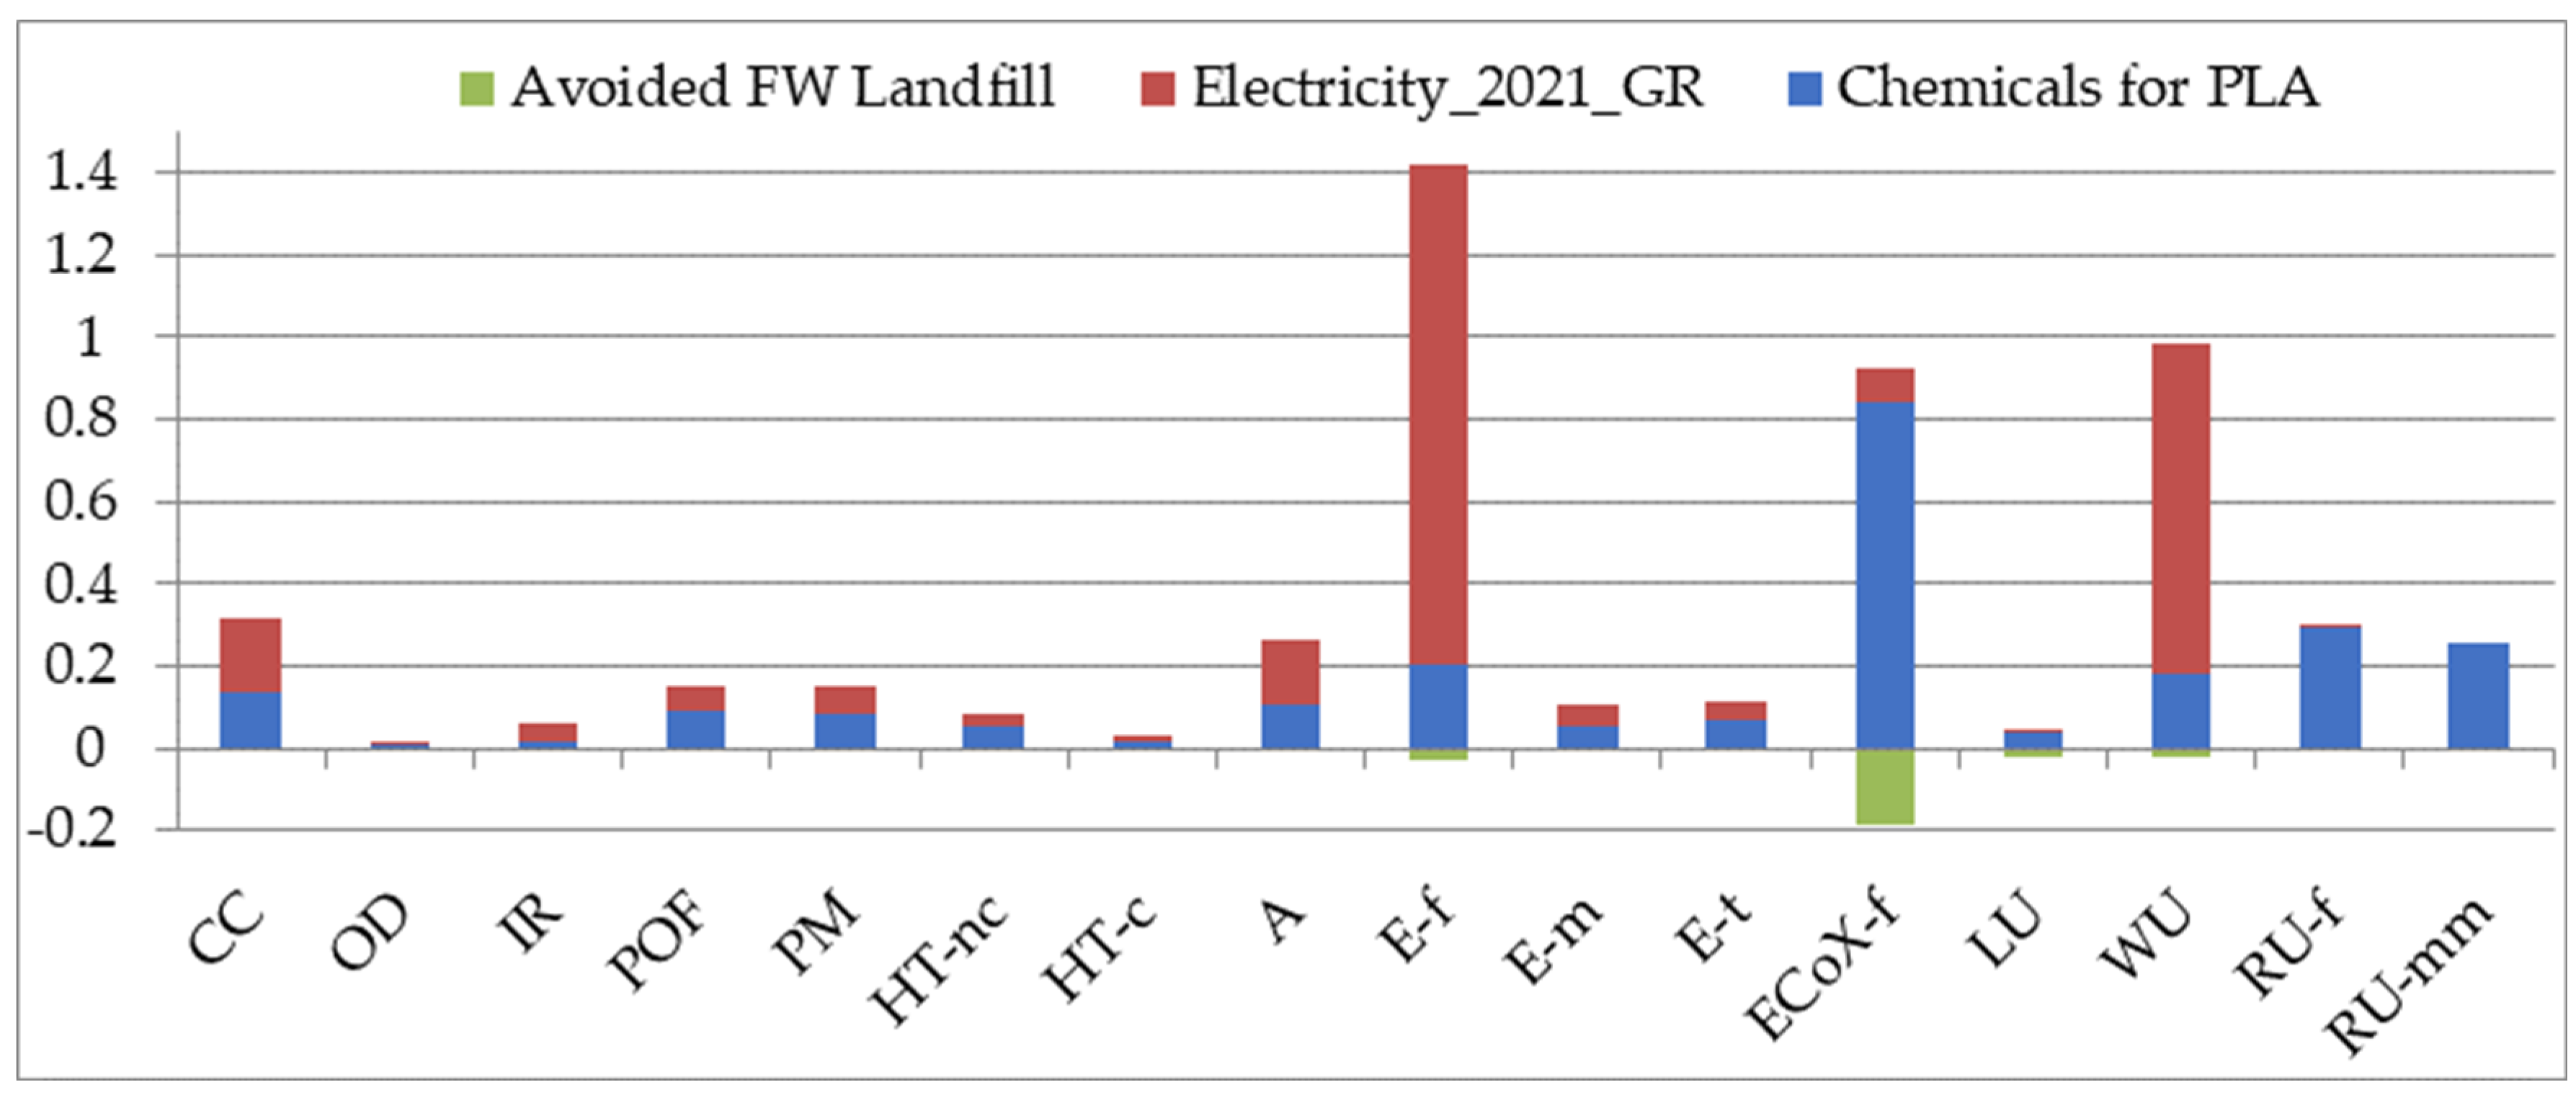
3.1. Characterization and Normalization

Table 1 illustrates the outcomes of the study across the various environmental impact categories. The characterization results for each impact category are distributed among three main components, namely: (i) the contribution of chemical additives, (ii) the contribution of electricity, and (iii) the contribution from the avoided landfilling of FW. Figure 3 presents the relative contribution of each of the three components. The electricity component (shown in red in Figure 2) is the major contributor to various impact categories, including climate change, ionizing radiation, freshwater ecotoxicity, and water use. This indicates the crucial environmental impact of electricity use in the bioplastic production process. The chemical addition (shown in blue in Figure 3) greatly affects ozone depletion, photochemical ozone formation, freshwater ecotoxicity, terrestrial eutrophication, land use, resource use, and mineral–metals resource use. This finding emphasizes the importance of careful selection and the potential decrease in chemical additions to reduce their detrimental impact on the environment. Notably, the averted landfilling of FW (indicated in green) has an environmentally favorable impact, particularly in terms of land use and freshwater ecotoxicity. Our findings are in agreement with Nampoothiri et al. [70], who reported that using leftovers or food waste can help lessen the environmental effect of PLA production. Our characterization results reinforce the view that bioplastic production from food waste emerges as a viable option since it has a positive impact on land use and on the reduction of pollution in freshwater ecosystems.
More specifically, reductions in greenhouse gas emissions, with a decrease of 50.9225 kg CO2 eq., contribute to climate change mitigation. Furthermore, a decrease in ozone-depleting chemicals by −1.6 × 10⁻⁶ kg CFC11 eq. helps in preserving the ozone layer. Reduced emissions of non-methane volatile organic chemicals (−0.10398 kg NMVOC eq.) and particle matter (−2.4 × 10⁻⁶ illness inc.) result in improved air quality and public health outcomes. Furthermore, reductions in human toxicity, both non-cancer (−9.6 × 10⁻⁷ CTUh) and cancer-related (−2.5 × 10⁻⁸ CTUh), as well as acidification (−0.34189 mol H+ eq.), indicate favorable effects on human health and ecosystem preservation. Decreased eutrophication in freshwater (−0.0497 kg P eq.), marine (−0.07274 kg N eq.), and terrestrial (−1.16318 mol N eq.) ecosystems helps preserve ecological balance. The reduction in freshwater ecotoxicity (−8161.21 CTUe) and land use (−21,306.69425 Pt) also suggests positive effects on biodiversity conservation. However, please note that some authors have questioned the overall positive influence of PLA manufacturing on climate change and sustainability, particularly regarding land use [71].
Moving on to the normalization phase, presented in Figure 4, our findings indicate that the three most important categories are freshwater eutrophication, water use, and freshwater ecotoxicity. Electricity is the major contributor for the first two categories, while chemicals are mainly responsible for the freshwater ecotoxicity impacts. Electricity generation, particularly from fossil fuels, has a huge environmental impact [72]. To address these challenges, a transition towards cleaner and more sustainable energy sources and improved energy efficiency is of paramount importance. By reducing the reliance on fossil fuels and embracing cleaner alternatives such as wind and solar energy, the negative environmental and health implications may be alleviated. Moreover, in the present pilot-scale case study, several practices and strategies can be implemented to reduce the total energy needs for the specific equipment and systems outlined. For the receiving and processing equipment, replacement of existing motors in conveyor belts, screws, shredders, pulpers, and monopumps with high-efficiency models that use less power is recommended. Then, for bioreactors R1 and R2, improvement of the insulation is recommended to minimize heat loss and maintain optimal temperatures with less energy. Finally, for polymerization devices, replacement of existing equipment with energy-efficient models is recommended, that require less power, and optimizing the polymerization process to reduce the duration of operation without affecting the quality of the final product can reduce energy consumption. By implementing these practices, the pilot-scale unit can reduce its total energy consumption, leading to cost savings and a lower environmental impact.

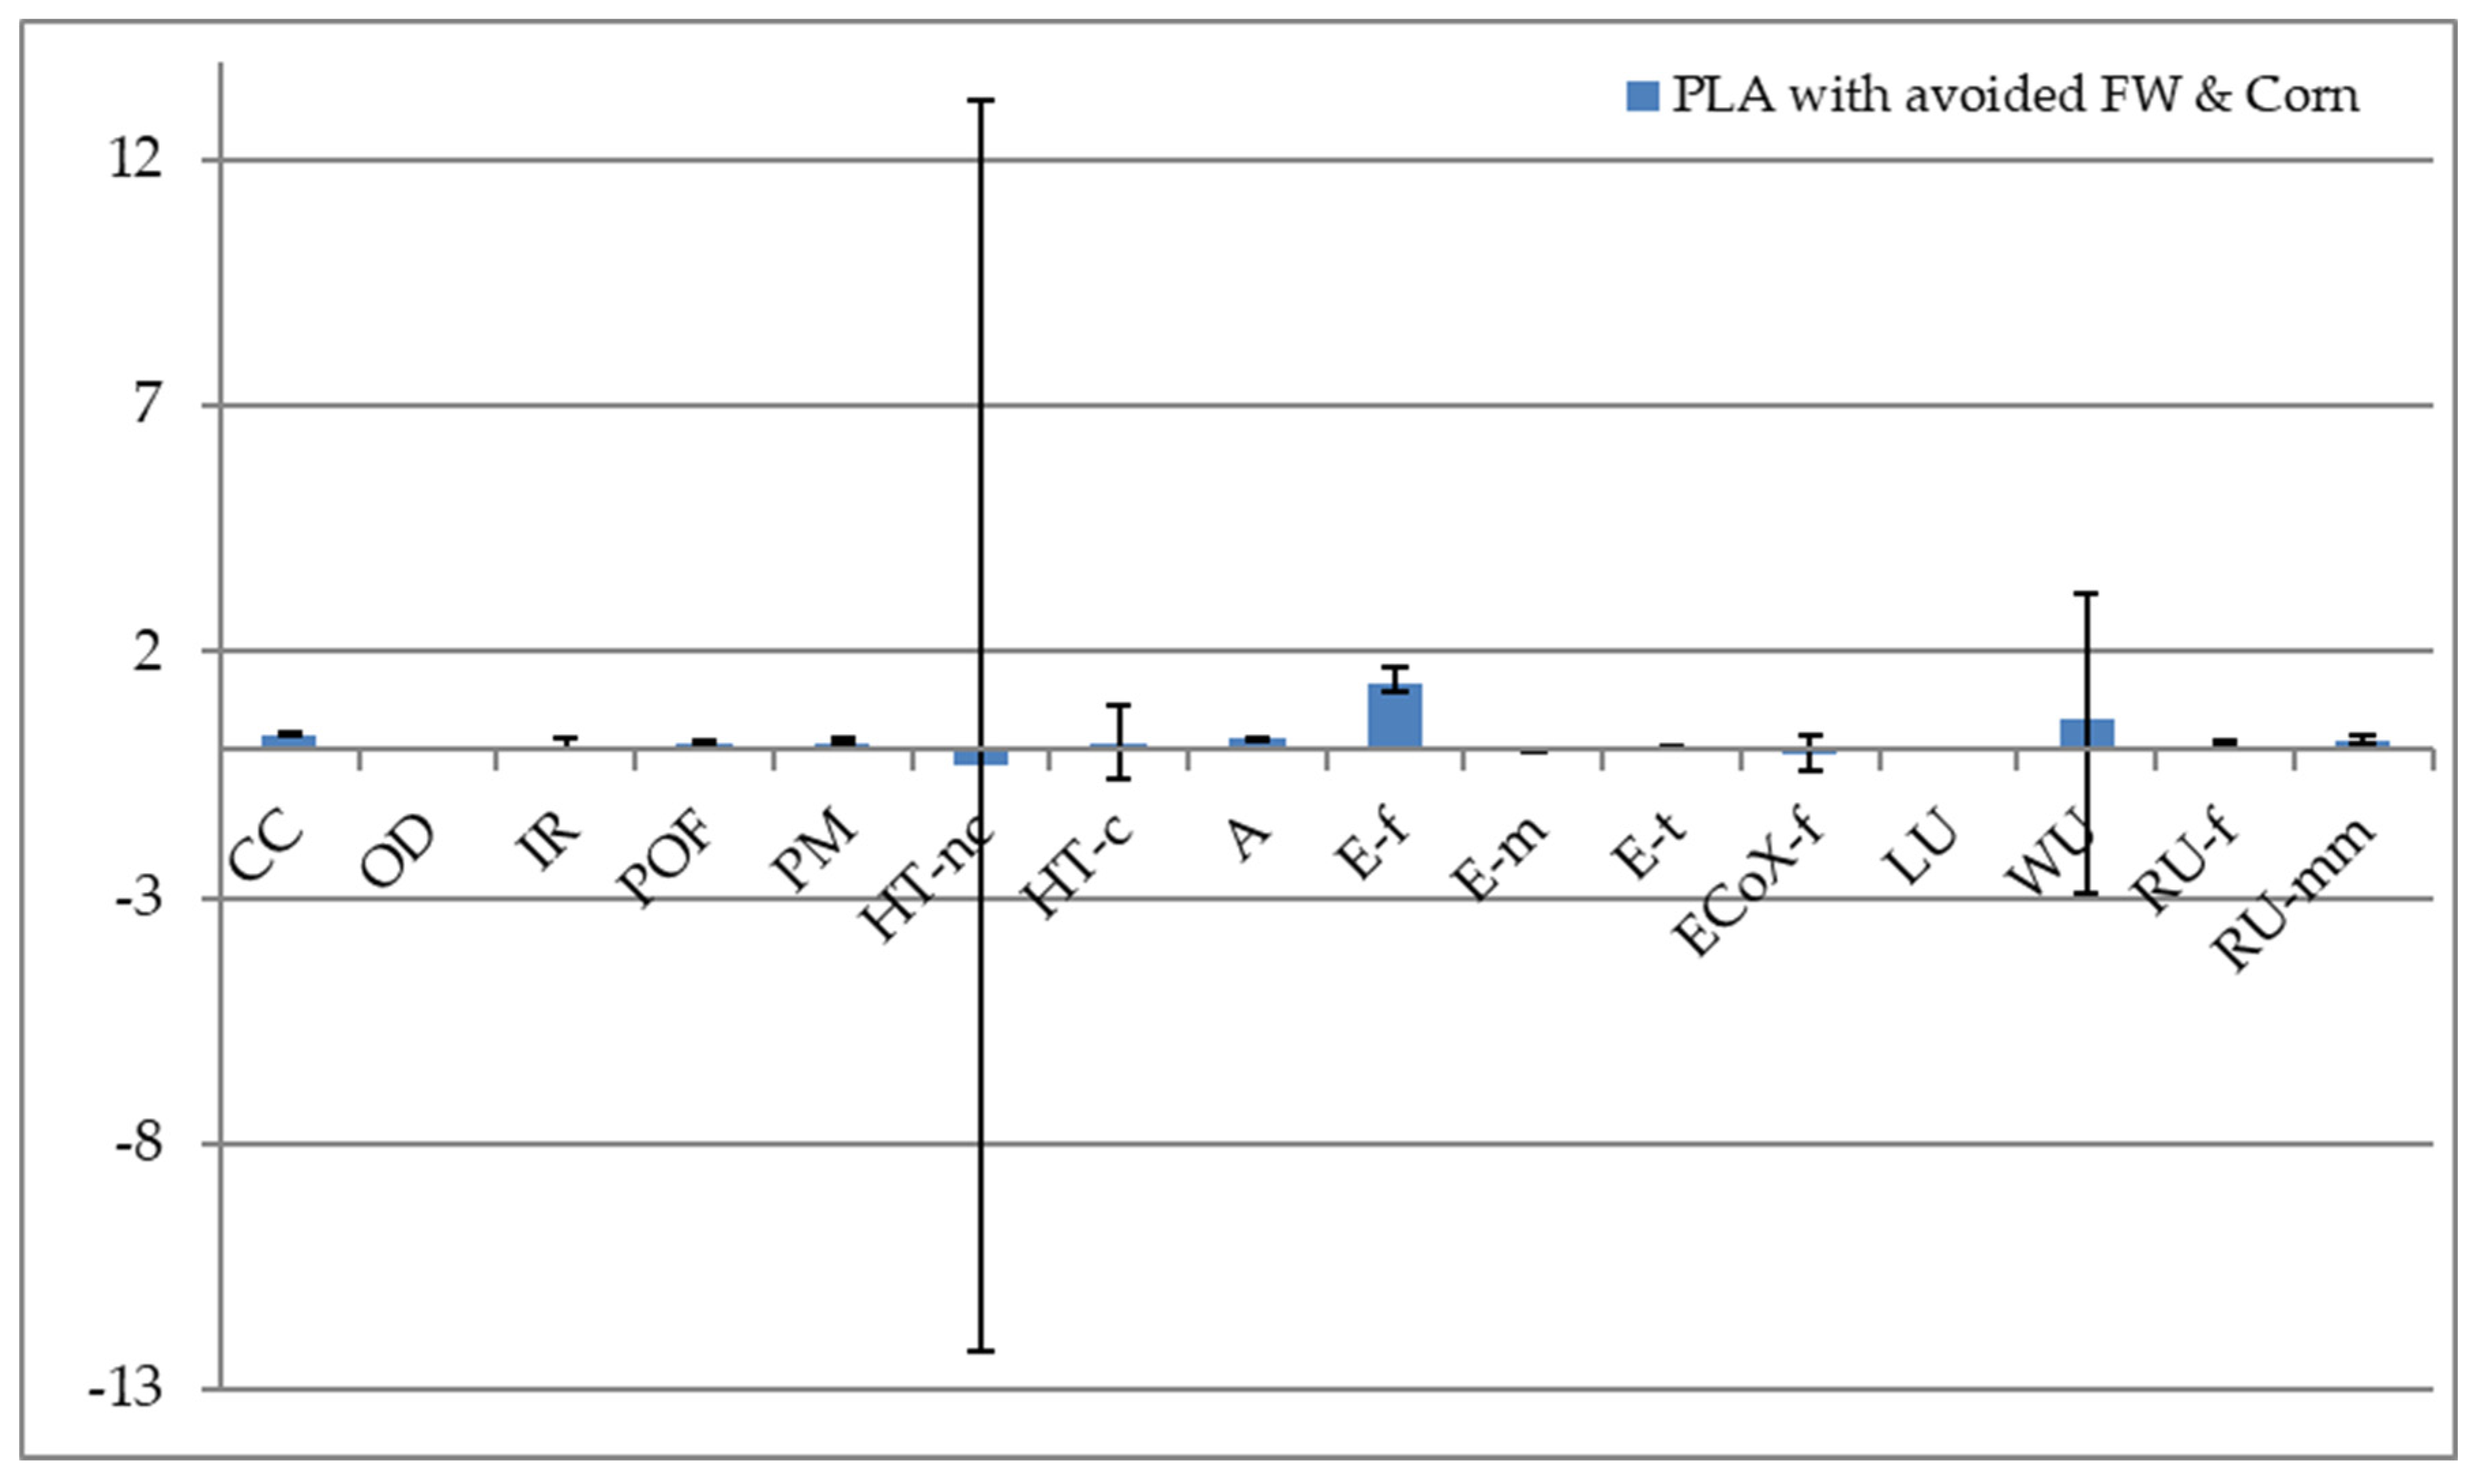
3.2. Alternative Feedstock Scenario

Again, in this scenario, the characterization results presented in Table 2 are divided into three major components: the contribution of chemical additives, the contribution of electricity, and the contribution from avoiding food waste landfilling and corn not utilized for producing the intended quantity of bioplastic. Figure 5 presents the relative contribution of each of the three components. The electricity component (red in Figure 5) is the major contributor to climate change, ionizing radiation, freshwater ecotoxicity, acidification, and water use. The chemicals (blue color) are the major contributors to ozone depletion, photochemical ozone formation, human toxicity (cancer and non-cancer effects), freshwater ecotoxicity, terrestrial eutrophication, land use, resource use, and mineral–metals resource use. In the present scenario, it is noteworthy the environmentally positive impact, particularly on marine and terrestrial eutrophication, freshwater ecotoxicity, and land and water use, of the prevented landfilling of FW and corn production (green color). First- and second-generation PLA tend to have significant environmental consequences in various areas, including human toxicity, freshwater eutrophication, and marine eutrophication [32], as confirmed by the findings of this study. Additionally, changes in land use can have long-term environmental and ecological consequences [73].
Particularly, the positive savings (as represented by negative values) demonstrated in Figure 5 across multiple categories represent the prevention that contributes to these environmental impacts. The current study’s summarized data highlight notable reductions in various environmental impact categories, affirming the benefits of converting food waste into bioplastic feedstock. Specifically, regarding climate change, a total reduction of 182.13 kg CO2 eq. is observed, primarily attributed to the avoidance of greenhouse gas emissions associated with fossil fuels or their derivatives, amounting to 155.77 kg CO2 eq. Additionally, biogenic emissions savings of 25.55 kg CO2 eq. are realized, likely stemming from reduced methane emissions due to diverting food waste from conventional disposal methods. Furthermore, a total reduction of 18,214.4 CTUe in freshwater ecotoxicity is achieved, credited to the avoidance of various organic and inorganic pollutants, as well as metal-based contaminants, thereby safeguarding aquatic habitats. The reduction in acidification by 1.87 mol H+ eq. signifies potential savings from mitigating acidifying agents, which pose threats to ecosystems. Moreover, a decrease in resource usage from fossil fuels by 256.24 MJ indicates reduced reliance on non-renewable energy sources in bioplastic production, contributing to wider sustainability efforts. Finally, the decline in terrestrial eutrophication by 7.24 kg P eq. indicates a favorable impact on nutrient runoff into water bodies, mitigating excessive algae growth and preserving freshwater ecosystems. These findings underscore the environmental benefits of repurposing food waste for bioplastic production.
Continuing on to the normalization stage, as shown in Figure 6, our findings indicate that the three most significant categories are freshwater eutrophication, water use, and freshwater ecotoxicity. In the same context, electricity is the largest contributor for the first two categories, although at lower values, while chemicals are mostly responsible for the freshwater ecotoxicity impacts.
The main categories recorded as prevention (Figure 6) at the normalization level include freshwater eutrophication and freshwater ecotoxicity. These categories quantify the savings achieved in reducing nutrient input and the reductions in the release of ecotoxic substances. In life cycle assessments, normalization is a crucial step in assessing environmental impact [74]. It involves comparing the environmental impact of a product or process to a reference value, which is typically based on the average or typical impact of a specific category of products or processes. Overall, normalization and characterization in LCA help in evaluating the environmental impact of various processes and products [75].

3.3. Sensitivity and Uncertainty Analysis

Understanding variations in various impact categories is critical in the continuous effort to monitor and reduce the environmental effects of human activities. The following data shows the most current percentage rates of change, emphasizing both gains and areas for concern.
Based on Figure 7 and Table A4 (Appendix A), resuming all operations in 2024 (with the latest energy mix in Greece, which has been implemented since 2023) could potentially lead to a significant 20% reduction in carbon dioxide equivalent, indicating progress in addressing climate change concerns. Additionally, a 21% decrease in chlorofluorocarbon equivalent suggests effectiveness in phasing out ozone-depleting compounds, contributing to the recovery of the ozone layer. Notably, there is a 19% reduction in non-methane volatile organic compound equivalent, indicating progress in reducing air pollution and ozone generation. The significant 47% decrease in illness incidence due to particulate matter indicates successful measures to improve air quality and protect public health. Similarly, the 12% reduction in non-cancerous human toxicity demonstrates attempts to minimize exposure to dangerous chemicals, hence improving human health and well-being. Notable reductions include a 32% decrease in malignant human toxicity, indicating success in reducing carcinogenic dangers, and a 35% reduction in hydrogen ion equivalent, indicating progress in mitigating acidification and maintaining ecological pH equilibrium.
While there have been considerable advancements in key environmental impact categories, challenges persist that require collective action and innovation. Continued collaboration among governments, industry, and communities is critical to ensuring a sustainable future.
The uncertainty analysis is shown in Figure 8, and the category with a significant difference is human toxicity without cancer effects, which might be attributed to various variables. These include variations in exposure and susceptibility across populations, the complexity of chemical interactions, a lack of comprehensive data on long-term exposure, methodological differences in the assessment of toxicity, and variations in models used to extrapolate data from experimental studies to real-world scenarios. Furthermore, regulatory standards and procedural discrepancies among areas and nations might lead to inaccurate measurements and interpretations of human toxicity data. These characteristics make it challenging to acquire accurate and reliable measures of non-cancer human adverse effects.
The primary advantages of producing PLA from food waste include reduced environmental impact and long-term sustainability [76]. This aligns with environmental aims since converting food waste into bioplastics such as PLA promotes circular economy principles [77] and reduces dependency on polymers produced through fossil fuels [9]. However, significant challenges such as raw material volatility, process optimization, and economic feasibility need to be addressed.
The diversity of raw materials affects the efficiency and consistency of the fermentation process and subsequent PLA synthesis. To produce high-quality PLA, research and development are needed to develop efficient and cost-effective technologies for the pretreatment, fermentation, and purification of lactic acid derived from food waste. The economic feasibility of waste collection, treatment, and conversion procedures relative to standard PLA production methods will determine viability. More numerical details for the uncertainty analysis results are presented in Table A5 in Appendix A.

4. Conclusions and Limitations

Bioplastics produced from organic waste offer a promising alternative for reducing dependence on petroleum-based plastics [78]. This study focuses on evaluating PLA production from food waste, with an emphasis on its potential to promote environmental sustainability. The main benefits are increased resource efficiency, less environmental impact, and long-term sustainability. This strategy applies the principles of the circular economy while also reducing reliance on polymers derived from fossil fuels. Our results indicate that electricity is the major contributor to the most important environmental impacts of PLA production from food waste in the pilot scale unit. Moreover, the electricity required for PLA production still depends on fossil sources. The most important impacts are freshwater eutrophication, water use, and freshwater ecotoxicity. Our findings are in agreement with literature reports that state that switching to second-generation feedstocks, such as separately collected food waste, and improvements in energy efficiency and use of renewable energy are among the technological advances that reduce the environmental impacts of bioplastics [30].
Aside from the environmental benefits, there are certain limitations, such as the economic viability, as waste collection, treatment costs, and conversion process efficiency determine PLA production from food waste. Waste management technology innovation and efficient conversion procedures are crucial to cost-effectiveness. Tsang et al. [35] and Jõgi and Bhat [31] highlighted the potential cost savings resulting from bioplastic production from food waste compared to standard processes while emphasizing the need for more cost-effective solutions. Additional studies underscore the need to examine the economic feasibility of the food-waste-to-bioplastics concept within the context of a circular economy [79]. However, a direct comparative economic analysis is still absent, illustrating the need for more research in this field.
In terms of future research challenges within the use of LCA for the assessment of bioplastics production, we also clearly identify that the plastic littering impacts, even for bioplastics that are marketed as biodegradable, are not included within any current LCA impact category [9]. With the fast-growing accumulation of degradable bioplastics and their resulting microplastics in soils globally, there is an urgent better need to understand their potential effects on soil-microbial-plant systems, which could serve as a starting point for assessing their ecological risk in terrestrial ecosystems [52]. Based on these scientific findings, relative LCA impact models should be developed.
Regarding the scalability of the present process to an industrial one, the use of pilot-scale data is a difficult issue with several challenges. Berndtsson et al. [80] note the necessity for senior management support in scaling up data-driven pilot initiatives. There is also a suggested framework for pilot line scale-up utilizing digital manufacturing, which may improve the accuracy of scale-up models [81]. These studies demonstrate the importance of detailed planning, organizational support, and the technology tools required for scaling up the process.
To summarize, while both food waste and corn may be used as raw materials for PLA production, employing food waste has the potential to reduce waste, increase resource efficiency, and reduce environmental impacts. However, process optimization, scalability, and economic viability issues must be addressed before PLA production from food waste can be more competitive and sustainable than standard corn-based PLA production.

Author Contributions

The collaborative nature of the research outlined in this article involved each author contributing in diverse ways, encompassing unique perspectives, insights, feedback, and guidance that may not be easily quantified or neatly categorized. Despite this complexity, an effort has been made to delineate the authors’ contributions, recognizing that: conceptualization. K.S. and K.A.; methodology. K.A. and K.S.; software. K.S. and K.A.; validation. K.A., K.V. and K.L.; formal analysis. K.A. and K.S.; investigation. K.S. and A.M.; resources. A.M., T.M. and K.V.; data curation. A.M., K.V. and T.M.; writing—original draft preparation. K.A. and K.S.; writing—review and editing. K.A. and K.L.; visualization. K.S.; supervision. K.L., K.A. and T.M.; project administration. T.M. and K.L.; funding acquisition. T.M. and K.L. All authors have read and agreed to the published version of the manuscript.

Funding

This study was financially supported by the A2UFood Project (UIA 02-115 “Avoidable and Unavoidable Food Wastes: A Holistic Managing Approach for Urban Environments—A2U Food”, Urban Innovative Actions Initiative, EU, (2018–2022)), co-funded by the European Regional and Development Fund through the Urban Innovative Actions Initiative.

Institutional Review Board Statement

Not applicable.

Data Availability Statement

The data presented in this study are contained within this manuscript for reproducibility purposes.

Acknowledgments

The authors would like to acknowledge all who have directly or indirectly helped in carrying out this study.

Conflicts of Interest

The authors declare no conflicts of interest.

Appendix A

Table A1. Chemicals import table for LCI (all the chemicals used were purchased in larger quantities as they are part of the consumables for other laboratory experiments, via on-line ordering).
Chemical Characteristics/Supply CompanyAmountUnit
Sodium hydroxide≥98.0–100.5%/Sigma Aldrich (Burlington, MA, USA)25kg
Sodium hypochlorite, without water, in a 15% solution state/market product for cleaning100kg
Tetrahydrofuran Min. 99.5%/Honeywell (Charlotte, NC, USA)4.5kg
Acetone, Pure 100%, Liquid/Manis chemicals (Athens, Greece)4kg
Hydrochloric acid from benzene chlorinationHoneywell X31087 hydrochloric acid solution, 6 M HCl4kg
1-butanol p.a. ≥99.5%/Merck (Marousi, Athens, Greece)176kg
Tin concentrate (Tin(II) 2-ethylhexanoate) 92.5–100.0%/Sigma Aldrich (Burlington, MA, USA)1kg
Enzyme, Glucoamylase, Novozyme, SpirizymeAmlyloglucosidases Spirizyme Fuel (SPF) from Novozymes5kg
Ammonium Hydroxideliquid 25%/Manis chemicals (Athens, Greece)25kg
Table A2. Energy needs import table for LCI.
Production EnergyHours of Operation (h)Power of Devices (kW)Energy Requirements (kWh)
Receiving/processing equipment (conveyor belt, conveyor screws, shredder, pulper, monopump) 2 h in every 8 h shift * 11 batches * 85%18.722.02 kW411.8
Bioreactor R1 4 days * 24 h/day * 11 batches * 85%8980.5 kW449
Bioreactor R21 day * 4 h/day * 11 batches * 85%37.40.5 kW18.7
Filter system 1 day * 2 h/day * 11 batches * 85%18.70.55 kW10.3
Low temperature heating system: for R1 3.5 days * 24 h/day * 11 batches * 85%7854.37 kW3430.5
Burner R10.5 days * 24 h/day * 11 batches * 85% 112.20.035 kW3.9
Burner R21 day * 4 h/day * 11 batches * 85%37.40.035 kW1.3
Polymerization devices1 day * 6 h/day * 11 batches * 85%56.12.25 kW126.2
Building air circulation fans 55 days * 8 h/day * 85%3740.20 kW74.8
Total energy needs 4451.7
Table A3. Starch contained in the case study sample for LCI (https://woodmed.com/index.php/health-information/basic-health-maintenance-diet/135-appendix-3-starch-content-of-vegetables-and-fruits (accessed on 15 February 2024).
Food Category% StarchTotal Feedstock Quantity (kg)Quantity of Starch in Feedstock (kg)
Spinach0.0325.00.75
Broccoli0.0328.00.84
Cabbage0.0329.00.87
Brussel Sprouts0.0918.01.60
White Potato0.18100.018.0
Pepper0.0632.01.92
Cucumber0.0340.01.20
Lettuce0.0380.02.40
Tomatoes0.0370.02.10
Carrots0.0956.55.08
Onions0.0993.08.30
Beans0.2110.02.10
Green Peas0.1540.06.00
Beets0.0922.01.98
Total amount of vegetables--643.553.0
Grapefruit0.095.00.45
Bananas0.2125.05.25
Watermelon0.065.00.30
Oranges0.1220.02.40
Peaches0.126.00.72
Apples0.1510.51.58
Total amount of fruits--71.510.70
Total Starch63.9
Corn0.21100.021.00
Total--30463.9
Table A4. Sensitivity analysis for two electricity mixes and the rate of change.
Impact Category (Unit)2021 Energy Mix2023 Energy Mix% Rate of Change
CC (kg CO2 eq.)2360.951879.05−20%
OD (kg CFC11 eq.)0.000.00−21%
IR (kBq U-235 eq.)225.90228.231%
POF (kg NMVOC eq.)5.624.56−19%
PM (disease inc.)0.000.00−47%
HT-nc (CTUh)0.000.00−12%
HT-c (CTUh)0.000.00−32%
A (mol H+ eq.)12.818.38−35%
E-f (kg P eq.)2.192.200%
E m (kg N eq.)0.02−0.22−1360%
E-t (mol N eq.)12.429.78−21%
ECoX-f (CTUe)21,125.619,234.86−9%
LU (Pt)6978.476399.44−8%
WU (m3 depriv.)4327.67186,362.874206%
RU-f (MJ)18,815.218,814.650%
RU mm (kg Sb eq.)0.0150.0150%
Table A5. Uncertainty analysis for total avoided product at normalization.
LabelPLA with Avoided FW and CornLowHigh
CC0.3230.0250.036
OD0.0030.0010.001
IR0.0360.0250.205
POF0.1590.0250.042
PM0.1410.0320.09
HT-nc−0.29211.913.506
HT-c0.1220.7060.802
A0.2250.0180.022
E-f1.3750.1750.32
E-m0.0010.010.017
E-t0.0690.0140.02
ECoX-f−0.0840.3580.372
LU0.0080.0060.004
WU0.6163.5432.544
RU-f0.1080.030.061
RU-mm0.1980.0710.107

References

  1. Ramos, A.; Afonso Teixeira, C.; Rouboa, A. Environmental Analysis of Waste-to-Energy—A Portuguese Case Study. Energies 2018, 11, 548. [Google Scholar] [CrossRef]
  2. Plastics—The Facts 2022 • Plastics Europe. Available online: https://plasticseurope.org/knowledge-hub/plastics-the-facts-2022/ (accessed on 5 October 2023).
  3. OECD. Global Plastics Outlook: Policy Scenarios to 2060; OECD: Paris, France, 2022; ISBN 978-92-64-97364-0. [Google Scholar]
  4. Browning, S.; Beymer-Farris, B.; Seay, J.R. Addressing the Challenges Associated with Plastic Waste Disposal and Management in Developing Countries. Curr. Opin. Chem. Eng. 2021, 32, 100682. [Google Scholar] [CrossRef]
  5. Zheng, J.; Suh, S. Strategies to Reduce the Global Carbon Footprint of Plastics. Nat. Clim. Chang. 2019, 9, 374–378. [Google Scholar] [CrossRef]
  6. Schmaltz, E.; Melvin, E.C.; Diana, Z.; Gunady, E.F.; Rittschof, D.; Somarelli, J.A.; Virdin, J.; Dunphy-Daly, M.M. Plastic Pollution Solutions: Emerging Technologies to Prevent and Collect Marine Plastic Pollution. Environ. Int. 2020, 144, 106067. [Google Scholar] [CrossRef] [PubMed]
  7. Rai, P.K.; Lee, J.; Brown, R.J.C.; Kim, K.-H. Micro- and Nano-Plastic Pollution: Behavior, Microbial Ecology, and Remediation Technologies. J. Clean. Prod. 2021, 291, 125240. [Google Scholar] [CrossRef]
  8. Saley, A.M.; Smart, A.C.; Bezerra, M.F.; Burnham, T.L.U.; Capece, L.R.; Lima, L.F.O.; Carsh, A.C.; Williams, S.L.; Morgan, S.G. Microplastic Accumulation and Biomagnification in a Coastal Marine Reserve Situated in a Sparsely Populated Area. Mar. Pollut. Bull. 2019, 146, 54–59. [Google Scholar] [CrossRef]
  9. Bishop, G.; Styles, D.; Lens, P.N.L. Environmental Performance Comparison of Bioplastics and Petrochemical Plastics: A Review of Life Cycle Assessment (LCA) Methodological Decisions. Resour. Conserv. Recycl. 2021, 168, 105451. [Google Scholar] [CrossRef]
  10. Shogren, R.; Wood, D.; Orts, W.; Glenn, G. Plant-Based Materials and Transitioning to a Circular Economy. Sustain. Prod. Consum. 2019, 19, 194–215. [Google Scholar] [CrossRef]
  11. Blank, L.M.; Narancic, T.; Mampel, J.; Tiso, T.; O’Connor, K. Biotechnological Upcycling of Plastic Waste and Other Non-Conventional Feedstocks in a Circular Economy. Curr. Opin. Biotechnol. 2020, 62, 212–219. [Google Scholar] [CrossRef] [PubMed]
  12. Tamburini, E.; Costa, S.; Summa, D.; Battistella, L.; Fano, E.A.; Castaldelli, G. Plastic (PET) vs Bioplastic (PLA) or Refillable Aluminium Bottles—What Is the Most Sustainable Choice for Drinking Water? A Life-Cycle (LCA) Analysis. Environ. Res. 2021, 196, 110974. [Google Scholar] [CrossRef] [PubMed]
  13. Schneiderman, D.K.; Hillmyer, M.A. 50th Anniversary Perspective: There Is a Great Future in Sustainable Polymers. Macromolecules 2017, 50, 3733–3749. [Google Scholar] [CrossRef]
  14. Yuan, X.; Wang, X.; Sarkar, B.; Ok, Y.S. The COVID-19 Pandemic Necessitates a Shift to a Plastic Circular Economy. Nat. Rev. Earth Environ. 2021, 2, 659–660. [Google Scholar] [CrossRef] [PubMed]
  15. Document 52018DC0028, Communication from the Commission to the European Parliament, the Council, the European Economic and Social Committee and the Committee of the Regions. A European Strategy for Plastics in a Circular Economy. 2018. Available online: https://eur-lex.europa.eu/legal-content/EN/TXT/?uri=COM%3A2018%3A28%3AFIN (accessed on 10 January 2024).
  16. Ali, S.S.; Abdelkarim, E.A.; Elsamahy, T.; Al-Tohamy, R.; Li, F.; Kornaros, M.; Zuorro, A.; Zhu, D.; Sun, J. Bioplastic Production in Terms of Life Cycle Assessment: A State-of-the-Art Review. Environ. Sci. Ecotechnol. 2023, 15, 100254. [Google Scholar] [CrossRef] [PubMed]
  17. Kircher, M. The Bioeconomy Needs Economic, Ecological and Social Sustainability. AIMSES 2022, 9, 33–50. [Google Scholar] [CrossRef]
  18. Sidek, I.S.; Draman, S.F.S.; Abdullah, S.R.S.; Anuar, N. Current Development on Bioplastics and Its Future Prospects: An Introductory Review. INWASCON Technol. Mag. 2019, 03–08. [Google Scholar] [CrossRef]
  19. Blum, N.U.; Haupt, M.; Bening, C.R. Why “Circular” Doesn’t Always Mean “Sustainable”. Resour. Conserv. Recycl. 2020, 162, 105042. [Google Scholar] [CrossRef]
  20. Bajpai, P. Market for Biobased Packaging Material. In Biobased Polymers; Elsevier: Amsterdam, The Netherlands, 2019; pp. 191–196. ISBN 978-0-12-818404-2. [Google Scholar]
  21. Chia, W.Y.; Ying Tang, D.Y.; Khoo, K.S.; Kay Lup, A.N.; Chew, K.W. Nature’s Fight against Plastic Pollution: Algae for Plastic Biodegradation and Bioplastics Production. Environ. Sci. Ecotechnol. 2020, 4, 100065. [Google Scholar] [CrossRef] [PubMed]
  22. Imre, B.; García, L.; Puglia, D.; Vilaplana, F. Reactive Compatibilization of Plant Polysaccharides and Biobased Polymers: Review on Current Strategies, Expectations and Reality. Carbohydr. Polym. 2019, 209, 20–37. [Google Scholar] [CrossRef] [PubMed]
  23. Zhao, X.; Cornish, K.; Vodovotz, Y. Narrowing the Gap for Bioplastic Use in Food Packaging: An Update. Environ. Sci. Technol. 2020, 54, 4712–4732. [Google Scholar] [CrossRef] [PubMed]
  24. Muniyasamy, S.; Dada, O.E. Recycling of Plastics and Composites Materials and Degradation Technologies for Bioplastics and Biocomposites. In Waste Management in the Fashion and Textile Industries; Elsevier: Amsterdam, The Netherlands, 2021; pp. 311–333. ISBN 978-0-12-818758-6. [Google Scholar]
  25. Sindhu, R.; Gnansounou, E.; Rebello, S.; Binod, P.; Varjani, S.; Thakur, I.S.; Nair, R.B.; Pandey, A. Conversion of Food and Kitchen Waste to Value-Added Products. J. Environ. Manag. 2019, 241, 619–630. [Google Scholar] [CrossRef] [PubMed]
  26. Rebolledo-Leiva, R.; Ladakis, D.; Ioannidou, S.-M.; Koutinas, A.; Moreira, M.T.; González-García, S. Pursuing Single or Combined Wheat Straw Based Poly(Butylene Succinate) Production Routes: A Life Cycle Approach of First- and Second-Generation Feedstocks. Sustain. Mater. Technol. 2023, 37, e00683. [Google Scholar] [CrossRef]
  27. Trivedi, A.K.; Gupta, M.K.; Singh, H. PLA Based Biocomposites for Sustainable Products: A Review. Adv. Ind. Eng. Polym. Res. 2023, 6, 382–395. [Google Scholar] [CrossRef]
  28. Tsiropoulos, I.; Faaij, A.P.C.; Lundquist, L.; Schenker, U.; Briois, J.F.; Patel, M.K. Life Cycle Impact Assessment of Bio-Based Plastics from Sugarcane Ethanol. J. Clean. Prod. 2015, 90, 114–127. [Google Scholar] [CrossRef]
  29. Vink, E.T.H.; Rábago, K.R.; Glassner, D.A.; Gruber, P.R. Applications of Life Cycle Assessment to NatureWorksTM Polylactide (PLA) Production. Polym. Degrad. Stab. 2003, 80, 403–419. [Google Scholar] [CrossRef]
  30. Brizga, J.; Hubacek, K.; Feng, K. The Unintended Side Effects of Bioplastics: Carbon, Land, and Water Footprints. One Earth 2020, 3, 45–53. [Google Scholar] [CrossRef]
  31. Jõgi, K.; Bhat, R. Valorization of Food Processing Wastes and By-Products for Bioplastic Production. Sustain. Chem. Pharm. 2020, 18, 100326. [Google Scholar] [CrossRef]
  32. Fonseca, A.; Ramalho, E.; Gouveia, A.; Figueiredo, F.; Nunes, J. Life Cycle Assessment of PLA Products: A Systematic Literature Review. Sustainability 2023, 15, 12470. [Google Scholar] [CrossRef]
  33. Govil, T.; Wang, J.; Samanta, D.; David, A.; Tripathi, A.; Rauniyar, S.; Salem, D.R.; Sani, R.K. Lignocellulosic Feedstock: A Review of a Sustainable Platform for Cleaner Production of Nature’s Plastics. J. Clean. Prod. 2020, 270, 122521. [Google Scholar] [CrossRef]
  34. Swetha, T.A.; Ananthi, V.; Bora, A.; Sengottuvelan, N.; Ponnuchamy, K.; Muthusamy, G.; Arun, A. A Review on Biodegradable Polylactic Acid (PLA) Production from Fermentative Food Waste—Its Applications and Degradation. Int. J. Biol. Macromol. 2023, 234, 123703. [Google Scholar] [CrossRef]
  35. Tsang, Y.F.; Kumar, V.; Samadar, P.; Yang, Y.; Lee, J.; Ok, Y.S.; Song, H.; Kim, K.-H.; Kwon, E.E.; Jeon, Y.J. Production of Bioplastic through Food Waste Valorization. Environ. Int. 2019, 127, 625–644. [Google Scholar] [CrossRef] [PubMed]
  36. Elissen, H.J.H.; Kootstra, A.M.J. Production of Short-Chain Volatile Fatty Acids and Lactic Acid during Small-Scale Ensiling of Meadow Grass. Available online: https://edepot.wur.nl/415175 (accessed on 21 November 2023).
  37. Woodford, M. Modeling Imprecision in Perception, Valuation, and Choice. Annu. Rev. Econ. 2020, 12, 579–601. [Google Scholar] [CrossRef]
  38. Gong, L.; Passari, A.K.; Yin, C.; Kumar Thakur, V.; Newbold, J.; Clark, W.; Jiang, Y.; Kumar, S.; Gupta, V.K. Sustainable Utilization of Fruit and Vegetable Waste Bioresources for Bioplastics Production. Crit. Rev. Biotechnol. 2024, 44, 236–254. [Google Scholar] [CrossRef] [PubMed]
  39. Cecchi, T. Biobased Polymers from Food Waste Feedstock and Their Synthesis. In Biobased Products from Food Sector Waste; Springer International Publishing: Cham, Switzerland, 2021; pp. 231–285. ISBN 978-3-030-63435-3. [Google Scholar]
  40. Sakai, K.; Taniguchi, M.; Miura, S.; Ohara, H.; Matsumoto, T.; Shirai, Y. Making Plastics from Garbage: A Novel Process for Poly-L-Lactate Production from Municipal Food Waste. J. Ind. Ecol. 2003, 7, 63–74. [Google Scholar] [CrossRef]
  41. Yu, P.H.; Chua, H.; Huang, A.L.; Lo, W.; Chen, G.Q. Conversion of Food Industrial Wastes into Bioplastics. Appl. Biochem. Biotechnol. 1998, 70–72, 603–614. [Google Scholar] [CrossRef] [PubMed]
  42. Perotto, G.; Ceseracciu, L.; Simonutti, R.; Paul, U.C.; Guzman-Puyol, S.; Tran, T.-N.; Bayer, I.S.; Athanassiou, A. Bioplastics from Vegetable Waste via an Eco-Friendly Water-Based Process. Green Chem. 2018, 20, 894–902. [Google Scholar] [CrossRef]
  43. Kakadellis, S.; Harris, Z.M. Don’t Scrap the Waste: The Need for Broader System Boundaries in Bioplastic Food Packaging Life-Cycle Assessment—A Critical Review. J. Clean. Prod. 2020, 274, 122831. [Google Scholar] [CrossRef]
  44. Ramadhan, M.O.; Handayani, M.N. The Potential of Food Waste as Bioplastic Material to Promote Environmental Sustainability: A Review. IOP Conf. Ser. Mater. Sci. Eng. 2020, 980, 012082. [Google Scholar] [CrossRef]
  45. Bagnani, M.; Peydayesh, M.; Knapp, T.; Appenzeller, E.; Sutter, D.; Kränzlin, S.; Gong, Y.; Wehrle, A.; Greuter, S.; Bucher, M.; et al. From Soy Waste to Bioplastics: Industrial Proof of Concept. Biomacromolecules 2024, 25, 2033–2040. [Google Scholar] [CrossRef] [PubMed]
  46. Chroni, C.; Lasaridi, K.; Stylianidis, N.; Velonia, K.; Manios, T.; Daliakopoulos, I.; Tsompanidis, C.; Hafner, G.; Skarvelakis, M.; Drosou, Z. The A2UFood Project—Avoidable and Unavoidable Food Wastes: A Holistic Managing Approach for Urban Environments. Proceedings 2019, 30, 83. [Google Scholar] [CrossRef]
  47. D’Adamo, I. Adopting Circular Economy Current Practices and Future Perspectives; MDPI: Basel, Switzerland, 2020; ISBN 978-3-03928-343-9. [Google Scholar]
  48. Finkbeiner, M.; Inaba, A.; Tan, R.; Christiansen, K.; Klüppel, H.-J. The New International Standards for Life Cycle Assessment: ISO 14040 and ISO 14044. Int. J. Life Cycle Assess. 2006, 11, 80–85. [Google Scholar] [CrossRef]
  49. Theodorou, A.; Raptis, V.; Baltzaki, C.I.M.; Manios, T.; Harmandaris, V.; Velonia, K. Synthesis and Modeling of Poly(L-Lactic Acid) via Polycondensation of L-Lactic Acid. Polymers 2023, 15, 4569. [Google Scholar] [CrossRef] [PubMed]
  50. Maragkaki, A.; Malliaros, N.G.; Sampathianakis, I.; Lolos, T.; Tsompanidis, C.; Manios, T. Evaluation of Biodegradability of Polylactic Acid and Compostable Bags from Food Waste under Industrial Composting. Sustainability 2023, 15, 15963. [Google Scholar] [CrossRef]
  51. Preethi; Kavitha, S.; Rajesh Banu, J.; Arulazhagan, P.; Gunasekaran, M. Environmental Impacts and Sustainability Assessment of Food Loss and Waste Valorization: Value Chain Analysis of Food Consumption. In Food Waste to Valuable Resources; Elsevier: Amsterdam, The Netherlands, 2020; pp. 359–388. ISBN 978-0-12-818353-3. [Google Scholar]
  52. Liu, R.; Liang, J.; Yang, Y.; Jiang, H.; Tian, X. Effect of Polylactic Acid Microplastics on Soil Properties, Soil Microbials and Plant Growth. Chemosphere 2023, 329, 138504. [Google Scholar] [CrossRef] [PubMed]
  53. Perkoulidis, G.; Malamakis, A.; Banias, G.; Moussiopoulos, N. Development of a Methodological Framework for the Evaluation of the Material and Energy Recovery Potential of Municipal Solid Waste Management: Implementation in Five Greek Regions. Circ. Econ. Sustain. 2022, 2, 313–326. [Google Scholar] [CrossRef]
  54. Powell, J.T.; Townsend, T.G.; Zimmerman, J.B. Estimates of Solid Waste Disposal Rates and Reduction Targets for Landfill Gas Emissions. Nat. Clim. Chang. 2016, 6, 162–165. [Google Scholar] [CrossRef]
  55. ISO 14040:2006 (En), Environmental Management—Life Cycle Assessment—Principles and Framework. Available online: https://www.iso.org/obp/ui/en/#iso:std:iso:14040:ed-2:v1:en (accessed on 23 June 2024).
  56. Boulay, A.-M.; Bulle, C.; Bayart, J.-B.; Deschênes, L.; Margni, M. Regional Characterization of Freshwater Use in LCA: Modeling Direct Impacts on Human Health. Environ. Sci. Technol. 2011, 45, 8948–8957. [Google Scholar] [CrossRef] [PubMed]
  57. Hélias, A.; Esnouf, A.; Finkbeiner, M. Consistent Normalization Approach for Life Cycle Assessment Based on Inventory Databases. Sci. Total Environ. 2020, 703, 134583. [Google Scholar] [CrossRef] [PubMed]
  58. Lim, L.-T.; Auras, R.; Rubino, M. Processing Technologies for Poly(Lactic Acid). Prog. Polym. Sci. 2008, 33, 820–852. [Google Scholar] [CrossRef]
  59. Rezvani Ghomi, E.R.; Khosravi, F.; Saedi Ardahaei, A.S.; Dai, Y.; Neisiany, R.E.; Foroughi, F.; Wu, M.; Das, O.; Ramakrishna, S. The Life Cycle Assessment for Polylactic Acid (PLA) to Make It a Low-Carbon Material. Polymers 2021, 13, 1854. [Google Scholar] [CrossRef] [PubMed]
  60. Goldschmidt, J.; Sankavaram, K.; Udahogora, M. Advancing Cultural Competencies: Applying the Dietary Exchange List System to Jamaican Foods. Health Sci. J. 2018, 12. [Google Scholar] [CrossRef]
  61. Karytsas, S.; Vardopoulos, I.; Theodoropoulou, E. Factors Affecting Sustainable Market Acceptance of Residential Microgeneration Technologies. A Two Time Period Comparative Analysis. Energies 2019, 12, 3298. [Google Scholar] [CrossRef]
  62. Oikonomou, T.I.; Andreosatos, C.; Drosou, V.; Karytsas, C. The Influence of Energy Policy Instruments upon the Promotion of Solar Thermal Technology in Greece. In Proceedings of the BEHAVE 2020—6th European Conference on Behaviour and Energy Efficiency, Copenhagen, Denmark, 21–23 October 2020; Available online: https://c2e2.unepccc.org/wp-content/uploads/sites/3/2021/05/442-the-influence-of-energy-policy-instruments-upon-the-promotion-of-solar-thermal-technology-in-greece.pdf (accessed on 12 January 2024).
  63. Rashid Khan, H.U.; Awan, U.; Zaman, K.; Nassani, A.A.; Haffar, M.; Abro, M.M.Q. Assessing Hybrid Solar-Wind Potential for Industrial Decarbonization Strategies: Global Shift to Green Development. Energies 2021, 14, 7620. [Google Scholar] [CrossRef]
  64. Al Shidi, H.; Sulaiman, H.; Amoatey, P. Shifting to Renewable Energy to Mitigate Carbon Emissions: Initiatives by the States of Gulf Cooperation Council. Low Carbon Econ. 2016, 07, 123–136. [Google Scholar] [CrossRef]
  65. Sheldon, S.; Hadian, S.; Zik, O. Beyond Carbon: Quantifying Environmental Externalities as Energy for Hydroelectric and Nuclear Power. Energy 2015, 84, 36–44. [Google Scholar] [CrossRef]
  66. International Energy Agency. Greece 2023 Energy Policy Review; IEA Energy Policy Reviews; OECD: Paris, France, 2023; ISBN 978-92-64-32569-2. [Google Scholar]
  67. Plant, A.L.; Becker, C.A.; Hanisch, R.J.; Boisvert, R.F.; Possolo, A.M.; Elliott, J.T. How Measurement Science Can Improve Confidence in Research Results. PLoS Biol. 2018, 16, e2004299. [Google Scholar] [CrossRef] [PubMed]
  68. Hong, J.; Shaked, S.; Rosenbaum, R.K.; Jolliet, O. Analytical Uncertainty Propagation in Life Cycle Inventory and Impact Assessment: Application to an Automobile Front Panel. Int. J. Life Cycle Assess. 2010, 15, 499–510. [Google Scholar] [CrossRef]
  69. Adamczak, S.; Świderski, J.; Dobrowolski, T.; Mathia, T.G. Evaluation of Measurement Uncertainty of Profile Parameters Using a Monte Carlo Method. Mechanik 2018, 418–420. [Google Scholar] [CrossRef]
  70. Madhavan Nampoothiri, K.; Nair, N.R.; John, R.P. An Overview of the Recent Developments in Polylactide (PLA) Research. Bioresour. Technol. 2010, 101, 8493–8501. [Google Scholar] [CrossRef] [PubMed]
  71. Escobar, N.; Haddad, S.; Börner, J.; Britz, W. Land Use Mediated GHG Emissions and Spillovers from Increased Consumption of Bioplastics. Environ. Res. Lett. 2018, 13, 125005. [Google Scholar] [CrossRef]
  72. Chen, W.; Oldfield, T.L.; Cinelli, P.; Righetti, M.C.; Holden, N.M. Hybrid Life Cycle Assessment of Potato Pulp Valorisation in Biocomposite Production. J. Clean. Prod. 2020, 269, 122366. [Google Scholar] [CrossRef]
  73. Qiu, H.; Hu, B.; Zhang, Z. Impacts of Land Use Change on Ecosystem Service Value Based on SDGs Report--Taking Guangxi as an Example. Ecol. Indic. 2021, 133, 108366. [Google Scholar] [CrossRef]
  74. Aymard, V.; Botta-Genoulaz, V. Normalisation in Life-Cycle Assessment: Consequences of New European Factors on Decision-Making. Supply Chain Forum Int. J. 2017, 18, 76–83. [Google Scholar] [CrossRef]
  75. Lim, S.-R. Application of Life Cycle Assessment to Enhance the Environmental Performance of Process Systems and Products. Clean Technol. 2014, 20, 339–348. [Google Scholar] [CrossRef]
  76. Fahim, I.S.; Chbib, H.; Mahmoud, H.M. The Synthesis, Production & Economic Feasibility of Manufacturing PLA from Agricultural Waste. Sustain. Chem. Pharm. 2019, 12, 100142. [Google Scholar] [CrossRef]
  77. Rosenboom, J.-G.; Langer, R.; Traverso, G. Bioplastics for a Circular Economy. Nat. Rev. Mater. 2022, 7, 117–137. [Google Scholar] [CrossRef] [PubMed]
  78. Samer, M.; Hijazi, O.; Mohamed, B.A.; Abdelsalam, E.M.; Amer, M.A.; Yacoub, I.H.; Attia, Y.A.; Bernhardt, H. Environmental Impact Assessment of Bioplastics Production from Agricultural Crop Residues. Clean Technol. Environ. Policy 2022, 24, 815–827. [Google Scholar] [CrossRef]
  79. Banu, J.R.; Sharmila, V.G. Review on Food Waste Valorisation for Bioplastic Production towards a Circular Economy: Sustainable Approaches and Biodegradability Assessment. Sustain. Energy Fuels 2023, 7, 3165–3184. [Google Scholar] [CrossRef]
  80. Berndtsson, M.; Ericsson, A.; Svahn, T. Scaling-Up Data-Driven Pilot Projects. AI Mag. 2020, 41, 94–102. [Google Scholar] [CrossRef]
  81. Chinnathai, M.K.; Al-Mowafy, Z.; Alkan, B.; Vera, D.; Harrison, R. A Framework for Pilot Line Scale-up Using Digital Manufacturing. Procedia CIRP 2019, 81, 962–967. [Google Scholar] [CrossRef]
Figure 1. Flow chart with the boundaries of functional units for the baseline scenario.
Sustainability 16 05529 g001
Figure 2. Process flowchart for PLA production in the A2UFood pilot scale unit.
Sustainability 16 05529 g002
Figure 3. Characterization results for the production of PLA from FW.
Sustainability 16 05529 g003
Figure 4. Normalization results for the impact categories for the production of PLA from FW.
Sustainability 16 05529 g004
Figure 5. Characterization results for the alternative feedstock scenario, including the total prevention.
Sustainability 16 05529 g005
Figure 6. Normalization results for the alternative feedstock scenario, including the total prevention.
Sustainability 16 05529 g006
Figure 7. Characterization diagram of sensitivity analysis for the main impact categories.
Sustainability 16 05529 g007
Figure 8. Uncertainty analysis for all avoided products at the normalization level.
Sustainability 16 05529 g008
Table 1. Characterization impact assessment results for the production of 99 kg of PLA from FW.
Impact Category (Unit)TotalChemical for PLAElectricity, GR_2021Avoided FW
CC (kg CO2 eq.)2492.151109.931433.14−50.93
OD (kg CFC11 eq.)0.00040.00030.00013−1.6 × 10⁻⁶
IR (kBq U-235 eq.)238.2374.56165.79−2.12967
POF (kg NMVOC eq.)5.993.552.5425−0.10398
PM (disease inc.)8.86 × 10−54.75 × 10−54.35 × 10⁻⁵−2.4 × 10⁻⁶
HT-nc (CTUh)1.87 × 10−51.23 × 10−57.38 × 10⁻⁶−9.6 × 10⁻⁷
HT-c (CTUh)5.37 × 10−73.03 × 10−72.58 × 10⁻⁷−2.5 × 10⁻⁸
A (mol H+ eq.)14.335.8452398.83−0.34
E-f (kg P eq.)2.240.381.96−0.05
E m (kg N eq.)2.011.021.06−0.07
E-t (mol N eq.)18.4512.417.25−1.16
ECoX-f (CTUe)31,178.835,891.193448.83−8161.2
LU (Pt)7175.528,241.53240.65−21306.7
WU (m3 depriv.)11,037.22063.449211.42−237.7
RU-f (MJ)18,815.919,070.011.43−255.4
RU mm (kg Sb eq.)0.0150.020−0.0007
Table 2. Characterization impact assessment results for the production of 99 kg of PLA for the alternative feedstock scenario for the main impact categories.
Impact Category (Unit)TotalChemical for PLAElectricity GR_2021Avoided Raw Material
CC (kg CO2 eq.)2360.951109.941433.14−182.13
OD (kg CFC11 eq.)0.00040.000230.00014−1.4 × 10⁻⁵
IR (kBq U-235 eq.)225.8974.56165.79−14.463
POF (kg NMVOC eq.)5.623.552.54−0.47
PM (disease inc.)7.84 × 10−54.75 × 10−54.35 × 10⁻⁵−1.3 × 10⁻⁵
HT-nc (CTUh)1.72 × 10−51.23 × 10−57.38 × 10⁻⁶−2.4 × 10⁻⁶
HT-c (CTUh)4.97 × 10−73.03 × 10−72.58 × 10⁻⁷−6.4 × 10⁻⁸
A (mol H+ eq.)12.815.858.825883−1.86
E-f (kg P eq.)2.200.331.96−0.09
E m (kg N eq.)0.021.021.06−2.06
E-t (mol N eq.)12.4212.417.25−7.24
ECoX-f (CTUe)21,125.635,891.23448.83−18,214.4
LU (Pt)6978.4728,241.5240.65−21,503.7
WU (m3 depriv.)4327.672063.449211.42−6947.19
RU-f (MJ)18,815.219,070.01.43−256.24
RU mm (kg Sb eq.)0.020.020−0.0007
Disclaimer/Publisher’s Note: The statements, opinions and data contained in all publications are solely those of the individual author(s) and contributor(s) and not of MDPI and/or the editor(s). MDPI and/or the editor(s) disclaim responsibility for any injury to people or property resulting from any ideas, methods, instructions or products referred to in the content.

