

Feasibility of Natural Fibre Usage for Wind Turbine Blade Components: A Structural and Environmental Assessment
 , , ,
, , ,
Abstract
:1. Introduction
2. Materials and Methods
2.1. Baseline Wind Turbine Blade
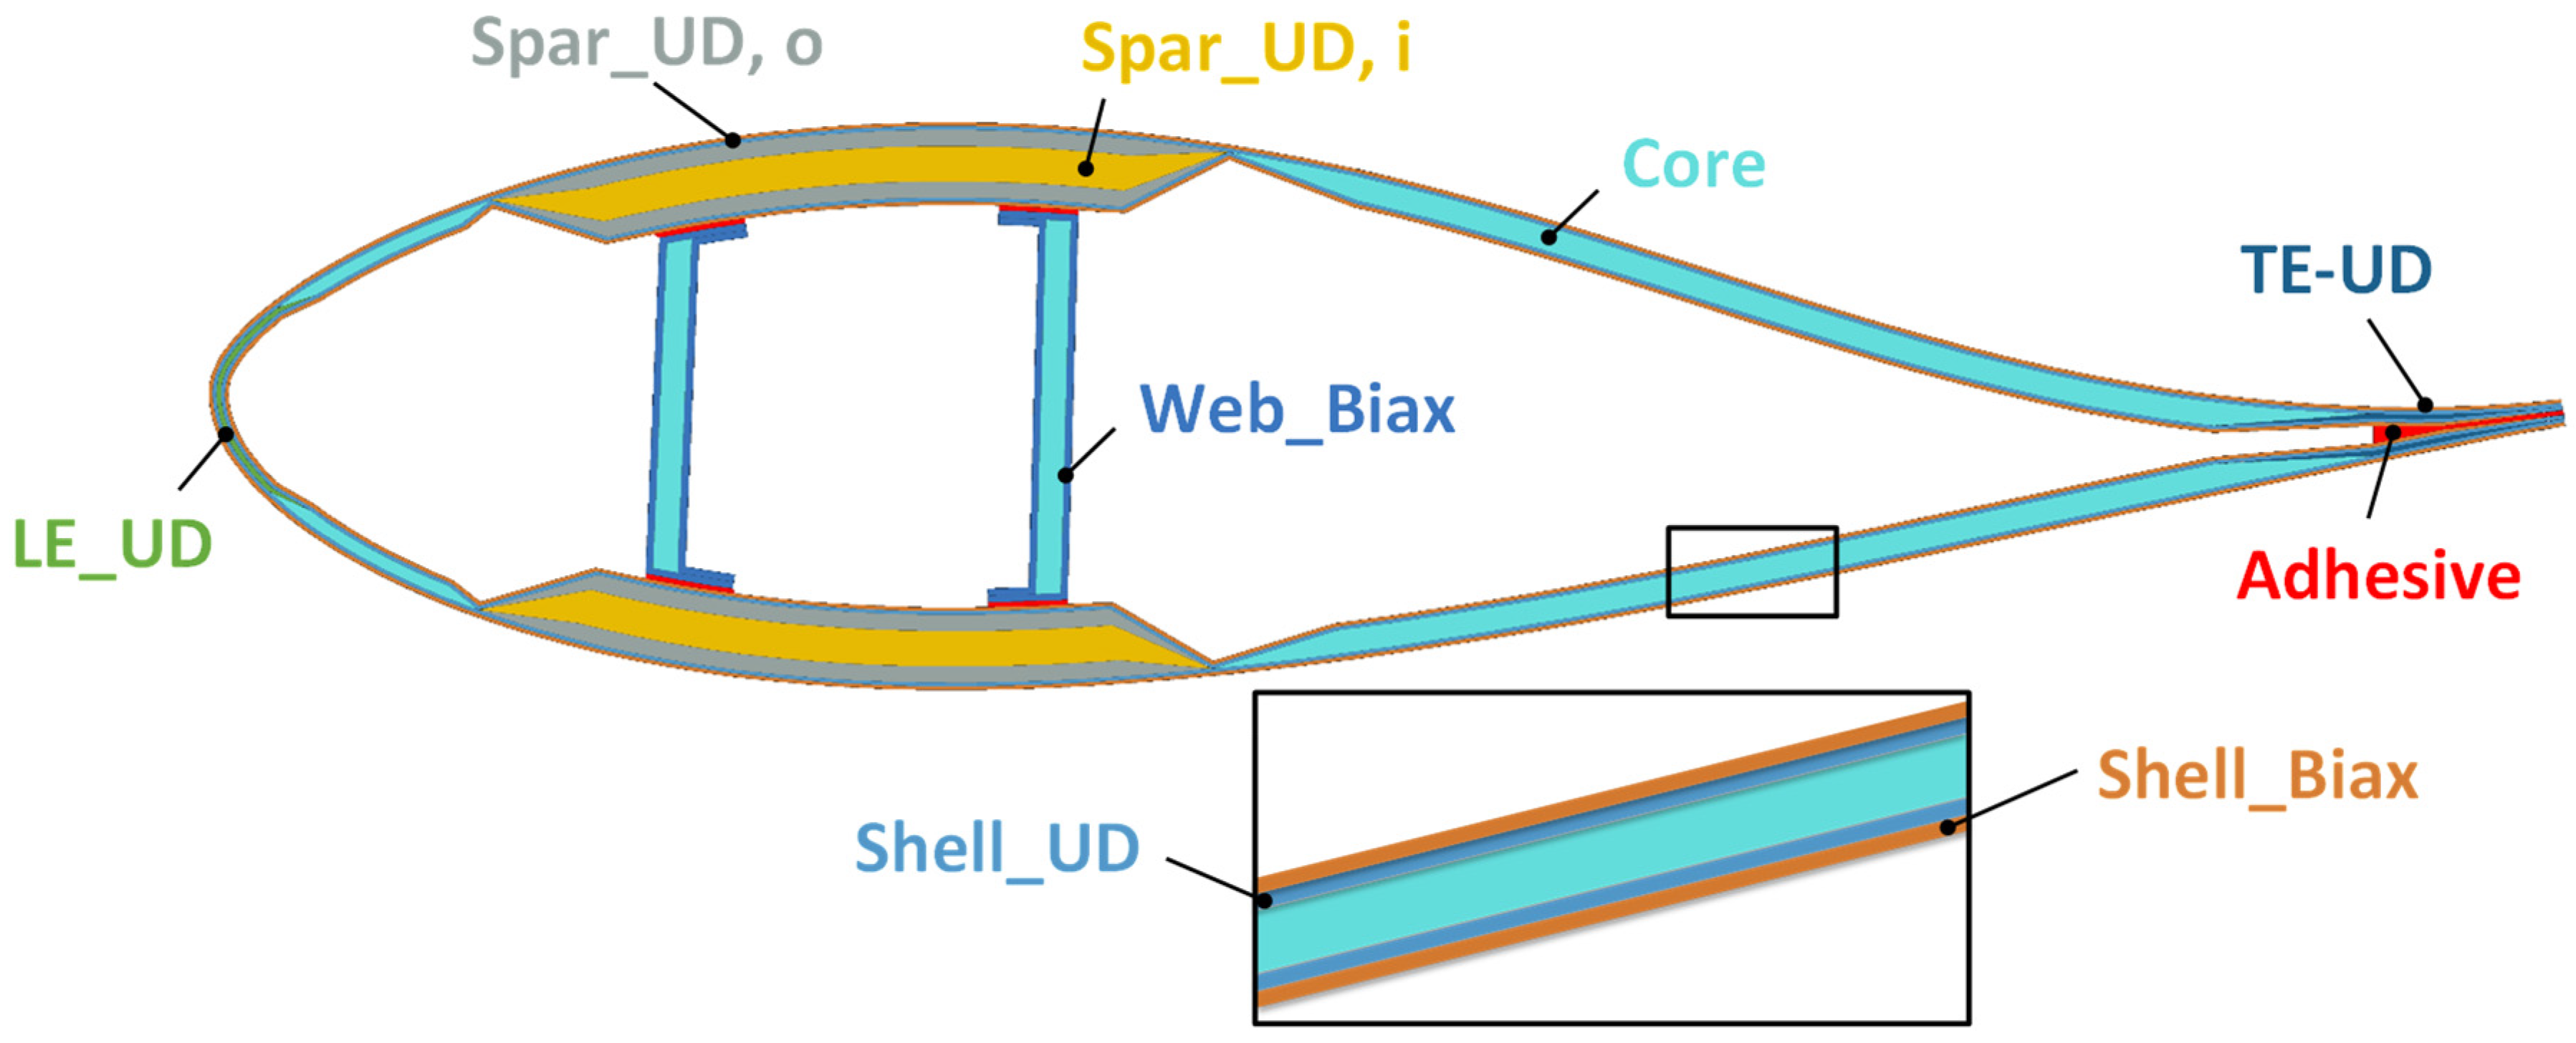
2.2. Blade Structure and Materials
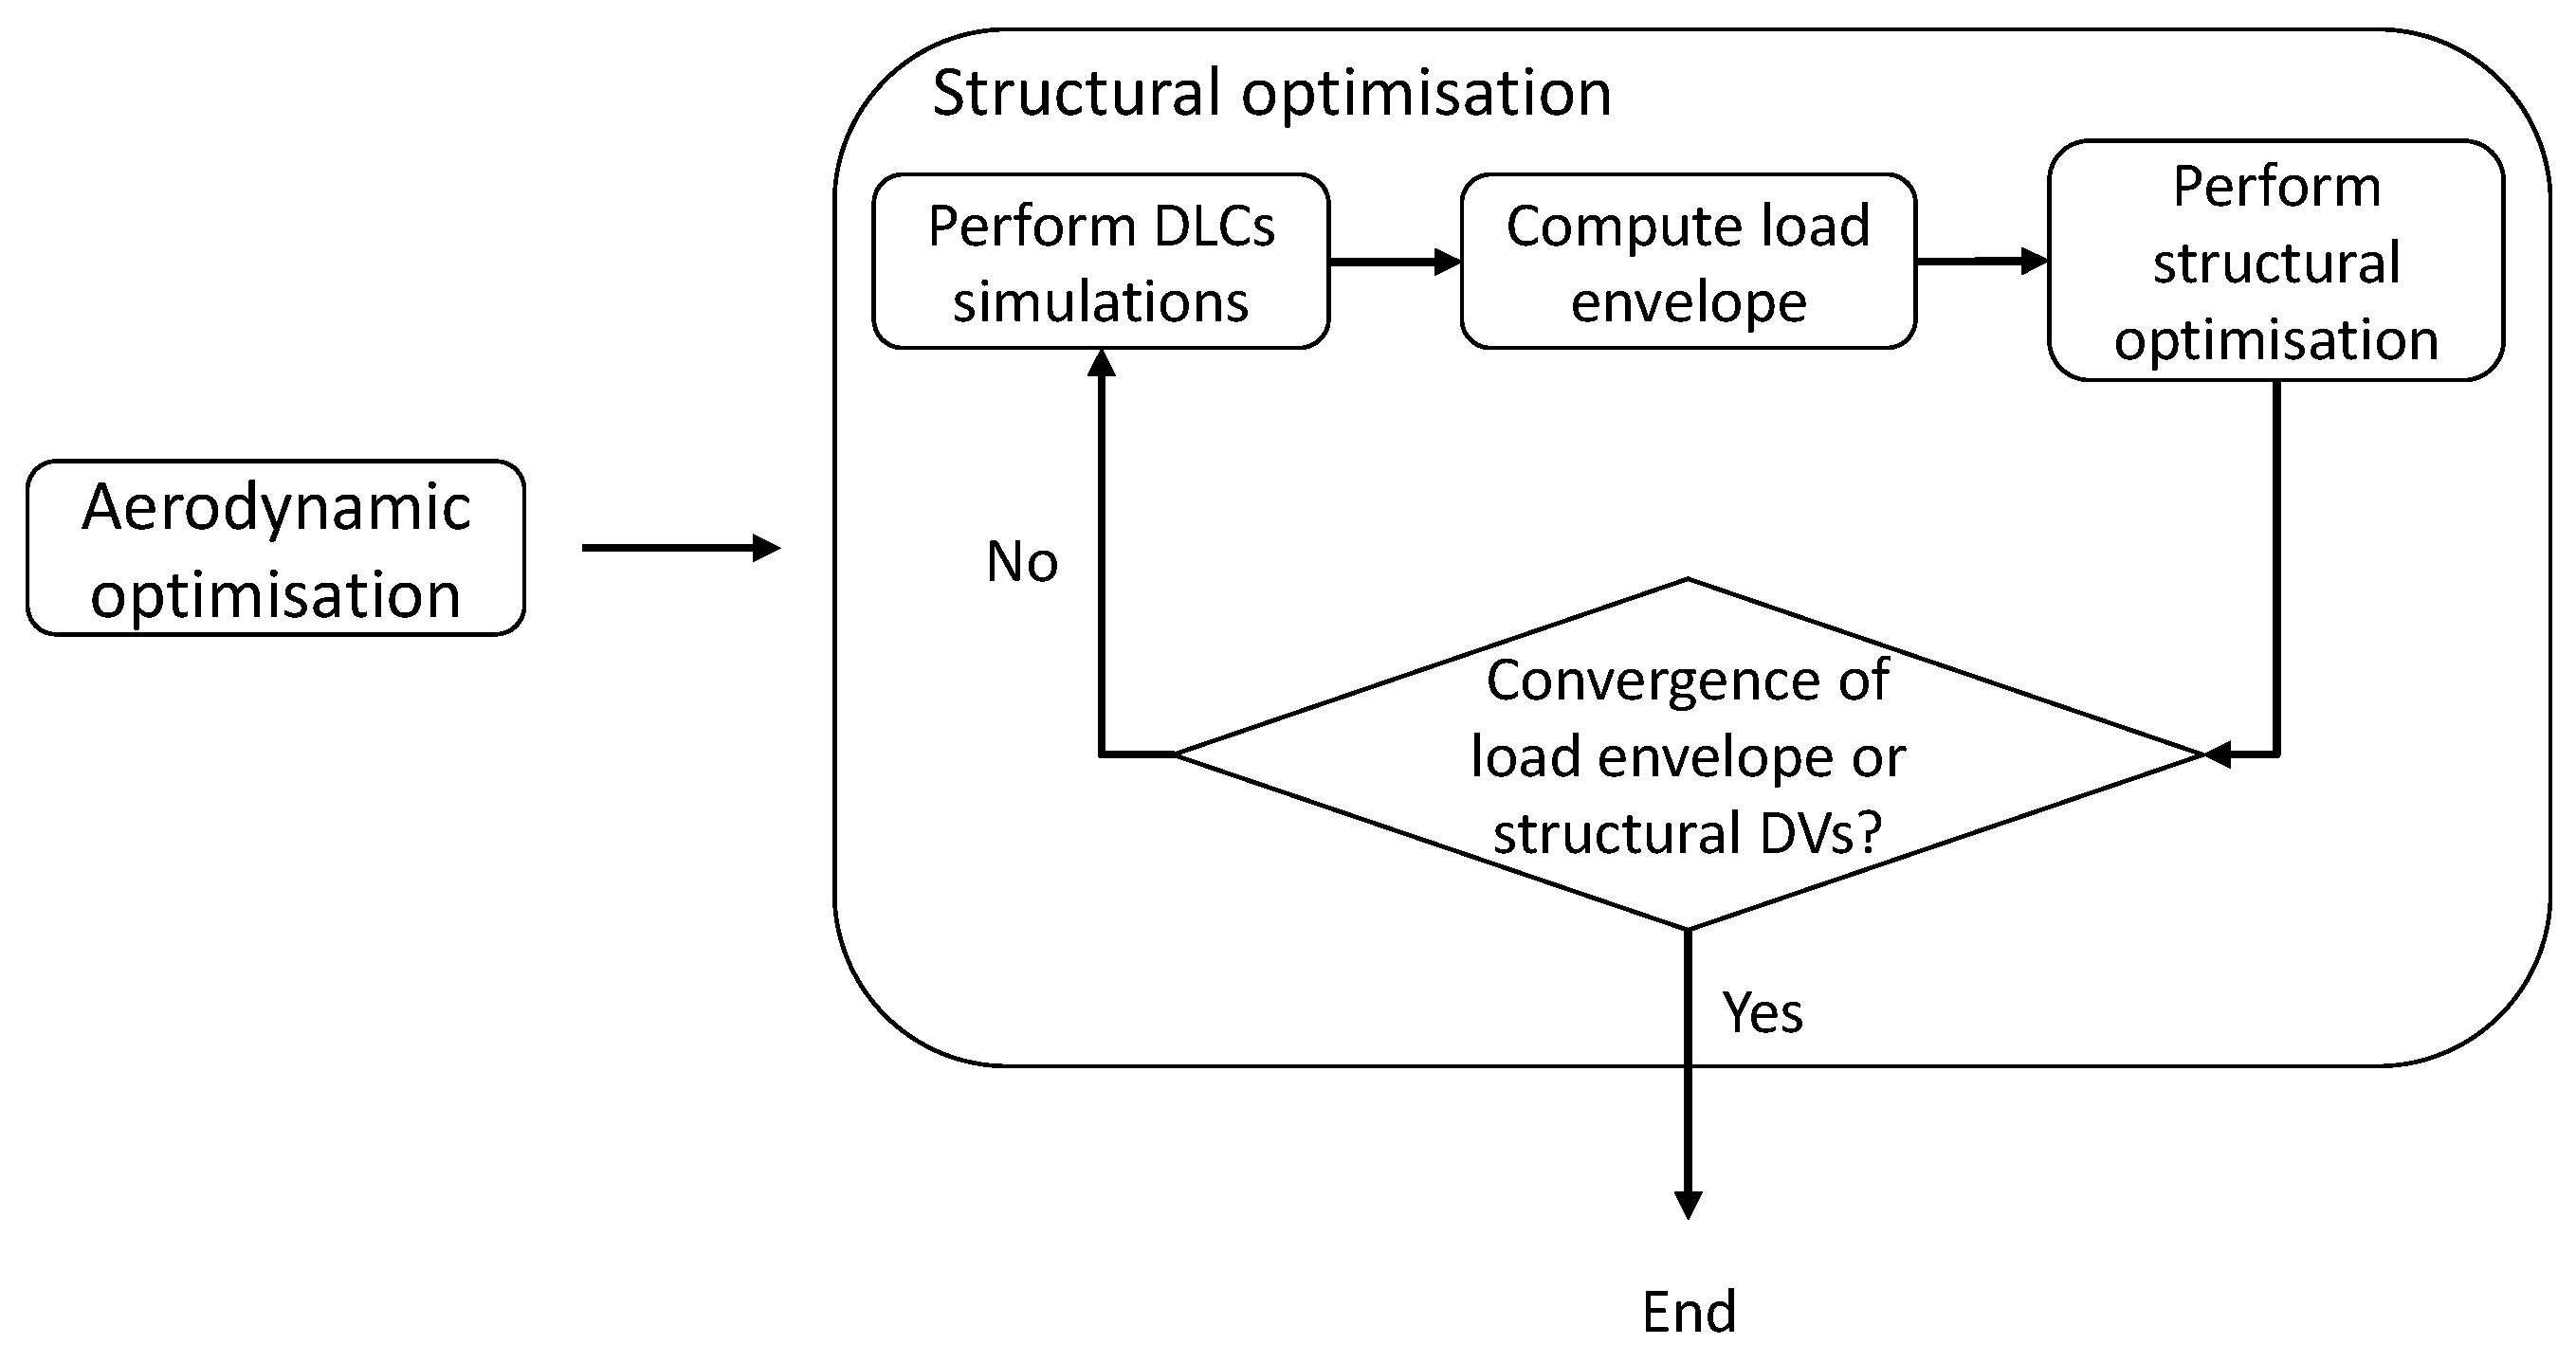
2.3. Blade Design Optimisation
2.4. Lifecycle Assessment
2.4.1. Goal and Scope
Functional Unit
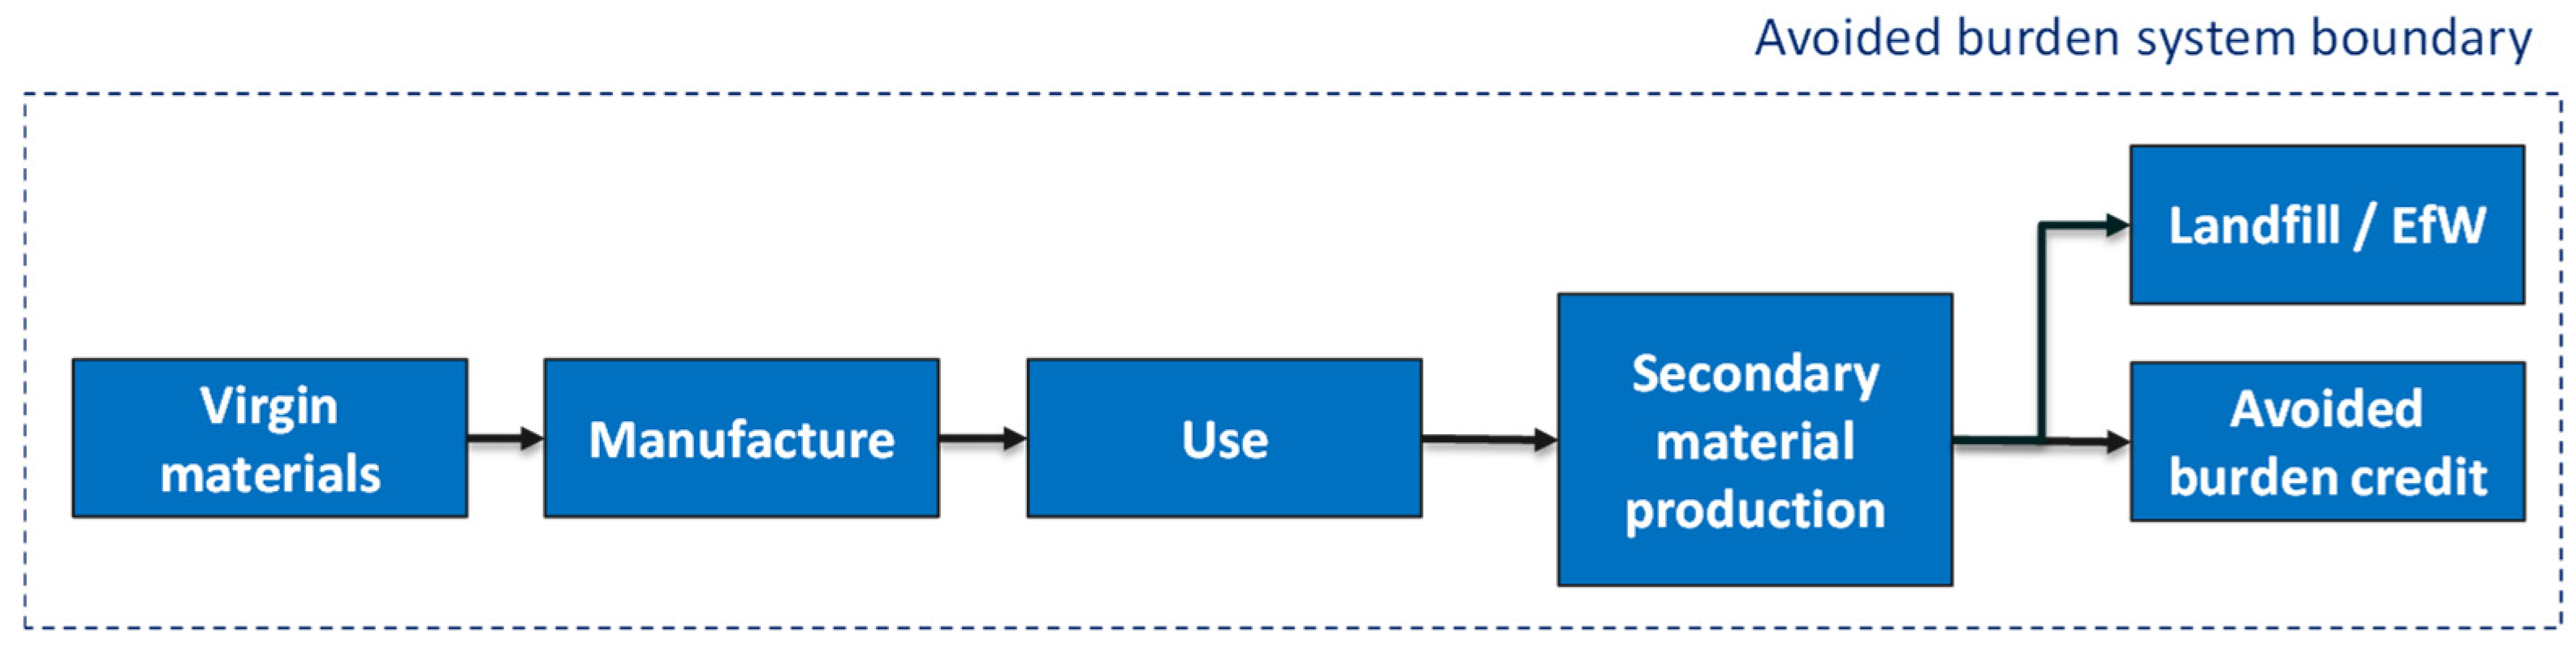
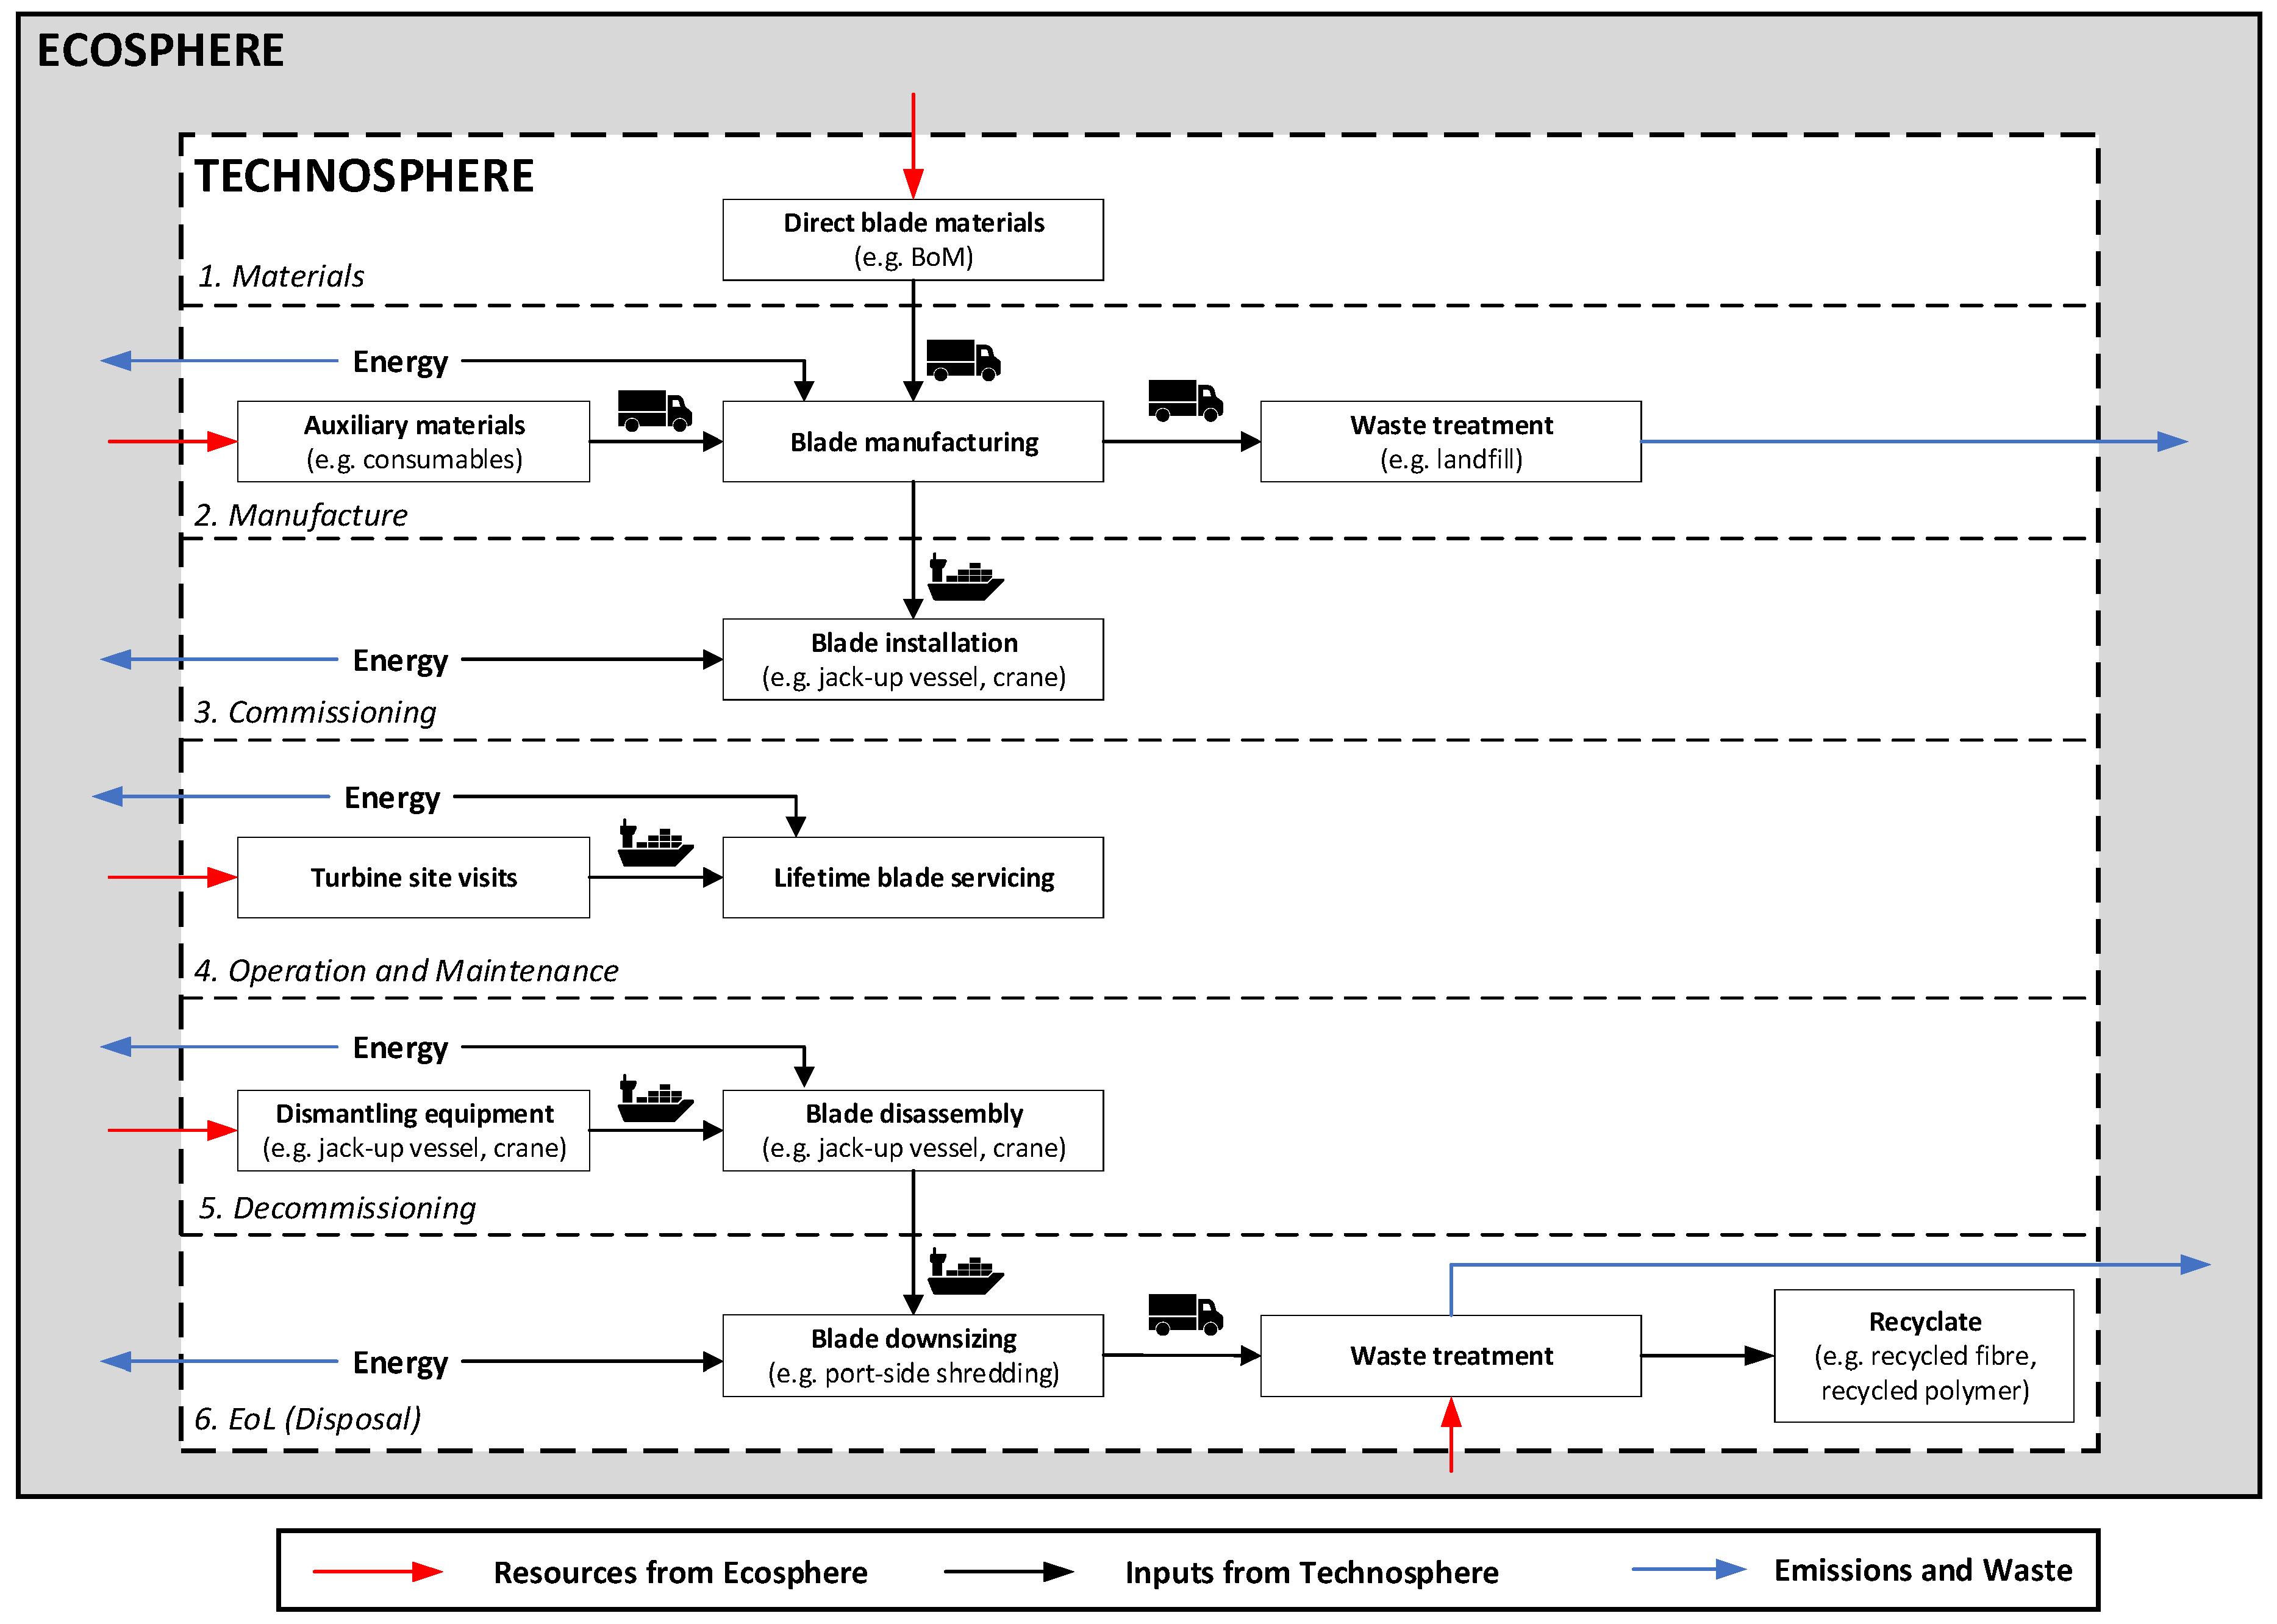
System Boundary
Scenarios
2.4.2. Lifecycle Inventory
Data Sources
Processes and Assumptions in LCI Calculations
Allocation
Cut-Off Criteria
2.5. Lifecycle Impact Assessment
- Abiotic Depletion (ADP elements) [kg Sb eq.]
- Abiotic Depletion (ADP fossil) [MJ]
- Acidification Potential (AP) [kg SO2 eq.]
- Eutrophication Potential (EP) [kg Phosphate eq.]
- Freshwater Aquatic Ecotoxicity Pot. (FAETP inf.) [kg DCB eq.]
- Global Warming Potential (GWP 100 years) [kg CO2eq.]
- Global Warming Potential (GWP 100 years), excl. biogenic carbon [kg CO2eq.]
- Human Toxicity Potential (HTP inf.) [kg DCB eq.]
- Marine Aquatic Ecotoxicity Pot. (MAETP inf.) [kg DCB eq.]
- Ozone Layer Depletion Potential (ODP, steady state) [kg R11 eq.]
- Photochem. Ozone Creation Potential (POCP) [kg Ethene eq.]
- Terrestric Ecotoxicity Potential (TETP inf.) [kg DCB eq.]
3. Results
3.1. Blade Design Optimisation
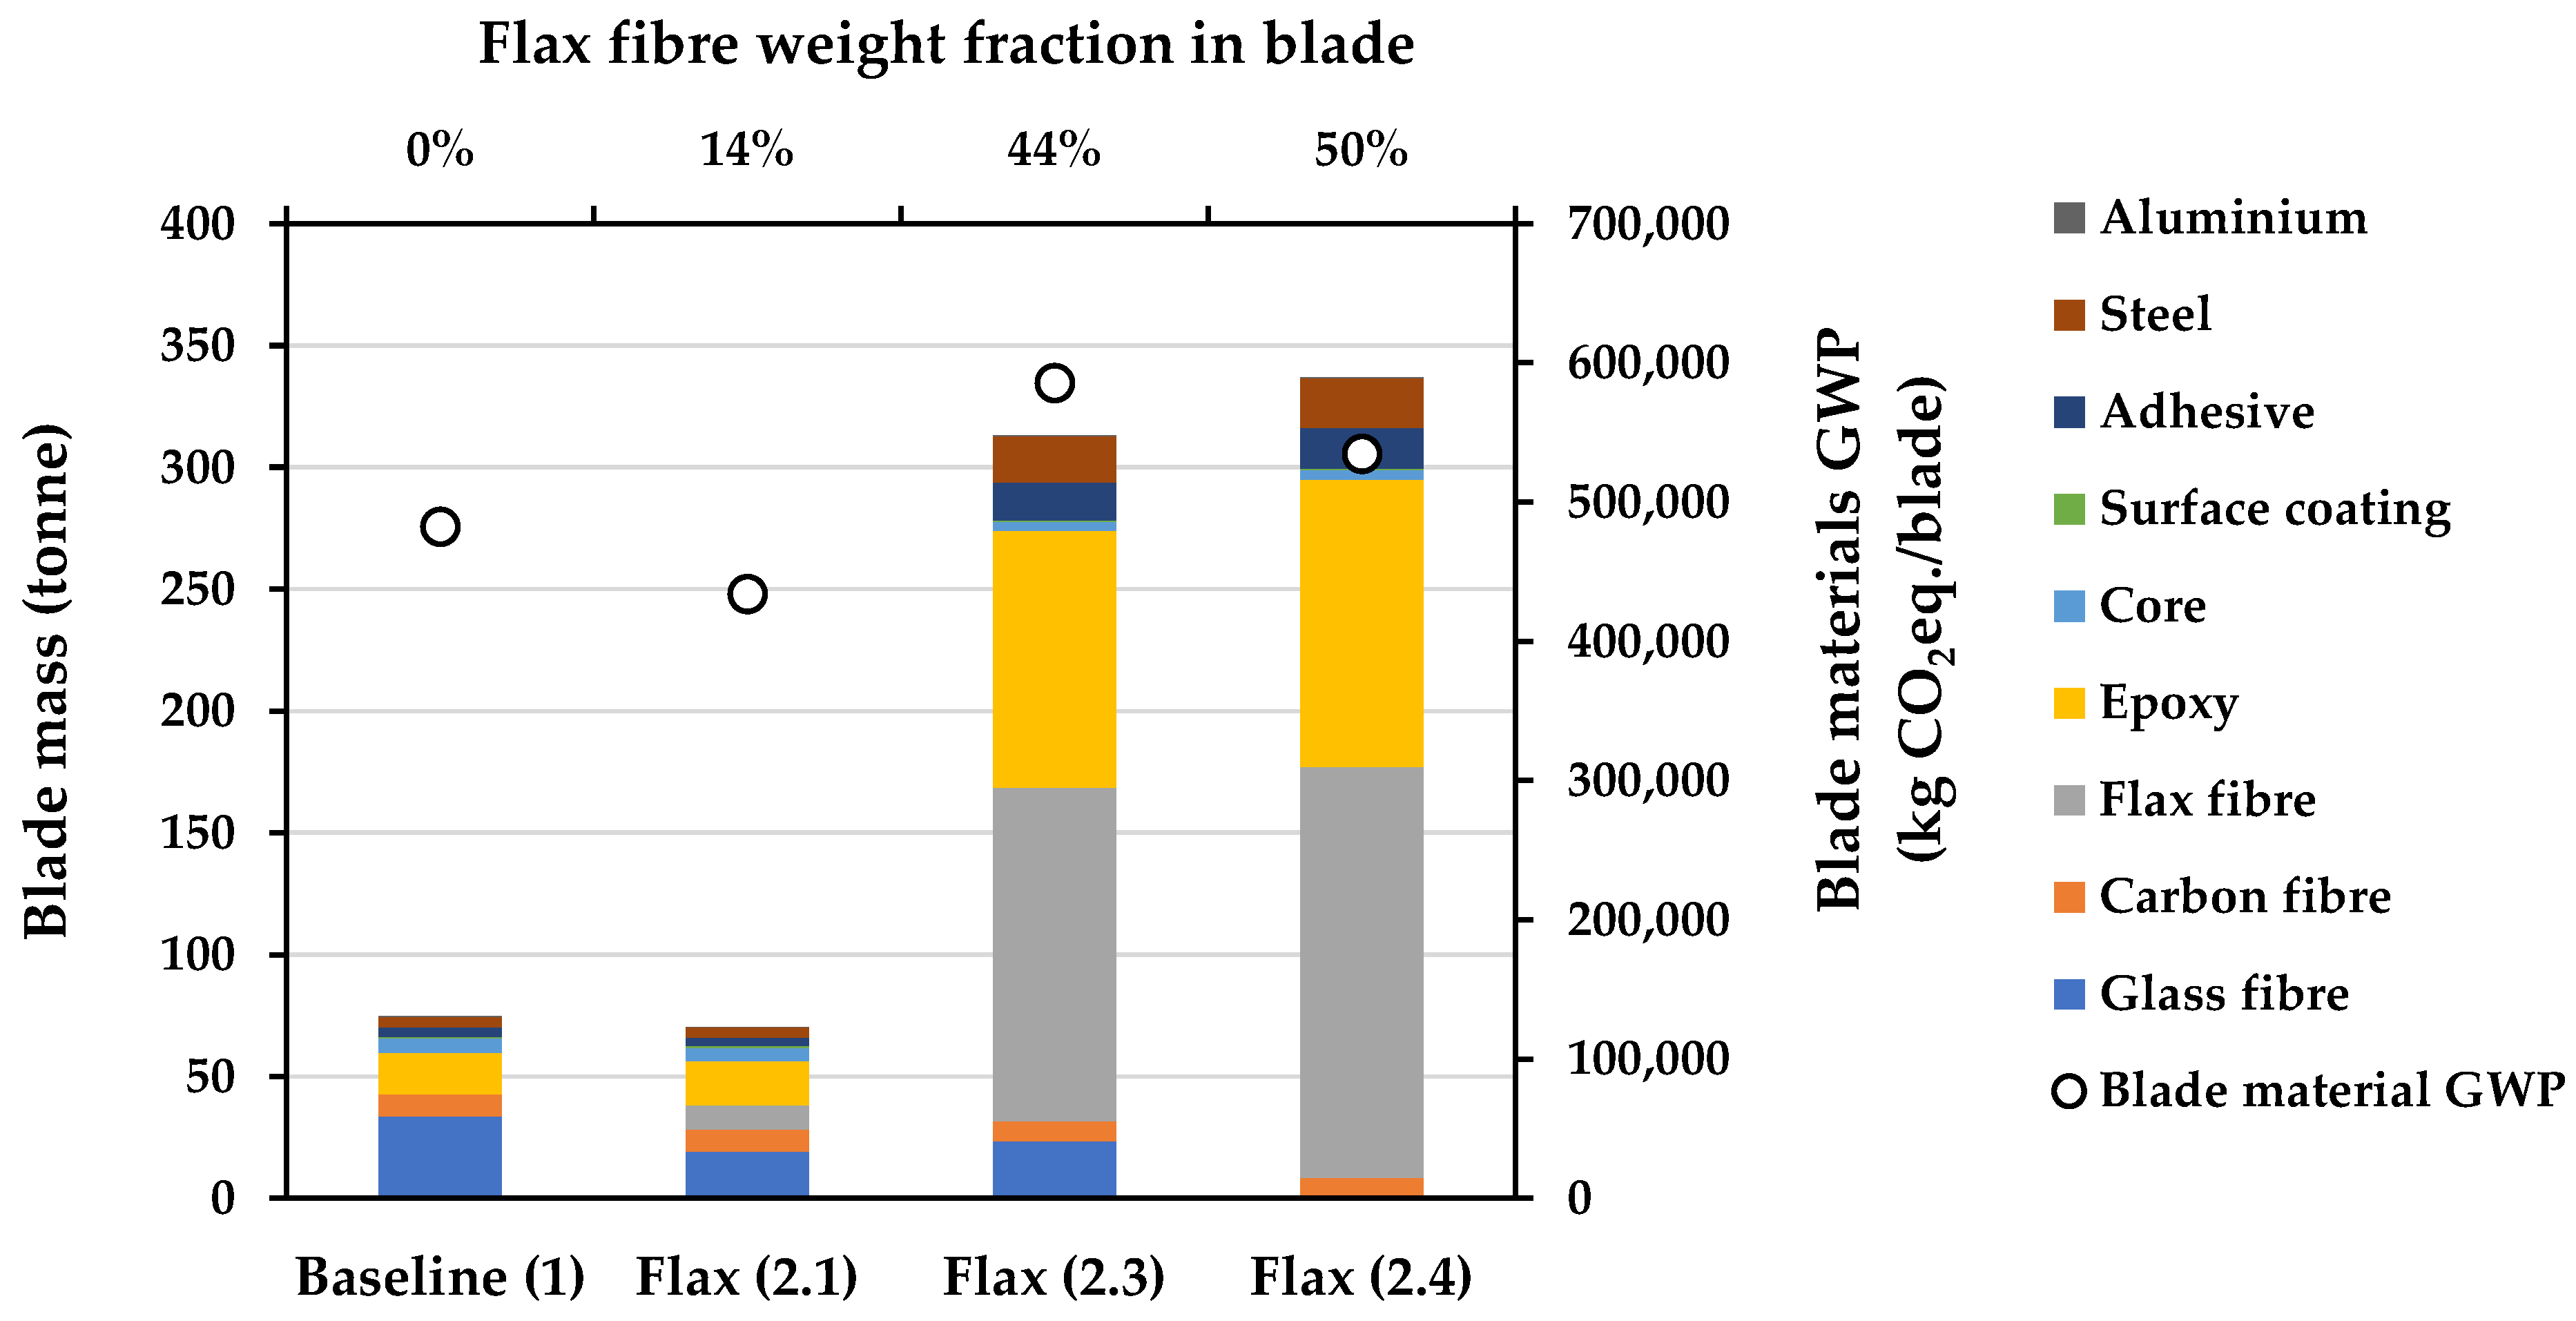
3.1.1. Influence of Flax Fibre Deployment
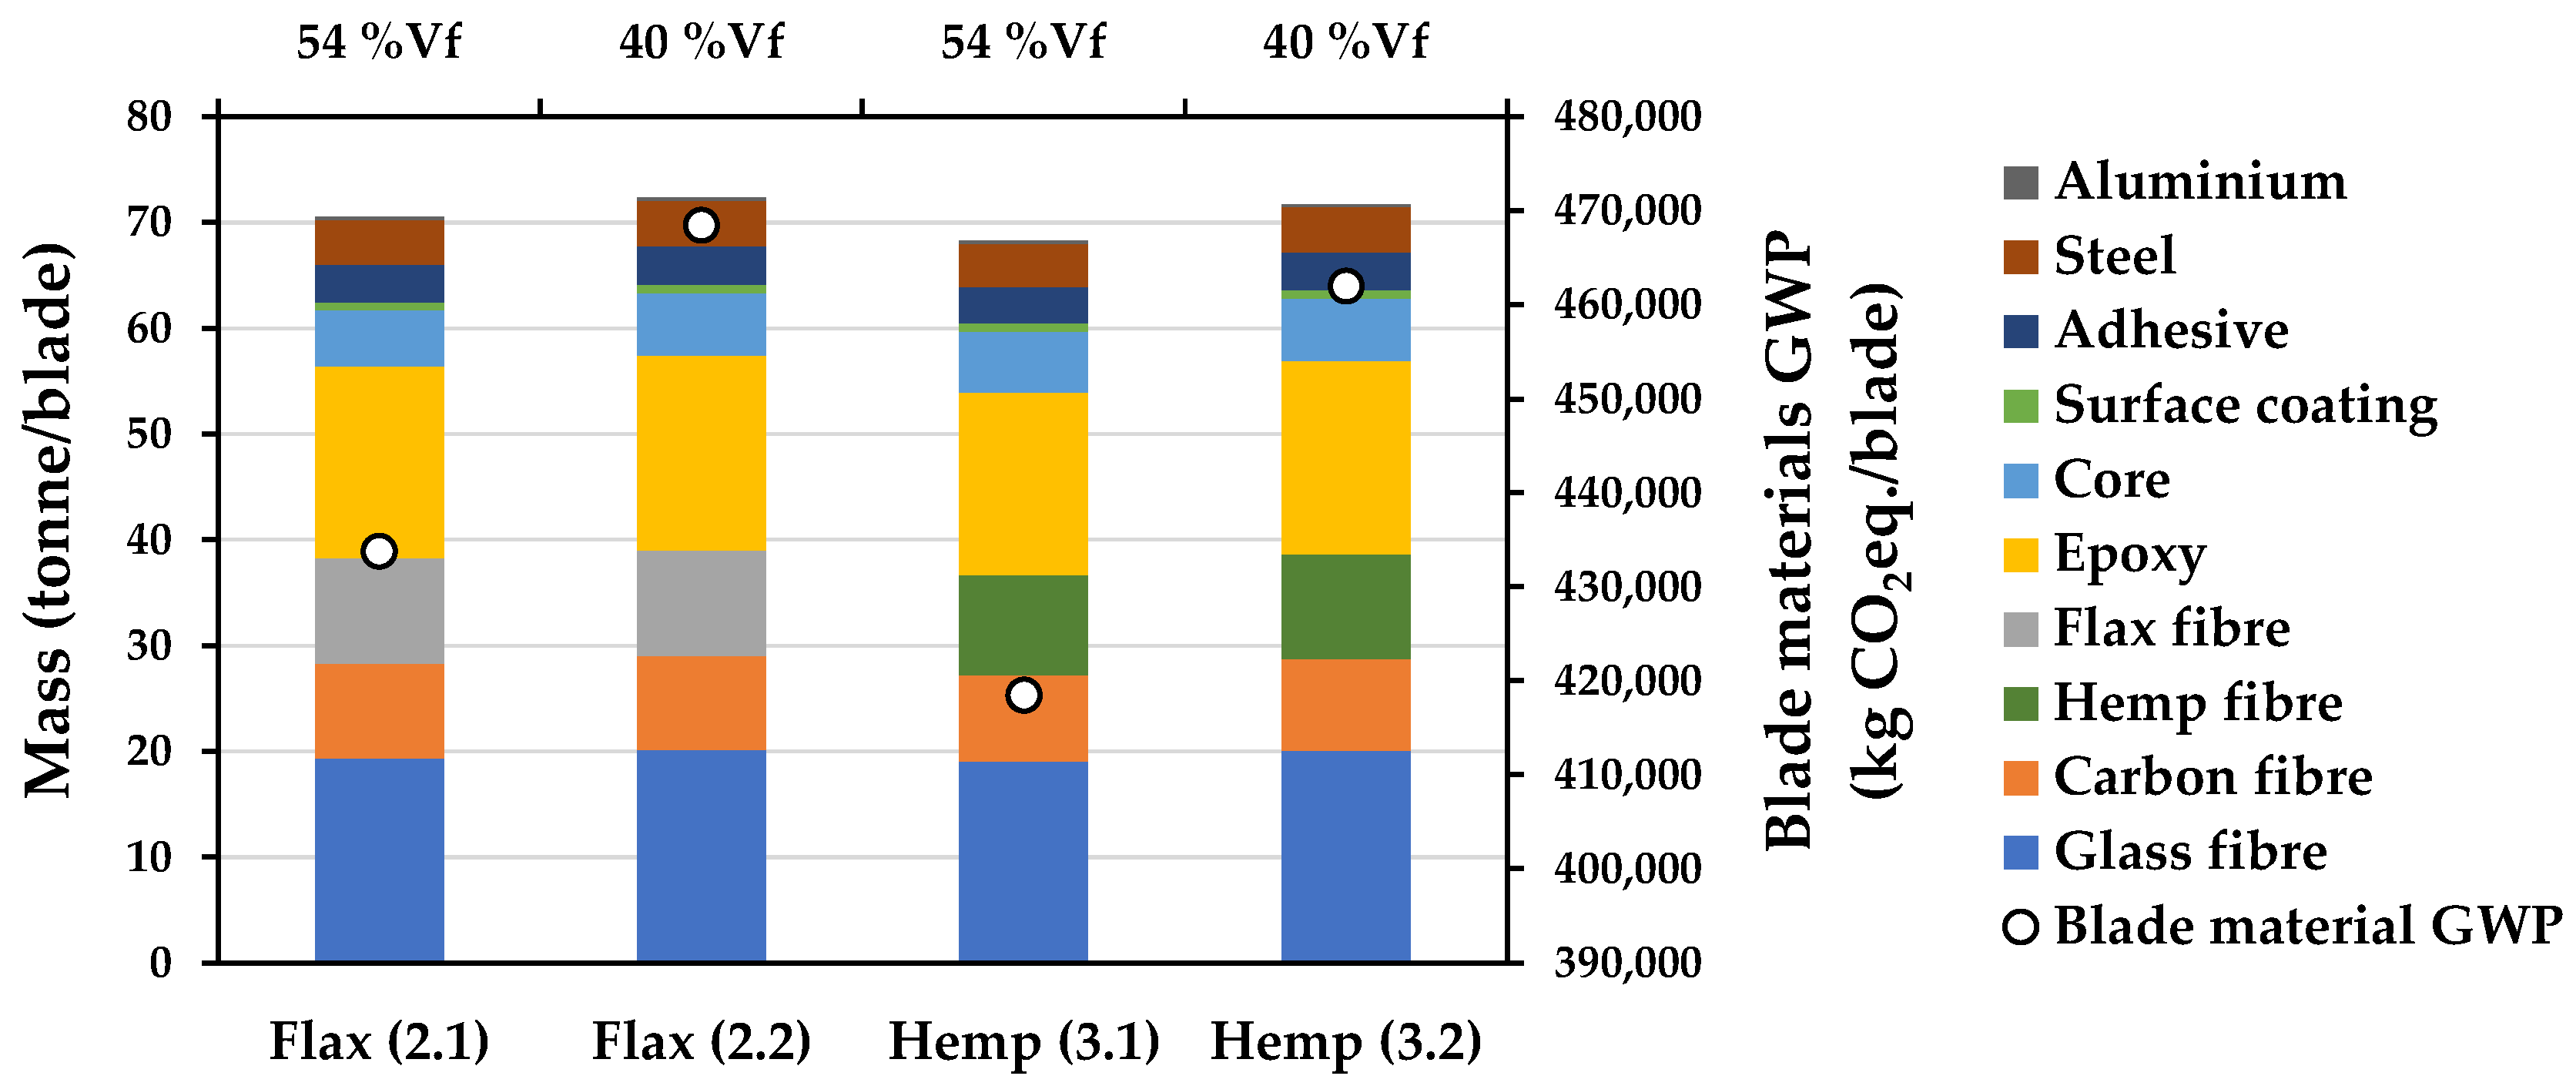
3.1.2. Influence of Natural Fibre Volume Fraction
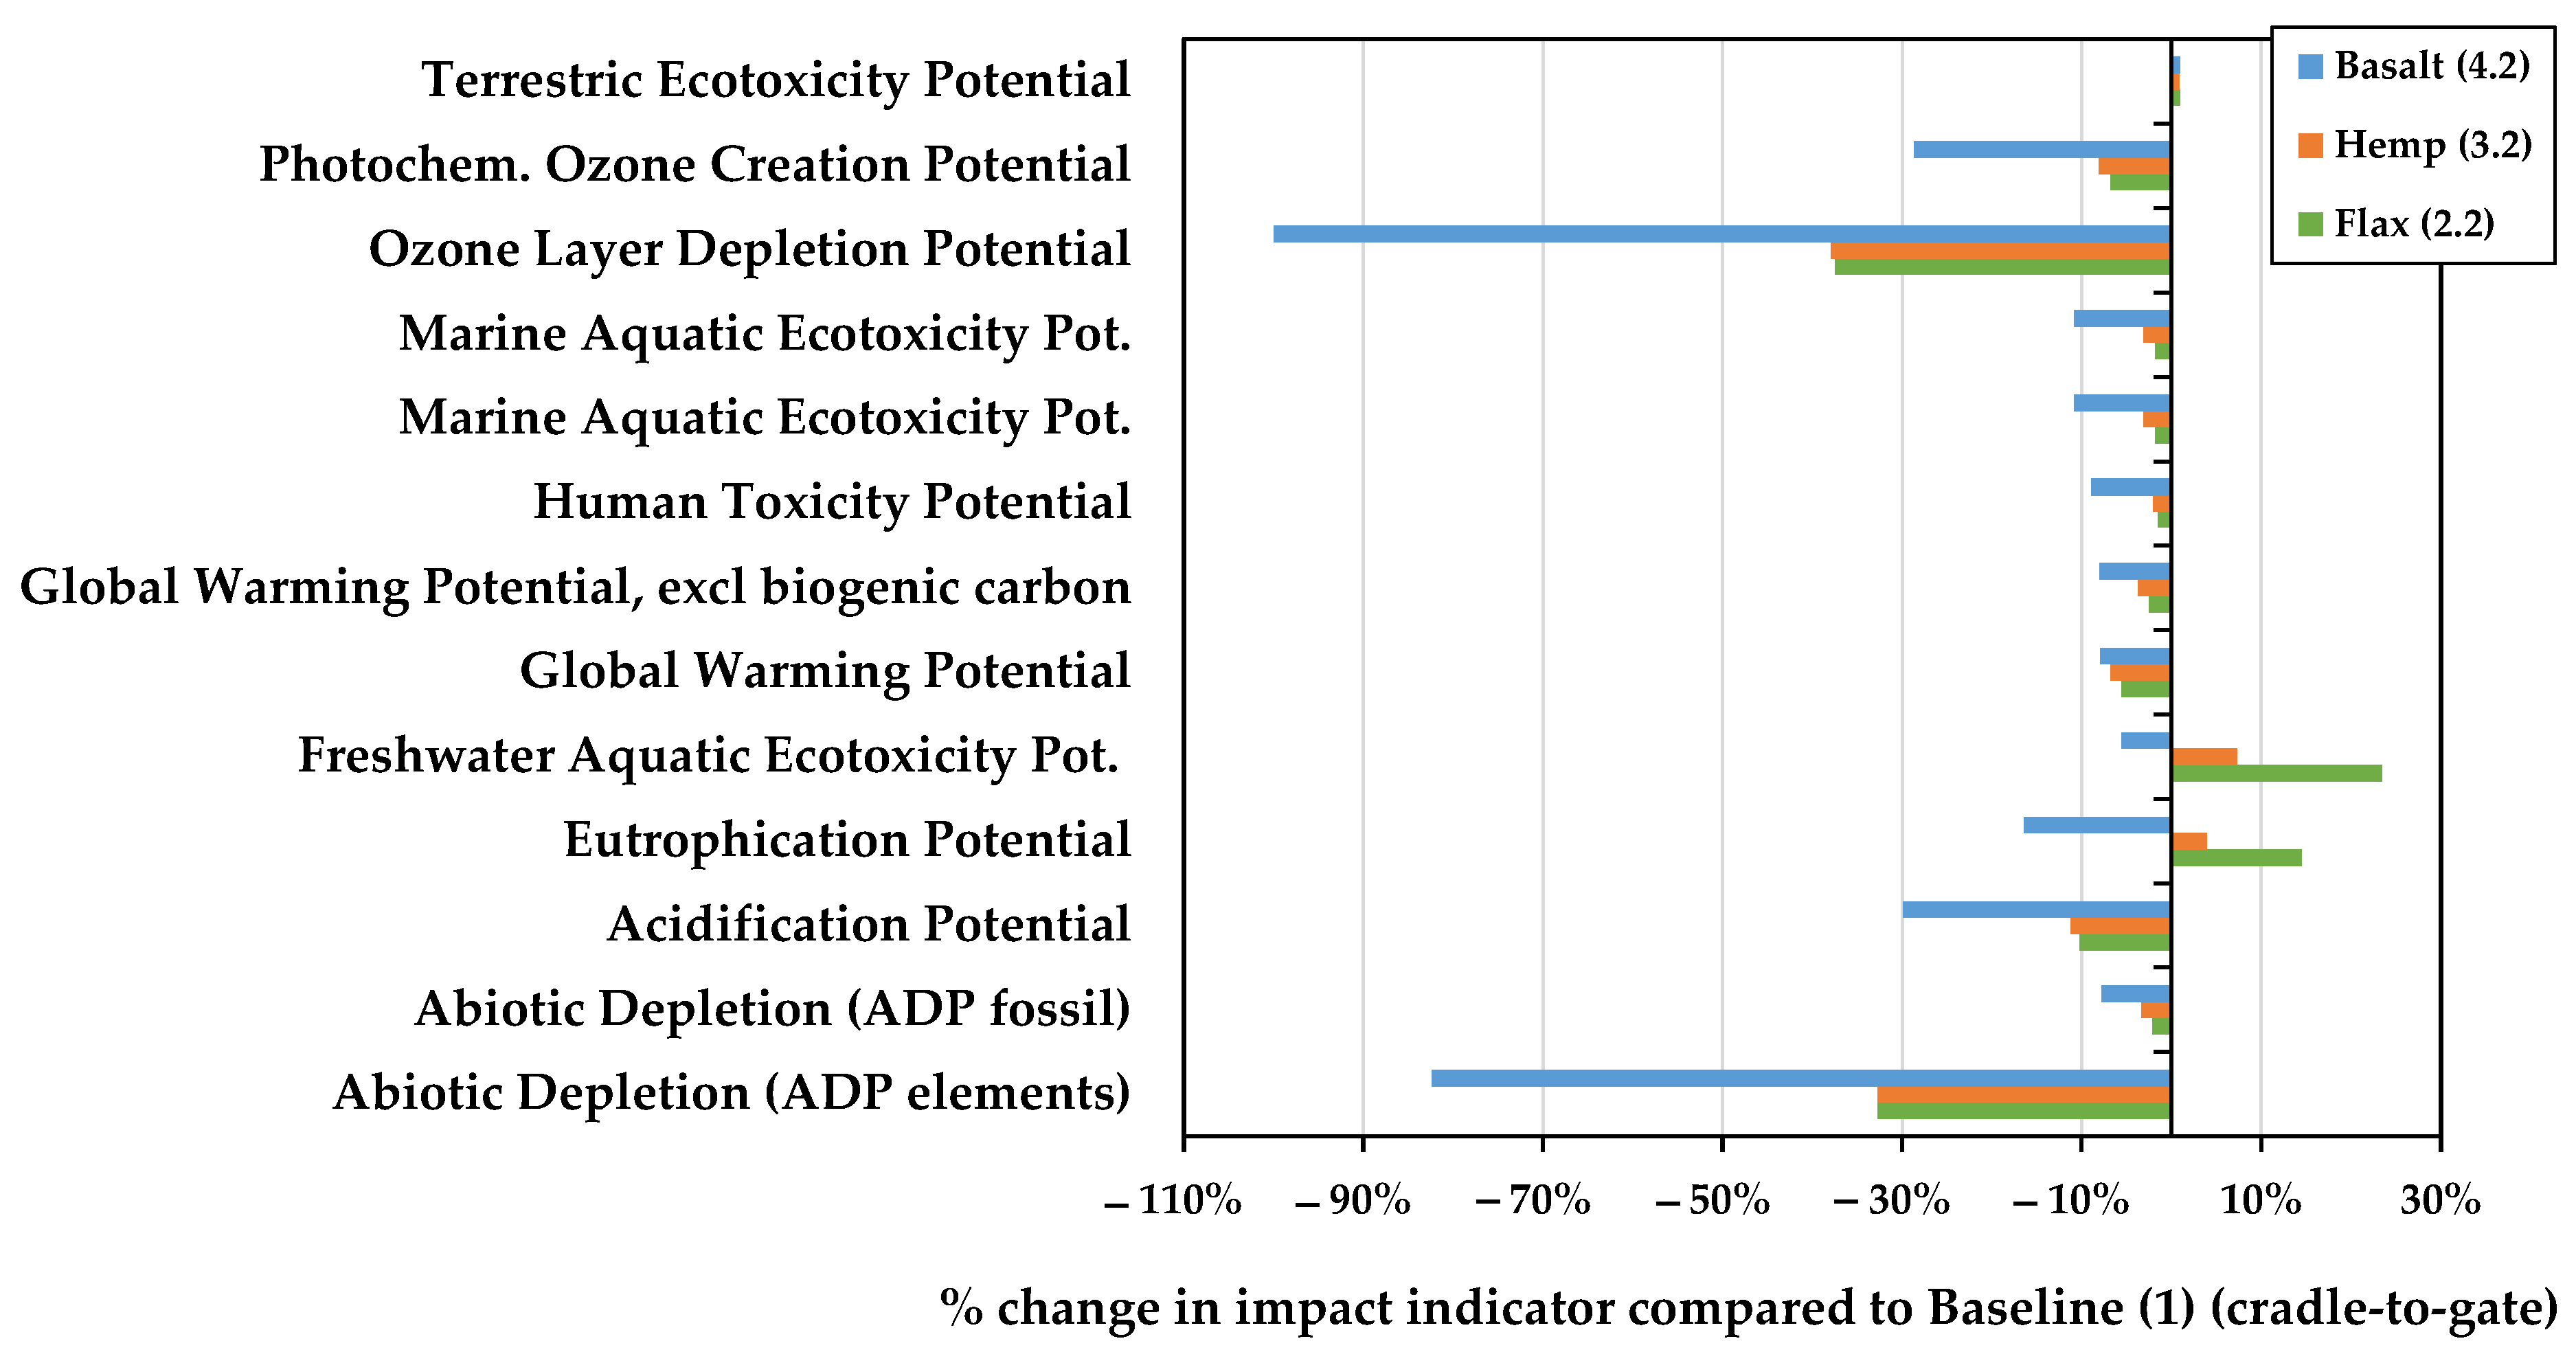
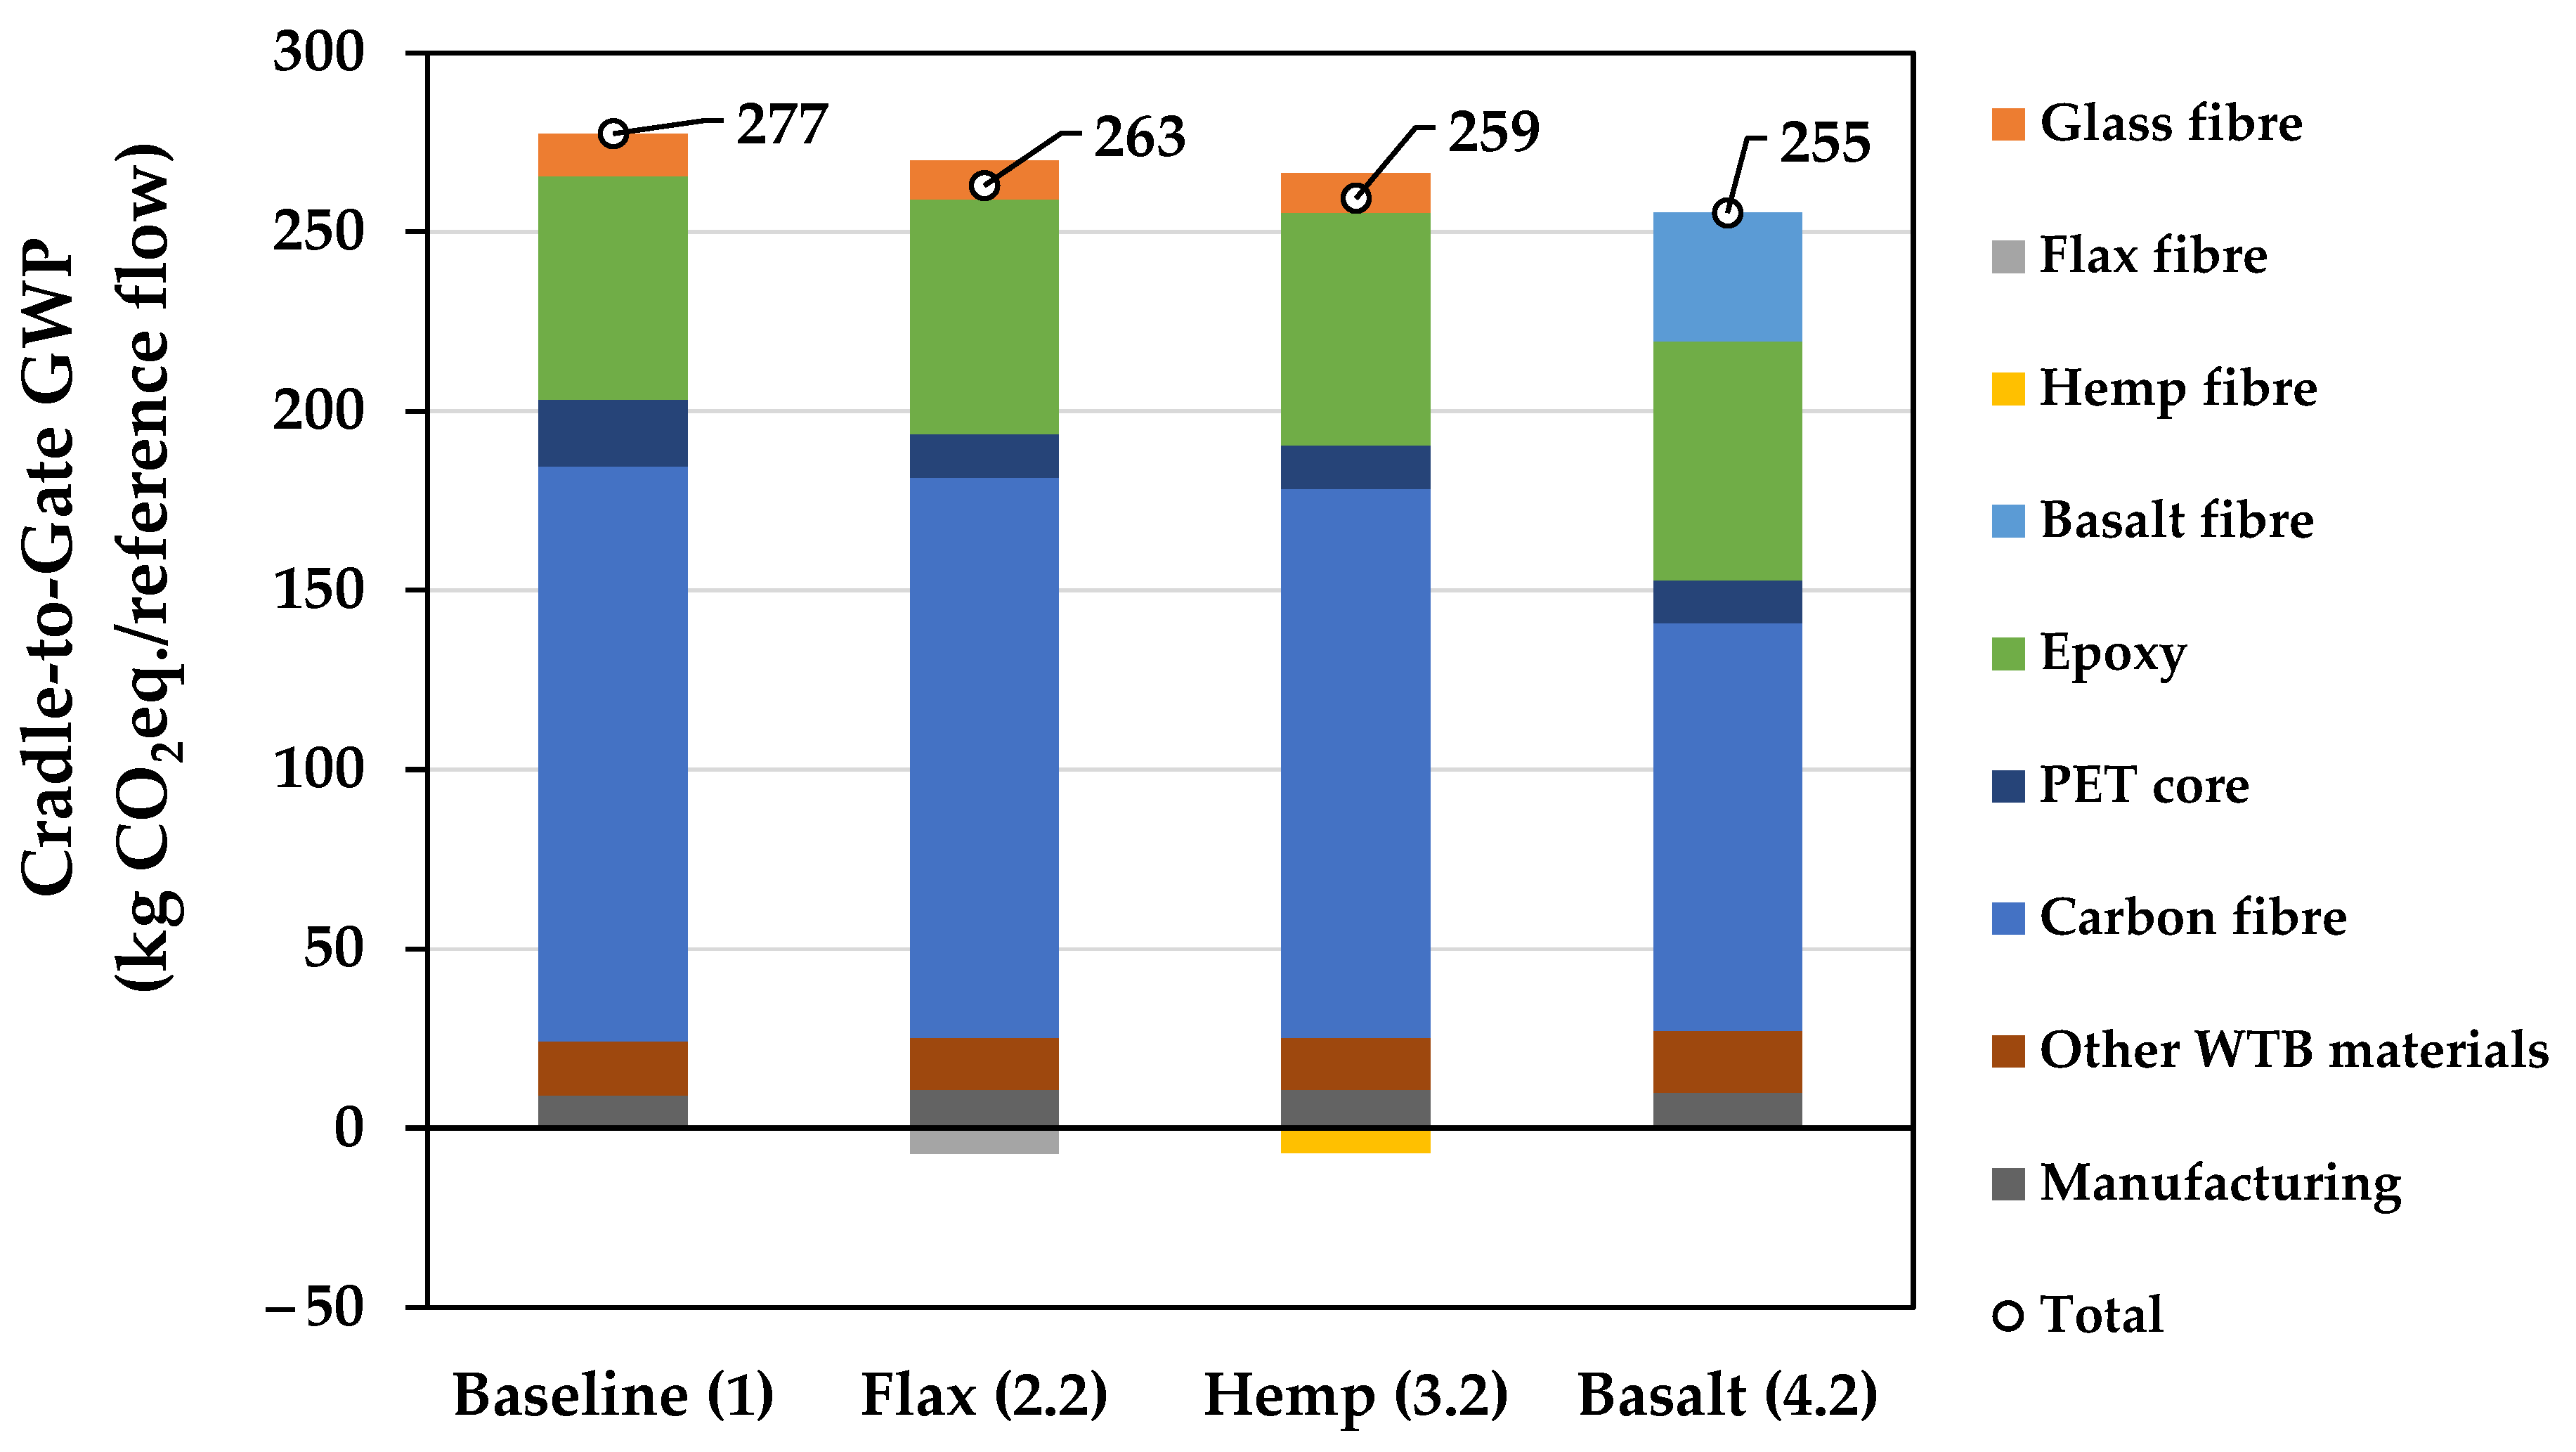
3.2. LCA: Cradle-to-Gate
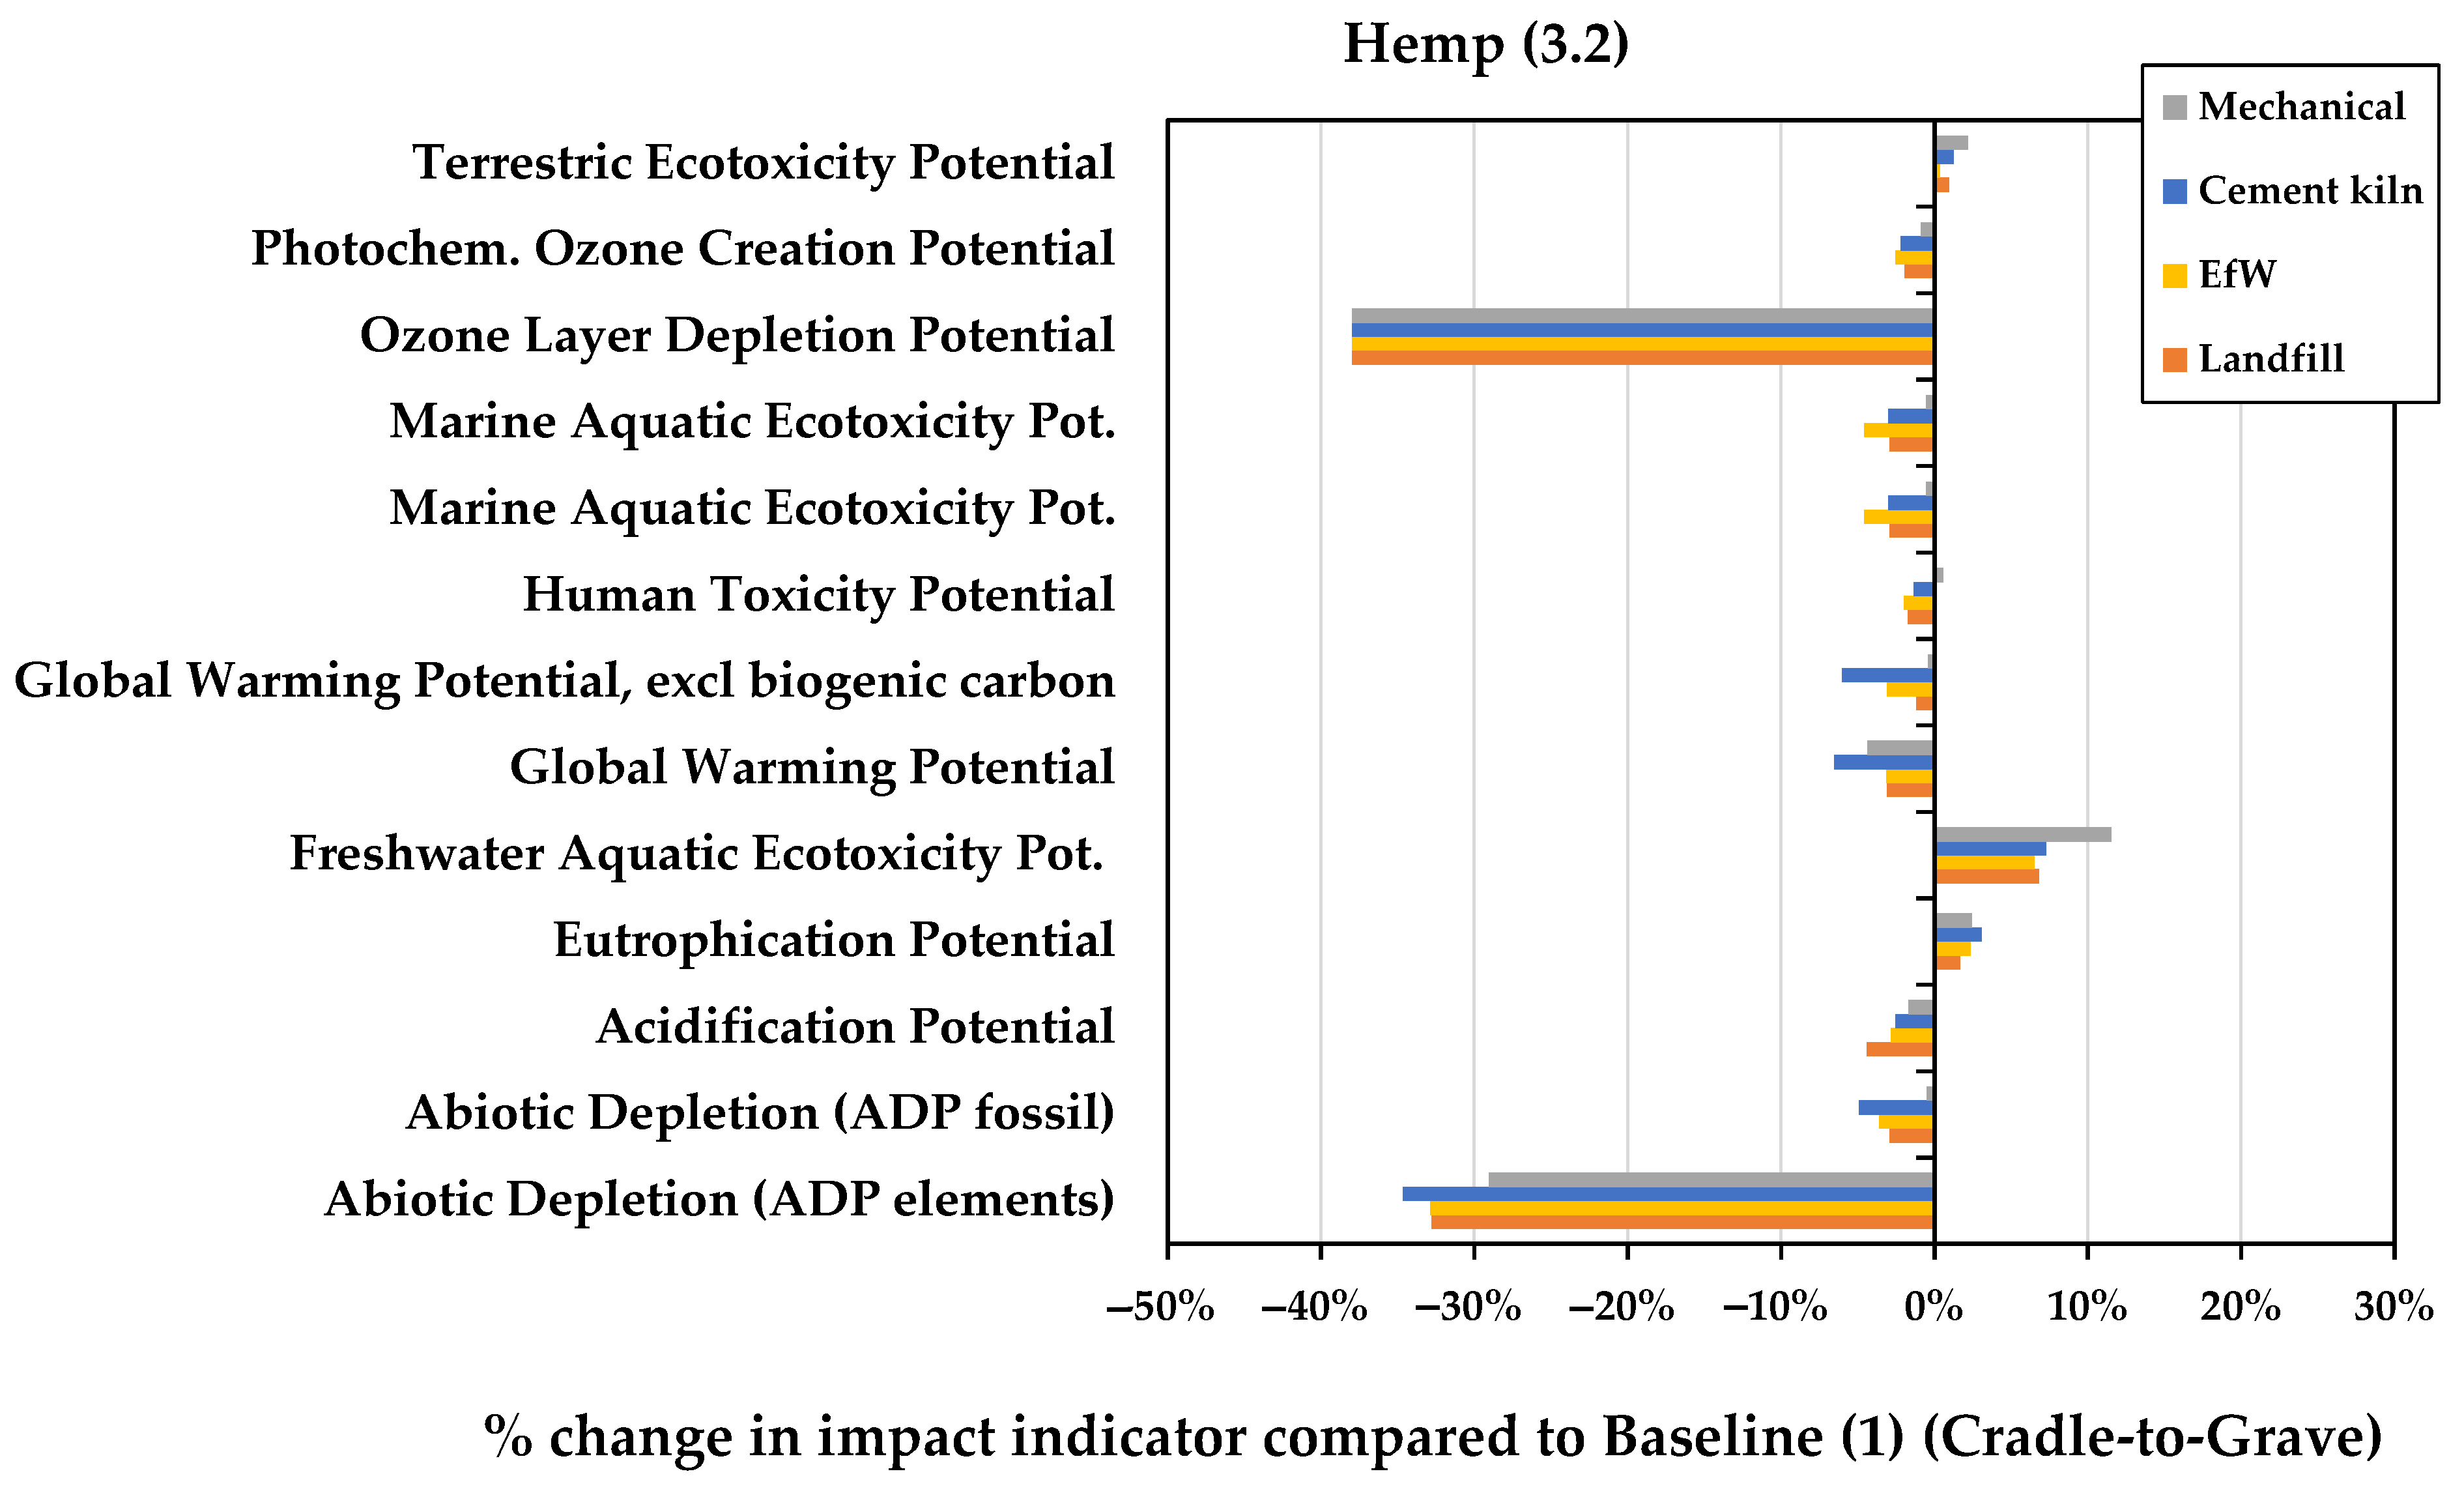
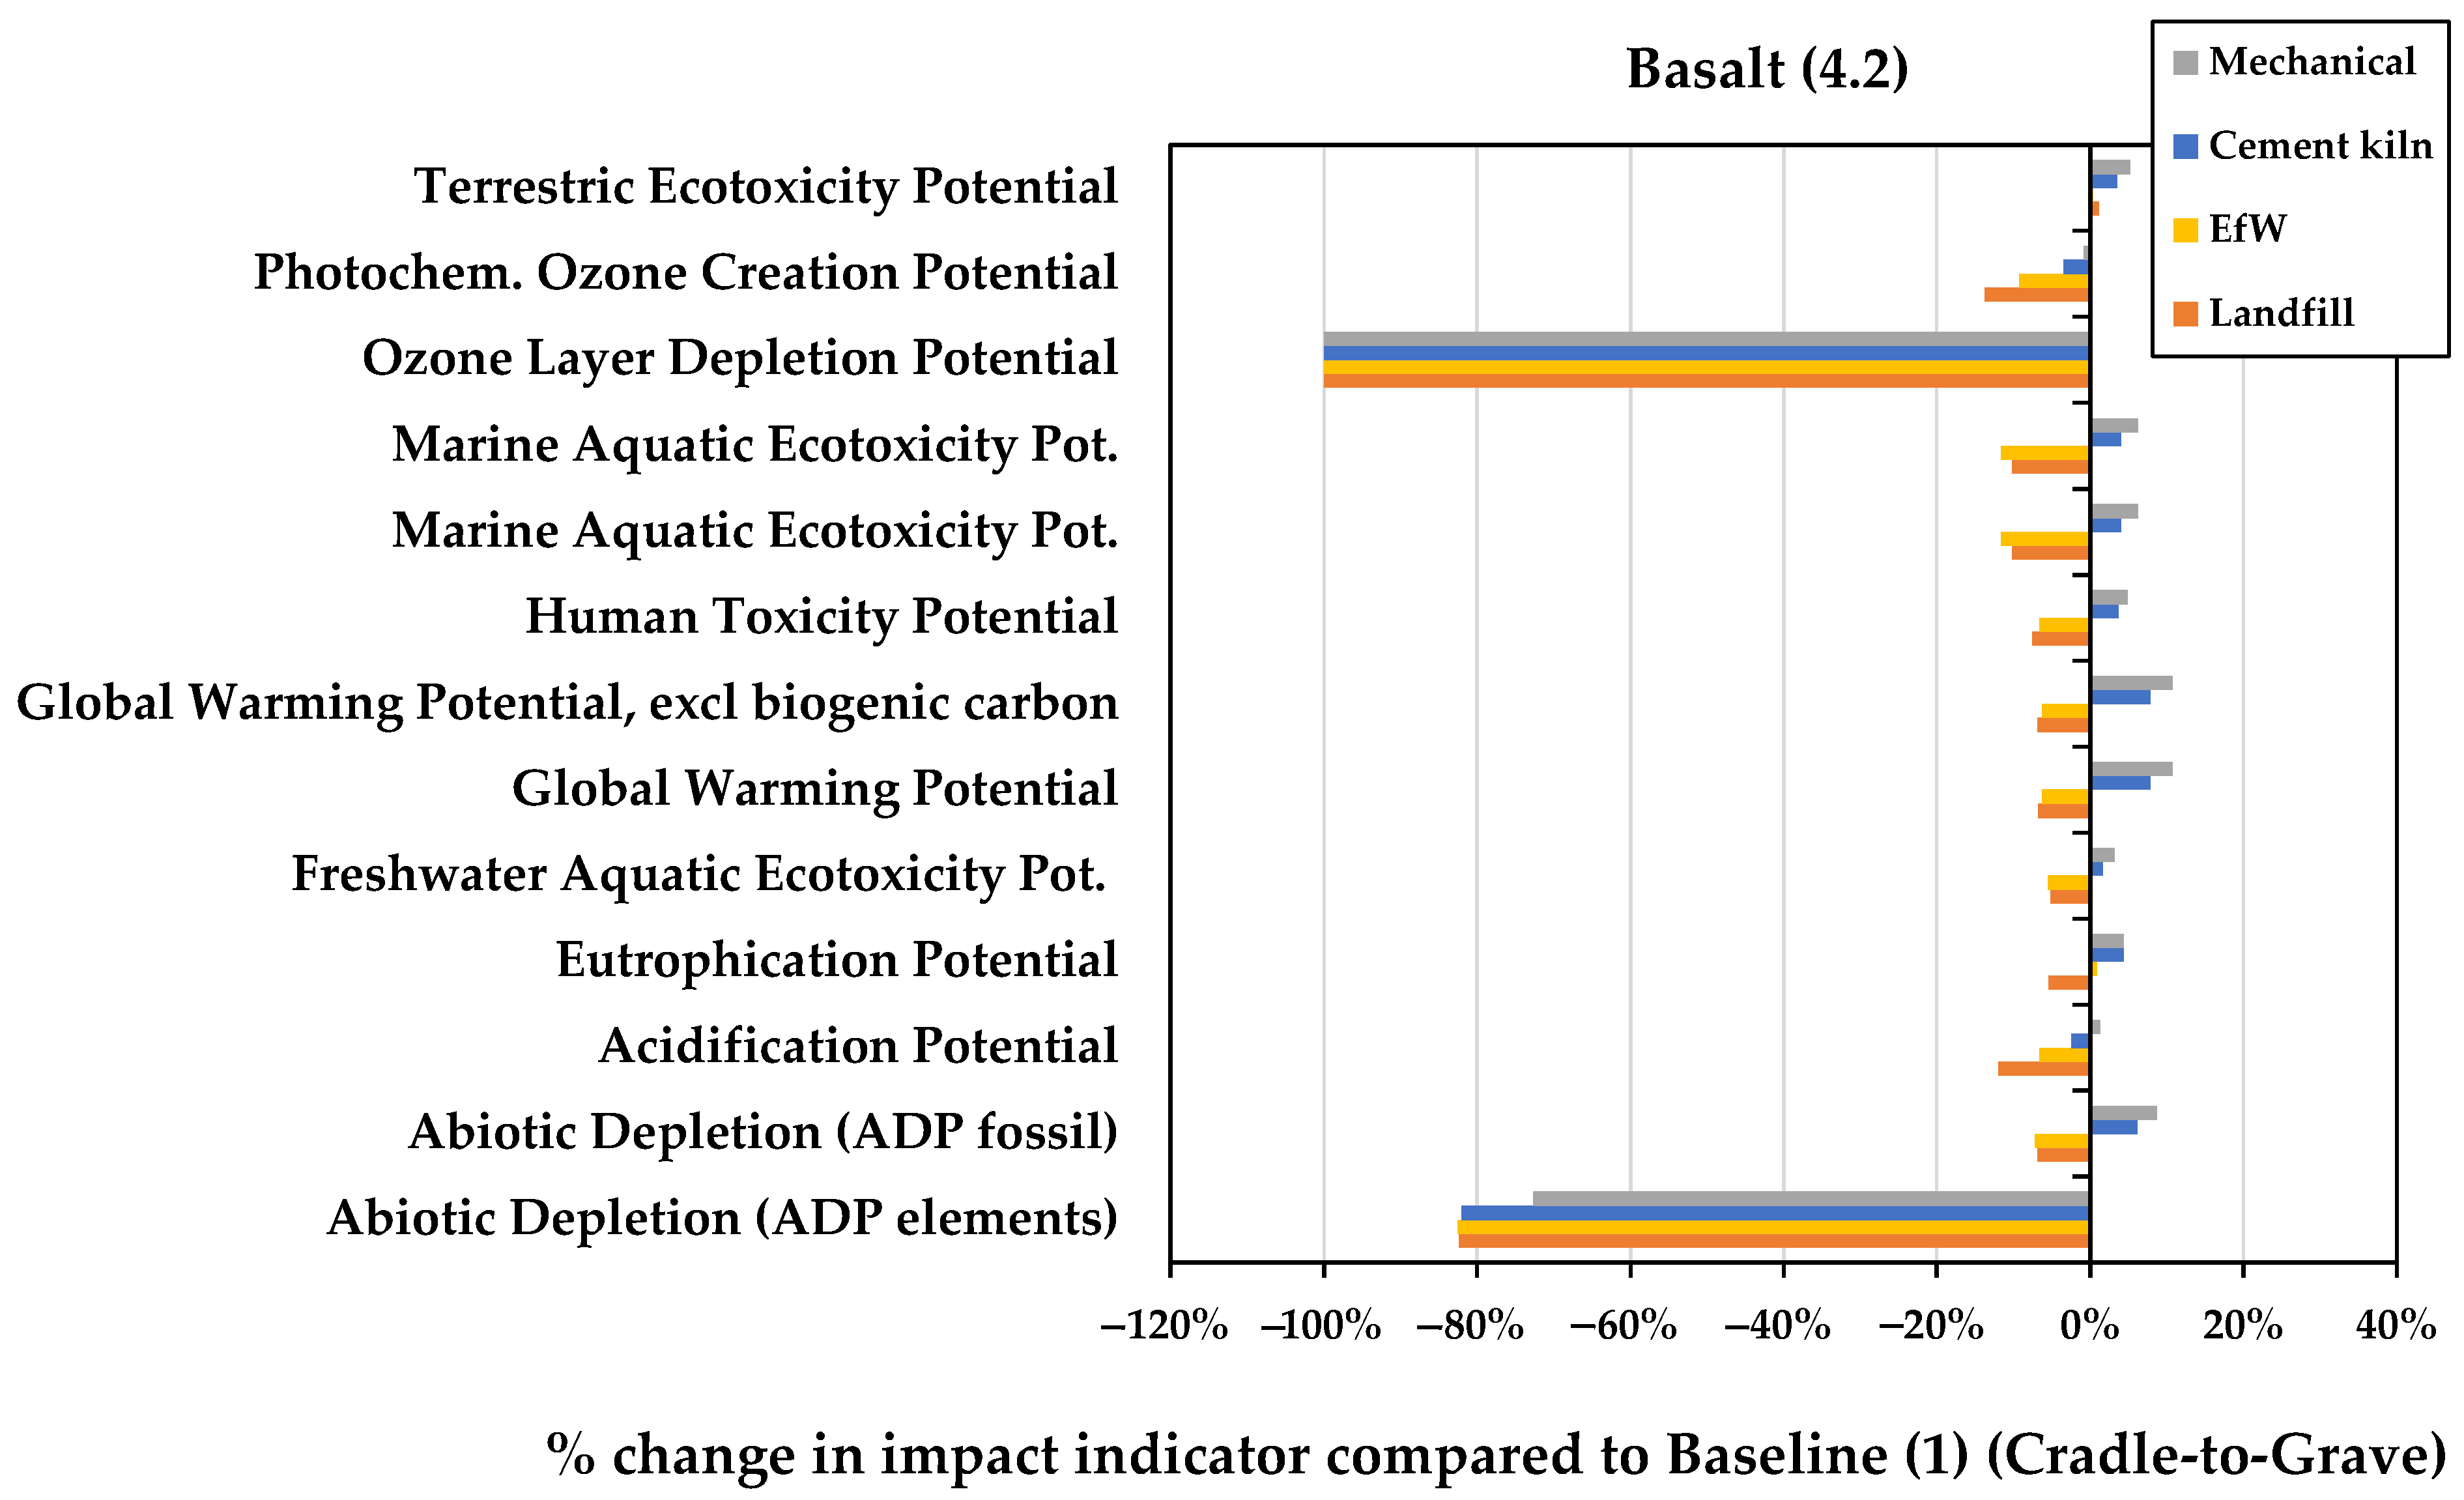
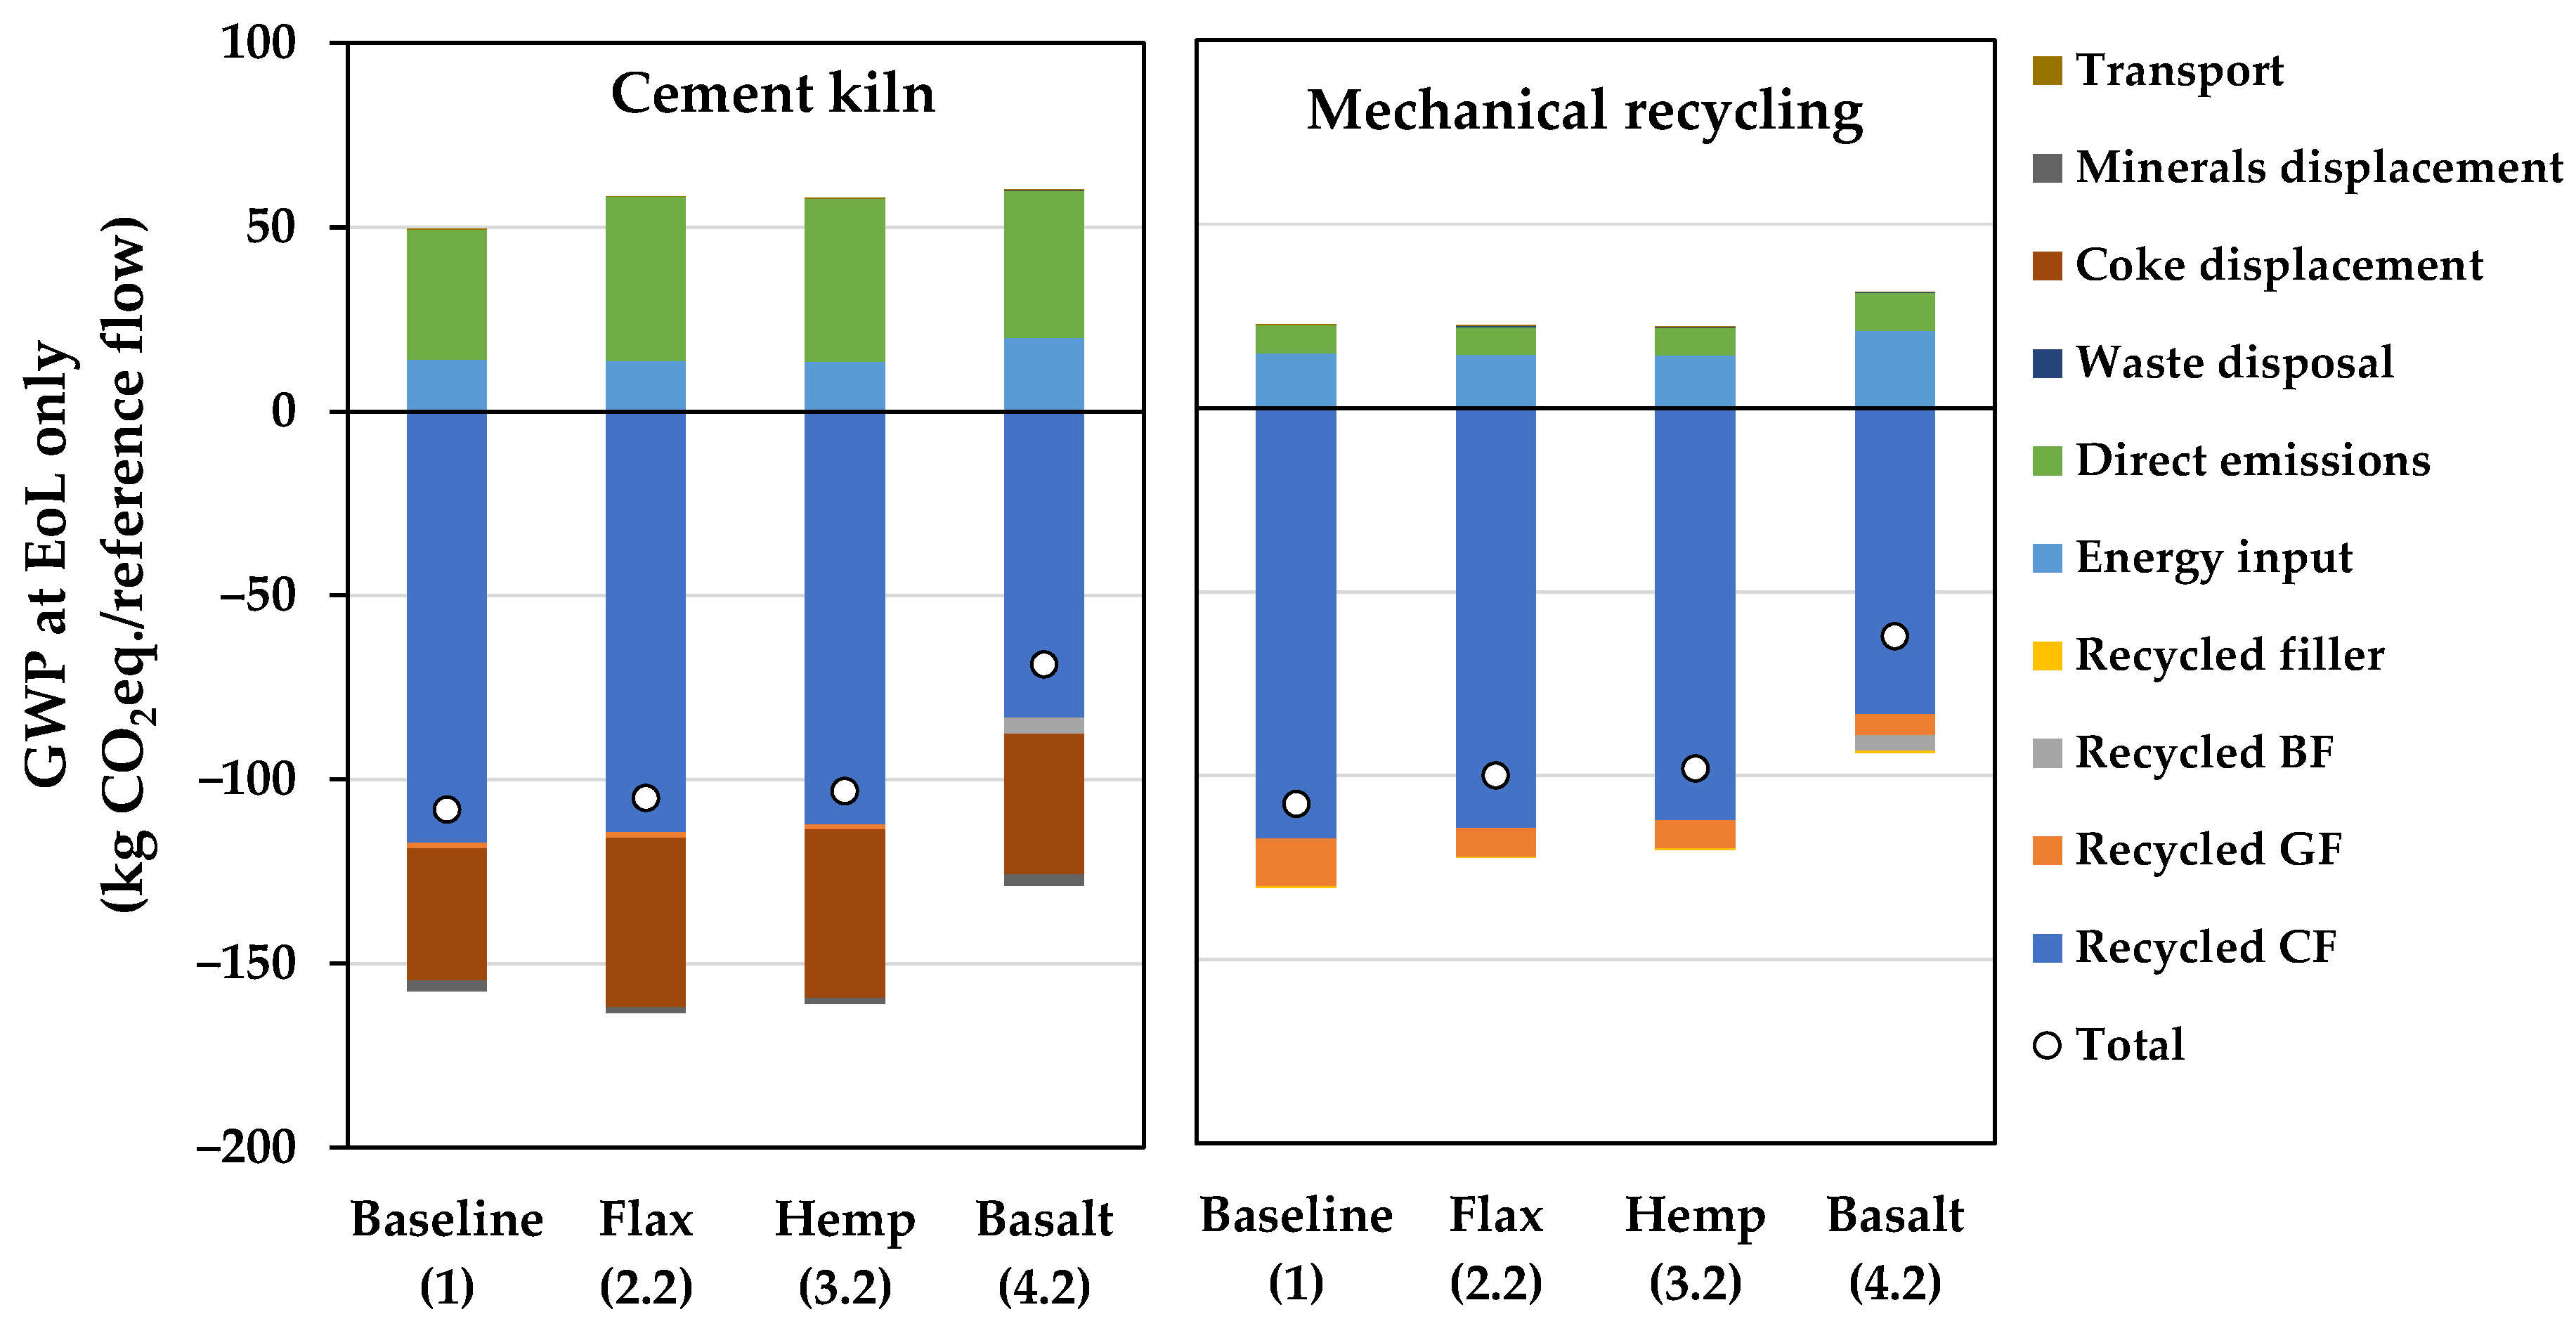
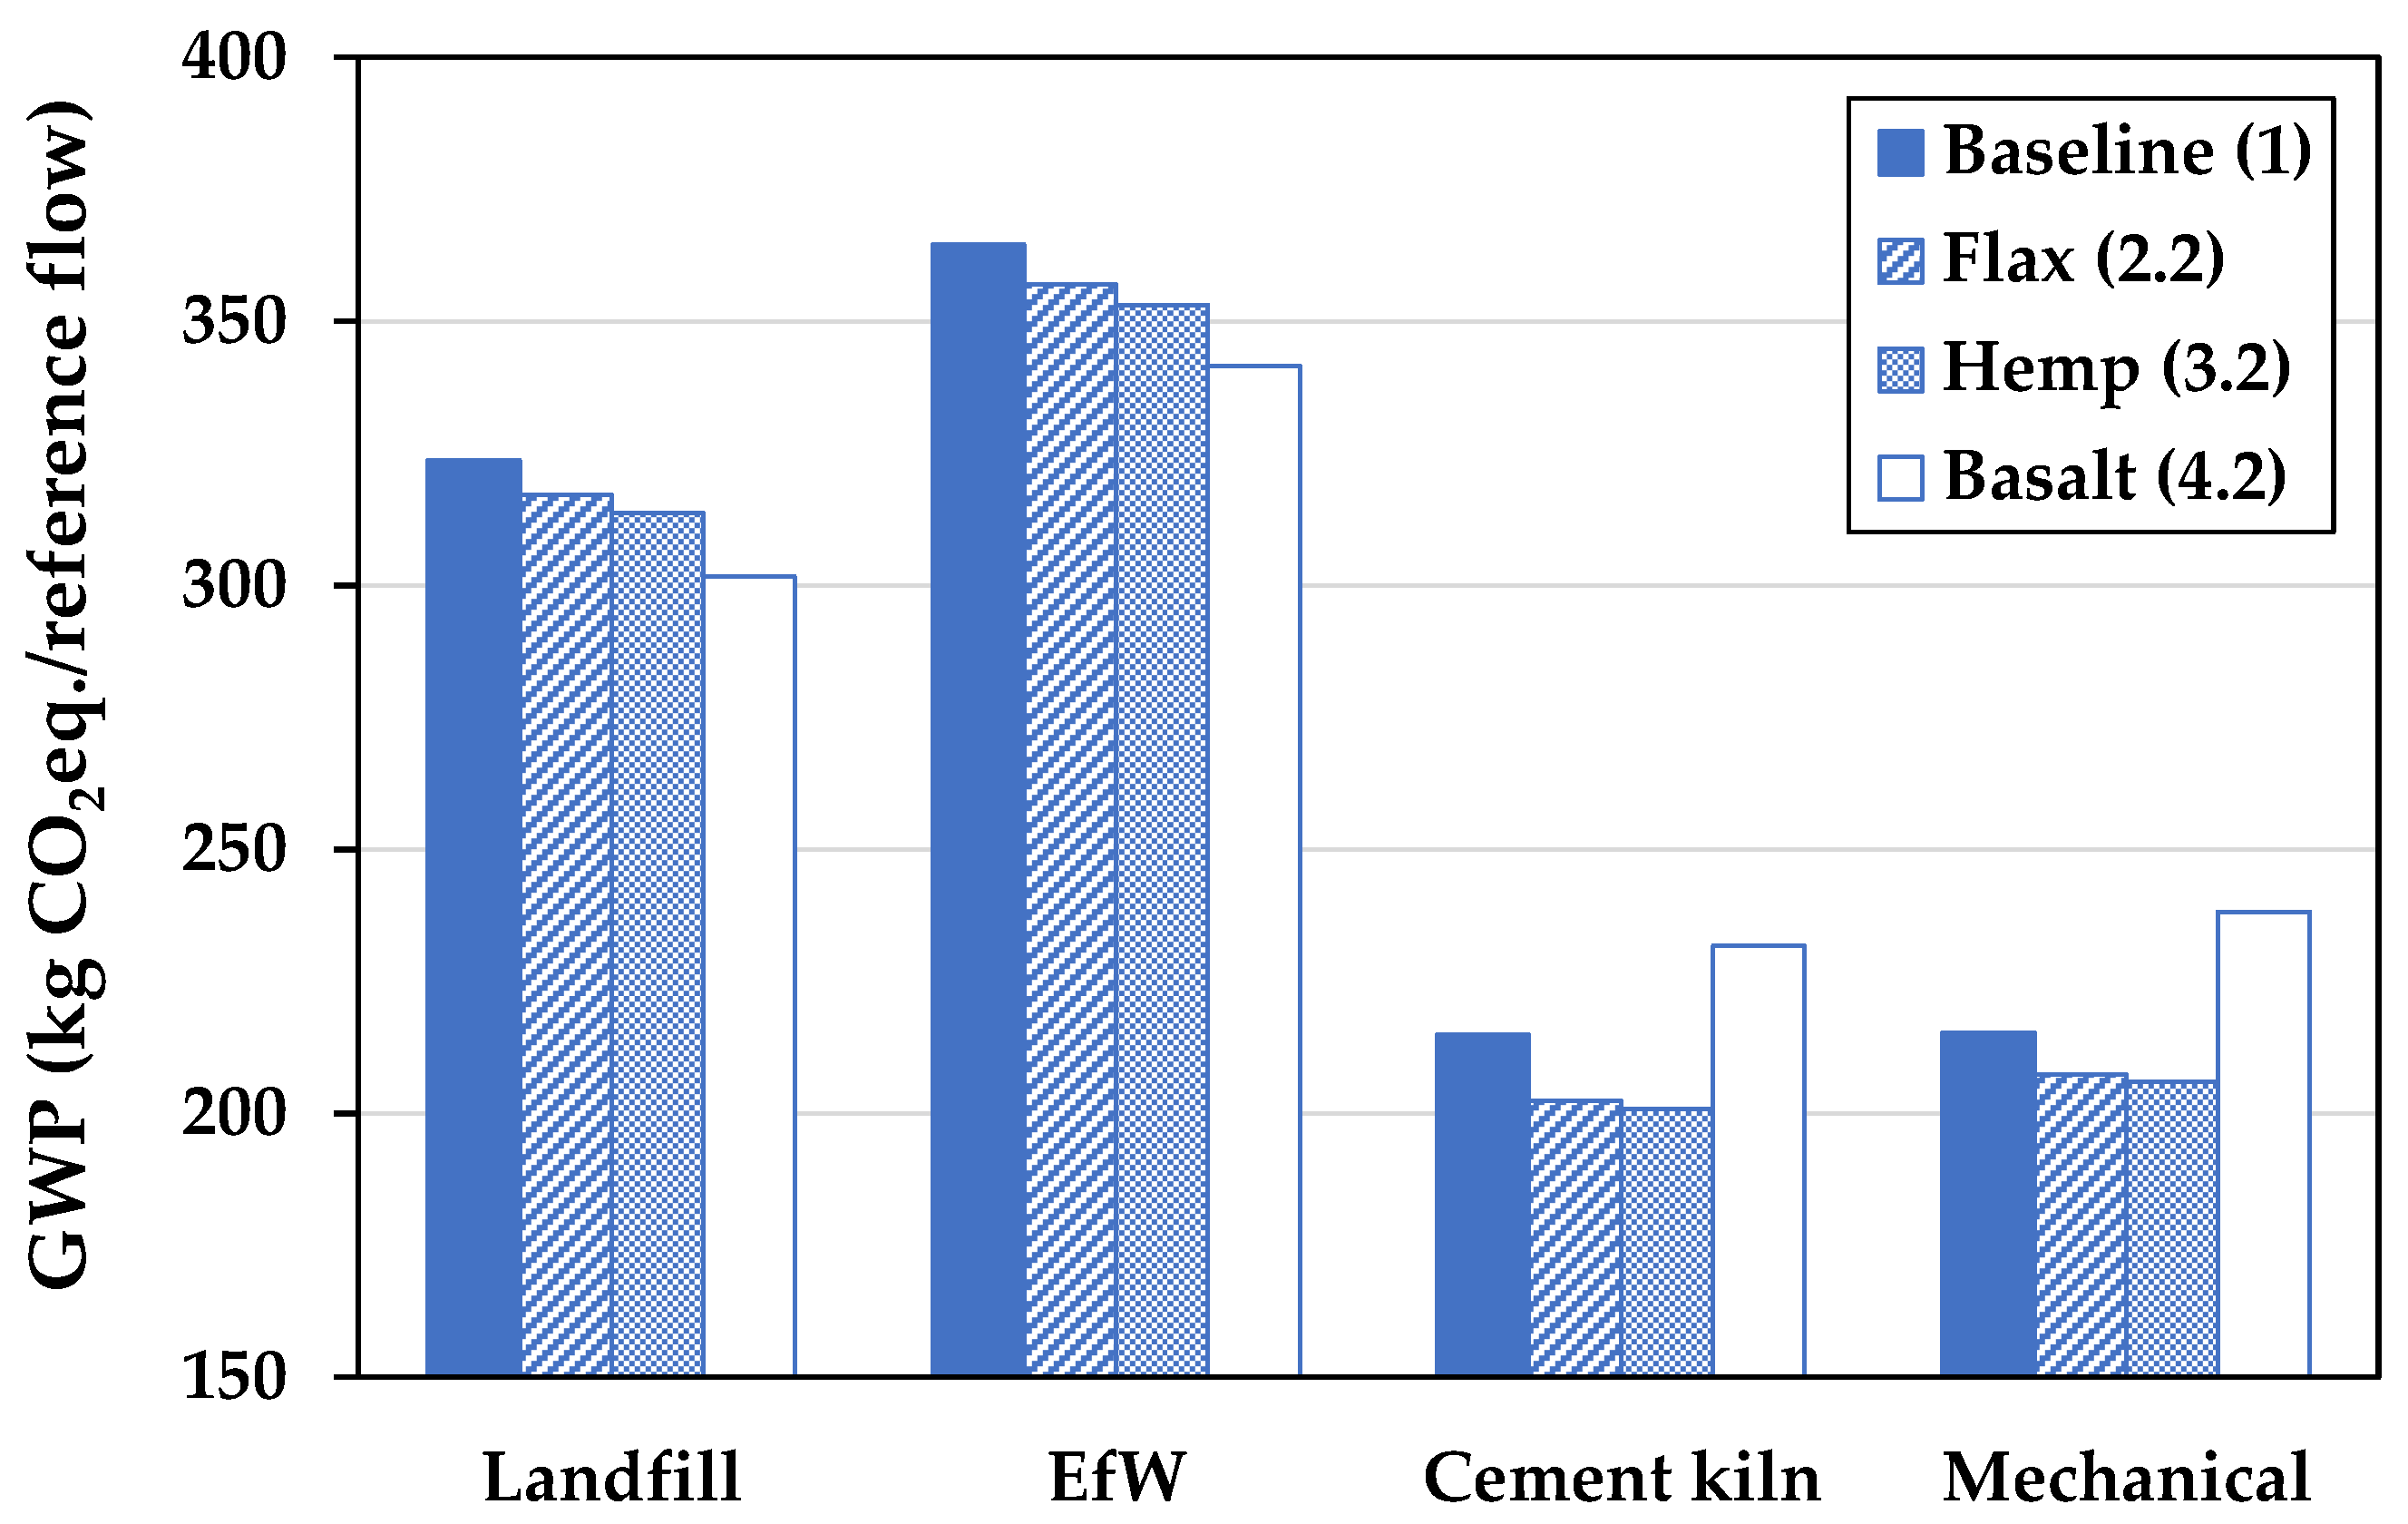
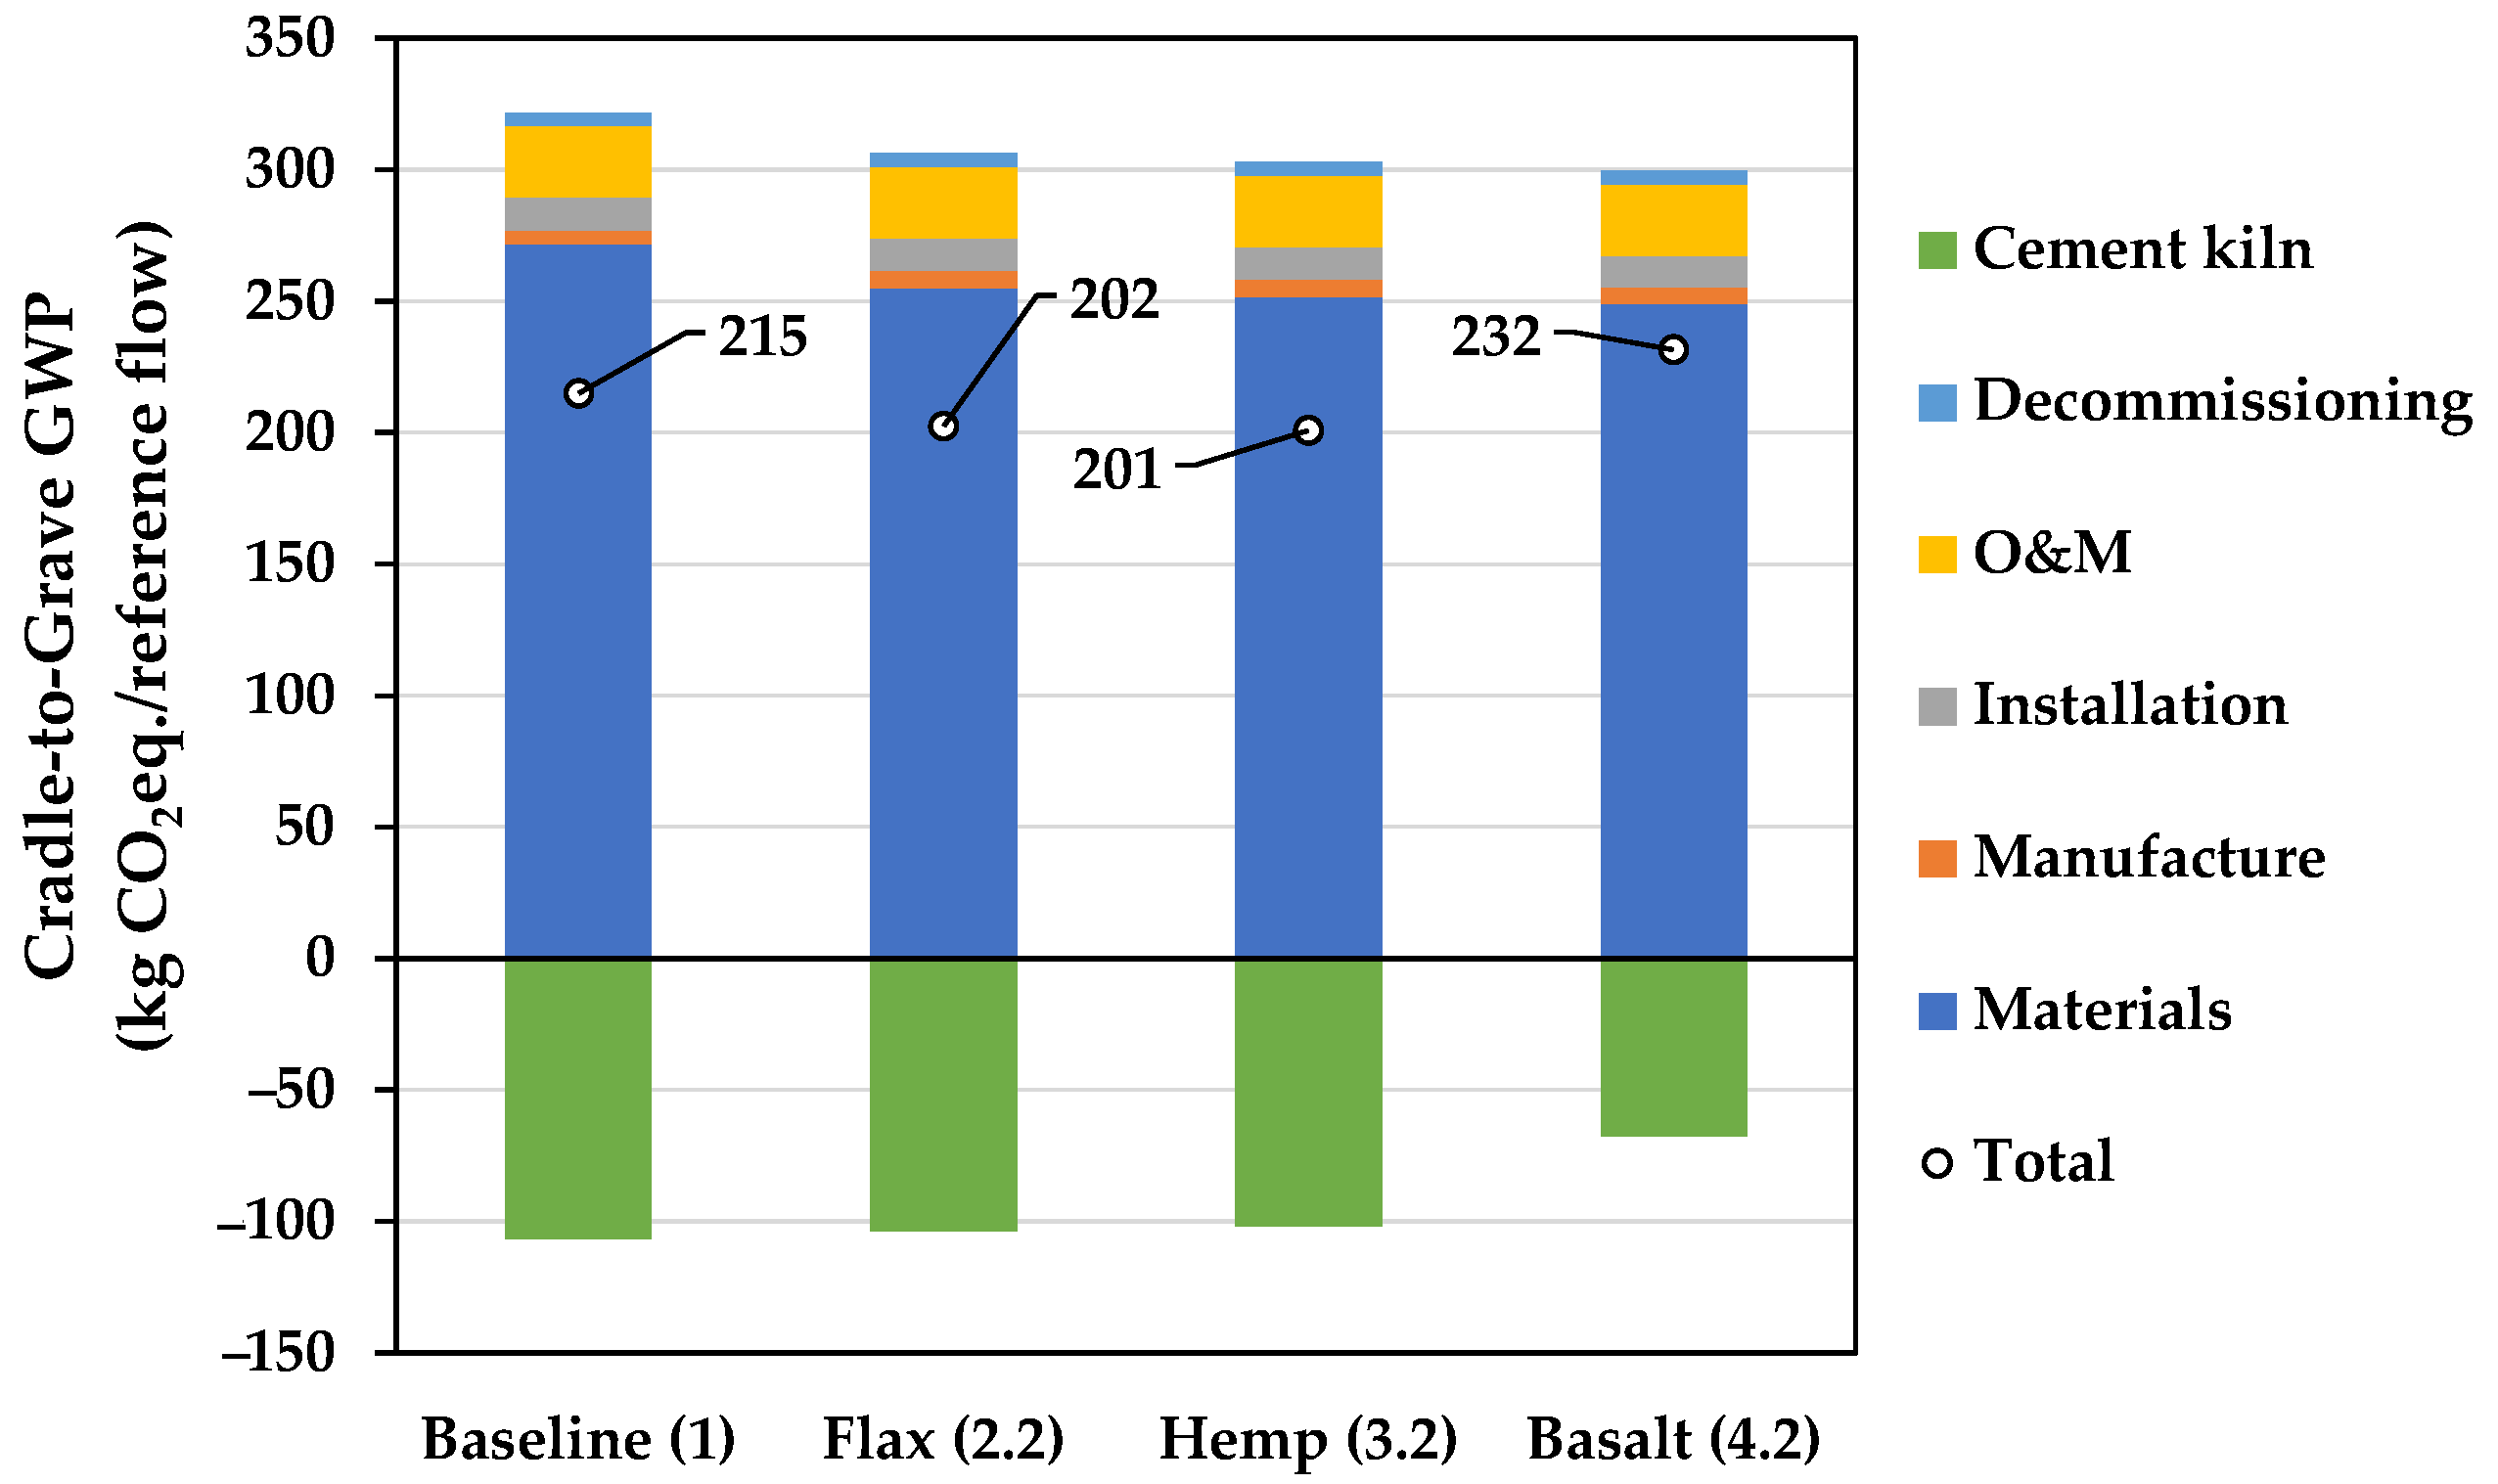
3.3. LCA: Cradle-to-Grave
4. Discussion
5. Conclusions
- Design load cases could be met by WTBs containing each of the alternative fibres assessed.
- Flax and hemp fibres were the most promising solutions; however, they must be restricted to use in stiffness-driven, bi-axial plies in the shell and shear webs to avoid excessive blade mass requirements.
- Basalt fibre has the potential to replace carbon fibre in the spar cap regions; however, the resulting blade is heavier and turbine level design is needed to understand the knock-on effects to the tower and drivetrain requirements.
- The best results were achieved by the hemp fibre, offering 8.9% and 13.2% reductions in WTB mass and total WTB material GWP, respectively.
- Flax and hemp fibre deployment in bi-axial plies could reduce the Cradle-to-Grave GWP by up to 5%. Due to the cultivation methods of these fibres, however, freshwater aquatic ecotoxicity and eutrophication were found to be greater than the baseline blade design.
- Basalt fibre was found to increase the Cradle-to-Grave impact across most indicators compared to the baseline blade design when recycled and is therefore not a priority material for future blade designs.
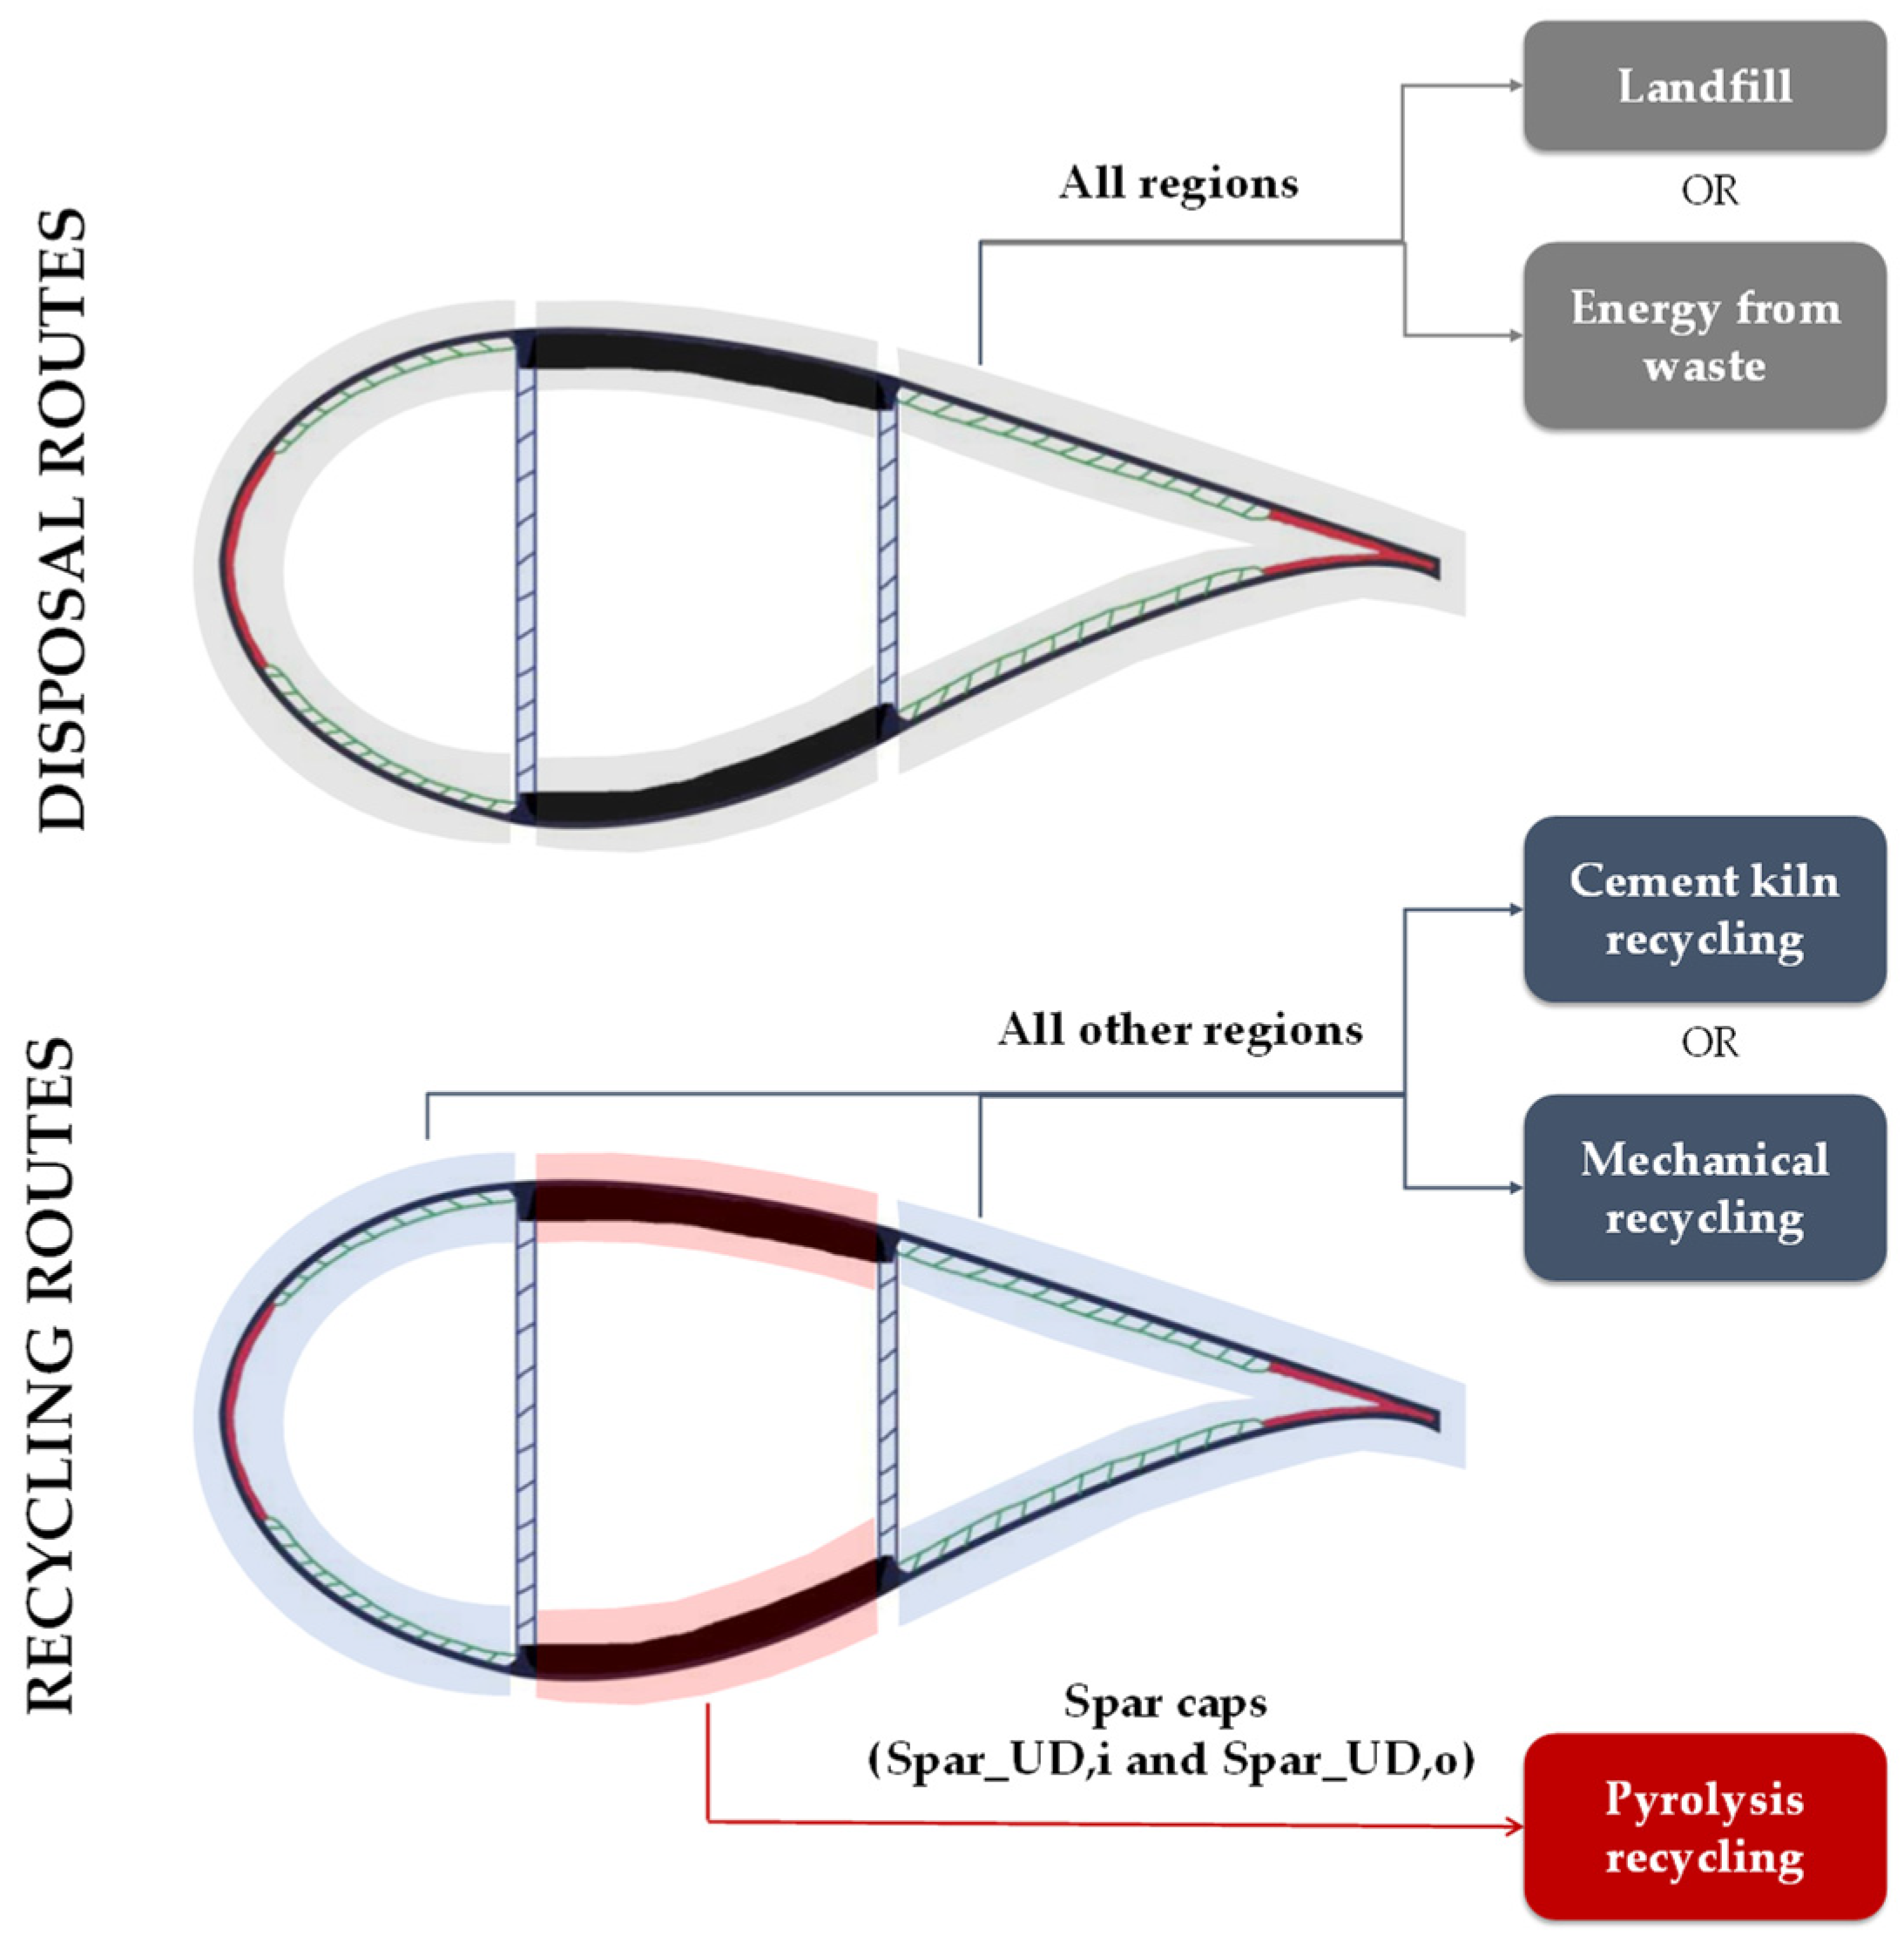
- Cement kiln co-processing and mechanical recycling EoL strategies were found to significantly reduce the WTB Cradle-to-Grave GWP and should be the prioritised strategies for WTB scrap, regardless of fibre type used.
- Irrespective of blade design, carbon fibre production was found to be the largest contributor to the WTB GWP. Lower-impact alternatives, or the development of lower-impact carbon fibre production, could therefore provide a significant reduction in wind energy impact and should be a priority for wind energy decarbonisation.
Supplementary Materials
Author Contributions
Funding
Informed Consent Statement
Data Availability Statement
Conflicts of Interest
Appendix A. Bill of Materials and AEP for Blade Designs from ATOM

| Scenario | ||||||||||
|---|---|---|---|---|---|---|---|---|---|---|
| Baseline (1) | Flax (2.1) | Flax (2.2) | Flax (2.3) | Flax (2.4) | Hemp (3.1) | Hemp (3.2) | Basalt (4.1) | Basalt (4.2) | ||
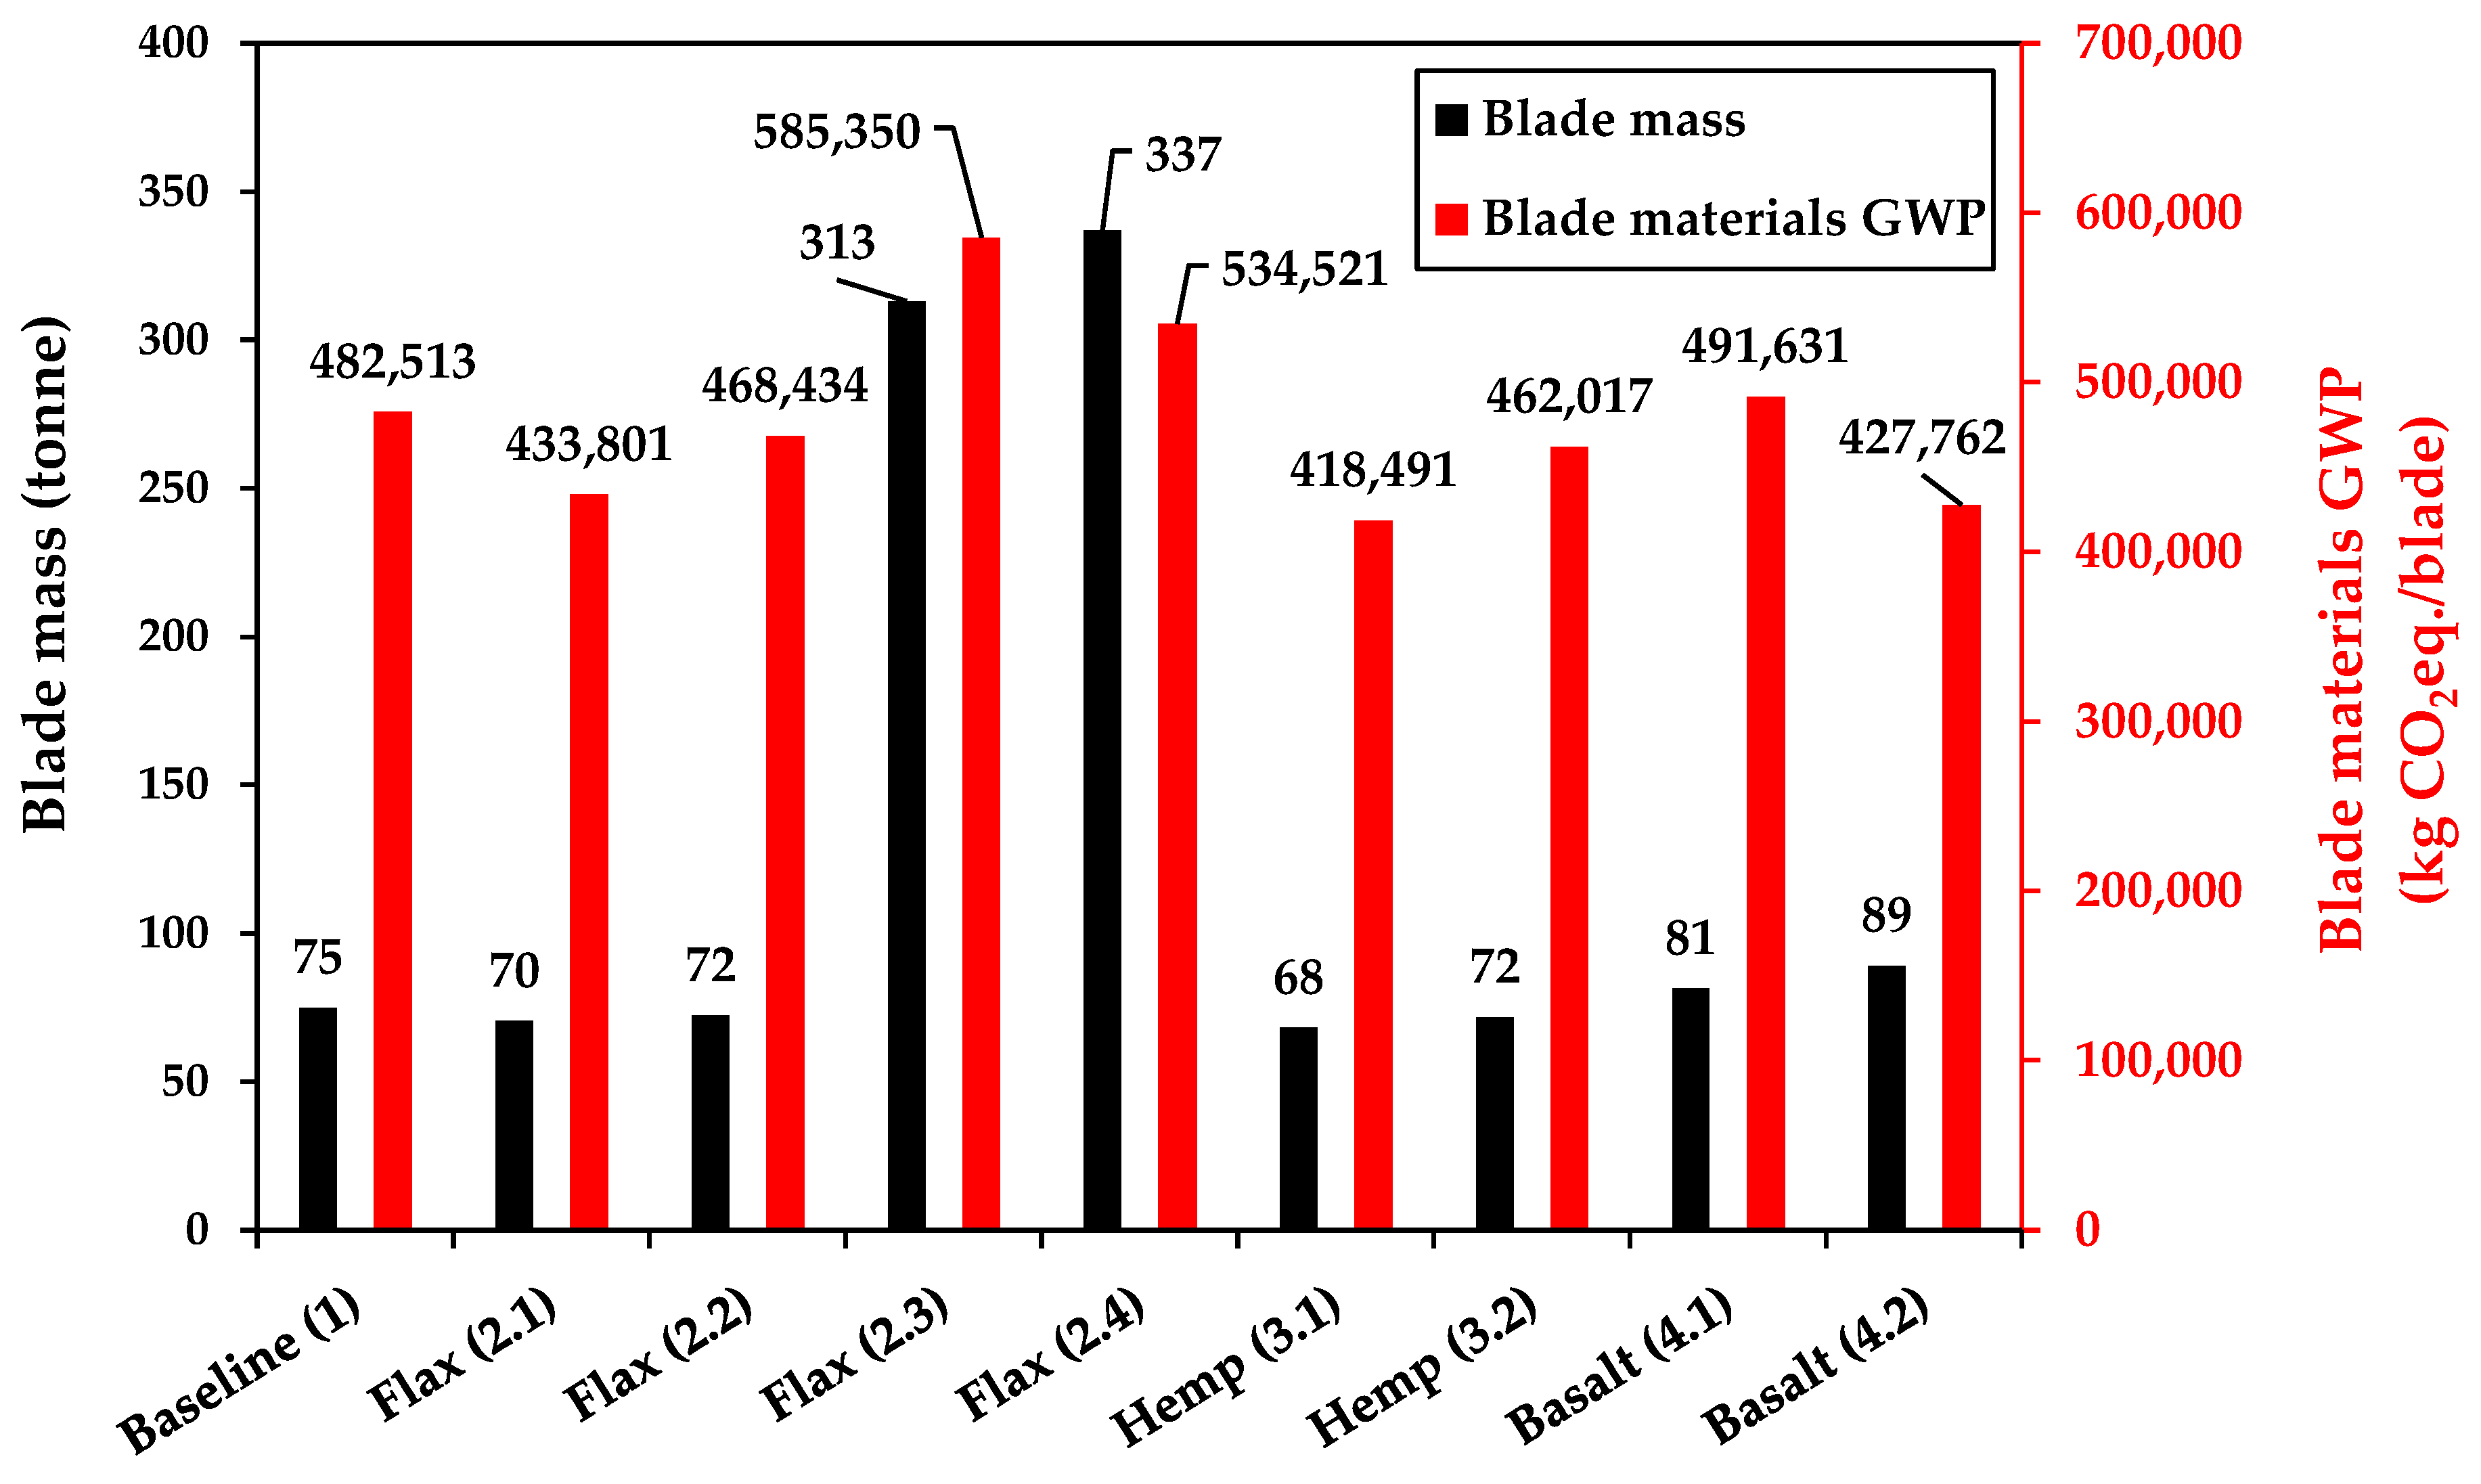
| Mass (tonne) | Total | 74.88 | 70.50 | 72.33 | 313.05 | 336.84 | 68.23 | 71.73 | 81.32 | 89.02 |
| Glass fibre | 33.75 | 19.33 | 20.19 | 23.46 | 0.45 | 19.06 | 20.07 | 0.00 | 0.00 | |
| Carbon fibre | 9.07 | 9.02 | 8.84 | 8.14 | 8.08 | 8.12 | 8.67 | 9.07 | 6.44 | |
| Flax fibre | / | 9.92 | 9.95 | 136.95 | 168.67 | / | / | / | / | |
| Hemp fibre | / | / | / | / | / | 9.48 | 9.95 | / | / | |
| Basalt fibre | / | / | / | / | / | / | / | 39.01 | 46.30 | |
| Epoxy | 16.98 | 18.12 | 18.40 | 105.37 | 117.97 | 17.29 | 18.22 | 18.17 | 19.67 | |
| Core | 5.80 | 5.31 | 5.95 | 3.65 | 3.57 | 5.72 | 5.89 | 5.07 | 5.77 | |
| Surface coating | 0.78 | 0.78 | 0.78 | 0.78 | 0.78 | 0.78 | 0.78 | 0.78 | 0.78 | |
| Adhesive | 3.74 | 3.52 | 3.62 | 15.65 | 16.84 | 3.41 | 3.59 | 4.07 | 4.45 | |
| Steel | 4.49 | 4.23 | 4.34 | 18.78 | 20.21 | 4.09 | 4.30 | 4.88 | 5.34 | |
| Aluminium | 0.27 | 0.27 | 0.27 | 0.27 | 0.27 | 0.27 | 0.27 | 0.27 | 0.27 | |
| AEP (GWh) | 79.67 | 79.68 | 79.64 | 79.67 | 79.67 | 79.50 | 79.60 | 79.74 | 79.69 | |
| Material GWP (kg CO2eq./blade) | 482,513 | 433,801 | 468,434 | 585,350 | 534,521 | 418,491 | 462,017 | 491,631 | 427,762 | |
| FF/HF/BF laminate fraction | / | 54%Vf | 40%Vf | 54%Vf | 54%Vf | 54%Vf | 40%Vf | 54%Vf | 54%Vf | |
| Reference flow (no. WTB per GWh generated) | 5.021 × 10⁻⁴ | / | 5.022 × 10⁻⁴ | / | / | / | 5.025 × 10⁻⁴ | / | 5.020 × 10⁻⁴ | |
Appendix B. Blade Design Optimisation Methodology and Assumptions
Appendix B.1. Methodology
Appendix B.2. Design Variables and Load Cases
Appendix B.3. Micromechanical Properties
| Property | Fibre Type | ||||
|---|---|---|---|---|---|
| GF | FF | HF | BF | Epoxy | |
| Density [gcm−2] | 2.62 [37] | 1.45 [37] | 1.45 [37] | 2.70 [37] | 1.19 [93] |
| Tensile modulus [GPa] | 78.0 [37] | 60.0 [94] | 56.8 [37] | 91 [95] | 3.2 [93] |
| Tensile strength [MPa] | 1995 [37] | 625 [94] | 585 [37] | 2100 [95] | 65 [93] |
| Compressive strength [MPa] | 1085 [37] | 339.9 2 | 318.2 2 | 1142 2 | 85 [93] |
| Shear modulus [GPa] 1 | 17.2 | 12.0 | 11.4 | 18.2 | Data not required |
| Shear strength [MPa] | Data not required | 43 [37] | |||
| Poisson’s ratio | 0.22 [37] | 0.20 [37] | 0.20 [37] | 0.20 [37] | 0.35 [37] |
| GWP [kg CO2eq./kg] | 1.49 [96] | −1.39 [97] | −1.34 [98] | 1.34 3 | 6.37 [99] |
Appendix B.4. Laminate Knockdown Factors
References
- IEA. Wind Electricity. 2022. Available online: https://www.iea.org/reports/wind-electricity (accessed on 23 April 2024).
- Pehl, M.; Arvesen, A.; Humpenöder, F.; Popp, A.; Hertwich, E.G.; Luderer, G. Understanding future emissions from low-carbon power systems by integration of life-cycle assessment and integrated energy modelling. Nat. Energy 2017, 2, 939–945. [Google Scholar] [CrossRef]
- Bonou, A.; Laurent, A.; Olsen, S.I. Life cycle assessment of onshore and offshore wind energy-from theory to application. Appl. Energy 2016, 180, 327–337. [Google Scholar] [CrossRef]
- Alsaleh, A.; Sattler, M. Comprehensive life cycle assessment of large wind turbines in the US. Clean Technol. Environ. Policy 2019, 21, 887–903. [Google Scholar] [CrossRef]
- Khalid, M.Y.; Arif, Z.U.; Hossain, M.; Umer, R. Recycling of wind turbine blades through modern recycling technologies: A road to zero waste. Renew. Energy Focus 2023, 44, 373–389. [Google Scholar] [CrossRef]
- Chiesura, G.; Stecher, H.; Jensen, J.P. Blade materials selection influence on sustainability: A case study through LCA. IOP Conf. Ser. Mater. Sci. Eng. 2020, 942, 012011. [Google Scholar] [CrossRef]
- Liu, P.; Meng, F.; Barlow, C.Y. Wind turbine blade end-of-life options: An eco-audit comparison. J. Clean. Prod. 2019, 212, 1268–1281. [Google Scholar] [CrossRef]
- Nagle, A.J.; Delaney, E.L.; Bank, L.C.; Leahy, P.G. A Comparative Life Cycle Assessment between landfilling and Co-Processing of waste from decommissioned Irish wind turbine blades. J. Clean. Prod. 2020, 277, 123321. [Google Scholar] [CrossRef]
- OpenFAST. OpenFAST Documentation v3.5.3. 2024. Available online: https://openfast.readthedocs.io/en/dev/index.html (accessed on 23 April 2024).
- NREL. OpenFAST. Available online: https://www.nrel.gov/wind/nwtc/openfast.html#:~:text=OpenFAST (accessed on 23 April 2024).
- Bortolotti, P.; Bottasso, C.L.; Croce, A. Combined preliminary-detailed design of wind turbines. Wind Energy Sci. 2016, 1, 71–88. [Google Scholar] [CrossRef]
- Heinz, J.C.; Sørensen, N.N.; Zahle, F. Fluid–structure interaction computations for geometrically resolved rotor simulations using CFD. Wind Energy 2016, 19, 2205–2221. [Google Scholar] [CrossRef]
- Macquart, T.; Maes, V.; Langston, D.; Pirrera, A.; Weaver, P.M. A New Optimisation Framework for Investigating Wind Turbine Blade Designs. In Advances in Structural and Multidisciplinary Optimization; Springer: Cham, Switzerland, 2018; pp. 2044–2060. [Google Scholar] [CrossRef]
- Scott, S.; Greaves, P.; Weaver, P.M.; Pirrera, A.; MacQuart, T. Efficient structural optimisation of a 20 MW wind turbine blade. J. Phys. Conf. Ser. 2020, 1618, 042025. [Google Scholar] [CrossRef]
- Scott, S.; MacQuart, T.; Rodriguez, C.; Greaves, P.; McKeever, P.; Weaver, P.; Pirrera, A. Preliminary validation of ATOM: An aero-servo-elastic design tool for next generation wind turbines. J. Phys. Conf. Ser. 2019, 1222, 012012. [Google Scholar] [CrossRef]
- Bottasso, C.L.; Bortolotti, P.; Croce, A.; Gualdoni, F. Integrated aero-structural optimization of wind turbines. Multibody Syst. Dyn. 2016, 38, 317–344. [Google Scholar] [CrossRef]
- Pavese, C.; Tibaldi, C.; Zahle, F.; Kim, T. Aeroelastic multidisciplinary design optimization of a swept wind turbine blade. Wind Energy 2017, 20, 1941–1953. [Google Scholar] [CrossRef]
- IEC 61400-1; Wind Turbines -Part 1: Design Requirements, 3rd IEC. International Electrotechnical Commission: Geneva, Switzerland, 2005.
- Lee, J.H.; Collier, C.; Ainsworth, J.; Cho, K.N.; Lee, Y.S. Development of Natural Fiber Wind Turbine Blades Using Design Optimization Technology. 2021. Available online: https://cdn.collieraerospace.com/wp-content/uploads/2022/04/TEAM2021-fullpaper-yslee-Development-of-Natural-Fiber-Wind-Turbine-Blades.pdf (accessed on 23 April 2024).
- Shah, D.U.; Schubel, P.J.; Clifford, M.J. Can flax replace E-glass in structural composites? A small wind turbine blade case study. Compos. Part B Eng. 2013, 52, 172–181. [Google Scholar] [CrossRef]
- Kalagi, G.R.; Patil, R.; Nayak, N. Experimental Study on Mechanical Properties of Natural Fiber Reinforced Polymer Composite Materials for Wind Turbine Blades. Mater. Today Proc. 2018, 5, 2588–2596. [Google Scholar] [CrossRef]
- Miliket, T.A.; Ageze, M.B.; Tigabu, M.T.; Zeleke, M.A. Experimental characterizations of hybrid natural fiber-reinforced composite for wind turbine blades. Heliyon 2022, 8, e09092. [Google Scholar] [CrossRef]
- Gaertner, E.; Rinker, J.; Sethuraman, L.; Anderson, B.; Zahle, F.; Barter, G. IEA Wind TCP Task 37: Definition of the IEA 15 MW Offshore Reference Wind Turbine; National Renewable Energy Lab.: Golden, CO, USA, 2020; pp. 1–44. Available online: https://github.com/IEAWindTask37/IEA-15-240-RWT (accessed on 23 April 2024).
- Scott, S.; Greaves, P.; Macquart, T.; Pirrera, A. Comparison of blade optimisation strategies for the IEA 15MW reference turbine. J. Phys. Conf. Ser. 2022, 2265, 032029. [Google Scholar] [CrossRef]
- Halpin, J.C.; Kardos, J.L. The Halpin-Tsai Equations: A Review. Polym. Eng. Sci. 1976, 16, 293–387. [Google Scholar] [CrossRef]
- ISO 14040:2006; Environmental Management—Life Cycle Assessment—Principles and Framework. International Organization for Standardization: Geneva, Switzerland, 2006. Available online: https://www.iso.org/standard/37456.html (accessed on 23 April 2024).
- Bortolotti, P.; Berry, D.; Murray, R.; Gaertner, E.; Jenne, D.; Damiani, R.; Barter, G.; Dykes, K. A Detailed Wind Turbine Blade Cost Model. 2019. Available online: https://www.nrel.gov/docs/fy19osti/73585.pdf (accessed on 23 April 2024).
- Jalili, S.; Maheri, A.; Ivanovic, A. Cost Modelling for Offshore Wind Farm Decommissioning. 2022. Available online: https://northsearegion.eu/media/19936/cost-modelling_final_2022.pdf (accessed on 23 April 2024).
- Offshore Renewable Energy Catapult. Decarboning Marine Operation North Sea Offshore Wind: Innovation Roadmap Produced for the UK Government DfT and FCDO. 2021. Available online: https://assets.publishing.service.gov.uk/media/60e5ce8ae90e0764c8f0a3d4/decarbonising-maritime-operations-in-north-sea-offshore-wind-o-and-m.pdf (accessed on 23 April 2024).
- SPARTA. System Performance, Availability and Reliability Trend Analysis: Portfolio Review 2016. No. March, 2017. Available online: https://s3-eu-west-1.amazonaws.com/media.ore.catapult/wp-content/uploads/2017/03/28102600/SPARTAbrochure_20March-1.pdf (accessed on 23 April 2024).
- Palmer, J.; Ghita, O.R.; Savage, L.; Evans, K.E. Successful closed-loop recycling of thermoset composites. Compos. Part A Appl. Sci. Manuf. 2009, 40, 490–498. [Google Scholar] [CrossRef]
- Meng, F.; Olivetti, E.A.; Zhao, Y.; Chang, J.C.; Pickering, S.J.; McKechnie, J. Comparing Life Cycle Energy and Global Warming Potential of Carbon Fiber Composite Recycling Technologies and Waste Management Options. ACS Sustain. Chem. Eng. 2018, 6, 9854–9865. [Google Scholar] [CrossRef]
- AOC Trusted Solutions. Renewable Value: Recycling Guide. 2020. Available online: https://aocresins.com/en-emea/downloads/renewable-value-composites-recycling/# (accessed on 23 April 2024).
- Shuaib, N.A.; Mativenga, P.T. Energy demand in mechanical recycling of glass fibre reinforced thermoset plastic composites. J. Clean. Prod. 2016, 120, 198–206. [Google Scholar] [CrossRef]
- Blanchard, J.M.F.A.; Sobey, A.J. Comparative design of E-glass and flax structures based on reliability. Compos. Struct. 2019, 225, 111037. [Google Scholar] [CrossRef]
- Madsen, B.; Hoffmeyer, P.; Lilholt, H. Hemp yarn reinforced composites—II. Tensile properties. Compos. Part A Appl. Sci. Manuf. 2007, 38, 2204–2215. [Google Scholar] [CrossRef]
- Barbero, E.J. Introduction to Composite Materials Design; CRC Press: Boca Raton, FL, USA, 1998. [Google Scholar]
- Rahman, M.Z. Mechanical and damping performances of flax fibre composites–A review. Compos. Part C Open Access 2021, 4, 100081. [Google Scholar] [CrossRef]
- Tsalidis, G.A. Human Health and Ecosystem Quality Benefits with Life Cycle Assessment Due to Fungicides Elimination in Agriculture. Sustainability 2022, 14, 846. [Google Scholar] [CrossRef]
- Van Zelm, R.; Huijbregts, M.A.J.; Posthuma, L.; Wintersen, A.; Van De Meent, D. Pesticide ecotoxicological effect factors and their uncertainties for freshwater ecosystems. Int. J. Life Cycle Assess. 2009, 14, 43–51. [Google Scholar] [CrossRef]
- Nordborg, M.; Davis, J.; Cederberg, C.; Woodhouse, A. Freshwater ecotoxicity impacts from pesticide use in animal and vegetable foods produced in Sweden. Sci. Total Environ. 2017, 581–582, 448–459. [Google Scholar] [CrossRef]
- Palmer, J.A.T. Mechanical Recycling of Automotive Composites for Use as Reinforcement in Thermoset Composites; University of Exeter: Exeter, UK, 2009. [Google Scholar]
- Dittenber, D.B.; Gangarao, H.V.S. Critical review of recent publications on use of natural composites in infrastructure. Compos. Part A Appl. Sci. Manuf. 2012, 43, 1419–1429. [Google Scholar] [CrossRef]
- Nehls, G. MingYang Reveals 18-MW Offshore Wind Turbine Model with 140-meter-long Blades. Composites World 2023. Available online: https://www.compositesworld.com/news/mingyang-reveals-18-mw-offshore-wind-turbine-model-with-140-meter-long-blades (accessed on 23 April 2024).
- Malnati, P. ‘Green’ Carbon Fiber: Renewable Energy Powers Fiber Production. Composites World 2020. Available online: https://www.compositesworld.com/news/green-carbon-fiber-renewable-energy-powers-fiber-production#:~:text=Source (accessed on 23 April 2024).
- Khayyam, H.; Naebe, M.; Milani, A.S.; Fakhrhoseini, S.M.; Date, A.; Shabani, B.; Atkiss, S.; Ramakrishna, S.; Fox, B.; Jazar, R.N. Improving energy efficiency of carbon fiber manufacturing through waste heat recovery: A circular economy approach with machine learning. Energy 2021, 225, 120113. [Google Scholar] [CrossRef]
- Al-Lami, A.; Hilmer, P.; Sinapius, M. Eco-efficiency assessment of manufacturing carbon fiber reinforced polymers (CFRP) in aerospace industry. Aerosp. Sci. Technol. 2018, 79, 669–678. [Google Scholar] [CrossRef]
- Arnold, U.; De Palmenaer, A.; Brück, T.; Kuse, K. Energy-Efficient Carbon Fiber Production with Concentrated Solar Power: Process Design and Techno-economic Analysis. Ind. Eng. Chem. Res. 2018, 57, 7934–7945. [Google Scholar] [CrossRef]
- Karp, E.M.; Eaton, T.R.; SànchezNogué, V.; Vorotnikov, V.; Biddy, M.J.; Tan, E.C.D.; Brandner, D.G.; Cywar, R.M.; Liu, R.; Manker, L.P.; et al. Renewable acrylonitrile production. Science 2017, 358, 1307–1310. [Google Scholar] [CrossRef]
- Nehls, G. Toray Obtains ISCC Certification for European Carbon Fiber. Composites World 2024. Available online: https://www.compositesworld.com/news/toray-obtains-iscc-certification-for-european-carbon-fiber-production-facilities (accessed on 23 April 2024).
- Nehls, G. Teijin to Produce, Sell Tenax Carbon Fiber from Certified, Sustainable Raw Materials. Composites Structures 2024. Available online: https://www.compositesworld.com/news/teijin-to-produce-sell-tenax-carbon-fiber-from-certified-sustainable-raw-materials (accessed on 23 April 2024).
- Poursorkhabi, V.; Abdelwahab, M.A.; Misra, M.; Khalil, H.; Gharabaghi, B.; Mohanty, A.K. Processing, Carbonization, and Characterization of Lignin Based Electrospun Carbon Fibers: A Review. Front. Energy Res. 2020, 8, 208. [Google Scholar] [CrossRef]
- Mateo-Sagasta, J.; Zadeh, S.M.; Turral, H. More People, More Food… Worse Water?—Water Pollution from Agriculture: A Global Review. Rome. 2018. Available online: https://openknowledge.fao.org/server/api/core/bitstreams/686ea465-7847-428e-b599-b236f2240e47/content (accessed on 23 April 2024).
- Dara, S.K. The New Integrated Pest Management Paradigm for the Modern Age. J. Integr. Pest Manag. 2019, 10, 12. [Google Scholar] [CrossRef]
- Zhang, N.; Wang, M.; Wang, N. Precision agriculture—A worldwide overview. Comput. Electron. Agric. 2002, 36, 113–132. [Google Scholar] [CrossRef]
- Zhang, X.; Davidson, E.A.; Mauzerall, D.L.; Searchinger, T.D.; Dumas, P.; Shen, Y. Managing nitrogen for sustainable development. Nature 2015, 528, 51–59. [Google Scholar] [CrossRef]
- Tester, M.; Langridge, P. Breeding technologies to increase crop production in a changing world. Science 2010, 327, 818–822. [Google Scholar] [CrossRef]
- Lal, R. Soil carbon sequestration impacts on global climate change and food security. Science 2004, 304, 1623–1627. [Google Scholar] [CrossRef]
- Snapp, S.S.; Swinton, S.M.; Labarta, R.; Mutch, D.; Black, J.R.; Leep, R.; Nyiraneza, J.; O’Neil, K. Evaluating cover crops for benefits, costs and performance within cropping system niches. Agron. J. 2005, 97, 322–332. [Google Scholar] [CrossRef]
- Mitsch, W.J.; Gossilink, J.G. The value of wetlands: Importance of scale and landscape setting. Ecol. Econ. 2000, 35, 25–33. [Google Scholar] [CrossRef]
- Gomez-Campos, A.; Vialle, C.; Rouilly, A.; Sablayrolles, C.; Hamelin, L. Flax fiber for technical textile: A life cycle inventory. J. Clean. Prod. 2021, 281, 125177. [Google Scholar] [CrossRef]
- Paulsen, E.B.; Enevoldsen, P. A multidisciplinary review of recycling methods for end-of-life wind turbine blades. Energies 2021, 14, 4247. [Google Scholar] [CrossRef]
- Sorte, S.; Martins, N.; Oliveira, M.S.A.; Vela, G.L.; Relvas, C. Unlocking the Potential of Wind Turbine Blade Recycling: Assessing Techniques and Metrics for Sustainability. Energies 2023, 16, 7624. [Google Scholar] [CrossRef]
- Chartered Institution of Building Services Engineers (CIBSE). TM46: 2008 Energy Benchmarks CIBSE; Chartered Institution of Building Services Engineers (CIBSE): London, UK, 2008. [Google Scholar]
- Kaiser, M.J.; Snyder, B. Offshore Wind Energy Cost Modeling: Installation and Decommissioning. In Green Energy and Technology; Springer: Berlin, Germany, 2014. [Google Scholar]
- Dalgic, Y.; Lazakis, I.; Turan, O.; Judah, S. Investigation of Optimum Jack-Up Vessel Chartering Strategy for Offshore Wind Farm O&M Activities. Ocean Eng. 2014, 95, 106–115. [Google Scholar] [CrossRef]
- Hassan, G.L.G. A Guide to UK Offshore Wind Operations and Maintenance; Scottish Enterprise: Glasgow, UK, 2013. [Google Scholar] [CrossRef]
- Jalili, S.; Maheri, A.; Ivanovic, A. Cost and Emission Analyses of Decommissioning of Offshore Wind Farms Using Reverse Installation Method: Cases of Lincs Limited, Gunfleet Sands, and Horns Rev I Wind Farms. 2022. Available online: https://northsearegion.eu/media/21105/cost-and-emission-analysis-of-decommissioning-og-offshore-wind-farms-using-reverse-installation-method.pdf (accessed on 23 April 2024).
- Arvesen, A.; Birkeland, C.; Hertwich, E.G. The Importance of Ships and Spare Parts in LCAs of Offshore Wind Power. Environ. Sci. Technol. 2013, 47, 2948–2956. [Google Scholar] [CrossRef]
- Di Maria, F.; Contini, S.; Bidini, G.; Boncompagni, A.; Lasagni, M.; Sisani, F. Energetic Efficiency of an Existing Waste to Energy Power Plant. Energy Procedia 2016, 101, 1175–1182. [Google Scholar] [CrossRef]
- Tolvik Consulting. UK Energy from Waste Statistics – 2019. 2019. Available online: https://www.tolvik.com/published-reports/view/uk-energy-from-waste-statistics-2019/ (accessed on 23 April 2024).
- Joseph, A.M.; Snellings, R.; Van den Heede, P.; Matthys, S.; De Belie, N. The use of municipal solidwaste incineration ash in various building materials: A Belgian point of view. Materials 2018, 11, 141. [Google Scholar] [CrossRef]
- Mann, H.; Roloff, C.; Hagemeier, T.; Thévenin, D.; Tomas, J. Model-based experimental data evaluation of separation efficiency of multistage coarse particle classification in a zigzag apparatus. Powder Technol. 2017, 313, 145–160. [Google Scholar] [CrossRef]
- Department of Business Energy and Industrial Strategy. 2020 Government Greenhouse Gas Conversion Factors for Company Reporting: Methodology Paper. 2020. Available online: https://assets.publishing.service.gov.uk/media/5f119b673a6f405c059f6060/conversion-factors-2020-methodology.pdf (accessed on 23 April 2024).
- Costiuc, L.; Patachia, S.; Baltes, L.; Tierean, M. Investigation on Energy Density of Plastic Waste Materials. In Proceedings of the 26th International Conference on Solid Waste Technology and Management, Philadelphia, PA, USA, 27–30 March 2011; pp. 930–939. [Google Scholar]
- Wang, H.; Tian, Y.; Chen, X.; Li, J. Kinetic and Synergetic Effect Analysis of the Co-Combustion of Coal Blended with Polyurethane Materials. ACS Omega 2020, 5, 26005–26014. [Google Scholar] [CrossRef] [PubMed]
- Sukanto, H.; Raharjo, W.W.; Ariawan, D.; Triyono, J. Carbon fibers recovery from CFRP recycling process and their usage: A review. IOP Conf. Ser. Mater. Sci. Eng. 2021, 1034, 012087. [Google Scholar] [CrossRef]
- Thomason, J.L. The influence of fibre length and concentration on the properties of glass fibre reinforced polypropylene: 5. Injection moulded long and short fibre PP. Compos. Part A Appl. Sci. Manuf. 2002, 33, 1641–1652. [Google Scholar] [CrossRef]
- Yang, L.; Thomason, J.L. Development and application of micromechanical techniques for characterising interfacial shear strength in fibre-thermoplastic composites. Polym. Test. 2012, 31, 895–903. [Google Scholar] [CrossRef]
- Cai, G.; Wada, M.; Ohsawa, I.; Kitaoka, S.; Takahashi, J. Interfacial adhesion of recycled carbon fibers to polypropylene resin: Effect of superheated steam on the surface chemical state of carbon fiber. Compos. Part A Appl. Sci. Manuf. 2019, 120, 33–40. [Google Scholar] [CrossRef]
- Resin Library Supplies. Polyester Resin: Preparation, Storage and Usage of Unsaturated Polyester Resin for Glass Fibre-Based Laminates. Available online: https://www.resinlibrary.com/knowledge/article/polyester-resin/ (accessed on 23 April 2024).
- Pakdel, E.; Kashi, S.; Varley, R.; Wang, X. Recent progress in recycling carbon fibre reinforced composites and dry carbon fibre wastes. Resour. Conserv. Recycl. 2021, 166, 105340. [Google Scholar] [CrossRef]
- Krauklis, A.E.; Karl, C.W.; Gagani, A.I.; Jørgensen, J.K. Composite Material Recycling Technology—State of the Art and Sustainable Development for the 2020s. J. Compos. Sci. 2021, 5, 28. [Google Scholar] [CrossRef]
- Pickering, S.; Turner, T.; Meng, F.; Morris, C. Developments in the Fluidised Bed Process for Fibre Recovery from Thermoset Composites. 2015. Available online: https://www.researchgate.net/publication/301849557_Developments_in_the_fluidised_bed_process_for_fibre_recovery_from_thermoset_composites/link/5854164608ae77ec370458a2/download?_tp=eyJjb250ZXh0Ijp7ImZpcnN0UGFnZSI6InB1YmxpY2F0aW9uIiwicGFnZSI6InB1YmxpY2F0aW (accessed on 23 April 2024).
- Zhang, Y.; Huang, T.; Wang, Y.; Zhang, J.; Wang, J. Environmental assessment of concrete beams strengthened with fibre-reinforced polymer. Proc. Inst. Civ. Eng. Eng. Sustain. 2020, 174, 37–45. [Google Scholar] [CrossRef]
- Inman, M.; Thorhallsson, E.R.; Azrague, K. A Mechanical and Environmental Assessment and Comparison of Basalt Fibre Reinforced Polymer (BFRP) Rebar and Steel Rebar in Concrete Beams. Energy Procedia 2017, 111, 31–40. [Google Scholar] [CrossRef]
- Azrague, K.; Inman, M.R.; Alnaes, L.-I.; Dahl Schlanbusch, R.; Jóhannesson, B. Life Cycle Assessment as a Tool for Resource Optimisation of Continuous Basalt Fibre Production in Iceland. 2016. Available online: http://dc.engconfintl.org/lca_wastehttp://dc.engconfintl.org/lca_waste/10 (accessed on 23 April 2024).
- Pavlović, A.; Donchev, T.; Petkova, D.; Staletović, N. Sustainability of alternative reinforcement for concrete structures: Life cycle assessment of basalt FRP bars. Constr. Build. Mater. 2022, 334, 127424. [Google Scholar] [CrossRef]
- Osnos, S. Present and future of basalt fibre technology, manufacturing and market development. JEC Compos. Mag. 2016, 53, 15–18. [Google Scholar]
- Misiura, D.; Majka, T.M. An overview on obtaining foamed PET by reactive extrusion. Czas. Tech. 2018, 4, 97–102. [Google Scholar] [CrossRef]
- Svanberg, K. MMA and GCMMA—Two Methods for Nonlinear Optimization. 2007. Available online: https://people.kth.se/~krille/mmagcmma.pdf (accessed on 23 April 2024).
- Scott, S.J. Optimal Aeroelastic Tailoring of Wind Turbines; University of Bristol: Bristol, UK, 2021. [Google Scholar]
- Hexion. Technical Data Sheet: EPIKOTETM Resin MGSTM RIMR 135 and EPIKURETM Curing Agent MGSTM RIMH 134–RIMH 137. 2006. Available online: https://www.metyx.com/wp-content/uploads/PDF_Files/Hexion/TDS/TDS%20RIMH%20137.pdf (accessed on 23 April 2024).
- Communications with Flax Fibre Material Supplier—EcoTechnilin. 2022. Available online: https://eco-technilin.com/en/ (accessed on 23 April 2024).
- Lance Brown Import-Export, “Basalt Fibers Datasheet”. Available online: https://www.lbie.com/PDF/n3011.pdf (accessed on 23 April 2024).
- Sphera. Process Data Set: Glass Fibres; from Mineral Components; Production Mix, at Plant; Borosillicate Glass/E-Glass. 2023. Available online: http://gabi-documentation-2022.gabi-software.com/xml-data/processes/894ab0c2-a408-4824-8983-f886248f65bb.xml (accessed on 23 April 2024).
- Sphera. Process Data Set: Flax Long Fibre; Technology Mix; Production Mix, at Plant; Long Fibre. 2023. Available online: https://lcadatabase.sphera.com/2024/xml-data/processes/f0e27392-c4a2-4593-8603-c9f2a5274f9e.xml (accessed on 23 April 2024).
- Sphera. Process Data Set: Hemp Long Fibre; Technology Mix; Production Mix, at Plant; Long Fibre. 2023. Available online: https://lcadatabase.sphera.com/2024/xml-data/processes/3fbc0b5f-1455-403a-9f7b-f624ebc2c912.xml (accessed on 23 April 2024).
- Sphera. Process Data Set: Epoxy Resin (EP); from Bisphenol A and Epichlorohydrin; Production Mix, at Plant. 2021. Available online: http://gabi-documentation-2022.gabi-software.com/xml-data/processes/30df02e7-d183-4eba-987e-351ae4e42455.xml (accessed on 23 April 2024).
- DNV. DNV-ST-0376 Rotor Blades for Wind Turbines. 2015. Available online: https://arc.global/articles/docs/rotor-blades-DNVGL-ST-0376.pdf (accessed on 23 April 2024).
- Jones, R.M. Mechanics Of Composite Materials, 2nd ed.; CRC Press: Boca Raton, FL, USA, 1999. [Google Scholar]

| Blade Scenario ID | Alternative Fibre Deployed | Scenario Description |
|---|---|---|
| 1 | None | Baseline WTB |
| 2.1 | Flax fibre | Bi-axial GF replacement in shells and shear webs |
| 2.2 | ||
| 2.3 | Bi-axial GF replacement in shells and shear webs, UD GF replacement in LE, TE, and shells | |
| 2.4 | Bi-axial GF replacement in shells and shear webs, UD GF replacement in shells, LE, TE, and spar caps | |
| 3.1 | Hemp fibre | Bi-axial GF replacement in shells and shear webs |
| 3.2 | ||
| 4.1 | Basalt fibre | Bi-axial and UD GF replacement throughout all WTB, no CF replacement in spar |
| 4.2 | Bi-axial and UD GF replacement throughout all WTB, CF replacement in spar |
| Blade Scenario ID | Reinforcement Fibre Deployed in WTB Section/Vf (%) | Analyses Conducted | |||||||
|---|---|---|---|---|---|---|---|---|---|
| Spar_UD, i | Spar_UD, o | Shell_UD | LE_UD | TE_UD | Shell_Biax | Web_Biax | Structural | LCA | |
| 1 | CF/59% | GF/54% | ✔ 2 | ✔ | |||||
| 2.1 | GF/54% | FF/54% | ✔ 2 | ✖ | |||||
| 2.2 | GF/54% | FF/40% | ✔ 2 | ✔ | |||||
| 2.3 | GF/54% | FF/54% | ✔ 2 | ✖ | |||||
| 2.4 | FF/54% | ✔ 2 | ✖ | ||||||
| 3.1 | GF/54% | HF/54% | ✔ 2 | ✖ | |||||
| 3.2 | GF/54% | HF/40% | ✔ 2 | ✔ | |||||
| 4.1 | BF/54% | ✔ 1 | ✖ | ||||||
| 4.2 | CF/59% and BF/54% 3 | BF/54% | ✔ 2 | ✔ | |||||
| Material Name | GF/Epoxy | CF/Epoxy | FF/Epoxy | HF/Epoxy | BF/Epoxy | ||
|---|---|---|---|---|---|---|---|
| Fibre Type | E-Glass | Carbon | Flax | Hemp | Basalt | ||
| Vf [%] | 54 | 59 | 54 | 40 | 54 | 40 | 54 |
| E1 [MPa] | 41,214 | 129,190 | 32,031 | 24,718 | 30,373 | 23,478 | 50,173 |
| E2 [MPa] | 14,883 | 7616 | 15,274 | 9942 | 15,377 | 9985 | 15,185 |
| v12 | 0.28 | 0.32 | 0.27 | 0.29 | 0.27 | 0.29 | 0.27 |
| G12 [MPa] | 3019 | 3811 | 2829 | 2172 | 2796 | 2155 | 3130 |
| XT [MPa] | 905 | 1954 | 286 | 221 | 269 | 208 | 1158 |
| XC [MPa] | 527 | 967 | 188 | 159 | 178 | 152 | 651 |
| YT [MPa] | 59 | 47 | 59 | 59 | 59 | 59 | 65 |
| YC [MPa] | 81 | 158 | 81 | 81 | 81 | 81 | 85 |
| S [MPa] | 41 | 55 | 41 | 41 | 41 | 41 | 43 |
| Density [g/cm2] | 1.96 | 1.55 | 1.33 | 1.29 | 1.33 | 1.29 | 2.00 |
Disclaimer/Publisher’s Note: The statements, opinions and data contained in all publications are solely those of the individual author(s) and contributor(s) and not of MDPI and/or the editor(s). MDPI and/or the editor(s) disclaim responsibility for any injury to people or property resulting from any ideas, methods, instructions or products referred to in the content. |
© 2024 by the authors. Licensee MDPI, Basel, Switzerland. This article is an open access article distributed under the terms and conditions of the Creative Commons Attribution (CC BY) license (https://creativecommons.org/licenses/by/4.0/).
Share and Cite
Pender, K.; Bacharoudis, K.; Romoli, F.; Greaves, P.; Fuller, J. Feasibility of Natural Fibre Usage for Wind Turbine Blade Components: A Structural and Environmental Assessment. Sustainability 2024, 16, 5533. https://doi.org/10.3390/su16135533
Pender K, Bacharoudis K, Romoli F, Greaves P, Fuller J. Feasibility of Natural Fibre Usage for Wind Turbine Blade Components: A Structural and Environmental Assessment. Sustainability. 2024; 16(13):5533. https://doi.org/10.3390/su16135533
Chicago/Turabian StylePender, Kyle, Konstantinos Bacharoudis, Filippo Romoli, Peter Greaves, and Jonathan Fuller. 2024. "Feasibility of Natural Fibre Usage for Wind Turbine Blade Components: A Structural and Environmental Assessment" Sustainability 16, no. 13: 5533. https://doi.org/10.3390/su16135533