Article

Decisions and Coordination of E-Commerce Supply Chain Considering Product Quality and Marketing Efforts under Different Power Structures

1
Teaching Department of Basic Subjects, Jiangxi University of Science and Technology, Nanchang 330013, China
2
Business School, Jiangxi University of Science and Technology, Nanchang 330013, China
*
Author to whom correspondence should be addressed.
Sustainability 2024, 16(13), 5536; https://doi.org/10.3390/su16135536
Submission received: 5 June 2024 / Revised: 23 June 2024 / Accepted: 25 June 2024 / Published: 28 June 2024
(This article belongs to the Special Issue Sustainable Supply Chain and Operations Management: 2nd Edition)

Abstract

:
With the rapid development of internet technology, consumers have increasingly higher requirements for product quality. High-quality products can win consumers’ trust. Enhancing both product quality and sales in e-commerce platform transactions has long been a focal point of research. To address this issue, this paper constructs Stackelberg game models under different power structures and compares their impacts on pricing decisions and profits within e-commerce supply chains. Numerical simulations are used to explore the optimal combination strategy for the interaction of product quality and marketing efforts in the e-commerce supply chain. The results show that: (1) Under a centralized decision-making model, product quality and marketing efforts reach their optimal values, maximizing benefits for the supply chain system. (2) Under different power structures, the relationship between the profits of the supplier and the e-commerce platform self-operator is closely linked to the cost coefficients of product quality and marketing efforts. (3) Through the mechanism of “cost-sharing + compensation contract”, the supplier can reduce wholesale price, and the e-commerce platform self-operator can subsidize a portion of the sales to the supplier, thereby maximizing the profits of both parties and achieving a win–win situation. The research in this paper aids suppliers in improving product quality and e-commerce platform self-operators in enhancing their marketing efforts, providing theoretical support for optimizing supply-chain decision making on e-commerce platforms.

1. Introduction

In recent years, with the rapid advancement of e-commerce and the evolving nature of consumer demand, there has been a growing focus on the quality of electronic products purchased online [1]. In the digital age, electronic products hold a significant position in the e-commerce supply chain. The report “Consumer Electronics Market Size, Share & Trends Analysis Report by Product (Smartphones, Tablets, Desktops, Laptops, Digital Cameras, Hard Disk Drives, E-readers), By Sales Channel (Offline, Online), By Region, And Segment Forecasts, 2023–2030” pointed out that the global consumer electronics market size was $1068.22 billion in 2022 and is expected to grow at a compound annual growth rate of 6.6% from 2023 to 2030. This growth trend not only reflects consumers’ preference for high-quality electronic products but also highlights the key role of e-commerce platforms in supply-chain management. In the e-commerce supply chain, the quality and sales strategy of electronic products directly influence consumers’ purchasing decisions and satisfaction [2]. In addition, consumers are willing to pay for technological innovation, making high-quality electronic products their top choice [3]. Consumers, both domestically and internationally, generally prioritize the performance and quality of electronic products. Whether it is a smartphone, tablet, or home appliance, consumers expect these products to offer high performance and stable quality [4]. Driven by the trends of globalization and digitalization, electronic products are predominantly sold through e-commerce platforms, providing consumers worldwide with more choices and greater purchasing convenience [5]. However, addressing the quality standards of electronic products and improving their sales performance on e-commerce platforms is an urgent challenge for companies to solve [6]. Therefore, improving sales performance while ensuring product quality has become a common focus for e-commerce platform self-operators and suppliers. The research findings of this paper apply to the entire electronic products industry and provide theoretical guidance for the industry as a whole.
The improvement of electronic product quality and marketing efforts is crucial to the development of both suppliers and e-commerce platform self-operators. Many scholars have conducted various studies to enhance product quality and marketing strategies. Mulyad [7] conducted interviews and found that the quality of electronic products significantly impacts corporate sales performance. Prabhakar [8] also used the same method to improve product quality standards. Gong et al. [9] investigated the relationship between product quality and sales using the perspectives of super networks and variational inequalities. Wang et al. [10] developed a two-stage game model to examine how sales models impact manufacturers. In addition, Huang et al. [11] developed a revenue–cost contract to achieve optimal product quality and maximize profits. Subhajit et al. [12] implemented a contract strategy in which manufacturers and retailers collaborate to share costs, aiming to maximize profits for all participants in the supply chain. Previous studies have primarily focused on the impact of individual factors on supply chains or enterprises. In contrast, this article focuses on a supply-chain decision model that integrates both product quality and marketing efforts as dual factors. Moreover, while most studies focus on designing revenue–cost contracts, the subsidy contract proposed in this article aims to optimize decision-making profits more effectively for both parties involved.
The research perspective of this paper is as follows: firstly, it synthesizes the two pivotal factors of product quality and marketing efforts to investigate their collective impact on supply-chain performance. Secondly, adopting the perspective of e-commerce platform supply chains, this paper employs game theory to explore the coordination of decision making between suppliers and e-commerce platform self-operators under varying power structures. Finally, this paper introduces a “cost-sharing + compensation contract” mechanism to coordinate the e-commerce supply chain, thereby fostering the collaborative operations of suppliers and e-commerce platform self-operators, improving the overall profit of the e-commerce supply-chain system, and providing a useful reference for the practice of e-commerce supply-chain operation and management. Through the above analysis, this paper aims to answer the following questions:
  • In the e-commerce supply-chain system, when product quality and marketing efforts are independently managed, will there be free-riding behavior due to reliance on each other’s efforts?
  • When both e-commerce platform operators and suppliers seek to maximize their profits, will the overall performance of the supply chain decline?
  • How can the interests of supply-chain members be coordinated when they work together?
The main framework of this paper is to consider the level of product quality and marketing efforts by studying the e-commerce supply chain. The Stackelberg game models under different power structures are constructed, and a decentralized decision-making model led by suppliers and e-commerce platform self-operators is established. Then, through numerical simulation, the impact of product quality and marketing efforts on supply-chain decision making under different power structures is obtained. Finally, the design and coordination contract optimize the e-commerce supply chain.

2. Literature Review

2.1. Supply-Chain Research under Different Power Structures

Within the supply chain, each member possesses a certain degree of bargaining power. The supplier and e-commerce platform self-operator, occupying various market positions, form distinct power structures. Fan et al. [13] investigated the impact of cost sharing on manufacturers’ product quality decisions across various power structures. Lu et al. [14] studied the profits of each member within the power structures of different supply chains of super-large retail stores and discovered that when manufacturers assumed a leadership role, the profits of all members achieved Pareto optimality. Wang et al. [15] developed a five-power model and discovered that when the manufacturer holds greater power, the profit of each member within the supply chain increases accordingly. In addition, when there is power parity, the entire supply chain can be optimized. Wen et al. [16] and Wang et al. [17] designed a Nash equilibrium game dominated by manufacturers and retailers and a centralized game model for different channel power structures and found that the centralized decision model was the optimal decision model. Chen and Wang [18] conducted a study on the smartphone supply chain and discovered that profits were higher under a vertical Nash power structure compared to those under a TS or MS power structure. Feng et al. [19] and Chen et al. [20] pointed out that the power structure significantly influences the selection of service channels, and that the preferences for power structures vary accordingly. Jena and Meena [21] constructed five game models to change the power structure through an omni-channel, thereby providing consumers with different shopping services and improving performance. Andriani and Tseng [22] studied wholesale price contracts with power structures to achieve optimal levels of product quality, pricing, and supply-chain performance. It can be seen that different power structures in the supply chain can have a non-negligible impact on their operational decisions and performance.

2.2. Impact of Product Quality on the Supply Chain

With the swift advancement of science and technology, coupled with consumers’ growing demand for superior product quality, product quality has emerged as a pivotal factor in market competition. Cao et al. [23] studied the quality level of products and discovered that enhancing product quality can boost the profitability of supply-chain members, fostering closer collaboration among them. Xu et al. [24] investigated the influence of electronic product quality on the e-commerce supply chain and found that, under centralized decision making, product quality reaches its optimum level, thereby maximizing overall benefits. Zhang et al. [25] explored closed-loop supply chains and developed revenue-sharing contracts aimed at achieving maximum profits and reducing competition through quality enhancement. Zhang et al. [26] pointed out that suppliers should invest more in enhancing product quality. They established a cost-sharing model, demonstrating that improved quality control can boost the profits of both retailers and suppliers. Amirhossein et al. [27] proposed a multi-objective model that addresses various needs by considering the effects of different product quality levels on customers. Ahmed et al. [28] considered using inventory models to improve product production quality and found that using a centralized decision-making model can minimize production defects and improve product quality. Lin and Luo [29] investigated the innovation capabilities for the product quality of manufacturing enterprises, demonstrating that enhancing these capabilities significantly boosts the profitability of the supply-chain system. In summary, product quality holds immense significance in supply-chain research, offering theoretical support for incorporating the impact of product quality on supply-chain decision making.

2.3. Impact of Marketing Efforts on the Supply Chain

Intensified market competition and the diversification of consumer needs have elevated the importance of marketing efforts within the supply chain, making their role increasingly prominent. Li et al. [30] studied the decentralized green product supply chain and discovered that a high impact of marketing efforts significantly enhances the level of product greening. Taylor [31] pointed out that when retailers’ sales efforts affect demand, sales rebates and returns can enable retailers to invest in the best promotional efforts, thereby achieving channel coordination. Xie et al. [32] investigated the marketing efforts of retailers and proposed revenue–cost-sharing contracts, revealing that both retailers and suppliers benefit when retailers actively engage in marketing efforts. Li and Cao [33] discussed manufacturers’ research and development efforts and retailers’ marketing efforts and found that an increase in retailers’ marketing efforts increased market demand and supply-chain members’ profits. In addition, many scholars use marketing efforts by suppliers to maximize their profits [34,35]. Li and Chen [36] studied channel structure selection and marketing efforts and showed that suppliers selling products directly to consumers increase their profits. Chang et al. [37] discussed the marketing efforts of suppliers to increase their sales and maximize profits. Through comparative analysis, Huang et al. [38] discovered that platform marketing efforts significantly enhance the overall performance of the supply chain. In addition, some scholars have conducted the following research on the company’s efforts. Sousa [39] pointed out that companies may improve their market competitiveness through virtual equipment, helping them stand out in an increasingly competitive market. Jorge et al. [40] studied how new digital business alternatives affect firms and how user acceptance of these alternatives increases firms’ interest in innovative business models. Fadi et al. [41] believed that a company’s strategic investment model would affect its product quality and sustainable development. In summary, the marketing efforts of manufacturers, retailers, and companies play a crucial role in enhancing supply-chain performance. This underscores the importance of delving deeper into the impact of marketing activities within the supply chain, highlighting it as a topic worthy of thorough investigation and exploration.

2.4. Research on Coordination Contracts in Supply Chains

To effectively enhance the quality of electronic products in the e-commerce supply chain and elevate the marketing efforts of retailers, most supply chains primarily employ coordination mechanisms to boost their profits. Zhang et al. [42] employed a system dynamics approach to achieve closed-loop supply-chain coordination through the implementation of a quality penalty–revenue-sharing contract. Wang et al. [43] explored the application of tariff-pricing contracts to coordinate supply chains, particularly when manufacturers provide subsidies to enhance product quality. Mohammad et al. [44] addressed the challenge of maintaining electronic product quality and proposed a tiered revenue-sharing contract to harmonize the profitability of all parties involved in the agreement. Shen et al. [45] studied the influence of revenue-sharing contracts on the level of product quality control. Kou et al. [46] devised a contract combining fixed payments with extended warranty service revenue sharing, aimed at enhancing product quality and boosting supply-chain profits. Chen et al. [47] found that both the manufacturer and the retailer achieve maximum benefit when the retailer engages in marketing efforts under a revenue-sharing contract. Hu et al. [48] introduced zero-wholesale price-side payment contracts and greedy wholesale-side payment contracts to achieve coordination and increase profits. Furthermore, several scholars have explored the coordinating role of e-commerce platforms in this context. Taking into account the unique characteristics of e-commerce platforms, Wang et al. [49] proposed the use of an altruistic preference within joint fixed-cost contracts to maximize system efficiency. Lin and Qin [50] discussed the advertising and marketing efforts of e-commerce platforms and established a sales commission ratio combined with a service cost-sharing contract to achieve optimal supply-chain coordination. In summary, most scholars consider cost-sharing or benefit-sharing contracts, which provide the theoretical basis for this paper.
In summary, the existing research has obvious limitations on supply-chain performance and coordination. On one hand, most studies focus on individual factors such as electronic product quality or marketing efforts, with a limited in-depth discussion on supply-chain coordination from the perspective of the interplay between product quality and marketing efforts. On the other hand, while existing studies predominantly explore supply-chain coordination through approaches such as revenue sharing, cost sharing, or their combination, there is a notable paucity of research on retailers’ cost-sharing contracts and compensation contracts. A comparison between this study and previous studies is shown in Table 1. Therefore, this paper explores supply-chain coordination under the synergistic effects of product quality and marketing efforts. It introduces an innovative cost-sharing and compensation contract model aimed at maximizing the profits of supply-chain members.

3. Research Methodology

3.1. Introduction to the Methodology

The Stackelberg game model, also known as the leader–follower model, is a classic dynamic game model that is widely used in economics, management, supply-chain management, and market competition. The model describes the decision-making process and strategic interaction between leader and follower with first-mover advantages in the market, which involves two main stages and a specific decision-making sequence.
The two main stages are as follows: The first stage is the leader-decision stage, where the leader makes the initial decision. This decision can pertain to strategy elements such as pricing, output, investment, market entry, and more. The leader’s decision offers benefits from a first-mover advantage, as followers will subsequently make their decisions based on the observed actions of the leader. The second stage is the follower-reaction stage, in which the followers make their optimal decisions after observing the leader’s decision. The followers’ decisions are reactions to the leader’s actions, and they will seek to optimize their benefits based on the leader’s initial decision. The specific decision sequence is as follows: In the Stackelberg game model, the leader makes the initial decision and thus holds a first-mover advantage. This advantage allows the leader to influence the choices of followers and shape market outcomes through their initial decision. After observing the leader’s decision, the follower then selects its optimal strategy. Consequently, the follower’s strategy becomes the best response to the leader’s decision.
The following is a description of the Stackelberg game model: the supplier first chooses output q 1 , the retailer observes q 1 , and then the retailer chooses their own output q 2 . This is a complete information dynamic game. Assuming the inverse demand function is P ( Q ) = a q 1 q 2 , and the supplier and the retailer have the same constant unit cost c , then their profit function is Π i = q i [ P ( Q ) c ] ,   i = 1 , 2 . Given the situation of q 1 , the optimal choice of the retailer is max Π 2 = q 2 ( a q 1 q 2 c ) , finding the first-order derivative function and setting it to 0, which means that the retailer’s marginal revenue is equal to the marginal cost, the profit is maximized, and its reaction curve is q 2 = 1 / 2 ( a q 1 c ) . Here, q 2 is the actual situation of the retailer when the supplier chooses q 1 . Similarly, we can calculate the supplier’s profit. If we substitute q 2 into the equation, we obtain max Π 1 = q 1 [ a q 1 1 / 2 ( a q 1 c ) c ] . Taking the first-order derivative, we obtain q 1 = 1 / 2 ( a c ) . Substituting this into the retailer’s reaction function, we obtain q 2 = 1 / 4 ( a c ) .
In summary, the Stackelberg game model employs a two-stage decision-making process to analyze how companies with first-mover advantages influence market outcomes and the behavior of other companies through their decisions. Leaders leverage their first-mover advantage to formulate strategies, while followers respond with their best response strategies to maximize their respective interests.
Many scholars have used this method to study supply-chain decision making and coordination. Saha et al. [51] studied five game models and introduced a two-way revenue-sharing contract aimed at enhancing supply-chain performance. He et al. [52] explored cooperative advertising strategies within a two-period supply chain, employing game-theory methods and supply-chain contracts to enhance coordination within the system. Guo et al. [53] developed a Stackelberg game model to analyze pricing strategies and profit distribution within the supply chain under various decision-making scenarios characterized by asymmetric power dynamics. Heydari and Ghasemi [54] investigated the reverse supply chain and developed a tailored revenue-sharing mechanism designed to distribute risks among participants. Hosseini-Motlagh et al. [55] analyzed optimal decision making in a Stackelberg game involving competing retailers. They proposed a wholesale price contract with multilateral compensation to effectively coordinate decisions across multiple links in the supply chain. Modak et al. [56] investigated the vertical game between manufacturers and retailers using a Stackelberg model, ultimately achieving channel coordination through a two-stage game decision-making process. Jiang and Ma [57] analyzed the Stackelberg game model and examined the effects of pre-sales and product quality on supply-chain members. The results indicated that pre-sales lead to increased profits for both retailers and manufacturers. Previous studies on the Stackelberg game method serve as valuable examples and provide a solid theoretical foundation for this paper, enabling the realization of its model.

3.2. Research Problem and Assumptions

Using electronic products as a case study, this paper investigates the decision-making processes within a dual-entity e-commerce supply chain, consisting of a supplier and an e-commerce platform self-operator. In this supply chain, the supplier is tasked with manufacturing electronic products and providing them to the e-commerce platform’s self-dealer at wholesale prices. The e-commerce platform self-operator orders these electronic products from the supplier and sells them online to consumers. Additionally, the supplier determines the product’s wholesale price w and quality level t , while the self-operator of the e-commerce platform determines the market sales price p and marketing efforts e . The structure of the model is shown in Figure 1.
In this paper, three decision-making models are constructed: a centralized decision-making model, a supplier-led decision-making model, and a decentralized decision-making model led by an e-commerce platform self-operator. The centralized decision-making model involves joint decisions made by various stakeholders to maximize the overall benefit of the supply chain. The supplier-led Stackelberg model considers a scenario where a dominant supplier and an e-commerce platform self-operator constitute a two-stage Stackelberg game, with the supplier in the leading role and the e-commerce platform self-operator as the follower. Conversely, in the Stackelberg game model dominated by the e-commerce platform self-operator, the e-commerce platform self-operator assumes the role of the leader, while the supplier takes on the role of the follower.
The consumers’ perception of product quality is often subjective and influenced by factors such as the product’s appearance, performance, and technological innovation. Many scholars have conducted extensive research on consumers’ perceptions of product quality and its definition. He and He [58] defined product quality as the benefit created for the user when the product is used correctly, encompassing the consumer’s preference and satisfaction. Wang et al. [59] combined product quality with altruistic preference concerns and employed game-theory methods. Their results demonstrated that as consumers’ perception of product quality increased, the profits of manufacturers, e-commerce platforms, and supply-chain systems also increased. Kasulaitis et al. [60] found that consumers exhibit a strong preference for multifunctional and high-performance electronic products. Alessandro et al. [61] found that e-commerce platforms offering products with a high-quality appearance and performance improve consumers’ perceived quality and satisfaction. Based on the research of the aforementioned scholars, this article defines the enhancement of product quality as improvements in product performance, appearance, and technological innovation, providing a reference for enterprises aiming to improve product quality.
The level of marketing efforts refers to the initiatives retailers undertake to boost product sales through various promotions and other marketing strategies designed to stimulate consumer purchases. These efforts are reflected in various aspects, including advertising, product innovation, and sales-team activities [62]. Liu et al. [63] discussed advertising based on specific products and found that a higher investment in quality improvement, combined with lower advertising expenses, can effectively coordinate the profits of various systems within the company. Fu et al. [64] studied a dynamic control model of a monopoly enterprise consisting of departments. Their research demonstrated that product innovation can lead to increased retail prices, thereby resulting in higher profits. Ma and Hu [65] studied the marketing efforts of retailers and explored the impact of these efforts on supply-chain profits using five differential game models. Alotosh et al. [66] employed geometric Brownian motion within a fuzzy environment to address dynamic pricing issues. Their findings indicated that effective promotions and personalized sales approaches can enhance customer retention and improve overall performance. In summary, the level of marketing efforts discussed in this article encompasses advertising, product innovation, and other factors, quantifying their impact through changes in market demand and sales. This provides theoretical support for enterprises seeking to enhance their marketing strategies.
Based on this, the following assumptions need to be put forward in this paper:
Assumption 1.
The market demand  D  is affected by the price  p , product quality level  t , and the marketing effort level  e  of e-commerce platform self-operator, which decreases with the increase in price, increases with the increase in product quality level, and increases with the improvement of the marketing effort level of the e-commerce platform self-operator. So, with reference to Zhang et al. [67], we suppose that the function of  D  is  D = a b p + β t + θ e , where  a > 0 ,  b > 0 ,  β > 0 , and  θ > 0 .
Assumption 2.
Different product quality levels will affect consumers’ choices, and the supplier can improve the quality of electronic products by introducing new equipment. So, the relationship between product quality cost  C ( t )  and product quality level  t  can be reflected as a quantitative parameter, with reference to Cai et al. [68]. The relationship expression is  C ( t ) = 1 2 γ t 2 , where  γ  is the product cost coefficient,  γ > 0 , and the product quality cost is borne by the supplier alone.
Assumption 3.
The degree to which the e-commerce platform self-operator markets their products will influence consumers’ attention, and advertising can help increase brand awareness. So, there will be corresponding costs. With reference to Cai et al. [68], the expression is  C ( e ) = 1 2 k e 2 , where  k  is the cost coefficient of marketing efforts,  k > 0 , and the cost of marketing efforts is borne by the e-commerce platform self-operator alone.
Assumption 4.
The model only takes into account a single product manufactured by the supplier, both the supplier and e-commerce platform self-operator are risk neutral, and the information regarding the supply chain is open and free from deception.
Based on the aforementioned assumptions, all parameters and descriptions in this paper are shown in Table 2, the profits of the supplier, e-commerce platform self-operator, and supply-chain system are as follows, respectively:
Π m = ( w c ) ( a b p + β t + θ e ) 1 2 γ t 2 .
Π r = ( p w ) ( a b p + β t + θ e ) 1 2 k e 2 .
Π c = ( p c ) ( a b p + β t + θ e ) 1 2 γ t 2 1 2 k e 2 .

4. Supply-Chain Model Analysis

This section mainly describes the profit relationship of the supply-chain decision-making model under different power structures and compares the correlation coefficient and profit. In the following discussion, we always assume that the following conditions are always satisfied: (A1) 2 b γ β 2 > 0 ; (A2) k β 2 + γ θ 2 2 b k γ < 0 ; (A3) 2 k b θ 2 > 0 ; (A4) 4 k b 2 γ 2 β 2 > 0 ; and (A5) k γ θ 2 > 0 .

4.1. Centralized Decision-Making Model

In the centralized decision-making model, the supplier and the e-commerce platform self-operator make unified decisions, collaboratively determining product prices, product quality level, and marketing efforts level to maximize the overall benefit of the supply chain. To convenience the discussion, in the present study, the centralized decision model is abbreviated as the C model. In the C model, the profit of this model system is as follows:
Π c ( C ) = ( p ( C ) c ) ( a b p ( C ) + β t ( C ) + θ e ( C ) ) 1 2 γ t ( C ) 2 1 2 k e ( C ) 2 .
The first-order derivatives of Π c ( C ) with respect to p ( C ) , t ( C ) , and e ( C ) are as follows:
Π c ( C ) p ( C ) = a + β t ( C ) + θ e ( C ) b p ( C ) + b ( c p ( C ) ) .
Π c ( C ) t ( C ) = β ( c p ( C ) ) γ t ( C ) .
Π c ( C ) e ( C ) = k e ( C ) θ ( c p ( C ) ) .
The Hessian matrix of Π c ( C ) with respect to p ( C ) , t ( C ) , and e ( C ) can be derived as follows:
H 1 = 2 b β θ β γ 0 θ 0 k .
The first-order principal minor of H 1 is 2 b , the second-order principal minor of H 1 is 2 b γ β 2 , the third-order master principal minor of H 1 is k β 2 + γ θ 2 2 b k γ . Then, under the conditions (A1) and (A2), H 1 is a negative definite matrix. Π c ( C ) can reach maximum for p ( C ) , t ( C ) , and e ( C ) , which are the solutions of Equations Π c ( C ) p ( C ) = 0 , Π c ( C ) t ( C ) = 0 , and Π c ( C ) e ( C ) = 0 . We obtain the solutions for p ( C ) * , t ( C ) * , and e ( C ) * as follows:
p ( C ) * = a k γ + [ ( b k θ 2 ) γ k β 2 ] c ( 2 b k θ 2 ) γ k β 2 .
t ( C ) * = β k ( a b c ) ( 2 b k θ 2 ) γ k β 2 .
e ( C ) * = θ γ ( a b c ) ( 2 b k θ 2 ) γ k β 2 .
Then, when the sales price is p ( C ) * , the product quality in level t ( C ) * , and the marketing effort level is e ( C ) * , the supply-chain profit reaches a maximum and the total profit of the supply chain is as follows:
Π c ( C ) * = k γ ( a b c ) 2 2 [ ( 2 b k θ 2 ) γ k β 2 ] .

4.2. Decentralized Decision-Making Model Dominated by the Supplier

In the supplier-decentralized decision-making model (briefly, S model), the supplier first sets the wholesale price and product quality level to maximize their profits. Following this, e-commerce platform self-operator, taking into account the supplier’s wholesale price, aims to maximize their own profits by determining the consumer sales price and the level of their marketing efforts. The following are the profits of supplier, e-commerce platform self-operator, and supply-chain system:
Π m ( S ) = ( w ( S ) c ) ( a b p ( S ) + β t ( S ) + θ e ( S ) ) 1 2 γ t ( S ) 2 .
Π r ( S ) = ( p ( S ) w ( S ) ) ( a b p ( S ) + β t ( S ) + θ e ( S ) ) 1 2 k e ( S ) 2 .
Π c ( S ) = ( p ( S ) c ) ( a b p ( S ) + β t ( S ) + θ e ( S ) ) 1 2 γ t ( S ) 2 1 2 k e ( S ) 2 .
According to the reverse solution method, the first-order derivatives of Π r ( S ) with respect to p ( S ) and e ( S ) are as follows:
Π r ( S ) p ( S ) = a + β t ( S ) + θ e ( S ) 2 b p ( S ) + b w ( S ) .
Π r ( S ) e ( S ) = θ ( p ( S ) w ( S ) ) k e ( S ) .
The Hessian matrix of Π r ( S ) with respect to p ( S ) and e ( S ) is
H 2 = 2 b θ θ k .
Easily, under this condition (A3), H 2 is a negative definite matrix, and then Π r ( S ) can reach a maximum for p ( S ) and e ( S ) , which are the solutions of Equations Π r ( S ) p ( S ) = 0 and Π r ( S ) e ( S ) = 0 . Hence, we can obtain:
p ( S ) = w ( S ) θ 2 + a k + β k t ( S ) + b k w ( S ) 2 b k θ 2 .
e ( S ) = θ ( a + β t ( S ) b w ( S ) ) 2 b k θ 2 .
Substituting Equations (17) and (18) into the supplier’s profit function Π m ( S ) , the Hessian matrix of Π m ( S ) with respect to w ( S ) and t ( S ) is as follows:
H 3 = 2 b 2 k 2 b k     θ 2 β b k 2 b k     θ 2 β b k 2 b k     θ 2 γ .
Under this condition (A4), H 3 is a negative definite matrix, and then Π m ( S ) has an optimal solution for w ( S ) and t ( S ) , which are the solutions of Equations Π m ( S ) w ( S ) = 0 and Π m ( S ) t ( S ) = 0 , and we obtain the solutions for w ( S ) * and t ( S ) * as follows:
w ( S ) * = a γ ( 2 k b θ 2 ) + c b ( 2 k b γ k β 2 γ θ 2 ) b [ 2 γ ( 2 b k θ 2 ) k β 2 ] .
t ( S ) * = β k ( a b c ) 2 γ ( 2 b k θ 2 ) k β 2 .
By substituting w ( S ) * and t ( S ) * into Equations (17) and (18), we can determine the optimal sales price p ( S ) * and marketing effort level e ( S ) * :
p ( S ) * = a γ ( 3 b k θ 2 ) + c b [ ( b k θ 2 ) γ k β 2 ] b [ 2 γ ( 2 b k θ 2 ) k β 2 ] .
e ( S ) * = θ γ ( a b c ) 2 γ ( 2 b k θ 2 ) k β 2 .
Substituting w ( S ) * , t ( S ) * , p ( S ) * , and e ( S ) * into Equations (12)–(14), we can obtain the maximum profit for the supplier, e-commerce platform self-operator, and supply-chain system.
The supplier’s profit is
Π m ( S ) * = k γ ( a b c ) 2 2 [ 2 γ ( 2 b k θ 2 ) k β 2 ] ,
the e-commerce platform self-operator’s profit is
Π r ( S ) * = k γ 2 ( 2 k b θ 2 ) ( a b c ) 2 2 [ 2 γ ( 2 b k θ 2 ) k β 2 ] 2 ,
and the total profit of the supply chain system is
Π c ( S ) * = k γ ( a b c ) 2 [ 3 γ ( 2 b k θ 2 ) ] 2 [ 2 γ ( 2 b k θ 2 ) k β 2 ] 2 .

4.3. Decentralized Decision-Making Model Dominated by the E-Commerce Platform Self-Operator

In the decentralized decision-making model led by the e-commerce platform self-operator, the platform self-operator acts as a leader while the suppliers follow (briefly, E model). In this model, the e-commerce platform self-operator determine the sale price and the extent of their marketing efforts based on the principle of profit maximization. Subsequently, the supplier sets the wholesale price and product quality level, considering the price established by the e-commerce platform self-operator. Let p ( E ) = w ( E ) + x , where x stands for the e-commerce platform self-operator’s profit per unit product in the solving process. Then, the supplier’s profit, the e-commerce platform self-operator’s profit, and the supply-chain system’s profit are
Π m ( E ) = ( w ( E ) c ) [ a b ( w ( E ) + x ) + β t ( E ) + θ e ( E ) ] 1 2 γ t ( E ) 2 ,
Π r ( E ) = x [ a b ( w ( E ) + x ) + β t ( E ) + θ e ( E ) ] 1 2 k e ( E ) 2 ,
Π c ( E ) = ( w ( E ) + x c ) [ a b ( w ( E ) + x ) + β t ( E ) + θ e ( E ) ] 1 2 γ t ( E ) 2 1 2 k e ( E ) 2 .
According to the reverse solution method, the first-order derivatives of Π m ( E ) with respect to w ( E ) and t ( E ) are
Π m ( E ) w ( E ) = a b ( w ( E ) + x ) + β t ( E ) + θ e ( E ) + b ( c w ( E ) ) ,
Π m ( E ) t ( E ) = β ( c w ( E ) ) γ t ( E ) .
Thus, the Hessian matrix for Π m ( E ) with respect to w ( E ) and t ( E ) is
H 4 = 2 b β β γ .
Under this condition (A1), Π m ( E ) can reach a maximum for w ( E ) and t ( E ) , which are the solutions of Equations Π m ( E ) w ( E ) = 0 and Π m ( E ) t ( E ) = 0 . Then, we can determine
w ( E ) = c β 2 + a γ + θ e ( E ) γ + b c γ b γ x 2 b γ β 2 ,
t ( E ) = β ( a + θ e ( E ) b c b x ) 2 b γ β 2 .
Substituting Equations (31) and (32) into Π r ( E ) , we can easily obtain the Hessian matrix of Π r ( E ) with respect to x and e ( E ) :
H 5 = 2 b 2 γ 2 b γ     β 2 θ b γ 2 b γ     β 2 θ b γ 2 b γ     β 2 k .
Under the condition (A5), Π r ( E ) can reach a maximum for x and e ( T M ) , which are the solutions of Equations Π r ( E ) x = 0 and Π r ( E ) e ( E ) = 0 . Then, we can calculate:
x * = k ( 2 b γ β 2 ) ( a b c ) b ( 2 k β 2 + γ θ 2 4 b k γ ) ,
e ( E ) * = θ γ ( a b c ) 2 k ( 2 b γ β 2 ) γ θ 2 .
Substituting x * and e ( E ) * into Equations (31) and (32), we can obtain the optimal wholesale price w ( E ) * and product quality level t ( E ) * :
w ( E ) * = a k γ + [ ( 3 b k 2 β 2 ) γ γ θ 2 ] c 2 k ( 2 b γ β 2 ) γ θ 2 ,
t ( E ) * = β k ( a b c ) 2 k ( 2 b γ β 2 ) γ θ 2 .
Because p ( E ) * = w ( E ) * + x * , we can determine the sales price p ( E ) * :
p ( E ) * = a k ( 3 b γ β 2 ) + c b [ ( b k θ 2 ) γ k β 2 ] 2 k ( 2 b γ β 2 ) γ θ 2 .
By substituting w ( E ) * , t ( E ) * , p ( E ) * , and e ( E ) * into Equations (26)–(28), we can calculate the maximum profit for the supplier, e-commerce platform self-operator, and supply-chain system.
The supplier’s profit is
Π m ( E ) * = k 2 γ ( 2 b γ β 2 ) ( a b c ) 2 2 [ 2 k ( 2 b γ β 2 ) γ θ 2 ] 2 ,
the e-commerce platform self-operator’s profit is
Π r ( E ) * = k γ ( a b c ) 2 2 [ 2 k ( 2 b γ β 2 ) γ θ 2 ] 2 ,
and the total profit of the supply chain system is
Π c ( E ) * = k γ ( a b c ) 2 [ 3 k ( 2 b γ β 2 ) k β 2 ] 2 [ 2 k ( 2 b γ β 2 ) γ θ 2 ] 2 .

4.4. Comparison and Analysis of the Decision Models

This section compares the results of the calculations under the supply-chain model. In the following analysis, the following assumptions are always satisfied:
( B 1 )   ( 2 b k θ 2 ) γ k β 2 > 0 ,   ( B 2 )   2 k ( 2 b γ β 2 ) γ θ 2 > 0 ,   and   ( B 3 )   k ( 2 b γ β 2 ) + γ θ 2 > 0 .
Proposition 1.
Under the conditions (B1) and (B2), we can determine that  Π m ( S ) * > Π r ( S ) * , Π m ( E ) * < Π r ( E ) * . Π c ( C ) * > Π c ( S ) * , and Π c ( C ) * > Π c ( E ) * .
Proof of Proposition 1.
With assumptions, we can easily obtain the following:
Π c ( C ) * Π c ( S ) * = k 3 γ ( b k     θ 2 ) ( a     b c ) 2 [ 2 γ ( 2 b k     θ 2 )     k β 2 ] 2 [ ( 2 b k     θ 2 ) γ     k β 2 ] > 0 , Π c ( C ) * Π c ( E ) * = k γ 3 ( b k     θ 2 ) ( b k     β 2 ) ( a     b c ) 2 [ 2 k ( 2 b γ     β 2 )     γ θ 2 ] 2 [ ( 2 b k     θ 2 ) γ     k β 2 ] > 0 , Π m ( S ) * Π r ( S ) * = 2 γ ( 2 b k     θ 2 )     k β 2 γ ( 2 b k     θ 2 ) > 1 ,   Π m ( E ) * Π r ( E ) * = k ( 2 b γ     β 2 ) 2 k ( 2 b γ     β 2 )     γ θ 2 < 1 .
Thus, the proposition is proven. □
Remark 1.
Proposition 1 indicates that within a decentralized decision-making framework, the supplier’s profit is higher when the supplier assumes a leadership role, as opposed to when the e-commerce platform self-operator holds the leadership position. Furthermore, the supplier’s profit is higher than that of the e-commerce platform self-operator. Conversely, when the e-commerce platform self-operator is in a leadership position, the results are reversed. This illustrates that when the supplier occupies a leadership position, they can more effectively manage production, costs, and the supply chain. Consequently, they can sell products at higher prices and attain greater profits. On the other hand, when the e-commerce platform self-operator holds the leadership position, they can achieve higher sales and profits through a deeper understanding of market demand and by meeting consumer needs with precise positioning and innovative marketing strategies. Furthermore, the total profit of the supply-chain system is higher under centralized decision making compared to decentralized decision making. This implies that substantial room for improvement exists within decentralized decision making, primarily due to the impact of double marginalization.
Proposition 2.
Under the conditions (B1) and (B2), we can determine that e ( C ) * > e ( S ) * , e ( C ) * > e ( E ) * , e ( E ) * > e ( S ) * , t ( C ) * > t ( S ) * , t ( C ) * > t ( E ) * , and t ( E ) * > t ( S ) * .
Proof of Proposition 2.
With assumptions, we can easily determine the following:
e ( C ) * e ( S ) * = 2 γ ( 2 b k θ 2 ) k β 2 γ ( 2 b k θ 2 ) k β 2 > 1 ,
e ( C ) * e ( E ) * = θ γ ( a b c ) ( k β 2 2 b k γ ) [ 2 k ( 2 b γ β 2 ) γ θ 2 ] [ γ ( 2 b k θ 2 ) k β 2 ] > 0 ,
e ( S ) * e ( E ) * = θ γ ( a b c ) ( k β 2 γ θ 2 ) [ 2 k ( 2 b γ β 2 ) γ θ 2 ] [ γ ( 2 b k θ 2 ) k β 2 ] < 0 ,
t ( C ) * t ( S ) * = 2 γ ( 2 b k θ 2 ) k β 2 γ ( 2 b k θ 2 ) k β 2 > 1 ,
t ( C ) * t ( E ) * = β k ( a b c ) ( k β 2 2 b k γ ) [ 2 k ( 2 b γ β 2 ) γ θ 2 ] [ γ ( 2 b k θ 2 ) k β 2 ] > 0 ,
t ( S ) * t ( E ) * = β k ( a b c ) ( k β 2 γ θ 2 ) [ 2 k ( 2 b γ β 2 ) γ θ 2 ] [ γ ( 2 b k θ 2 ) k β 2 ] < 0 .
Thus, the proposition is proven. □
Remark 2.
Proposition 2 indicates that the e-commerce platform self-operator’s marketing efforts are maximized under centralized decision making. Furthermore, when the e-commerce platform self-operator assumes a leadership role, the level of marketing efforts surpasses that observed when the supplier holds the leadership position. Moreover, the manufacturer’s product quality reaches its peak under centralized decision making.
Proposition 3.
Under the conditions (B1) and (B3), we can determine that Π c ( C ) * β > 0 , t ( C ) * β > 0 , Π m ( S ) * β > 0 , Π r ( S ) * β , Π c ( S ) * β , t ( S ) * β > 0 , Π m ( E ) * β > 0 , Π r ( E ) * β , Π c ( E ) * β , and t ( E ) * β > 0 .
Proof of Proposition 3.
With assumptions, we can easily calculate the following:
Π c ( C ) * β = β k 2 γ ( a b c ) 2 [ γ ( 2 k b θ 2 ) k β 2 ] 2 > 0 ,   t ( C ) * β = 2 β k 2 γ ( a b c ) [ γ ( 2 k b θ 2 ) k β 2 ] 2 > 0 ,
Π m ( S ) * β = β k 2 γ ( a b c ) 2 [ 2 γ ( 2 k b θ 2 ) k β 2 ] 2 > 0 ,
Π r ( S ) * β = 2 β k 2 γ 2 ( 2 b k θ 2 ) ( a b c ) 2 [ 2 γ ( 2 k b θ 2 ) k β 2 ] 3 > 0 ,
Π c ( S ) * β = β k 2 γ ( a b c ) 2 [ 4 γ ( 2 k b θ 2 ) k β 2 ] [ 2 γ ( 2 k b θ 2 ) k β 2 ] 3 > 0
t ( S ) * β = k ( a b c ) [ 2 γ ( 2 k b θ 2 ) + k β 2 ] [ 2 γ ( 2 k b θ 2 ) k β 2 ] 2 > 0 ,
Π m ( E ) * β = β k 2 γ ( a b c ) 2 [ 2 k ( 2 b γ β 2 ) + γ θ 2 ] [ 2 k ( 2 b γ β 2 ) γ θ 2 ] 3 > 0 ,
Π r ( E ) * β = 2 β k 2 γ 2 ( 2 b k θ 2 ) ( a b c ) 2 [ 2 γ ( 2 k b θ 2 ) k β 2 ] 3 > 0 ,
Π c ( E ) * β = β k 2 γ ( a b c ) 2 [ 6 k ( 2 b γ β 2 ) + γ θ 2 ] [ 2 k ( 2 b γ β 2 ) γ θ 2 ] 3 > 0 ,
t ( E ) * β = k ( a b c ) [ 2 k ( 2 b γ + β 2 ) γ θ 2 ] [ 2 k ( 2 b γ β 2 ) γ θ 2 ] 2 > 0 .
Thus, the proposition is proven. □
Remark 3.
Proposition 3 indicates that the total profit of the supply chain within a centralized decision-making model is directly proportional to the sensitivity coefficient of the product quality level. Furthermore, under various leadership scenarios, the profit of each member within a decentralized decision-making supply chain is also directly proportional to the sensitivity coefficient of product quality level. Moreover, the product quality level itself is directly proportional to this sensitivity coefficient, signifying that the sensitivity coefficient of product quality level will impact the profit outcomes for each decision within the supply chain.
Proposition 4.
Under the conditions (B1) and (B3), we can determine that Π c ( C ) * θ > 0 , e ( C ) * θ > 0 , Π m ( S ) * θ , Π r ( S ) * θ > 0 , Π c ( S ) * θ , e ( S ) * θ > 0 , Π m ( E ) * θ , Π r ( E ) * θ > 0 , and Π c ( E ) * θ , e ( E ) * θ > 0 .
Proof of Proposition 4.
With assumptions, we can easily calculate the following:
Π c ( C C ) * θ = θ k γ 2 ( a b c ) 2 [ γ ( 2 k b θ 2 ) k β 2 ] 2 > 0 , e ( C C ) * θ = γ ( a b c ) [ k ( 2 b γ β 2 ) + γ θ 2 ] [ γ ( 2 k b θ 2 ) k β 2 ] 2 > 0 ,
Π m ( S ) * θ = 2 θ k γ 2 ( a b c ) 2 [ 2 γ ( 2 k b θ 2 ) k β 2 ] 2 > 0 ,
Π r ( S ) * θ = θ k γ 2 ( a b c ) 2 [ 2 γ ( 2 k b θ 2 ) + k β 2 ] [ 2 γ ( 2 k b θ 2 ) k β 2 ] 3 > 0 ,
Π c ( S ) * θ = θ k γ 2 ( a b c ) 2 [ 6 γ ( 2 b k θ 2 ) + k β 2 ] [ 2 γ ( 2 k b θ 2 ) k β 2 ] 3 > 0 ,
e ( S ) * θ = γ ( a b c ) [ 2 γ ( 2 k b + θ 2 ) k β 2 ] [ 2 γ ( 2 k b θ 2 ) k β 2 ] 2 > 0 ,
Π m ( E ) * θ = 2 θ k 2 γ 2 ( 2 b γ β 2 ) ( a b c ) 2 [ 2 k ( 2 b γ β 2 ) γ θ 2 ] 3 > 0 ,
Π r ( E ) * θ = θ k γ 2 ( a b c ) 2 [ 2 k ( 2 b γ β 2 ) γ θ 2 ] 2 > 0 ,
Π c ( E ) * θ = θ k γ 2 ( a b c ) 2 [ 4 k ( 2 b γ β 2 ) + γ θ 2 ] [ 2 k ( 2 b γ β 2 ) γ θ 2 ] 3 > 0 ,
e ( S ) * θ = γ ( a b c ) [ 2 k ( 2 b γ β 2 ) + γ θ 2 ] [ 2 k ( 2 b γ β 2 ) γ θ 2 ] 2 > 0 .
Thus, the proposition is proven. □
Remark 4.
Proposition 4 indicates that within a centralized decision-making model, the overall profit of the supply-chain system is directly proportional to the sensitivity coefficient of the marketing efforts exerted by the e-commerce platform’s self-operator. In various decision-making scenarios, the profit of each supplier is directly proportional to the level of marketing efforts, which, in turn, is directly proportional to the sensitivity coefficient of those efforts. This indicates that enhanced marketing efforts will elevate supply-chain profits, thereby positively influencing the overall supply chain.

5. Supply-Chain Coordination Contract Model

To enhance product quality, the supplier has augmented their investment in equipment, thereby encouraging the e-commerce platform self-operator to market these products and cultivate a strong reputation. The e-commerce platform self-operator helps alleviate the supplier’s pressure to ensure product quality by conducting quality monitoring, performing random inspections, and offering traceability services. This approach satisfies customer demands for high-quality products, ensuring both the market demand for goods and the order volume from the e-commerce platform self-operator to the supplier. Consequently, the e-commerce platform self-operator is willing to increase their investment in quality control for the supplier.

5.1. “Cost-Sharing + Compensation Contract” Model

Based on the above analysis, this paper proposes a model of “cost-sharing + compensation contract”, which is abbreviated as the CS model, in order to facilitate the comparison and analysis of the article. The model of the design is as follows: the supplier offers a lower wholesale price w to the e-commerce platform self-operator to encourages them to place orders. To motivate the supplier to improve product quality, the e-commerce platform self-operator shares a proportion φ of the product quality costs with the supplier and provides a fixed compensation G to the supplier at the end of the sales cycle. Under the CS model, the profit functions of supplier, e-commerce platform self-operator, and supply-chain systems are as follows:
Π m ( C S ) = ( w ( C S ) c ) ( a b p ( C S ) + β t ( C S ) + θ e ( C S ) ) 1 2 ( 1 φ ) γ t ( C S ) 2 + G ,
Π r ( C S ) = ( p ( C S ) w ( C S ) ) ( a b p ( C S ) + β t ( C S ) + θ e ( C S ) ) 1 2 k e ( C S ) 2 1 2 φ γ t ( C S ) 2 G ,
Π c ( C S ) = ( p ( C S ) c ) ( a b p ( C S ) + β t ( C S ) + θ e ( C S ) ) 1 2 γ t ( C S ) 2 1 2 k e ( C S ) 2 .
The first-order derivatives of Π r ( C S ) with respect to p ( C S ) and e ( C S ) are as follows:
Π r ( C S ) p ( C S ) = a + β t ( C S ) + θ e ( C S ) b p ( C S ) b ( p ( C S ) w ) ,
Π r ( C S ) e ( C S ) = θ ( p ( C S ) w ( C S ) ) k e .
The Hessian matrix of Π r ( C S ) with respect to p ( C S ) and e ( C S ) is as follows:
H 6 = 2 b θ θ k .
Obviously, H 6 is a negative definite matrix, under which Π r ( C S ) can reach a maximum for p ( C S ) and e ( C S ) , which are the solutions of Equations Π r ( C S ) p ( C S ) = 0 and Π r ( C S ) e ( C S ) = 0 . Then, we can calculate the following:
p ( C S ) = w ( C S ) θ 2 + a k + β k t ( C S ) + b k w ( C S ) 2 b k θ 2 ,
e ( C S ) = θ ( a + β t ( C S ) b w ( C S ) ) 2 b k θ 2 .
Substituting Equations (46) and (47) into Π m ( C S ) yields: 2 Π m ( C S ) t ( C S ) 2 < 0 . Π m ( C S ) has an optimal solution. By letting Π m ( C S ) t ( C S ) = 0 , we can obtain
t ( C S ) * = β b k ( c w ) γ ( 2 b k θ 2 ) ( φ 1 ) .
Substituting t ( C S ) * into Equations (46) and (47) yields the following:
p ( C S ) * = a k θ 2 w ( C S ) + b k w ( C S ) + β 2 b k 2 ( c w ( C S ) ) / γ ( 2 b k θ 2 ) ( φ 1 ) 2 b k θ 2 .
e ( C S ) * = θ a b w ( C S ) + β 2 b k ( c w ( C S ) ) / γ ( 2 b k θ 2 ) ( φ 1 ) 2 b k θ 2 .
When the supplier first determines the level of product quality and the e-commerce platform self-operator determines the selling price of the product and the level of marketing efforts, then the profit of each member of the supply chain reaches its maximum.
In the CS model, for the supply chain to be coordinated, p ( C S ) * = p ( C ) * and t ( C S ) * = t ( C ) * should be satisfied; that is, the sales price and product quality level of the harmonized contract are equal to the sales price and product quality level under centralized decision making. At this point, the total profit of the supply chain is equal to that profit. According to Equations (8), (9), (48) and (49), we can calculate the following:
w ( C S ) * = p ( C ) * θ 2 + a k + β k t ( C ) * 2 b k p ( C ) * b k θ 2 ,
φ = θ 4 γ t ( C ) * + β a b k 2 + β b 2 c k 2 2 β b 2 k 2 p ( C ) * + β 2 b k 2 t ( C ) * + 2 b 2 k 2 γ t ( C ) * β θ 2 b c k + β θ 2 b k p ( C ) * 3 θ 2 b k γ t ( C ) * γ t ( C ) * θ 4 3 θ 2 b k + 2 b 2 k 2 .
By substituting the above decision variables into each profit function, the profits of supplier, the e-commerce platform self-operator, and the overall supply-chain system can be obtained.

5.2. Coordination of Supply-Chain Contracts and Pareto Improvement

Under the CS model, if the profits of the supplier and e-commerce platform self-operator are improved compared with those before harmonization, it means that the contract has achieved Pareto improvement, which is conducive to the acceptance of the contract by all members of the supply chain. To ensure that both the supplier and the e-commerce platform self-operator are willing to accept the contract, the following conditions need to be satisfied: Π m ( C S ) * > Π m ( S ) * and Π r ( C S ) * > Π r ( S ) * . Therefore, it can be found that in the cost-sharing subsidy contract model, the minimum value G that the e-commerce platform self-operator needs to subsidize the supplier for can be obtained and expressed as follows:
G = A 1 + A 2 + 2 Π m ( S ) * θ 6 + A 3 + 10 Π m ( S ) * θ 2 b 2 k 2 + A 4 + A 5 4 Π m ( S ) * b 3 k 3 2 ( b k θ 2 ) 2 ( 2 b k θ 2 ) .
Here,
A 1 = 3 β 2 θ 2 b k 2 t ( C ) * 2 5 β 2 b 2 k 3 t ( C ) * 2 + 3 β θ 4 b k p ( C ) * t ( C ) * 3 c β θ 4 b k t ( C ) * + 5 β θ 2 a b k 2 t ( C ) * , A 2 = 13 β θ 2 b 2 k 2 p ( C ) * t ( C ) * + 8 c β θ 2 b 2 k 2 t ( C ) * 9 β a b 2 k 3 t ( C ) * + 14 β b 3 k 3 p ( C ) * t ( C ) * 5 c β b 3 k 3 t ( C ) * , A 3 = 2 θ 4 a b k p ( C ) * 2 c θ 4 a b k 2 θ 4 b 2 k p ( C ) * 2 + 2 c θ 4 b 2 k p ( C ) * , A 4 = 2 θ 2 a 2 b k 2 10 θ 2 a b 2 k 2 p ( C ) * + 6 c θ 2 a b 2 k 2 + 8 θ 2 b 3 k 2 p ( C ) * 2 6 c θ 2 b 3 k 2 p ( C ) * , A 5 = 4 a 2 b 2 k 3 + 12 a b 3 k 3 p ( C ) * 4 c a b 3 k 3 8 b 4 k 3 p ( C ) * 2 + 4 c b 4 k 3 p ( C ) * .
Under the above conditions, the “cost-sharing + compensation contract” can guarantee that the profits of all supply-chain members are improved and the total profit of the supply chain is optimal, which means that the contract can achieve Pareto improvement of the supply chain.

6. Case Analysis

From the above analysis, we can know that product quality and marketing efforts can be subjectively perceived by consumers and can be quantified, which is mainly reflected in the growth of market demand and the increase in profits for each member of the supply-chain system. Therefore, in order to further verify the rationality and feasibility of contract coordination and quantify product quality and marketing efforts, this section makes some assumptions and assignments for the parameters in the model based on the known constraints. The parameters in the model refer to Zhu [69], as shown in Table 3.

6.1. Comparison of Supply-Chain Performance between the Three Modes

The decision-making outcomes are displayed in Table 4 after the aforementioned parameters are entered into the contract, decentralized, and centralized decision-making models. After simulation, the following results can be obtained.
From the above table, the following conclusions can be drawn:
In decentralized decision making, the overall benefits of the entire supply chain decline due to the existence of bilateral effects. In a centralized decision-making model, the supplier and e-commerce platform self-operator collaborate to make joint decisions, aiming to optimize the entire supply-chain system. The outcome of this collaborative decision making is the maximization of both the quality of the supplier’s products and the marketing efforts of the e-commerce platform self-operator, coupled with the reduction in retail and wholesale prices to their minimum levels. By minimizing supply-chain losses, significantly boosting market demand, and optimizing the total profit of the supply chain, this approach ensures maximum efficiency and effectiveness.
In the decentralized decision-making process led by the supplier, the e-commerce platform self-operator initially determines the retail price and marketing effort level. Subsequently, the supplier sets the wholesale price and product quality level. Therefore, in this decision-making model, the supplier optimizes their profit by increasing the wholesale price. In the decentralized decision-making model led by the e-commerce platform self-operator, the supplier reduces the wholesale price, while the self-operator enhances their marketing efforts to maximize both the retail price and overall profit. Both decision-making models achieve optimal profit by setting high wholesale and retail prices. This approach, however, leads to increased consumer prices, lower product quality-control levels, reduced market demand, and suboptimal overall profit for the entire supply-chain system.
Upon adopting a coordination contract involving cost sharing and compensation, there is a significant improvement in the product quality levels of the supplier and the marketing efforts of e-commerce platform self-operator, leading to an increase in market demand. Through the observation table, it is evident that the profits of supplier, e-commerce platform self-operator, and supply-chain systems under coordinated decision making are higher than those under decentralized decision making. The system profit reaches the level of centralized decision making, achieving optimal system profit and the optimal Pareto efficiency. The comparison of the values from various decision-making models in the table further substantiates the necessity of coordinating contracts to optimize the profits of the entire supply-chain system.

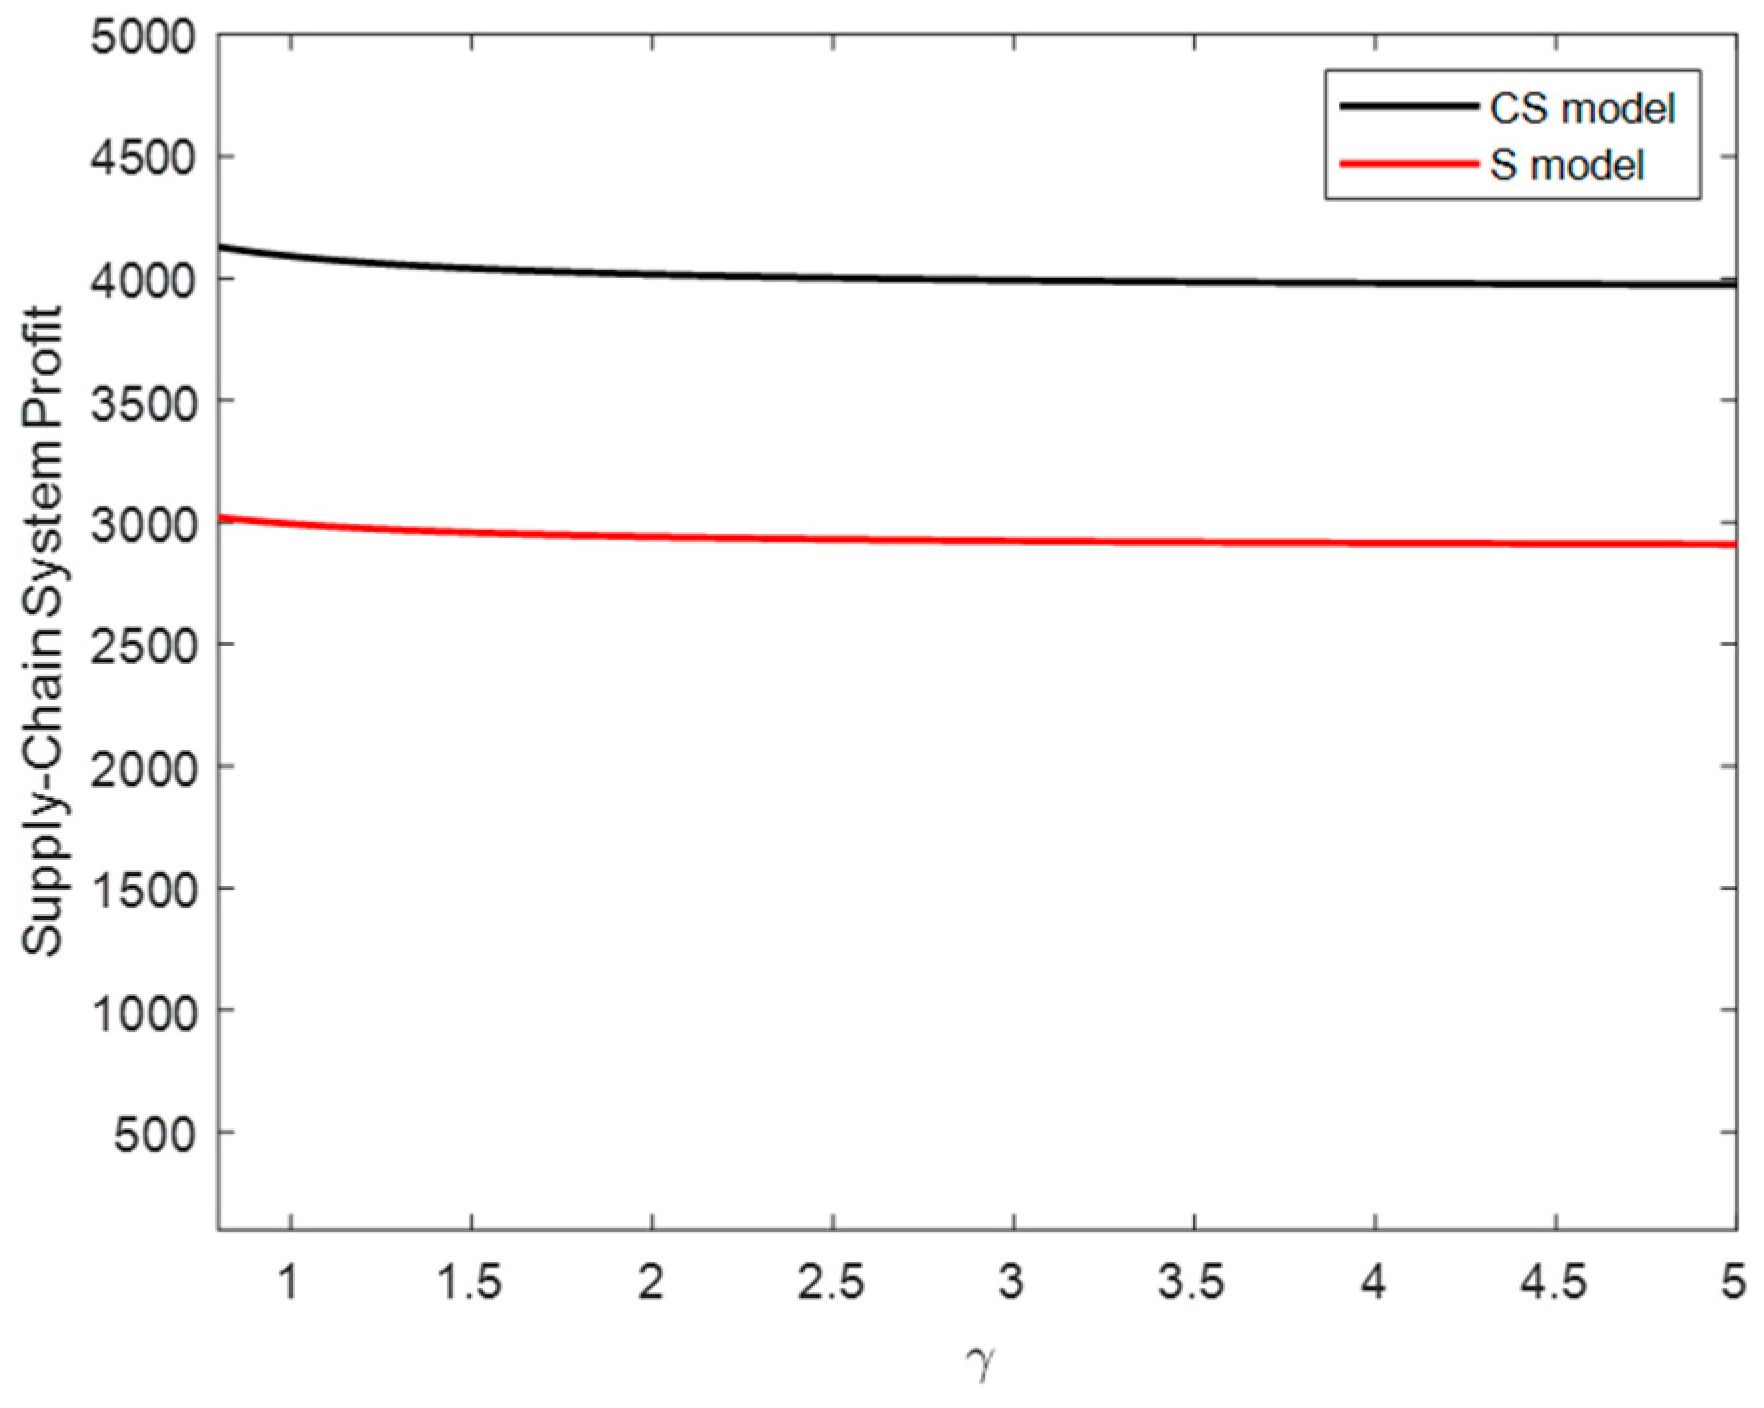
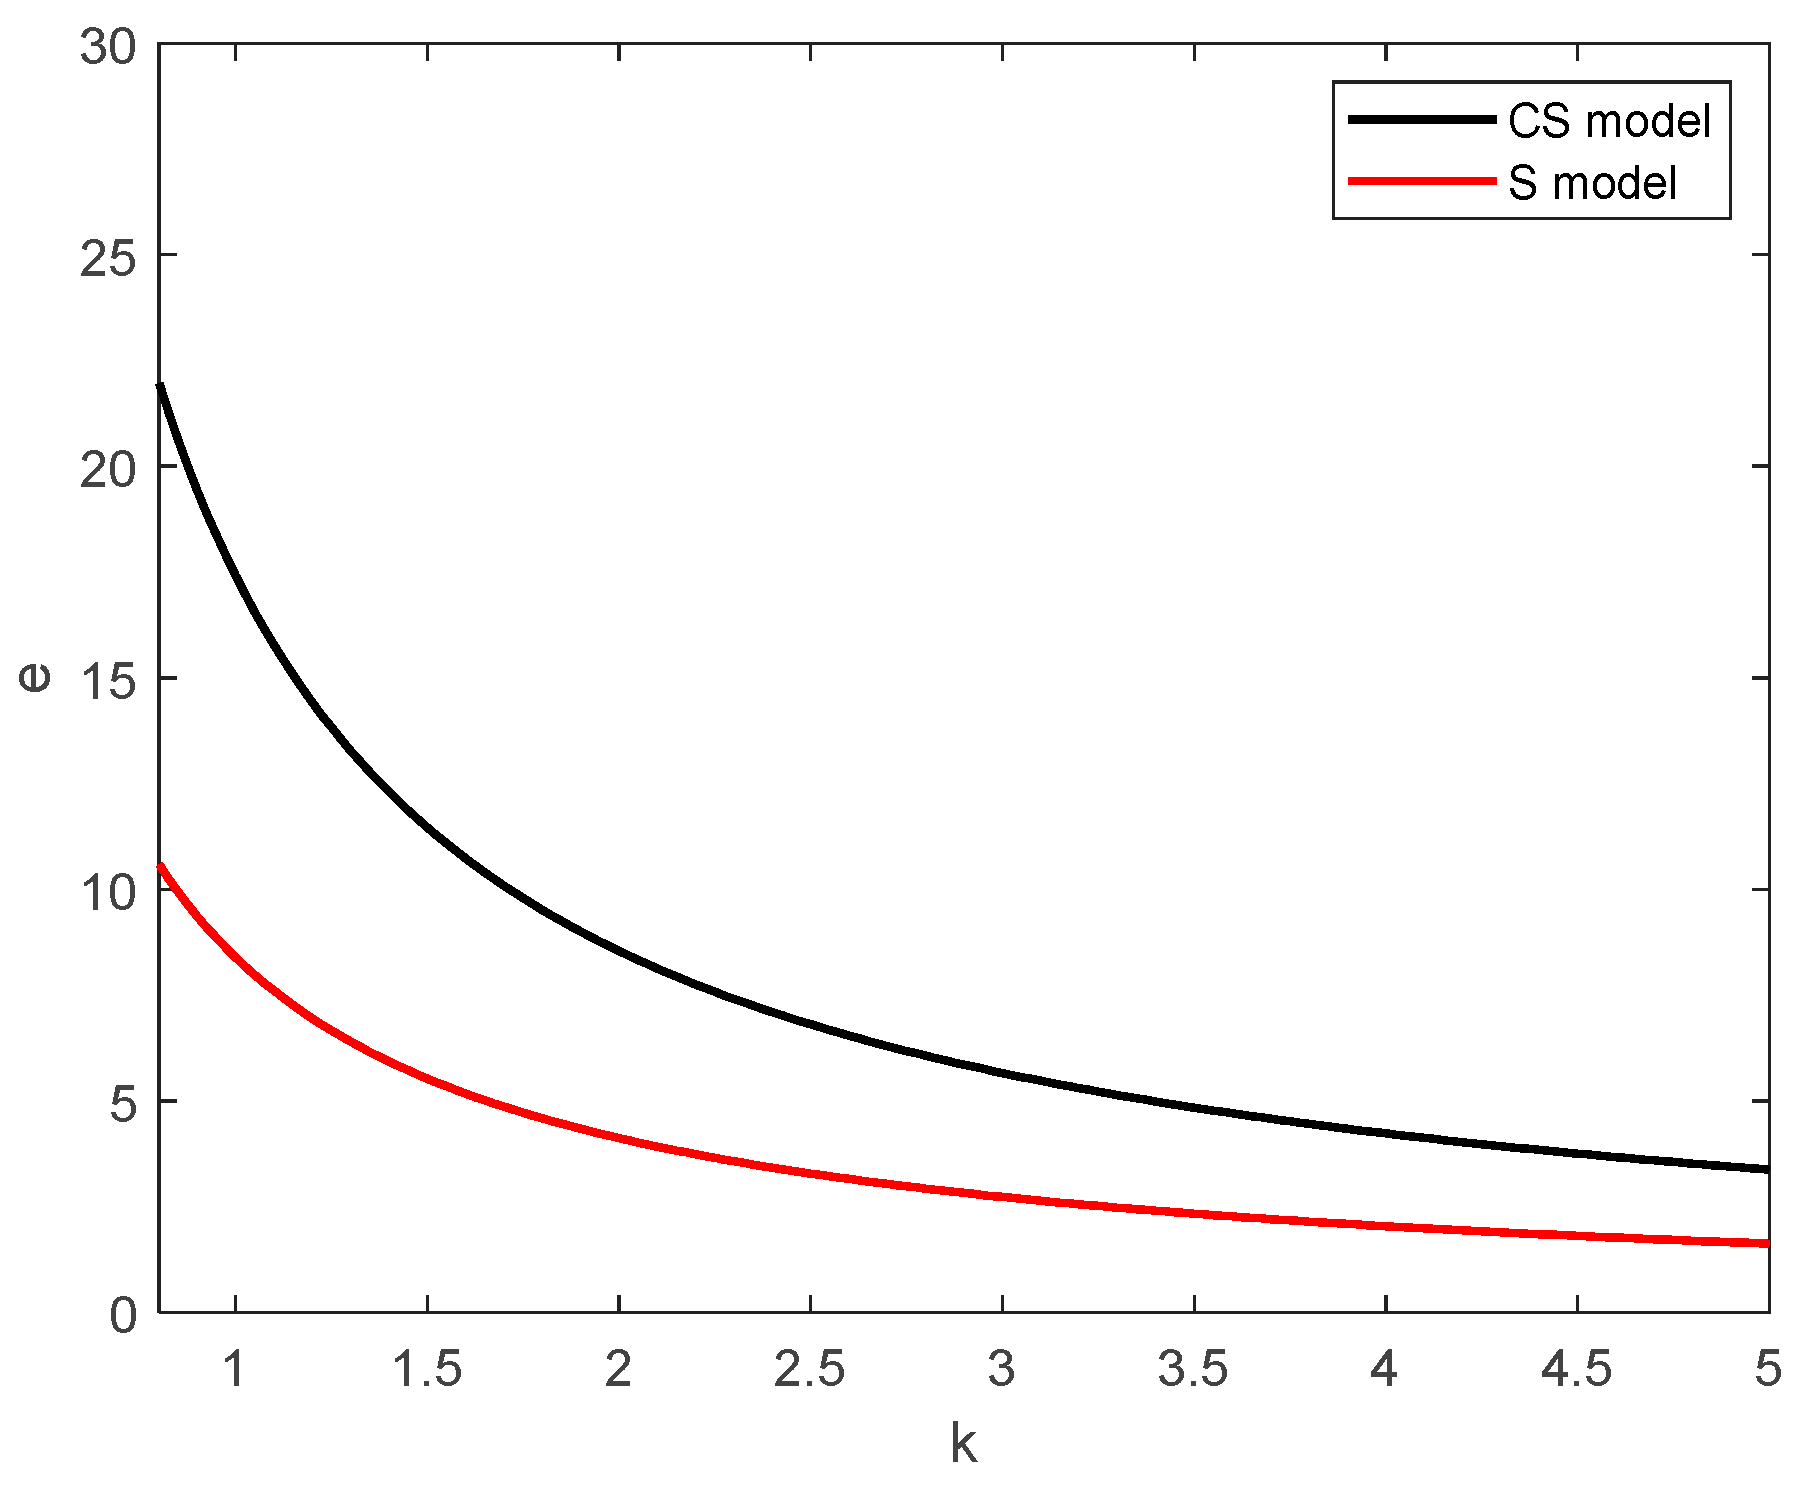
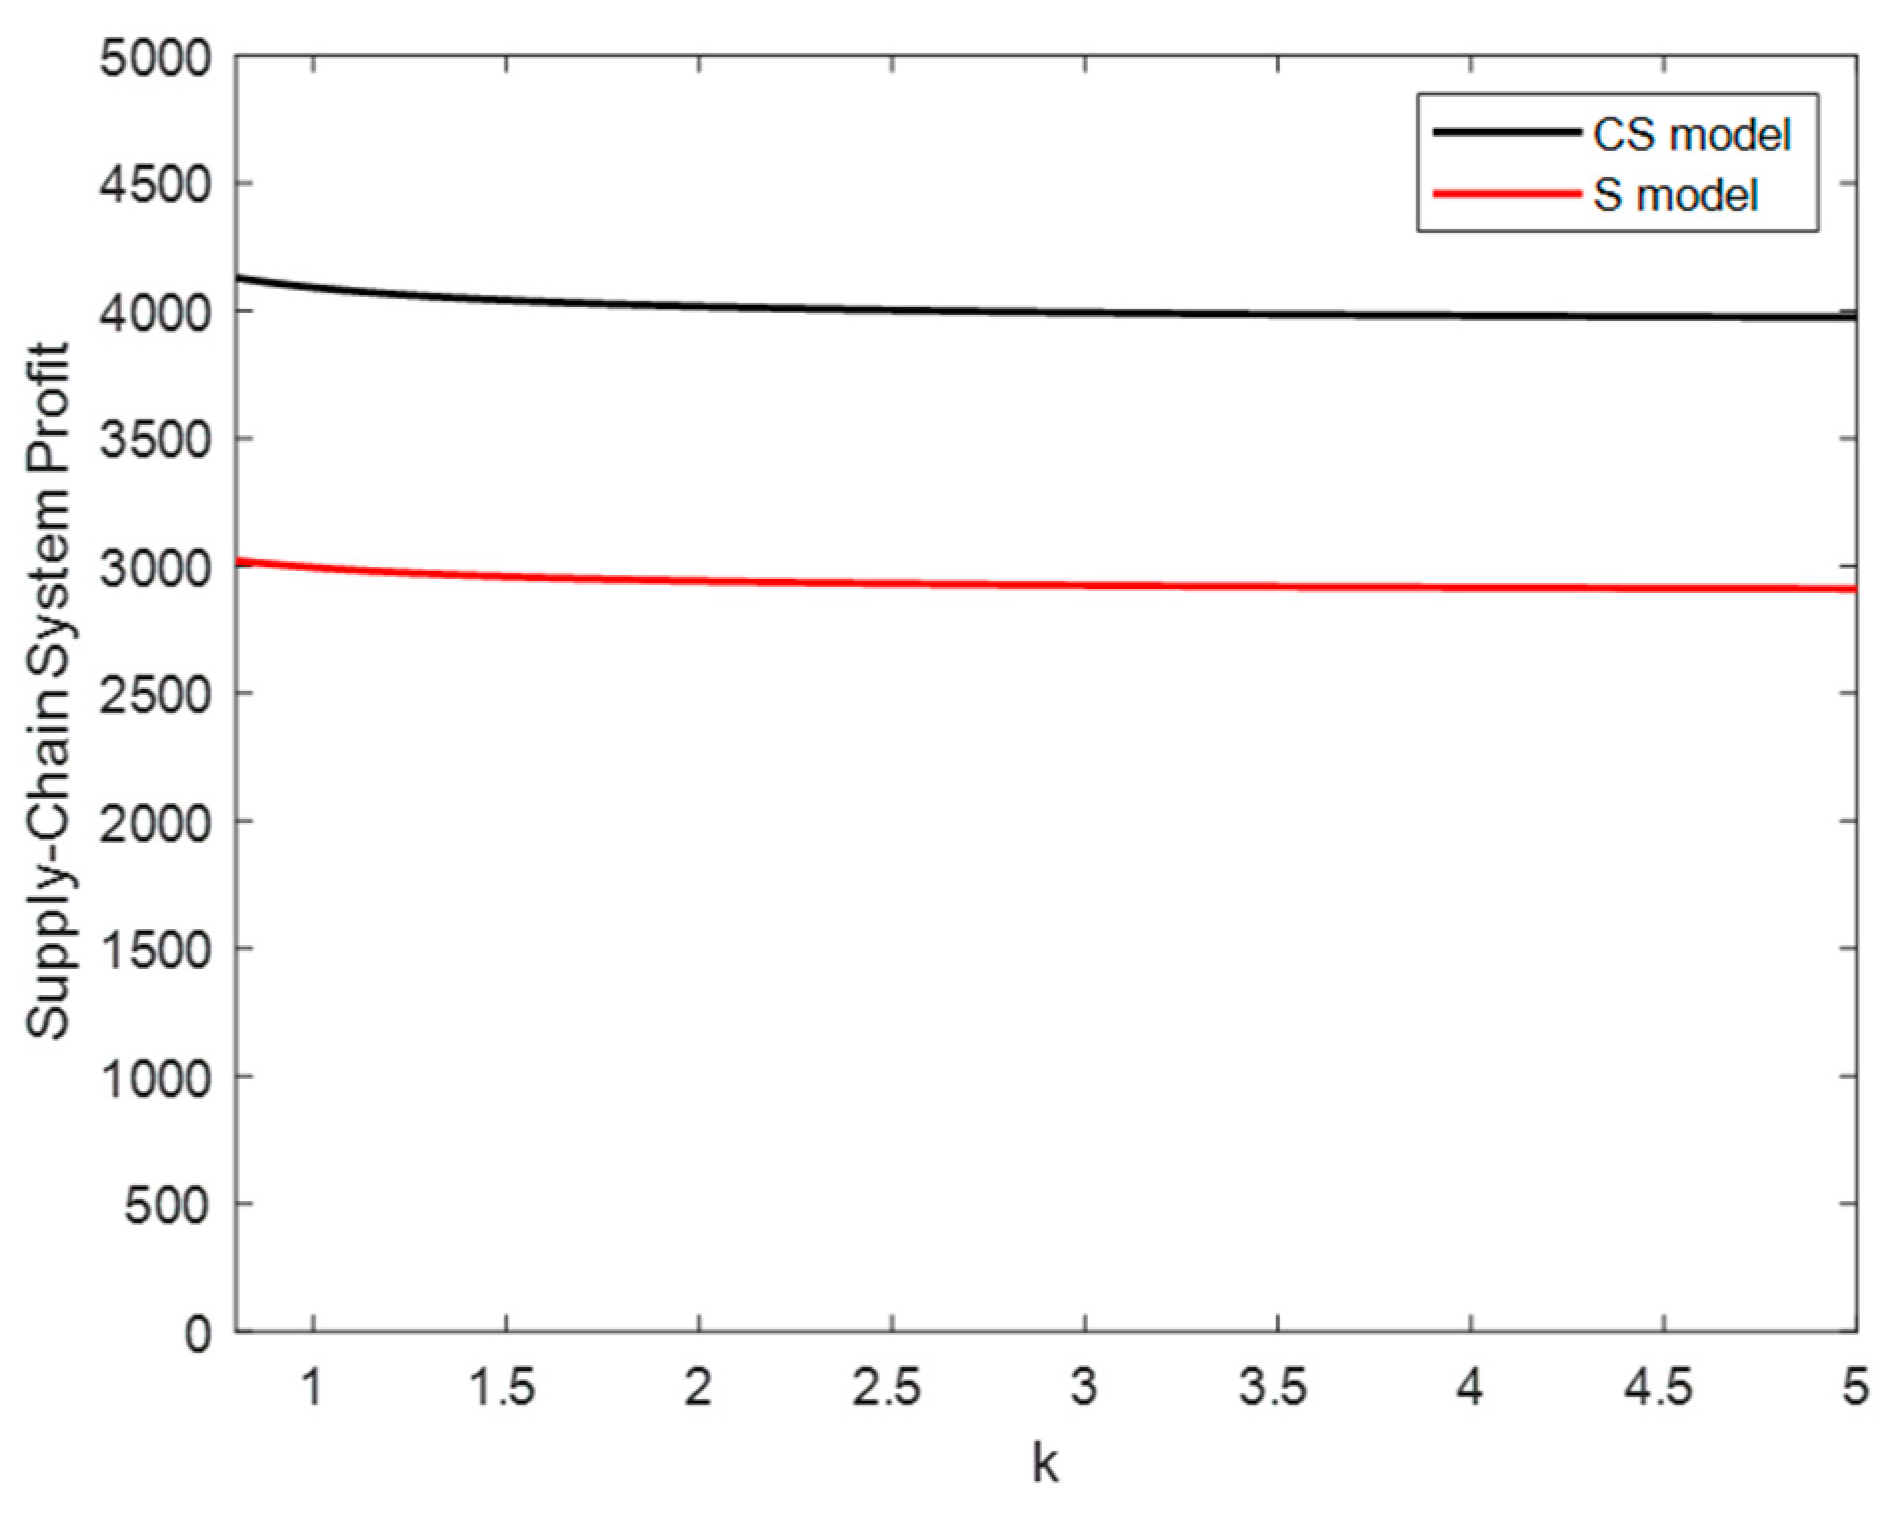
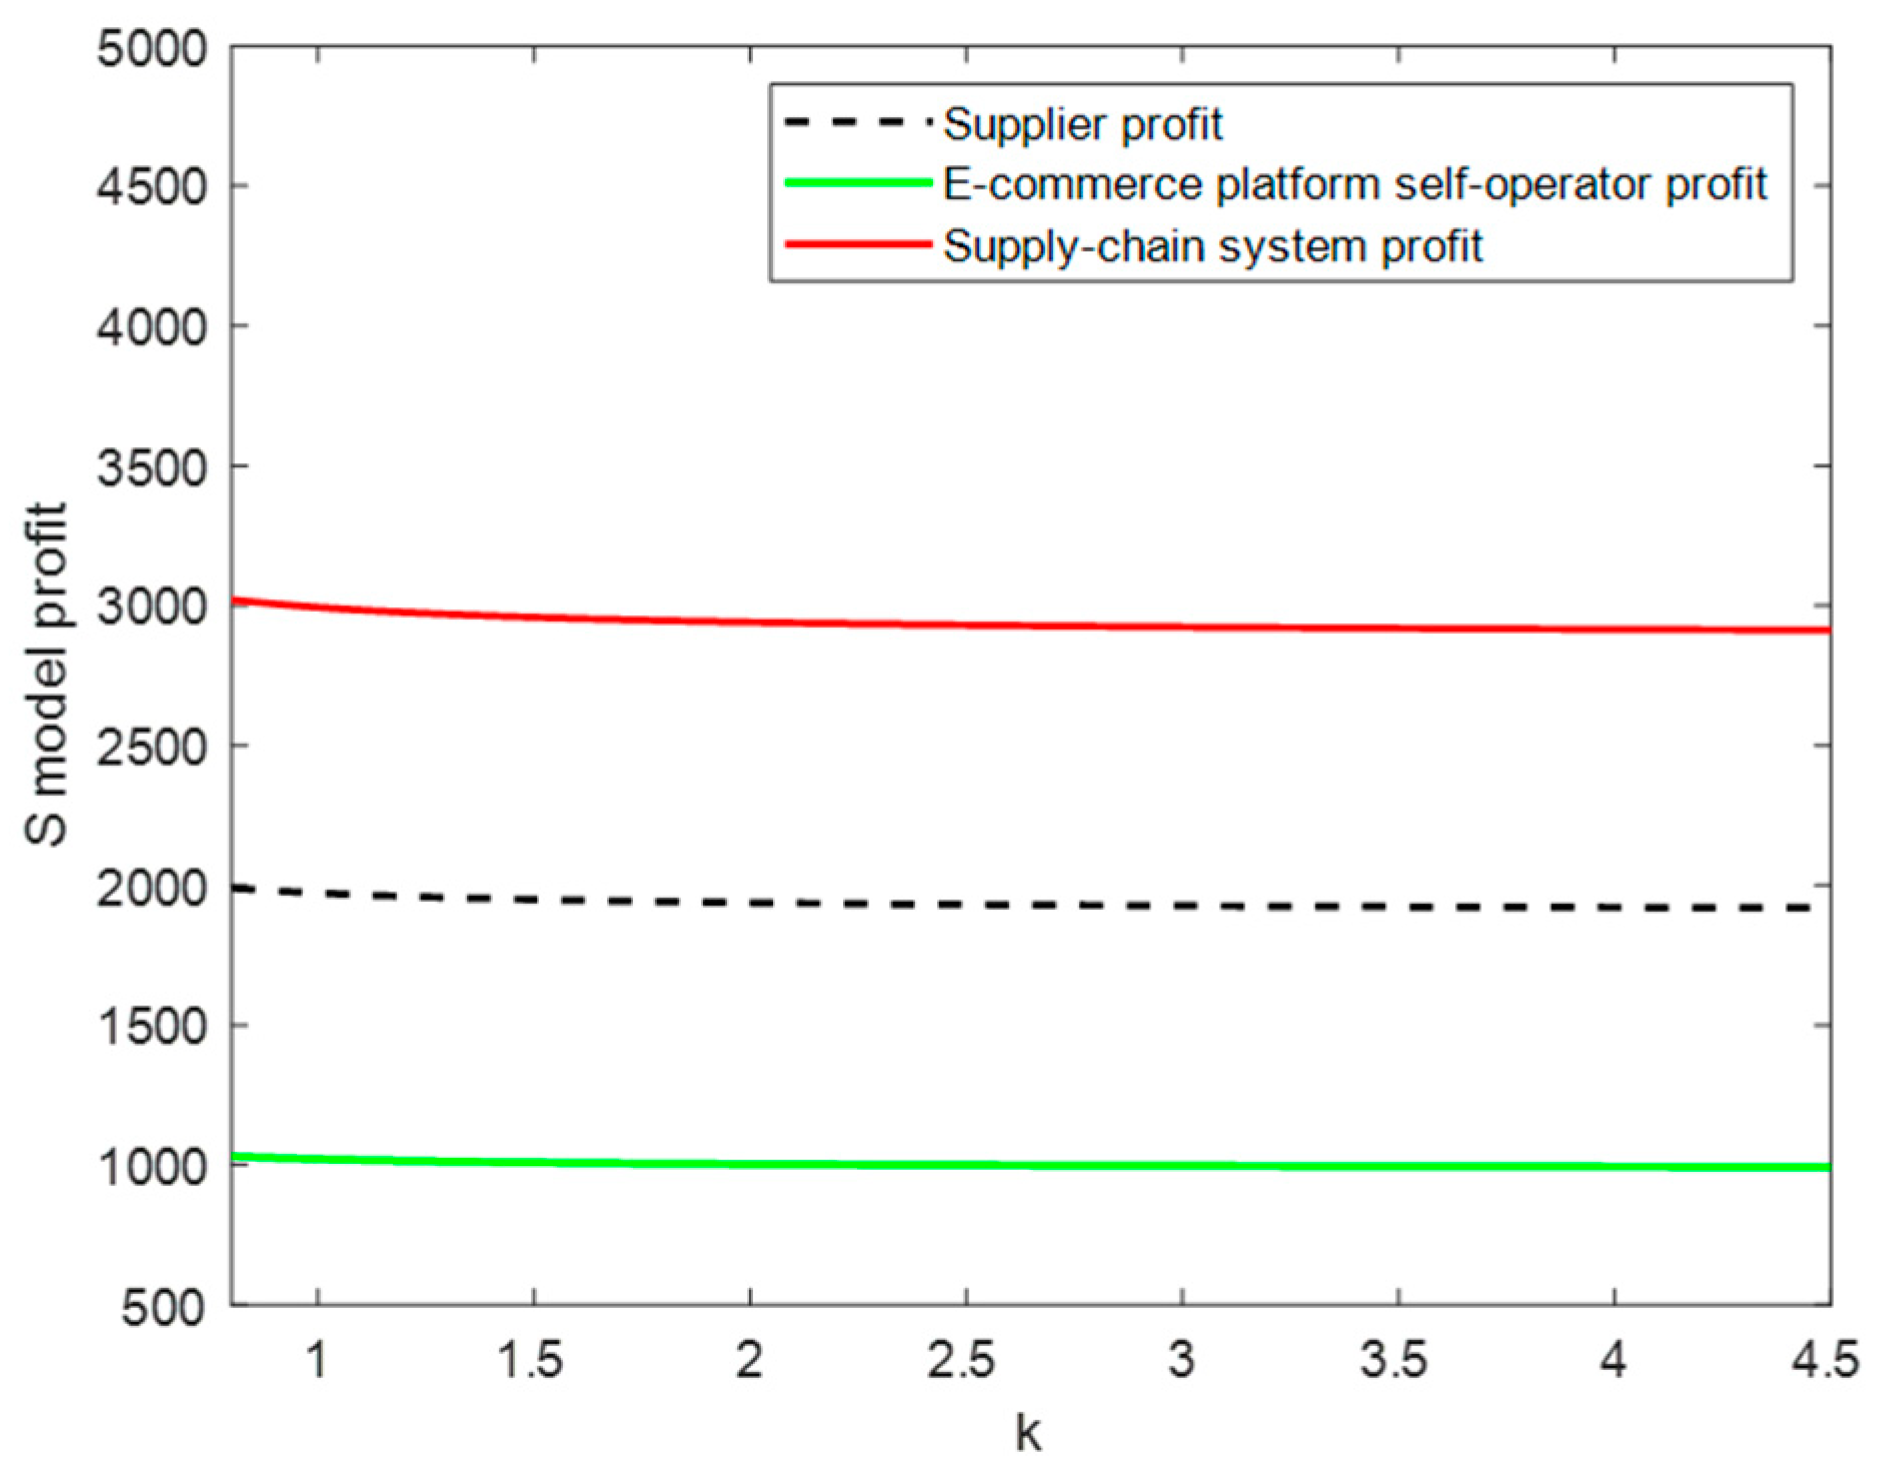
6.2. Sensitivity Analysis

As shown in Figure 2 and Figure 3, whether centralized or decentralized decision making is employed, the total profit of the supply-chain system is positively correlated with the sensitivity coefficients of product quality level and marketing effort level, and the profit from centralized decision making is higher than that from decentralized decision making.
Figure 2 and Figure 3 illustrate the significant impact of product quality level and marketing effort level on the e-commerce supply chain. The higher the product quality level, the greater the consumer preference for quality, indicating that enhancing product quality will drive higher market demand, thereby increasing the profits of supply-chain members. Similarly, increased marketing efforts lead to greater consumer awareness and desire to purchase the product, resulting in more loyal customers and market dominance, thereby providing greater returns to supply-chain members. Therefore, supply-chain members are increasingly motivated to enhance both product quality and marketing efforts to maximize overall profits.

6.3. Impact of γ and k on Supply-Chain Parameters in the CS Model and S Model

To validate the game model and its inferences constructed in this paper, as well as to explore the impact of the supplier’s product quality cost coefficient and the e-commerce platform self-operator’s marketing effort cost coefficient on the supply-chain system parameters, the following text compares the supplier-led decision model with the coordination contract to discuss the feasibility of the coordination contract.
(1) The impact of γ on the product quality level and profit, as shown in Figure 4 and Figure 5.
As illustrated in Figure 4 and Figure 5, as the product quality cost coefficient increases, both the product quality level and the supply-chain system profit decline in both the coordination contract model and the supplier-led decentralized decision-making model. In this case, the following suggestions can be put forward: For the supplier, it is essential to reduce the product quality cost coefficient and establish reasonable quality-control standards to enhance product quality and increase their profits. The supplier should re-evaluate their quality standards to ensure they meet market demand and customer expectations without excessively pursuing unnecessarily high standards. Secondly, the supplier can foster closer cooperation with key partners, enhance information sharing and communication, and collaboratively improve product quality. For the e-commerce platform self-operator, enhancing profits necessitates closer collaboration with the supplier to reduce quality costs and improve the transparency and reliability of the supply chain. By offering exceptional after-sales service, customer satisfaction and loyalty can be significantly enhanced, thereby ensuring stable sales growth and indirectly boosting profits.
(2) The impact of k on the product quality level and profit, as shown in Figure 6 and Figure 7.
Figure 6 and Figure 7 reveal that as the cost coefficient of marketing efforts increases, both the level of marketing efforts and the profit of the supply-chain system under the coordination contract model and the supplier-led decision-making model decrease. However, the impact of the marketing effort cost coefficient on market demand is less significant compared to that of the product quality cost coefficient. Among these, the coordination contract model surpasses the supplier-led decentralized decision-making model in terms of marketing effort cost, market demand, and overall supply-chain benefits. Therefore, the following suggestions can be made: For the supplier, providing high-quality products can not only win customer trust and satisfaction but also generate positive word of mouth and customer recommendations. Collaborating with e-commerce platforms to reduce wholesale prices will enable the platform self-operator to increase their product orders. For an e-commerce platform self-operator, leveraging data analysis and user behavior research can precisely target users, reduce advertising costs, enhance marketing efficiency, and achieve refined marketing strategies. Additionally, an e-commerce platform self-operator can establish a strong brand image by providing high-quality services. This approach attracts positive word-of-mouth communication, reduces marketing costs, and increases the user repurchase rate.
(3) The reconciliation of contract result verification, as shown in Figure 8 and Figure 9.
Figure 8 and Figure 9 clearly demonstrate that the cost-sharing and compensation contract positively impacts the e-commerce supply chain, contributing to Pareto optimization and the sustainable development of the entire supply chain. It further illustrates that the overall profits of the coordinated supplier, the e-commerce platform self-operator, and the entire supply chain have increased. Although the profit margins of supply-chain members have decreased due to the increased cost factor of marketing efforts, the impact has been relatively modest.

6.4. Discussion

The development of the e-commerce supply chain requires the joint efforts of suppliers and e-commerce platform self-operators. Based on the above numerical simulation analysis, each member of the supply chain can adopt the following strategies to enhance their core capabilities. Firstly, in a highly competitive market environment, superior product quality is essential for attracting consumers, while effective marketing strategies are crucial for increasing sales and expanding market share. Therefore, suppliers should continuously improve product quality, and e-commerce platform self-operators should enhance their marketing efforts to jointly promote the prosperity of the electronic product market. Secondly, as consumer demand evolves and market competition intensifies, enterprises should continuously innovate and optimize their products while formulating targeted marketing strategies to meet consumer needs and enhance brand influence. By establishing a solid contractual mechanism, a win–win situation can be achieved for both parties, promoting improvements in product quality and marketing efforts and thereby enhancing the performance of the entire supply chain. Finally, through the thoughtful design of power structures and the coordinated implementation of contracts, the operational efficiency of the supply chain and the closeness of cooperation between members can be enhanced, thereby improving the overall performance of the supply chain. This cooperation not only helps optimize resource allocation and reduce operating costs but also improves consumer satisfaction and loyalty, thereby creating greater value for enterprises.
The research in this paper has improved the results of previous studies. (1) When the rights are equal, the profits of each member of the supply chain can reach optimal levels, consistent with the findings of previous scholars [13,19]. However, the relevant theory is derived from a game model under different rights structures, further exploring the impact of varying cost coefficients on the power structure. This new perspective on the power dynamics between suppliers and e-commerce platform self-operators aims to enhance the profitability of the supply-chain system. (2) Compared to previous scholars’ research, most have analyzed either product quality or marketing efforts separately, with few combining both factors for analysis [24,37]. This paper analyzes the e-commerce supply chain based on the dual factors of product quality and marketing efforts. It offers pertinent management suggestions for supplier and e-commerce platform self-operators in various scenarios, providing theoretical references and managerial insights for the further advancement of the e-commerce supply chain. (3) In the Stackelberg game involving both parties, this study innovates by introducing the “cost-sharing + compensation contract” to enhance the performance of the e-commerce supply chain. This builds upon previous studies that utilized two-way revenue-sharing contracts [51], The addition of the compensation contract expands the research on e-commerce supply-chain management, supported by empirical evidence under various market environments and contract designs.

7. Conclusions

This paper examines the impact of electronic product quality and marketing efforts on market demand and the e-commerce supply chain. Using Stackelberg game theory and various supply-chain power structure models, this paper constructs three models: centralized decision making and decentralized decision making with different leaders. Based on this, a “cost-sharing + compensation contract” strategy is designed, and the feasibility of contract coordination is verified. After comparing and analyzing the results, the following is found: (1) Compared to decentralized decision making, centralized decision making can achieve lower sales prices and increase the profits of supply-chain members. (2) In both centralized and decentralized decision making, profit is positively correlated with the product quality sensitivity coefficient and the marketing effort sensitivity coefficient, while it is negatively correlated with the product quality cost coefficient and the marketing effort cost coefficient. (3) The “cost-sharing + compensation contract” mechanism achieves a win–win situation and ensures that the overall supply-chain profit reaches Pareto optimality. Finally, a numerical simulation is used to verify the correctness of the conclusion.
This paper conducts a dual-factor analysis of product quality and marketing efforts, an aspect not addressed in previous studies. Additionally, it resolves the issue of a lack of coordination between suppliers and e-commerce platform self-operators by introducing a “cost-sharing + compensation contract”. Through this mechanism, e-commerce platform self-operators can share costs and procure electronic products at a lower wholesale price, thereby increasing their profits. The e-commerce platform self-operator gives the smallest subsidy to the supplier, maximizing the profits for both parties. This coordination mechanism is seldom addressed in previous studies, thereby filling a gap in the literature. In addition, while ensuring product quality, the profits of each supply-chain member are gradually improved. When the supplier and e-commerce platform operator seek to maximize their profits, the overall performance of the supply chain is reduced. When suppliers and e-commerce platform self-operators make joint decisions, the profits of both parties can be maximized, and the overall performance of the supply chain can be improved. Finally, a cost-sharing + compensation contract is used to coordinate the profits of each member to maximize their profits.
The limitations of this study are as follows: This paper primarily focuses on the online sales environment and exclusively examines the impact of product quality levels on online sales. When constructing the model, only the secondary supply-chain relationship between the supplier and the e-commerce platform self-operator is taken into account. This paper primarily investigates the influence of the e-commerce platform self-operator’s marketing efforts on product quality and supply-chain profits, while not considering the impact of offline platform marketing efforts on the supply chain. Future research directions are as follows: First, combining the online and offline multi-channel sales scenarios would allow researchers to explore the impact of product quality levels on sales strategies and supply-chain profits under different sales channels. Secondly, researchers should consider incorporating additional links such as manufacturers into the supply-chain model and explore the decision-making interactions and coordination mechanisms among suppliers, manufacturers, e-commerce platform self-operators, and another stakeholders within a multi-level supply-chain structure. Lastly, researchers should further investigate the impact on product quality and supply-chain profits when both online e-commerce platforms and offline retail platforms engage in marketing efforts.

Author Contributions

Conceptualization, H.R. and Z.L.; writing—original draft preparation, Z.L.; writing—review and editing, H.R. and Z.L.; funding acquisition, H.R. All authors have read and agreed to the published version of the manuscript.

Funding

This research was funded by the National Natural Science Foundation of China, grant number 71661012.

Institutional Review Board Statement

Not applicable.

Informed Consent Statement

Not applicable.

Data Availability Statement

No new data were created or analyzed in this study. Data sharing is not applicable to this article.

Conflicts of Interest

The authors declare no conflicts of interest.

References

  1. Wan, X.; Chen, J. The relationship between platform choice and supplier’s efficiency- evidence from China’s online to offline (O2O) e-commerce platforms. Electron. Market. 2019, 29, 153–166. [Google Scholar] [CrossRef]
  2. Sulastri, R.E. The influence of product quality and promotion on consumer purchase decisions. J. Manaj. Bisnis. 2023, 7, 604–612. [Google Scholar] [CrossRef]
  3. Isidora, K.; Marija, K. Conjoint analysis of green consumer preferences for electronic products. Int. J. Qual. Res. 2022, 16, 559–575. [Google Scholar]
  4. Anand, H.; Alun, E. Brand preferences for consumer electronics in the United Arab Emirates. Int. J. Intell. Enterp. 2022, 9, 422–437. [Google Scholar]
  5. Ana, B.R.; Francesca, S.; Kristine, D.V.; Tammo, H.A.; Bijmolt, T.H. The effect of electronic word of mouth on sales: A meta-analytic review of platform, product, and metric factors. J. Mark. Res. 2016, 53, 297–318. [Google Scholar]
  6. Niu, B.Z.; Dong, J.; Dai, Z.P.; Liu, Y.Q. Sales data sharing to improve product development efficiency in cross-border e-commerce. Electron. Commer. Res. Appl. 2022, 51, 101112. [Google Scholar] [CrossRef]
  7. Mulyadi, H. Brand image analysis of sales with product quality as Samsung electronics Indonesia intervening variables. J. Sos. Dan Sains 2022, 3, 49–55. [Google Scholar]
  8. Prabhakar, M.K. Sheltronics installs electronic draft auto leveler technology at Gomuki Spinning Mills: New technology helps adhere to stringent quality standards and improve productivity. Text. Mag. 2017, 58, 70–72. [Google Scholar]
  9. Gong, W.W.; Liu, X.C.; Zhu, X.C.; Chen, J.X. Product quality control strategy based on supply chain network equilibrium in the direct broadcasting economy. Comput. Integr. Manuf. Syst. 2023, 29, 1684–1695. [Google Scholar]
  10. Wang, X.T.; Han, X.H.; Chen, Y. Optimal manufacturer strategy for live-stream selling and product quality. Electron. Commer. Res. Appl. 2024, 64, 101372. [Google Scholar] [CrossRef]
  11. Huang, F.Y.; Xiong, D.; Ma, C. Optimal decisions and channel coordination of a green supply chain with marketing effort and fairness concerns. Appl. Math. Nonlinear. Sci. 2023, 8, 909–926. [Google Scholar] [CrossRef]
  12. Subhajit, S.; Adel, F.A.; Md, A.K.; Amalesh, K.M. Optimal strategies for green investment, sharing contract and advertisement effort in a supply chain coordination problem. Ain. Shams. Eng. J. 2023, 15, 102595. [Google Scholar]
  13. Fan, J.C.; Fu, H.; Li, Y.H. The research on quality and coordination in supply chains under channel power structures and liability cost sharing. Syst. Eng. Pract. 2020, 40, 1767–1779. [Google Scholar]
  14. Lu, L.J.; Menezes, M.B.C. Supply chain vertical competition and product proliferation under different power structures. Int. J. Prod. Econ. 2024, 267, 109097. [Google Scholar] [CrossRef]
  15. Wang, W.; Liu, X.J.; Zhang, W.S.; Gao, G.; Zhang, H. Coordination of a green supply chain with one manufacturer and two competing retailers under different power structures. Discrete Dyn. Nat. Soc. 2019, 2019, 3453850. [Google Scholar] [CrossRef]
  16. Wen, H.; Zheng, B.R.; Cao, X.G.; Li, J.Z. Pricing and coordination of dual channel closed-loop supply chain with different channel power structure. Oper. Res. Manag. 2020, 29, 65–74. [Google Scholar]
  17. Wang, S.D.; Zhou, Y.W.; Min, J.; Zhong, Y.G. Coordination of cooperative advertising models in a one-manufacturer two-retailer supply chain system. Comput. Ind. Eng. 2011, 61, 1053–1071. [Google Scholar] [CrossRef]
  18. Chen, X.; Wang, X.J. Free or bundled: Channel selection decisions under different power structures. Omega 2015, 53, 11–20. [Google Scholar] [CrossRef]
  19. Feng, Q.H.; Liu, T. Research on the choice and coordination strategy of service channels in product and service supply chain considering power structure. Oper. Res. Manag. Sci. 2022, 31, 31–38. [Google Scholar]
  20. Chen, K.B.; Kong, Y.Q.; Lei, D. Pricing and green input decisions of a competitive supply chain with consumers’ product preference and different channel powers. China J. Manag. Sci. 2023, 31, 1–10. [Google Scholar]
  21. Jena, S.K.; Meena, P. Competitive sustainable processes and pricing decisions in omnichannel closed-up supply chains under different channel power structures. J. Retail. Consum. Serv. 2022, 69, 103114. [Google Scholar] [CrossRef]
  22. Andriani, D.P.; Tseng, F.S. Pricing and investment decisions when facing heterogeneous customers under different supply chain power structures. Alex. Eng. J. 2023, 78, 390–405. [Google Scholar] [CrossRef]
  23. Cao, X.G.; Kong, Y.Q.; Lei, D. Decision-making of closed-loop supply chain strategic alliance considering the quality level of remanufactured products and patent protection. Asia-Pac. J. Oper. Res. 2020, 37, 2050021. [Google Scholar] [CrossRef]
  24. Xu, B.; Zhang, Z.H.; Li, X.Q. Research on the coordination of quality behavior of supply 3 chain of e-commerce platform under C2B model of gig-grade e-commerce based on differential game. J. Theor. Appl. Electr. Commer. Res. 2022, 17, 1409–1430. [Google Scholar] [CrossRef]
  25. Zhang, Z.; Liu, S.; Niu, B. Coordination mechanism of dual-channel closed-loop supply chains considering product quality and return. J. Clean. Prod. 2020, 248, 119273. [Google Scholar] [CrossRef]
  26. Zhang, S.; Zhao, C.; Liu, Q.W. Cooperative incentive model of supply chain quality control based on cost-sharing contract. J. Phys. Conf. Ser. 2021, 1910, 012031. [Google Scholar] [CrossRef]
  27. Amirhossein, S.; Ali, H.D.; Mohammad, K.; Jurgita, A.; Edmundas, K.Z.; Farbod, Z. Multi-objective sustainable closed-loop supply chain network design considering multiple products with different quality levels. Systems 2022, 10, 94. [Google Scholar] [CrossRef]
  28. Ahmed, M.A.; Saadany, E.; Jaber, M.Y. Coordinating a two-level supply chain with production interruptions to restore process quality. Comput. Ind. Eng. 2008, 54, 95–109. [Google Scholar]
  29. Lin, Z.B.; Luo, C. A Study on supply chain product quality decision and coordination based on manufacturer’s process innovation capability. J. Fuzhou. Univ. (Philo. Soc. Sci.) 2021, 35, 50–58. [Google Scholar]
  30. Li, G.; Wu, H.M.; Sethi, S.P.; Zhang, X. Contracting green product supply chains considering marketing efforts in the circular economy era. Int. J. Prod. Econ. 2021, 234, 108041. [Google Scholar] [CrossRef]
  31. Taylor, T.A. Supply chain coordination under channel rebates with sales effort effects. Manag. Sci. 2002, 48, 992–1007. [Google Scholar] [CrossRef]
  32. Xie, W.Y.; Chen, B.; Huang, F.Y.; He, J. Coordination of a supply chain with a loss-averse retailer under supply uncertainty and marketing efforts. J. Ind. Manag. Optim. 2021, 17, 3393. [Google Scholar] [CrossRef]
  33. Li, M.; Gao, G.J. Coordination of supply chain cost-sharing contract considering green R&D investment and marketing efforts under low carbon background. Int. Core J. Eng. 2022, 8, 281–294. [Google Scholar]
  34. Taleizadeh, A.A.; Sane-Zerang, E.; Choi, T.M. The effect of marketing efforts on dual-channel closed-loop supply chain systems. IEEE. Trans. Syst. Man. Cybern. Syst. 2018, 48, 265–276. [Google Scholar] [CrossRef]
  35. Guo, J.S.; Yang, P.; Zhou, Y.W.; Yang, Y.Z. Dual channel supply chain coordination strategy based on uniform pricing and promotion. Oper. Res. Manag. Sci. 2021, 30, 99–107. [Google Scholar]
  36. Li, M.X.; Chen, K.B. Channel structure selection in a competitive supply chain under consideration of marketing efforts strategy. Soft Comput. 2022, 26, 12155–12177. [Google Scholar] [CrossRef]
  37. Chang, S.; Hu, B.; He, X.H. Supply chain coordination in the context of green marketing efforts and capacity expansion. Sustainability 2019, 11, 5734. [Google Scholar] [CrossRef]
  38. Huang, H.W.; Chen, Z.S.; Wu, S.; Jiao, J.F.; Wang, X.J. Pricing and coordination of dual channel based on sales effort under two-part pricing contract. Comput. Integer. Manuf. Syst. 2022, 28, 2998–3008. [Google Scholar]
  39. Sousa, N. Breaking barriers: Unveiling challenges in virtual reality adoption for tourism business managers. Tour. Hosp. Manag. 2024, 30, 269–282. [Google Scholar] [CrossRef]
  40. Jorge, F.; Sousa, N.; Losada, N. Can virtual reality be used to create memorable tourist experiences to influence the future intentions of wine tourists? J. Tour. Dev. 2023, 43, 67–76. [Google Scholar]
  41. Fadi, A.; David, F.; Mizan, R.; Nuzhat, N. A new era of strategic investment decision-making practices in UK companies: Towards sustainable supply chains and circular economy. Theor. Econ. Lett. 2023, 13, 666–682. [Google Scholar]
  42. Zhang, Y.C.; Feng, Y.; Zhou, J.H. Simulation and Optimization to Systematic Dynamic Model of Contract Coordination Quality Control in Closed-loop Supply Chain. Syst. Eng. 2018, 36, 105–112. [Google Scholar]
  43. Wang, W.B.; Chen, M.X.; Lin, W.Y.; Bian, W.L. Pricing and coordination in a dual-channel supply chain with product variety under the countervailing power of the retailer. IEEE Access 2021, 9, 18817–18830. [Google Scholar] [CrossRef]
  44. Mohammad, R.R.; Saeed, Y.; Atieh, F. A hierarchical revenue-sharing contract in electronic waste closed-loop supply chain. Waste Manag. 2020, 115, 121–135. [Google Scholar]
  45. Shen, Q.; Xu, L.L.; Yang, W.M.; Liu, X.B.; Hou, Y.X. The optimization of quality control in dual channel supply chains with uncertain demand. China J. Manag. Sci. 2019, 27, 128–136. [Google Scholar]
  46. Kou, J.; Zhang, X.M.; Zhou, M.S.; Dan, B. Pricing and coordination strategy of product and extended warranty in product service supply chain. J. Syst. Manag. 2020, 29, 601–607. [Google Scholar]
  47. Chen, Z.S.; Wu, S.; Govindan, K.; Wang, X.J.; Chin, K.S.; Martínez, L. Optimal pricing decision in a multi-channel supply chain with a revenue-sharing contract. Ann. Oper. Res. 2022, 318, 67–102. [Google Scholar] [CrossRef]
  48. Hu, H.J.; Li, Y.K.; Li, M.D. Decisions and coordination of green supply chain considering big data targeted advertising. J. Theor. Appl. Electr. Commer. Res. 2022, 17, 1035–1056. [Google Scholar] [CrossRef]
  49. Wang, Y.Y.; Yu, Z.Q.; Shen, L.; Fan, R.J.; Tang, R.Y. Decisions and coordination in e-commerce supply chain under logistics outsourcing and altruistic preferences. Mathematics 2021, 9, 253. [Google Scholar] [CrossRef]
  50. Lin, Q.; Qin, X.H. Optimal decision and contract coordination of e-commerce supply chain based on altruistic preference. J. Math. Pract. Theory 2021, 51, 287–299. [Google Scholar]
  51. Saha, S.; Banaszak, Z.A.; Bocewicz, G.K.; Nielsen, I.E. Pricing and quality competition for substitutable green products with a common retailer. Oper. Res. 2021, 22, 3713–3746. [Google Scholar] [CrossRef]
  52. He, Y.; Wang, H.; Guo, Q.; Xu, Q.Y. Coordination through cooperative advertising in a two-period consumer electronics supply chain. J. Retail. Consum. Serv. 2019, 50, 179–188. [Google Scholar] [CrossRef]
  53. Guo, H.X.; Liu, Z.; Hu, B.; Lin, H.D.; Shi, L.H.; Meng, C.C. Pricing and coordination mechanism of supply chain considering product recycling under asymmetric power. Math. Probl. Eng. 2021, 2021, 5579655. [Google Scholar] [CrossRef]
  54. Heydari, J.; Ghasemi, M. A revenue sharing contract for reverse supply chain coordination under stochastic quality of returned products and uncertain remanufacturing capacity. J. Clean. Prod. 2018, 197, 607–615. [Google Scholar] [CrossRef]
  55. Hosseini-Motlagh, S.-M.; Nematollahi, M.; Nouri, M. Coordination of green quality and green warranty decisions in a two-echelon competitive supply chain with substitutable products. J. Clean. Prod. 2018, 196, 961–984. [Google Scholar] [CrossRef]
  56. Modak, N.M.; Panda, S.; Sana, S.S. Three-echelon supply chain coordination considering duopolistic retailers with perfect quality products. Int. J. Prod. Econ. 2016, 182, 564–578. [Google Scholar] [CrossRef]
  57. Jiang, Y.; Ma, S.H. Study on supply chain sales strategy for perishable product with advance selling and quality disclosure. Ind. Eng. Manag. 2018, 23, 85–90. [Google Scholar]
  58. He, X.C.; He, Q.H. Investigation on quantization of quality of product. Hunan Metall. 2000, 28, 45–48. [Google Scholar]
  59. Wang, Y.Y.; Shen, L.; Han, Q. E-commerce supply chain model considering product quality and altruistic preference concern. Chin. J. Manag. Sci. 2021, 29, 123–134. [Google Scholar]
  60. Kasulaitis, B.; Babbitt, C.W.; Tyler, A.C. The role of consumer preferences in reducing material intensity of electronic products. J. Ind. Ecol. 2021, 25, 435–447. [Google Scholar] [CrossRef]
  61. Alessandro, S.O.; Gustavo, Q.S.; Dirceu, D.S.; Matheus, A.R.S.; Francisco, D.A.D.S.M. Impacts of service guarantees on consumers’ perceived quality and satisfaction in e-commerce. Int. J. Qual. Reliab. Manag. 2023, 40, 2559–2580. [Google Scholar]
  62. Liu, C.; Huang, W.L.; Zheng, B.R.; Yang, C. The decision-making of manufacturer stimulating supplier innovation considering marketing effort and innovation capability. Syst. Eng. Theory Pract. 2017, 37, 3040–3051. [Google Scholar]
  63. Liu, G.W.; Zhang, J.X.; Tang, W.S. Strategic transfer pricing in a marketing–operations interface with quality level and advertising dependent goodwill. Omega 2015, 56, 1–15. [Google Scholar] [CrossRef]
  64. Fu, C.Y.; Cheng, S.S.; Yi, Y.X. Dynamic control of product innovation, advertising effort, and strategic transfer-pricing in a marketing-operations interface. Math. Probl. Eng. 2019, 2019, 8418260. [Google Scholar] [CrossRef]
  65. Ma, D.Q.; Hu, J.S. Dynamic quality improvement input and marketing effort coordination strategies considering delay phenomenon. Oper. Res. Manag. Sci. 2021, 30, 181–190. [Google Scholar]
  66. Alotosh, D.; Biswajit, S.; Bikash, K.D.; Isha, S.; Liu, Y.; Shu-Kai, S.; Suman, K.S.; Lakshmi, T. The impact of sales effort on a dual-channel dynamical system under a price-sensitive stochastic demand. J. Retail. Consum. Serv. 2024, 76, 103561. [Google Scholar]
  67. Zhang, K.J.; Ma, M.Q. Research on dual-channel supply chain coordination considering fresh e-tailer’s returns. J. Donghua Univ. (Nat. Sci. Ed.) 2021, 47, 116–123. [Google Scholar]
  68. Cai, X.Q.; Chen, J.; Xiao, Y.B.; Xu, X.L. Optimization and coordination of fresh product supply chains with freshness-keeping efforts. Prod. Oper. Manag. 2010, 19, 261–278. [Google Scholar] [CrossRef]
  69. Zhu, M.L. Dual-channel supply chain coordination considering quality control under revenue-sharing contract. J. Trans. Eng. Inform. 2021, 19, 81–92. [Google Scholar]
Figure 1. The overall framework of the supply-chain model.
Sustainability 16 05536 g001
Figure 2. The change trend of the total profit in the C model and the S model.
Sustainability 16 05536 g002
Figure 3. The change trend of the total profit in the C model and the E model.
Sustainability 16 05536 g003
Figure 4. The impact of γ on t in the CS model and the S model.
Sustainability 16 05536 g004
Figure 5. The impact of γ on profit in the CS model and the S model.
Sustainability 16 05536 g005
Figure 6. The impact of k on the marketing effort level in the CS model and the S model.
Sustainability 16 05536 g006
Figure 7. The impact of k on the supply-chain system profit in the CS model and the S model.
Sustainability 16 05536 g007
Figure 8. The impact of k on supply-chain member profits in the S model.
Sustainability 16 05536 g008
Figure 9. The impact of k on supply-chain member profits in the CS model.
Sustainability 16 05536 g009
Table 1. Comparisons among the relevant literature and this paper.
ReferencesFocusPower StructureQuality of ProductsMarketing EffortsCoordination Mechanism
Lu et al. [14]Operating costsYesNoNoNash equilibrium
Wang et al. [17]Green costYesNoNoTariff contracts
Chen et al. [18]Green productsYesYesNoCost-sharing covenants
Cao et al. [23]Remanufacturing of waste
products
YesYesNoNo
Xu et al. [24]Product gradeNoYesNoCooperation and coordination mechanism
Zhang et al. [25]Quality controlNoYesYesNo
Li et al. [30]Green level of the productNoNoYesContractual deeds
Taleizadeh et al. [34]Dual-channelYesNoYesTwo-part tariff contract
Zhang et al. [42]Product qualityNoYesNoQuality reward and punishment–revenue-sharing contract
Lin et al. [50]Altruistic preferenceYesNoNoService cost sharing
This paperProduct quality,
marketing efforts
YesYesYesCost sharing + compensation deeds
Table 2. Parameters and their descriptions.
ParametersDescriptions
p Sales price
t Product quality level
e Marketing effort level
D Market demand
b Sensitivity coefficient of market demand to price, 0 < b < 1  
θ Sensitivity coefficient of consumers to the level of marketing
Efforts of e-commerce platform self-operator, 0 < θ < 1  
k Marketing effort cost factor, 0 < k < 1  
β Sensitivity coefficient of consumers to the quality level of supplier products, 0 < β < 1  
w Wholesale price
c Cost of the product
γ Product quality cost factor, 0 < γ < 1  
a Potential market demand for electronics
Π m Profit function of the supplier
Π r Profit function of the e-commerce platform self-operator
Π c Profit function of supply-chain system
Table 3. Parameter values.
Parameter a c k β γ θ b
Value100100.80.20.50.20.6
Table 4. Decision structures and profit values for each model.
Decision-Making Patterns p t e w d Π 1 * Π 2 * Π 3 *
C model97.8535.1421.96-45.68--4128.97
Decentralized modelS model133.516.9410.5991.1625.411990.091030.93020.99
E model133.0417.1710.7352.9225.751031.72017.353049.06
CS model983521.9110.3652.581991.432137.544128.97
Disclaimer/Publisher’s Note: The statements, opinions and data contained in all publications are solely those of the individual author(s) and contributor(s) and not of MDPI and/or the editor(s). MDPI and/or the editor(s) disclaim responsibility for any injury to people or property resulting from any ideas, methods, instructions or products referred to in the content.

