Abstract
Urbanization significantly affects the global carbon balance. Therefore, clarifying the effect of urbanization-induced land use change on carbon emissions and proposing the zonal-based policy implementation became crucial. In this study, we estimated the future land use carbon emissions in three scenarios by adopting the partitioned Patch-generating Land Use Simulation Model (PLUS) in the Xiamen–Zhangzhou–Quanzhou (XZQ) metropolitan circle, China. The results showed that (1) the region could be divided into two sub-areas (carbon sink function zone and high-carbon optimization zone); the partitioned PLUS model had a higher accuracy in the developed areas, whereas it had a lower accuracy in the undeveloped areas; (2) the main characteristic of land use change was the construction on the land that was previously farmland, spanning 260.2 km2; the land used for construction would continue to expand, with 215.5 km2 (8.2%), 261.0 km2 (9.9%), and 129.5 km2 (4.9%) in the natural development scenario (ND), economic development scenario (ED), and carbon neutrality scenario (CN), respectively; (3) the amount of carbon emissions would increase by 196.2 × 10⁴ tons and 235.4 × 10⁴ tons in the ND and ED, respectively, whereas, it would decrease by 49.0 × 10⁴ tons in the CN. This study made a beneficial attempt at partitioning based on carbon neutrality by improving the PLUS model simulation results and carbon emission assessment, which could provide methods and references for future similar studies. The findings suggest a method for the coordinated development between the carbon sink function zone and the high-carbon optimization zone. In addition, comprehensively understanding the land use change and its effects on carbon emissions, from this study, could provide important insights into carbon neutrality and regional sustainable development for urban planners and policymakers. In future research, the zoning research could be conducted at a finer scale, since the partition results were relatively coarse in this study.
1. Introduction
The land use system represents the intensity of human activity on the natural environment [1,2,3]. Recent studies suggest that human-induced perturbations to the Earth’s systems have exceeded the natural variability [4,5]. Consequently, humanity faces many severe global ecological issues, such as biodiversity loss, global warming, water pollution, and altered hydrological cycles [6,7,8]. These issues are closely associated with cities [9]. Previous studies have estimated that the global urban extent has reached 6.5 × 10⁵ km2 and is home to 55% of the global population [10]. Increasing global urbanization has resulted in a drop in ecological security, a decline in ecosystem services, and a dramatic increase in carbon emissions [11], impacting urban sustainable development and human wellbeing [2,12,13]. At present, urbanization and its eco-environmental effects have become vital research topics worldwide, especially on the urban planning to mitigate urban carbon emissions to cope with climate change [12,14].
Carbon emission is closely related to land use change [15,16,17]. Urban CO2 emissions account for approximately 70% of the total anthropogenic CO2 emissions, whereas agriculture and forestry only account for 13% [18,19]. The methods to assess land use carbon emissions mainly include field surveys, the empirical parameter model, and remote sensing-based methods [20]. However, the field survey method is time-consuming and laborious for large-scale research. Though the remote sensing method can compensate for the shortcomings of large-scale field surveys, it is full of great uncertainty. Thus, carbon emission coefficients of different land use types were widely adopted due to their economic feasibility and the capacity to make a rapid assessment. Previous studies have proved the efficiency of the carbon emission coefficients method [21]. For example, the net land use carbon emissions increased by 8.7 × 10⁸ tons and 1.3 × 10⁷ tons in the Yangtze River Delta Urban Agglomeration and the XZQ metropolitan circle, respectively [15,22]. Ultimately, we chose the empirical parameter model to assess regional carbon emissions.
Improving ecosystem management and optimizing ecosystem patterns can be practical to achieve carbon sequestration and emission reduction. The former generally focuses on a single ecosystem, such as the forest ecosystem and farmland ecosystem, while the latter tends to reduce carbon emissions through land use optimization. Some land use models have been integrated to simulate the spatiotemporal changes in land use to seek low-carbon pathways. Land use models facilitate a further understanding of the underlying influencing factors and their ecological effects. Existing land use models mainly include the Markov model [23], agent-based modeling [24], the cellular automata-based model (CA), the conversion of land use and its effects models (i.e., CLUE-S and CLUMondo models) [25,26], and the coupling model (i.e., the Patch-generating Land Use Simulation Model (PLUS)) [27,28]. The PLUS model is established based on CA models, with a higher accuracy. The PLUS model adopts a new rule-mining strategy to indicate the role of driving forces in land use change [29]. It also embraces a new multi-class seed growth mechanism, which enables it to simulate the multiple land use type changes at the patch level. Thus, the PLUS model was applied to simulate the future land use change in this study.
Numerous studies have explored the relationship between future land use change and carbon storage/carbon emission across different spatial scales by adopting the PLUS model [30,31,32]. For instance, there is a significant difference in carbon stock under the business-as-usual (BAU) and protected forest (PF) scenarios at Trees Lagoas, with 2.48 Tg [33]. Similarly, carbon storage tends to increase in the BAU scenario in the Sanjiangyuan Area [34]. Heterogeneity characteristics of carbon emissions were crucial to formulating carbon reduction strategies, especially in urban agglomerations [35]. Previous studies have generally considered the heterogeneity from the perspective of socioeconomic and topographic features, as well as climate [36,37,38]. Recently, an increasing number of studies have tended to investigate carbon zones [39,40]. However, few studies have paid attention to the effect of spatial heterogeneity in the context of carbon zones on the performance of the PLUS model.
Generally, the partitioned simulation could obtain more accurate and stable results, which promote carbon emissions estimation [41]. Since the existing studies treated the urban agglomeration as a whole, it inevitably ignored the heterogeneity within the urban agglomeration. The transition rule, representing spatial heterogeneity, is perhaps the most significant component in the PLUS model. The spatially partitioned transition rules effectively solve the issue of spatial heterogeneity in the administrative district partition and the constrained spatial clustering partition. For example, Xu et al. (2021) proposed a dual-constrained CA model and applied it in the Dianchi Lake watershed, China [42]. However, few studies have estimated the effect of partitioned simulation on carbon emissions [15]. Land use optimization for carbon neutrality has been applied to national spatial optimization in China. Implementing zoning and classification strategies has become crucial [43]. Carbon balance zoning is not only the key to formulating the carbon emission reduction control policies, but could reasonably promote low-carbon development in various regions. Thus, with the background of carbon neutrality, the study of carbon balance zoning can provide implications for land use optimization. However, few studies have developed comprehensive partitions based on carbon neutrality and investigated their effects on land use simulation.
Great progress has been made in the construction of ecological civilization in XZQ. Meanwhile, a large amount of farmland has been converted into construction land during rapid urbanization [44,45]. Additionally, the carbon emissions of this region are at a relatively high level. The Chinese government has announced an outline of the “carbon peak and carbon neutralization” strategy for XZQ [46]. Thus, high-quality economic development in the XZQ is necessary. Many favorable policies and plans have been released to advance “The Belt and Road Initiative” and the “Xiamen Free Trade Zone”. The XZQ metropolitan circle will encounter challenges regarding economic development and carbon neutralization. Therefore, exploring the effect of the land use dynamic on carbon neutralization is meaningful for regional sustainable development and urban planning.
In summary, there are some research gaps and limitations in previous studies. First, few studies have integrated partitions into multi-scenario land use simulation based on carbon neutralization and provided the implications for low carbon emissions. Second, there is a lack of in-depth studies on the effects of multi-scale land use on carbon emissions. In view of this, we adopted the partitioned PLUS model to simulate land use dynamics under multiple scenarios and investigated the effects on carbon emissions. The main contributions include the following: (1) the comprehensive partitions based on carbon neutralization were proposed and integrated into land use simulation, and (2) the spatiotemporal dynamic of the land use change and carbon emission of the XZQ metropolitan circle at a city and county scale from 2010 to 2020 were identified.
2. Materials and Methods
The workflow of this study is shown in Figure 1. Integrating land use data, partitioned results, a series of driving factors, and three scenarios, we explored the impact of developing a strategy on land use change and carbon emissions at the city and county scales.
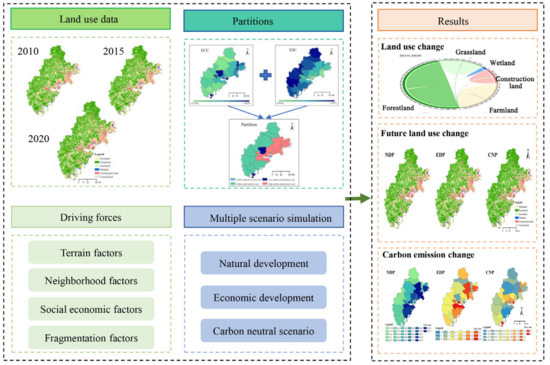
Figure 1.
Workflow of this study.
2.1. Study Area
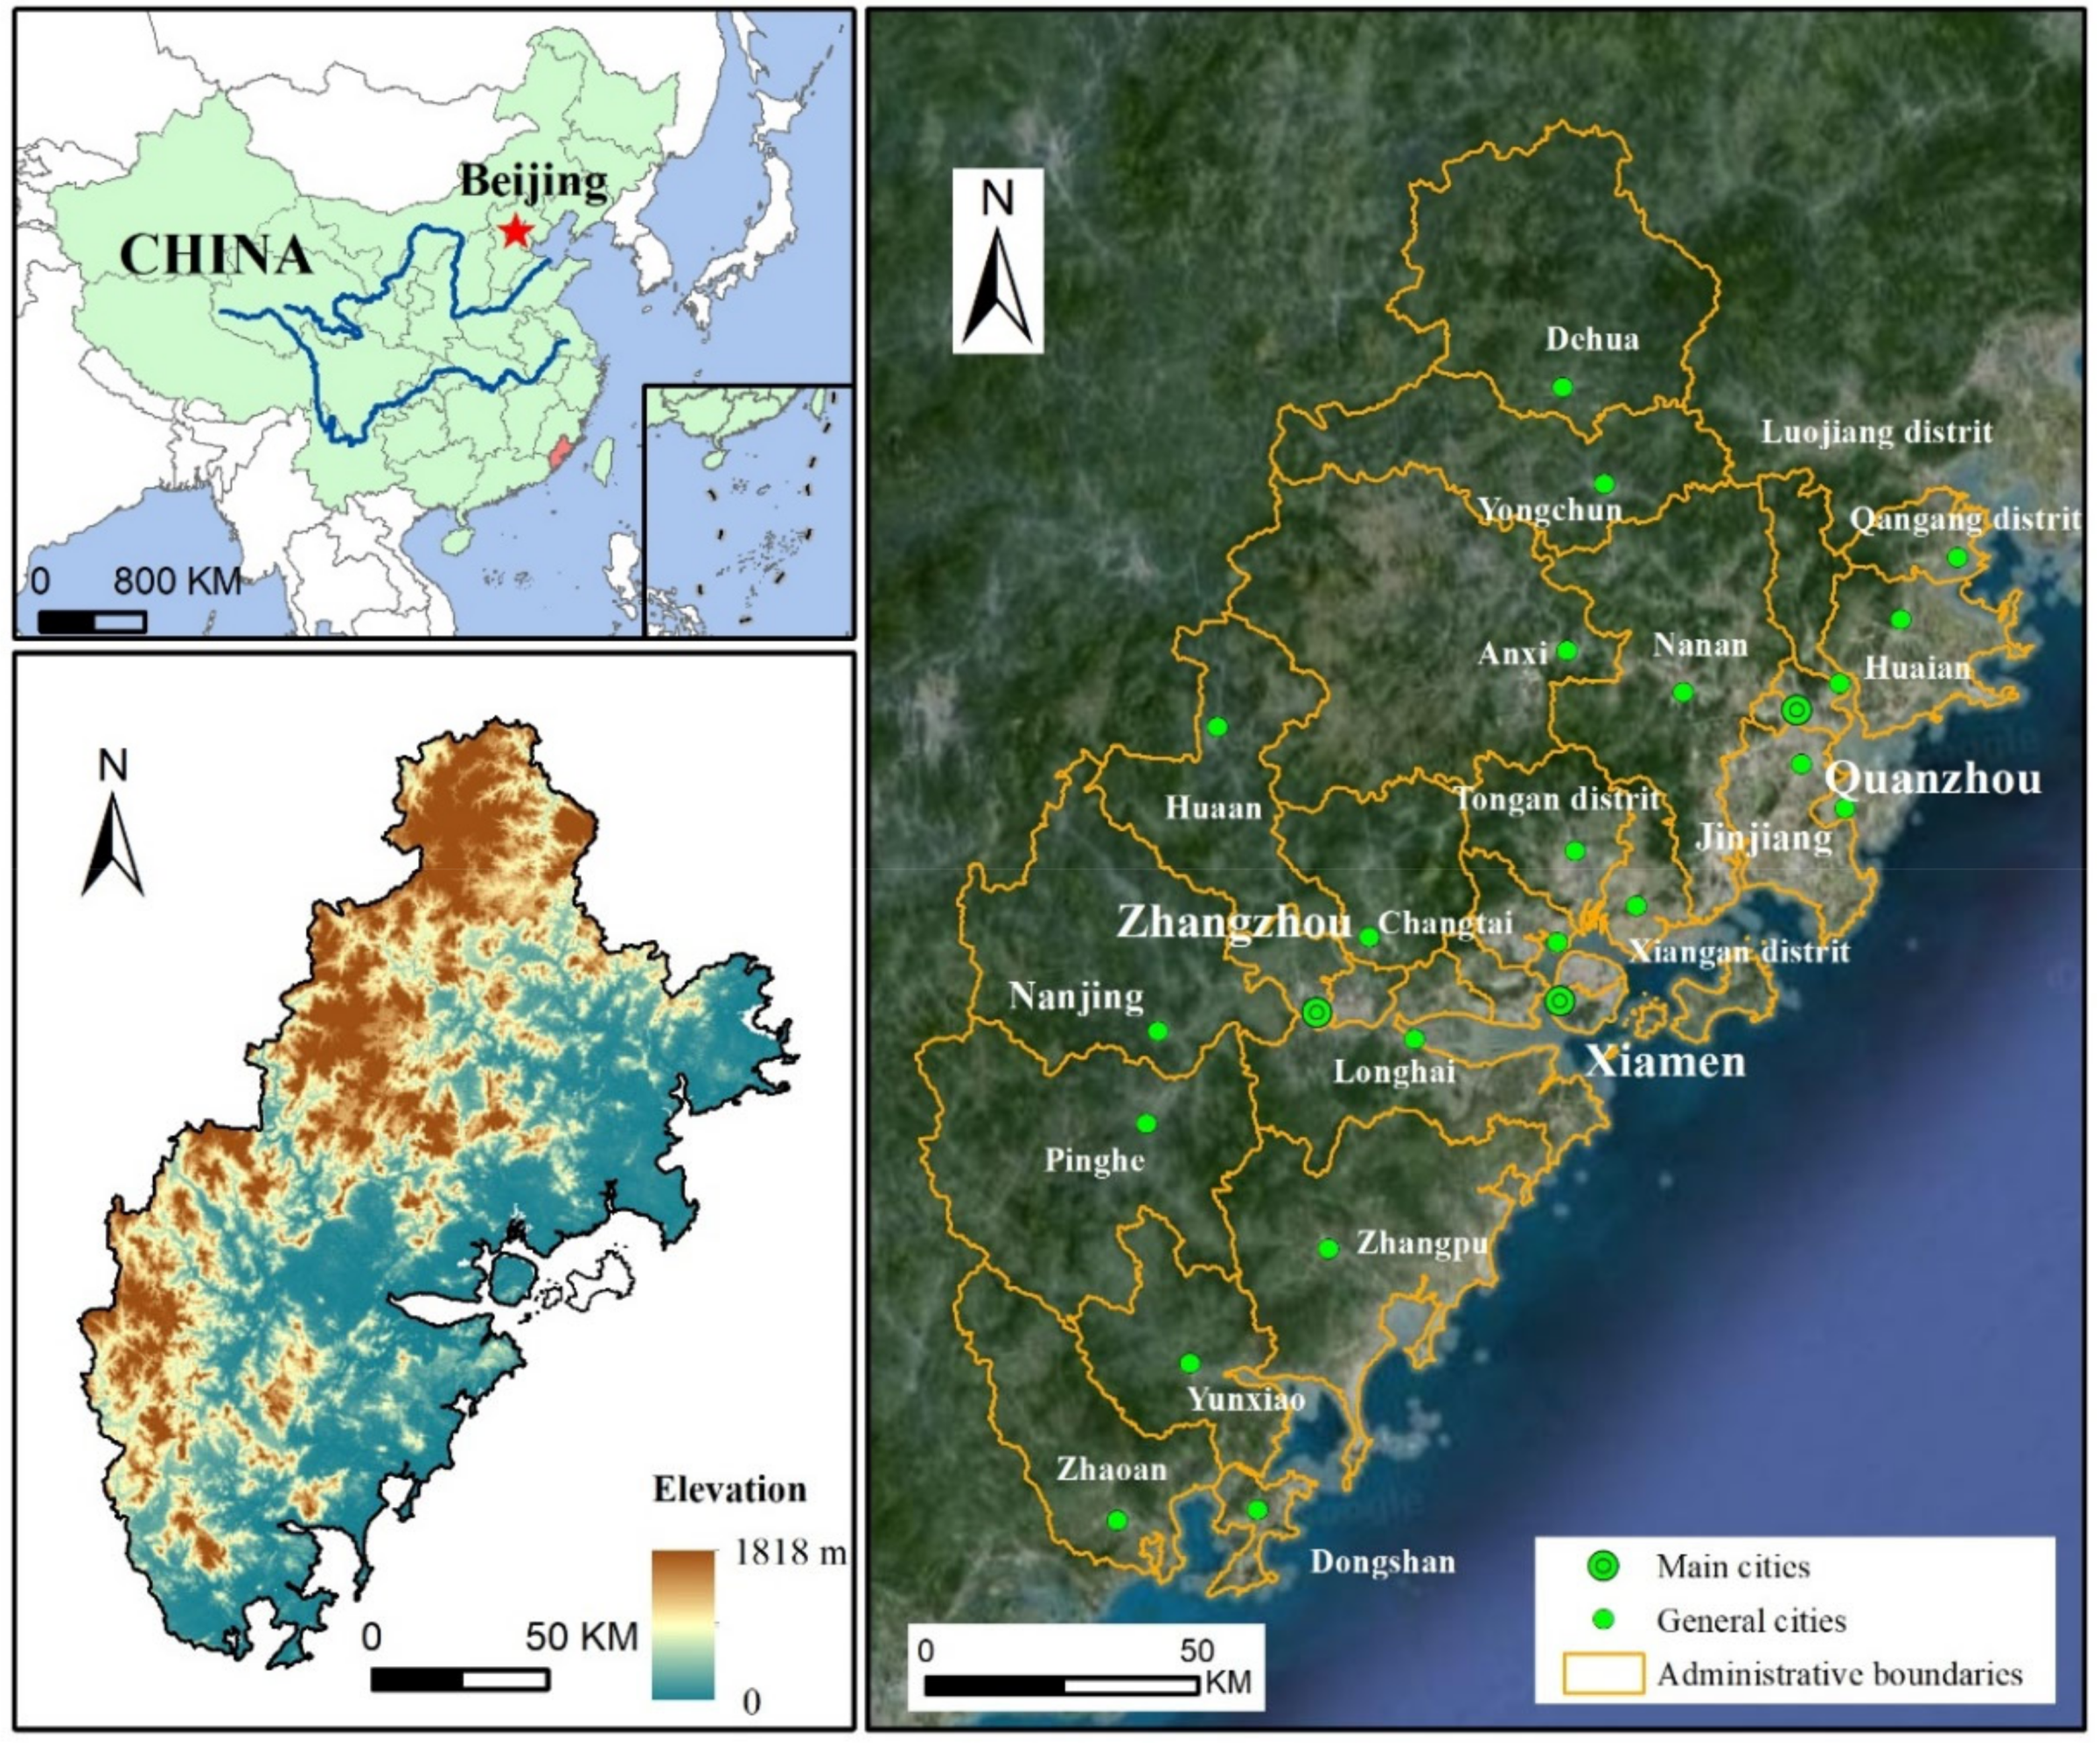
The XZQ (116°53′–119°05′ E, 23°23′–25°56′ N) is located on the southeast coast of China (Figure 2). It has a subtropical marine monsoon climate, whose terrain generally declines from the northwest to the southeast. The landform is diverse, including mountains and plains scattered throughout. The XZQ has 12 municipal districts, 4 county-level cities, and 13 counties. In 2021, the permanent resident population reached 19.2 million, and the GDP was approximately CNY 2.3 trillion. The XZQ is an economically developed area in Fujian Province, with a GDP accounting for 50% of the entire province. Xiamen is dominated by the tertiary industry, which accounts for approximately 60% of the GDP. Zhangzhou and Quanzhou are dominated by the secondary industry, which accounts for nearly 50% of the GDP for two cities. Overall, this region is complementary, intensive, and synergistic.

Figure 2.
The location of the XZQ metropolitan circle.
2.2. Data Sources
The used data mainly included land use data, socioeconomic data, terrain data, and county-level CO2 emissions and sequestration data. The land use data (resolution: 30 m) were collected from the Chinese Academy of Sciences (http://www.resdc.cn/, accessed on 7 May 2024), with an accuracy exceeding 90% [47]. In this study, the land use types can be divided into farmland, forestland, grassland, wetland, construction land, and unused land. The GDP, population density, and night light data (resolution: 1 km) were acquired from the Resources and Environmental Scientific Data Center (http://www.resdc.cn/, accessed on 7 May 2024). Terrain data (resolution: 30 m) were downloaded from the Geospatial Data Cloud (http://www.gscloud.cn/, accessed on 7 May 2024). The slope was extracted from the digital elevation model (DEM) using the ArcGIS “spatial analysis tools”. Roads were collected from the National Earth System Science Data Center (https://www.Geodata.cn, accessed on 7 May 2024). Railways were collected from the Baidu Map (https://map.baidu.com, accessed on 7 May 2024). Urban areas, villages, and rivers were extracted from land use data in 2020. The neighborhood factor was calculated using the tool of “Euclidean Distance” in ArcGIS 10.8. Points of interest (POIs) were derived through network crawling, which included seven subcategories, namely restaurants, bus stops, metro stations, manufacturing, schools, hospitals, and residences. The patch density was calculated based on the landscape using the software Fragstats 4.2. The data mentioned above were unified to the Albers coordinate system, with a resolution of 100 m. County-level CO2 emissions and sequestration data were acquired from previous studies (https://www.ceads.net.cn/, accessed on 7 May 2024) [20].
2.3. Partitions Based on Carbon Neutrality
Compared with previous studies [48,49], the county-level CO2 emissions and sequestration data used in this study were more reliable. We selected CO2 emissions data and carbon sequestration data from 2017 to proceed with zoning, because they are the latest data directly related to current land use. Carbon compensation has become an emerging field, and existing studies mainly focus on carbon balance zoning based on carbon budget accounting, with less attention being paid to the economic contributive coefficient of carbon emission (ECC) and the ecological support coefficient of the carbon absorption index (ESC). Therefore, this paper comprehensively considered the ECC and ESC, and divided the XZQ metropolitan circle into four sub-regions (Table 1) [39]. The ECC measures the contribution of regional carbon emissions to the regional economy. The ESC represents the capacity of carbon sequestration. The formulas are as follows:
where , , and are the GDP, carbon absorption, and carbon emissions of the th county, respectively. and are the carbon absorption and carbon emissions of the region, respectively.

Table 1.
Characteristics of carbon neutralization zoning.
2.4. PLUS Model
2.4.1. Driving Forces Selected
Land use change is closely related to natural environment, traffic location, social economy, and policy. Therefore, we comprehensively considered various influencing factors and their availability [50,51,52], and finally selected 13 driving factors in 2020 with a strong correlation to land change. Specifically, the 13 driving factors included GDP, population density, night light intensity, POIs’ density, distance to different levels of roads (the provincial roads/county railway/railway), distance to the urban areas/the village, distance to the river, DEM, slope, and patch density (Table 2).
Table 2.
Sources for driving forces.
2.4.2. Scenario Simulation
According to relevant studies [15], taking into account the current development situation of the XZQ and matching it with the future regional socio-economic development situation, we designed three scenarios to simulate future land use change. Partitioned simulations were also conducted for three scenarios in 2030. In the natural development scenario (ND), the trend of land use change is stable. The demands of different land use types in 2030 were obtained through the Markov chain. The land use transfer probability and neighborhood weights hardly changed. In the economic development scenario (ED), the economy is rapidly growing, and urbanization is accelerating. According to the 14th Five-Year Plan of cities, the area of farmland and forestland in 2030 should be no less than 90% of that in 2020. The area of urban expansion could increase by 131 km2, but by no more than 263 km2. The demand of other land use types was set according to the natural development scenario. In the carbon neutral scenario (CN), the amount of carbon emissions tends to largely decrease and the carbon absorption tends to increase. Urban areas, as the largest carbon source, would increase at a relatively slow rate. Forestland, one of the key carbon sinks, tends to recover. Meanwhile, farmland, another carbon emitter, tends to decrease. In terms of the partitioned simulation, the setting of land demands in the ND/ED was consistent with that in the entire region’s simulation. The total amount of construction land and forestland in the CN was equal to that in the entire region’s simulation.
2.4.3. Other Key Parameters in the PLUS Model
Land use change transfer rules, neighborhood weight, and restricted area are the key parameters in the PLUS model. We used unified transfer rules in different simulation scenarios (Table 3). The neighborhood weight was determined by the proportion of land use change area of a certain type to the total land use change area [29]. Ecological protection redlines were regarded as restricted areas in the three simulation scenarios.
Table 3.
Land use change transfer rules.
2.4.4. Model Validation
The accuracy of the simulation was tested based on the land use data in 2020. We predicted the land use in 2020 according to the input area of different land use type equal to the area of true land use in 2020. Kappa was used to evaluate the accuracy [53]. Generally, the model was reliable when the Kappa value is above 0.8. Kappa can be expressed as follows:
where , , and are the correct proportion of the simulation results, the random case’s results, and the simulation with the ideal classification, respectively.
2.5. Carbon Emission Estimation
In this study, we adopted the carbon emission coefficient method to estimate the amount of carbon emissions. The carbon emission coefficient of farmland, forestland, grassland, wetland, construction land, and unused land was 0.461, −5.052, −0.949, −0.253, 90.14, and −0.005, respectively [15]. The amount of carbon emissions can be expressed as follows:
where is the total net carbon emissions, and are the area and carbon emission coefficient of land use type , respectively. is the number of land use types.
3. Results
3.1. Land Use Change from 2010 to 2020 in the XZQ Metropolitan Circle
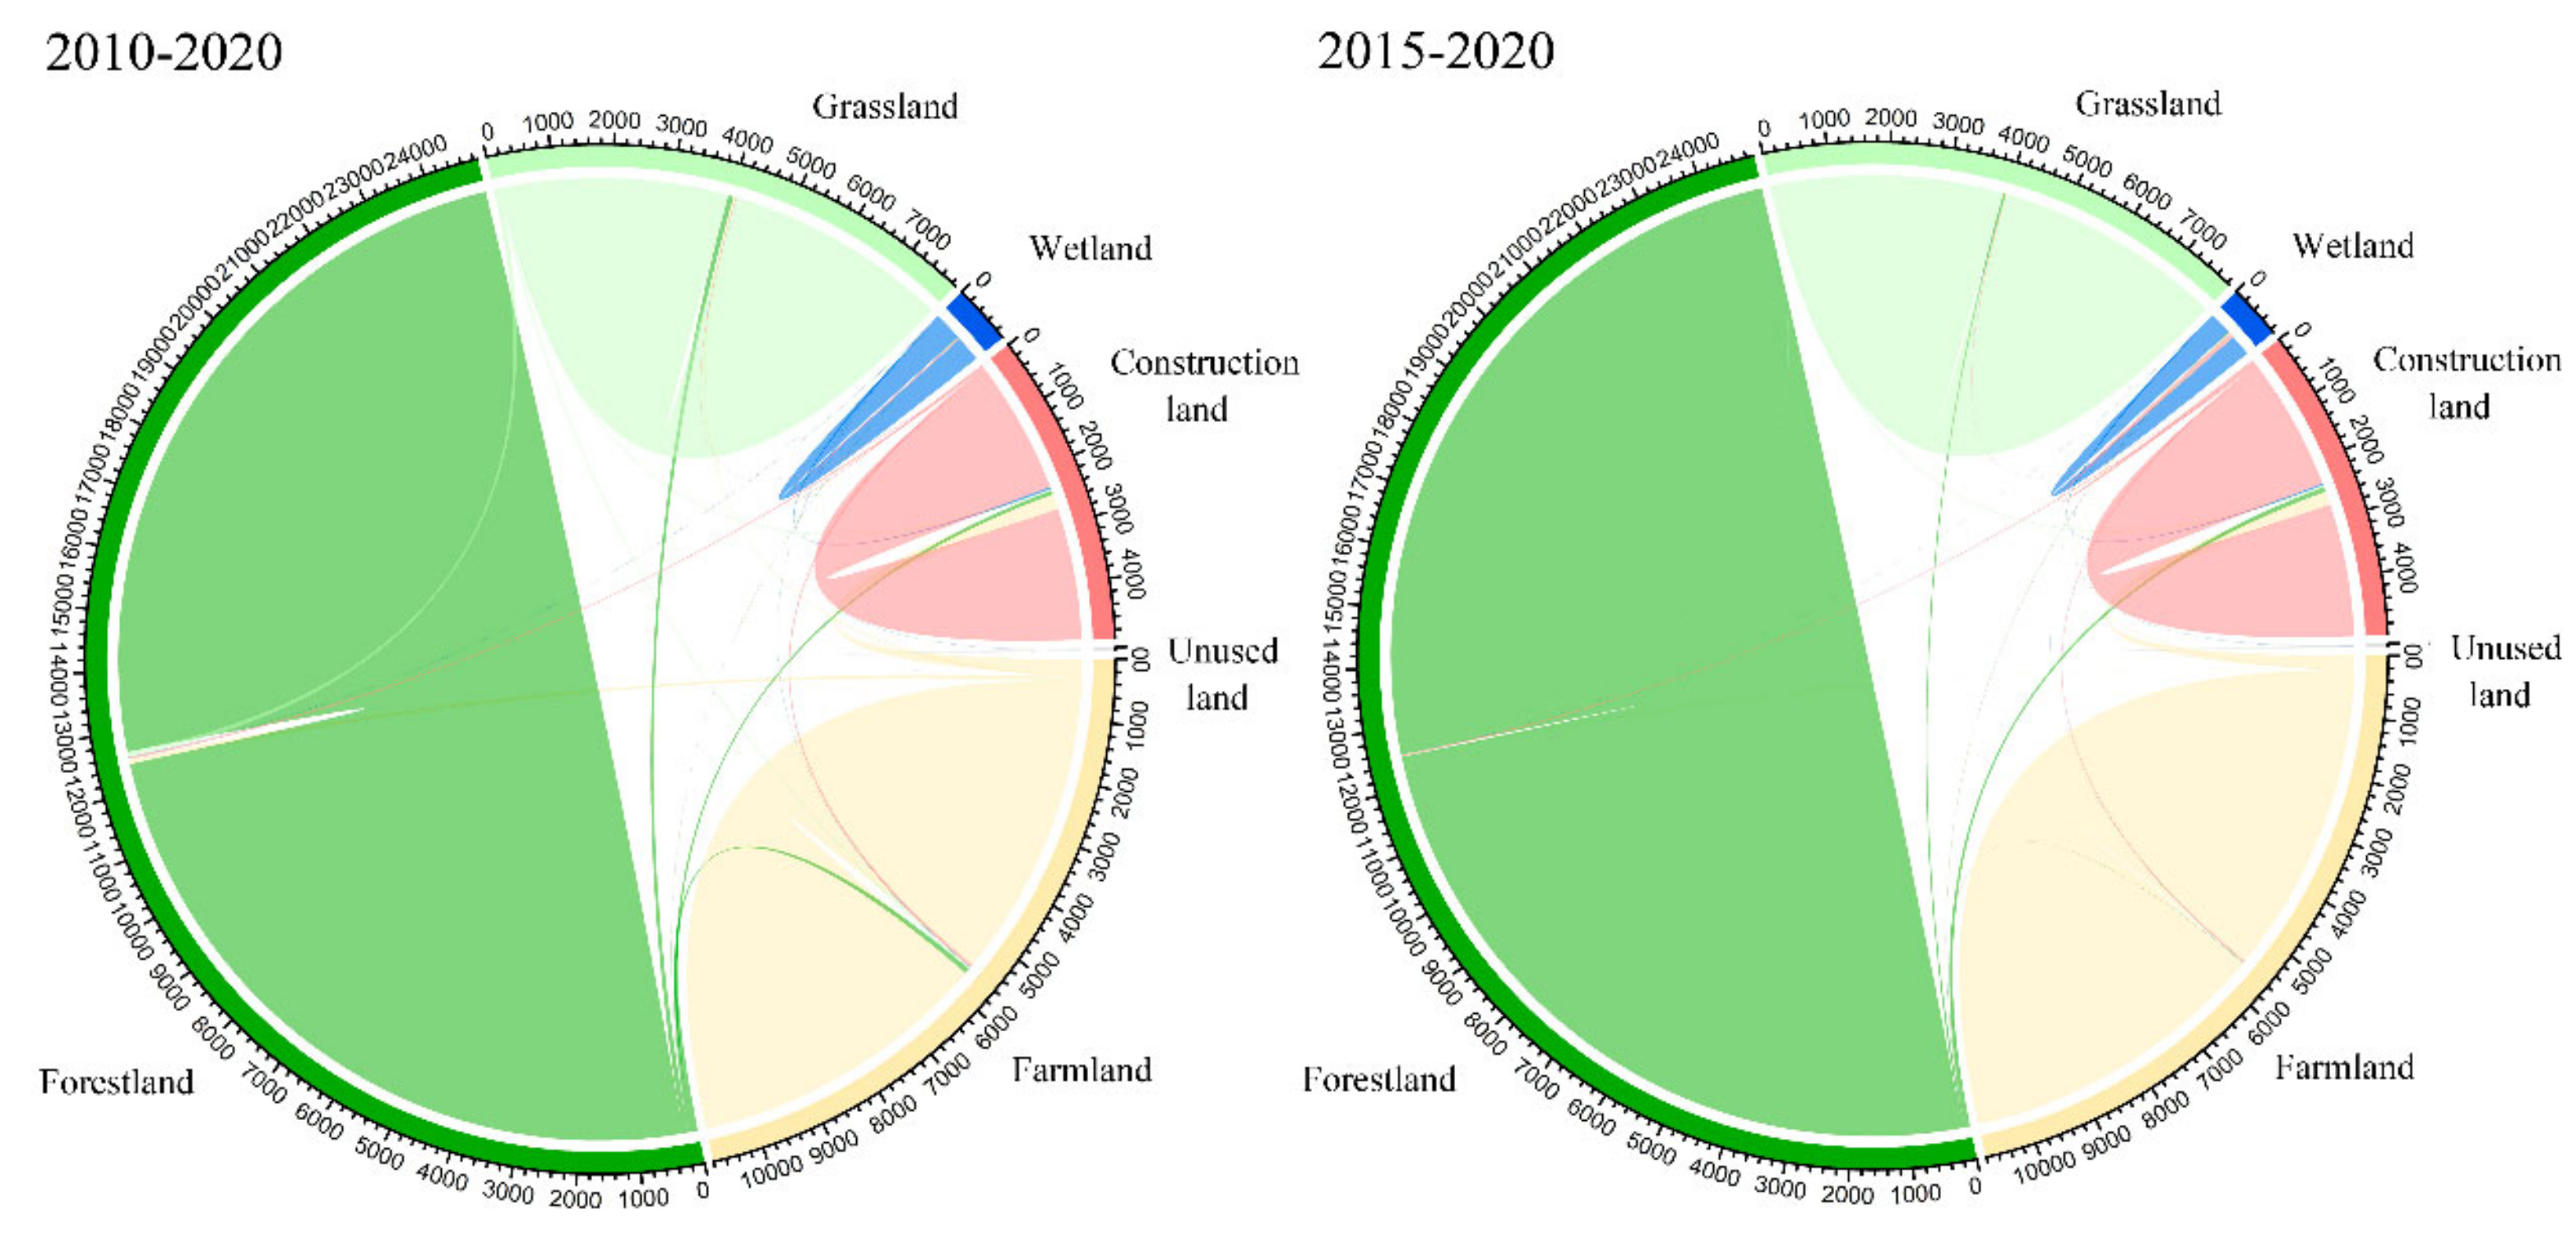
Forestland and farmland covered 50.3% (12,454.9 km2) and 22.2% (5509.2 km2) of the entire region in 2010, respectively (Figure 3 and Figure 4; Table 4). However, farmland experienced a decrease by 3.9% (215.4 km2 net loss), whereas the forestland changed little by 2020. The grassland and wetland decreased by 14.8 km2 and 2.1 km2 from 2010 to 2020. The construction land substantially expanded, with an increase of 41.0 km2 during 2010–2015 and 257.2 km2 during 2015–2020. According to the analysis above, urban expansion mainly occupied farmland.
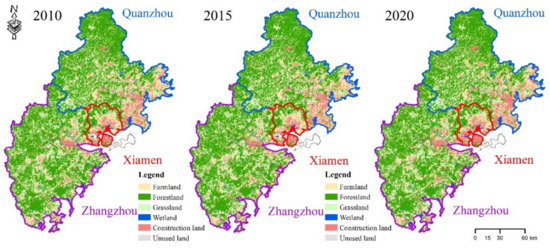
Figure 3.
Distribution of land use in 2010, 2015, and 2020 in the XZQ metropolitan circle.
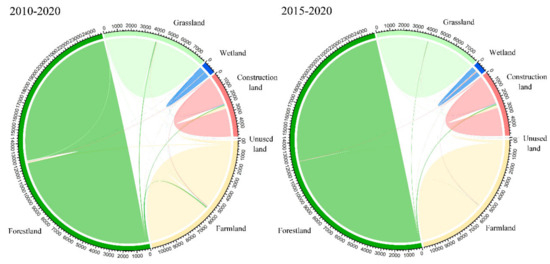
Figure 4.
Chord diagram, 2010–2020, and 2015–2020.
Table 4.
Statistics of each land use type in the XZQ metropolitan circle.
3.2. Partition Results Based on Carbon Neutrality
The carbon emission presented a high level in the northeast and southeast, especially for the area surrounding Quanzhou and Zhangzhou (Figure 5). This suggested that the land in the northeast and southeast was relatively disturbed by human activities. The carbon emission level in Xiamen was lower than that in Quanzhou and Zhangzhou, which was caused by the difference in the industrial structure between these two types of cities. The carbon absorption in the western regions was higher than that in the coastal areas. In terms of carbon neutrality, the area surrounding the main city acted as a carbon source, whereas the western regions played a key role in the carbon sink. As for the ECC, the pattern was similar to that of the carbon emissions. The pattern of the ESC corresponded to the carbon absorption. The main types were the carbon sink function zone and the high-carbon optimization zone. The carbon sink function zone was concentrated in the western region, whereas the high-carbon optimization zone was concentrated in Xiamen, Zhangzhou, and Quanzhou. Only two counties belonged to the low-carbon development zone, and one county belonged to the carbon intensity control zone.
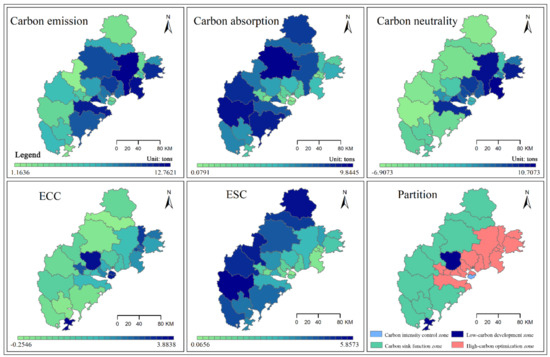
Figure 5.
Partition results are based on carbon neutrality.
3.3. Future Land Use Dynamics in Three Scenarios
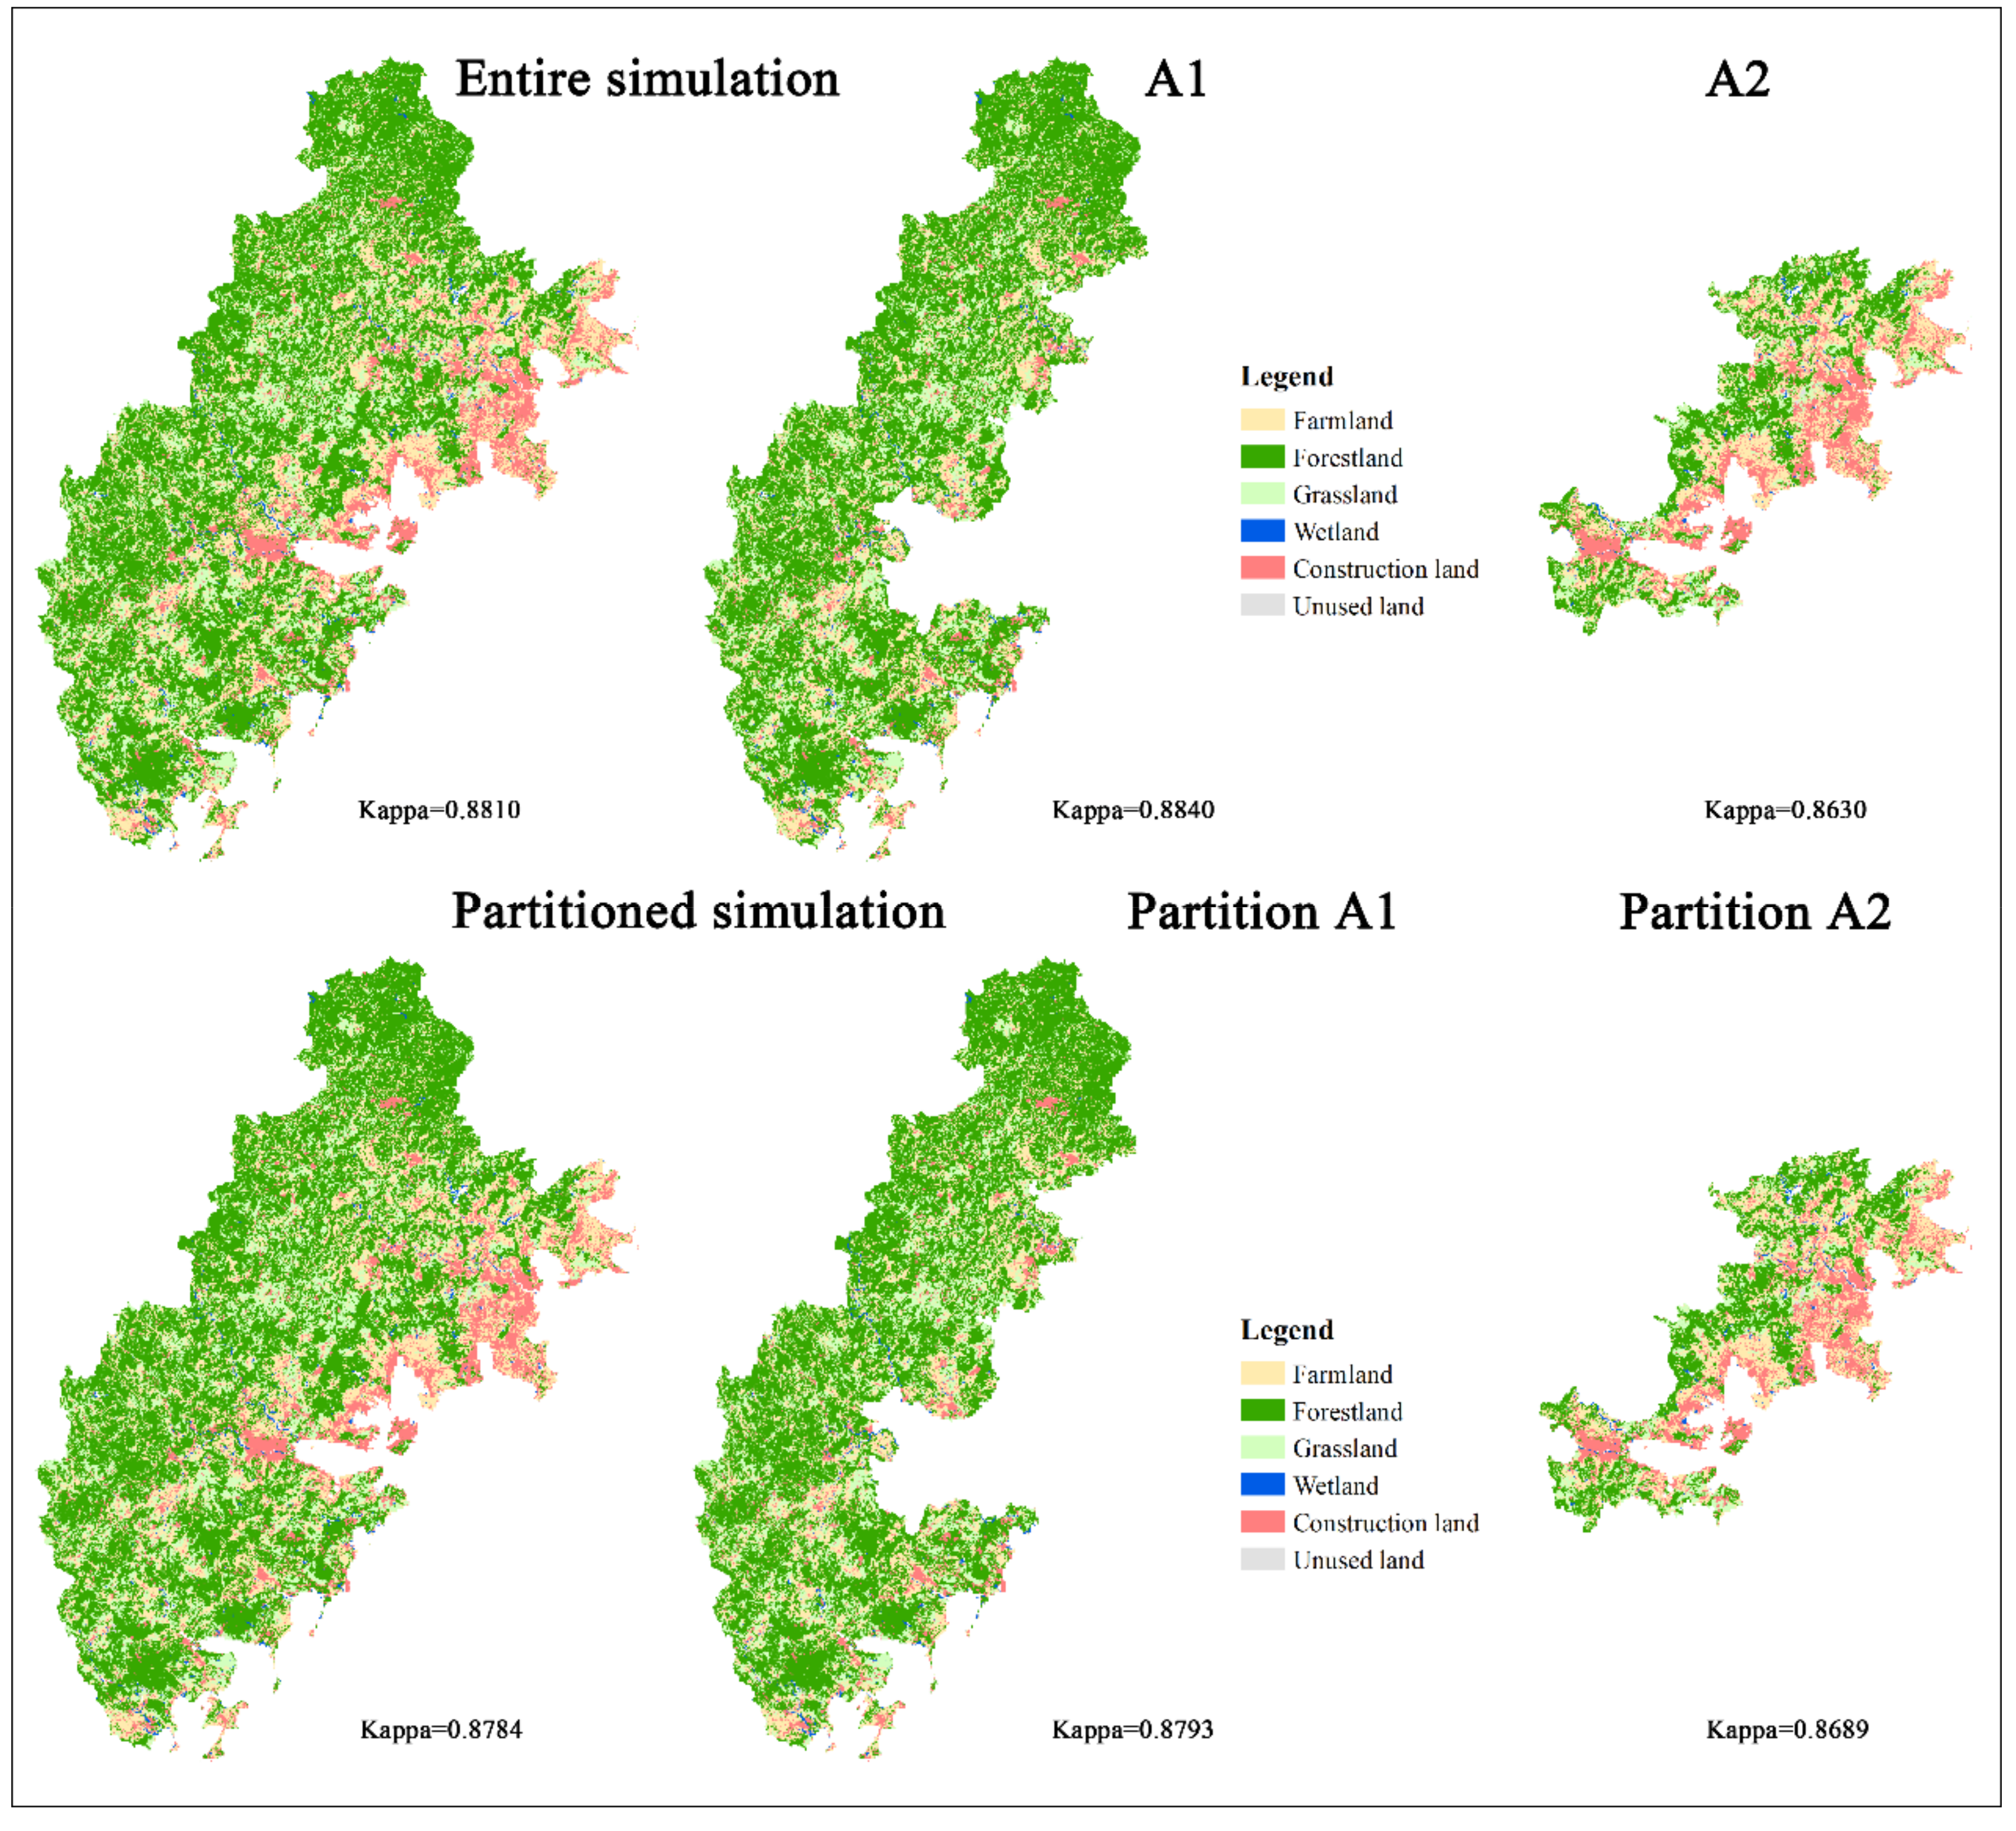
Based on the partitioned results, we merged the low-carbon development zone into the carbon sink function zone (Partition A1) and merged the carbon intensity control zone into the high-carbon optimization zone (Partition A2) for the simulation. The future land use in 2030 was simulated based on the entire region and the partitioned areas, respectively. Two aspects of comparison were carried out, as follows: the partition simulation results of the XZQ metropolitan circle were compared with the corresponding results extracted from non-partition simulation; the partitioned simulation results were fused and inlaid and were then compared with the non-partitioned simulation results of the XZQ. The difference in Kappa coefficients of the entire simulation result and the partitioned simulation result was not obvious (Figure 6). The partitioned PLUS model performed better than the entire PLUS model in the developed areas, but performed worse in undeveloped areas.
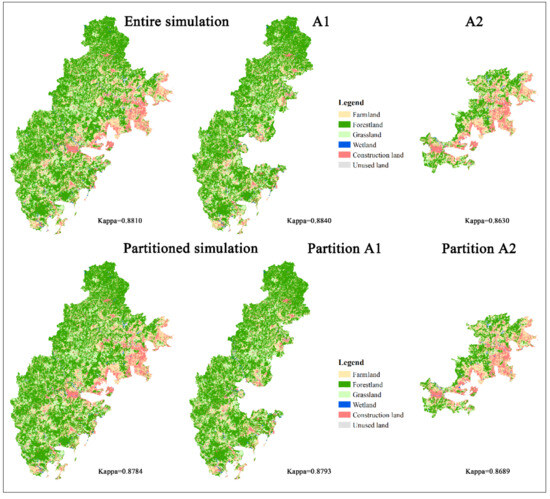
Figure 6.
Model validation: the nonpartitioned simulation results and the partitioned simulation results, 2020.
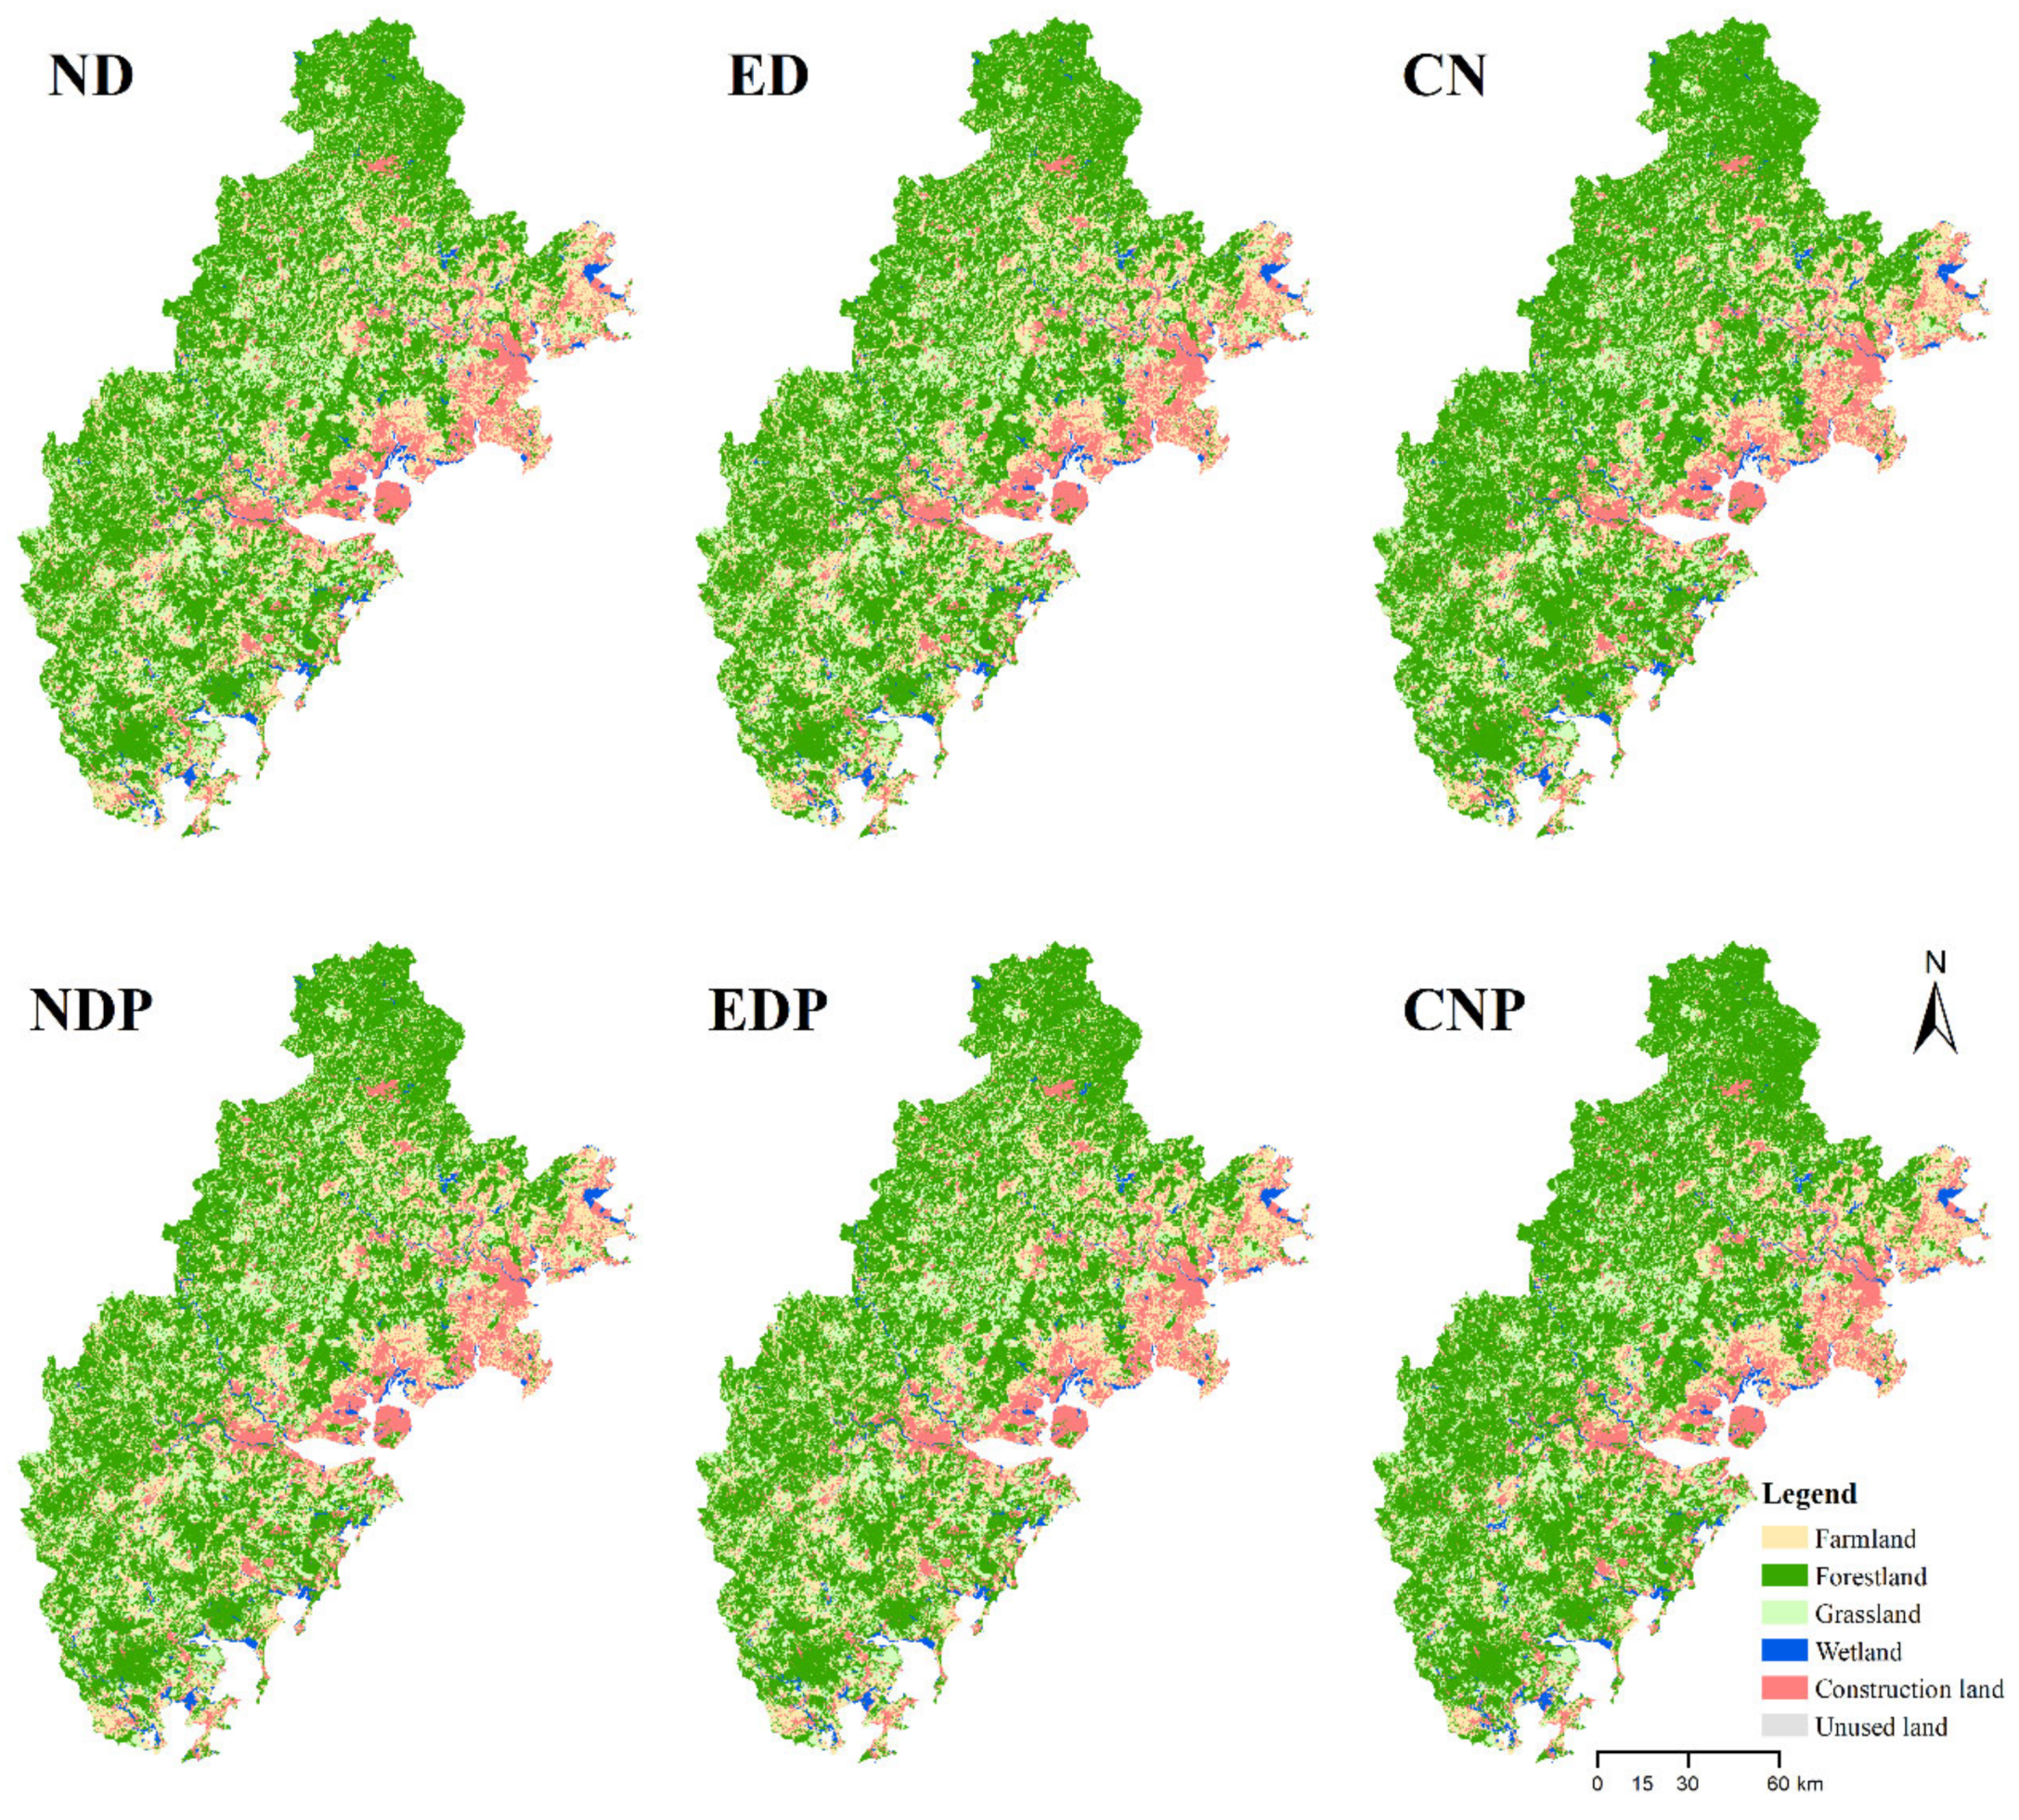
In the ND, the areas of farmland, forestland, grassland, wetland, and construction land were 5153.7 km2, 12,371.3 km2, 3909.9 km2, 473.7 km2, and 2847.7 km2, respectively (Figure 7; Table 5). Compared to the situation in 2020, the construction land increased by 215.5 km2, the farmland displayed a significant decrease by 138.1 km2, followed by the forestland, grassland, and wetland, with decreases of 44.8 km2, 19.7 km2, and 12.8 km2, respectively. This suggests that maintaining the current level of economic development would lead to the continuous rapid expansion of construction land, along with the substantial loss of farmland. In the ED, the construction land increased by 261.0 km2, and the farmland decreased by 224.2 km2, compared to the situation in 2020. The total natural land (forestland, grassland, and wetland) decreased by 36.7 km2. This suggests that farmland would have a high loss with urbanization, and the natural land would be somewhat protected. In the CN, the main land use change was the conversion of farmland into forestland. The loss of farmland was 1322.3 km2, and the increase in forestland was 1226.0 km2. Meanwhile, the construction land increased by 129.5 km2, whose growth rate (4.9%) was lower than that for the ND (8.2%) and ED (9.9%). The amount of the land use change area in the partitioned simulations was similar to that in the nonpartitioned simulations, but the land use change acquired from these two simulation types presented different spatial distributions. For example, the increased construction land was mainly distributed in Huian, Jinjiang, and Nanan in the ED with nonpartitioned simulation; however, it was concentrated in Longhai and Nanan in the ED with the partitioned simulation.
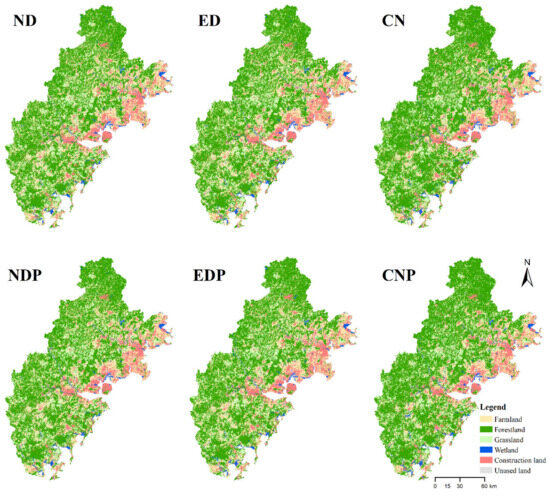
Figure 7.
Distribution of land use in 2030 under three scenarios.
Table 5.
Area statistics of land use under three scenarios.
3.4. Carbon Emissions in 2030 in the Three Scenarios
In 2020, the land use carbon emission was 1731.2 × 104 tons. In 2030, the land use carbon emissions would reach 1927.4 × 104 tons, 1966.6 × 104 tons, and 1780.2 × 104 tons with the entire simulation in the ND, ED, and CN scenarios, respectively. And according to the partitioned simulation results, the land use carbon emission would decrease by 5.0 × 10⁴ tons and 0.2 × 10⁴ tons in the ND and CN scenarios, but would increase by 13.1 × 10⁴ tons in the ED scenario.
The carbon emissions of partition A2 accounted for 83.4%, 83.8%, and 87.3% of the total carbon emissions of the entire simulation in the ND, ED, and CN scenarios, respectively. Partitioned development would not change the trend, but would decrease slightly more so than that the entire simulation, with a 0.5%, 1.2%, and 1.2% drop in the ND, ED, and CN scenarios, respectively. Compared to the ND, the land use carbon emissions of partition A1 decreased by 2.1 × 10⁴ tons and 93.5 × 10⁴ tons in the ED and CN scenarios, respectively.
At the county scale, the carbon emissions tended to significantly decrease in Dehua and Zhangpu, but significantly increase in Huian, Jinjiang, and Nanan in the ED scenario, compared to the situation in the ND scenario (Figure 8). The land use carbon emissions in the CN scenario were lower than those in the EDP. In terms of the partitioned simulation, the land use carbon emissions in the EDP exhibited an increasing trend compared to that in the NDP. Longhai and Nanan experienced the highest increase in land use carbon emissions with amounts of 10.9 × 10⁴ tons and 7.6 × 10⁴ tons, respectively. The pattern of carbon emission change was similar to that in the CN scenario.

Figure 8.
Carbon emission change at the county scale in 2030 in the three scenarios.
4. Discussion
4.1. The Partitions’ Applicability
It has become a consensus that zoning and classification strategies could be employed to solve ecological issues. Since the scholars always conducted the zoning studies based on their specific purposes, there is an inconsistency among the partition results. High spatial heterogeneity exists in the XZQ due to different levels of economic development, elevations, locations, and land use patterns. Previous studies have proposed some sub-region schemes by adopting the natural breakpoint method, k-means cluster algorithms, and self-organizing maps according to land use attributes [54,55]. Recently, increasing attention was paid to carbon partitions [39,40,56,57]. Because carbon emission intensity was closely related to the land use type [58], the land use spatial zoning in view of carbon neutrality was reasonable. The number of sub-region needs to be predetermined. Usually, 4–6 partitions are suitable, which is not redundant or less uncertain. In this study, we divided the whole region into four sub-regions according to our classification system. The distribution of the carbon sink function zone and high-carbon optimization zone were agglomeration and spatial continuity. On the contrary, there were few carbon intensity control zones and low-carbon development zones. This pattern is common for developing countries, but it would be reversed for the developed countries.
The dominant driving forces and their strengths were different for the subregions of a specific area. Thus, simulating an entire region and applying one transition rule might be less accurate. Additionally, neighborhood effects also affected the calculation in a land use simulation [59]. In this study, we both considered the partitioned transition rule and neighborhood weight. However, the partitioned PLUS model still assumed that the transition rate was stable in the same partition, which might lower the accuracy of the simulation results due to the dramatic land use change. Our results indicated that the partitions based on carbon neutrality can capture the main characteristics of the land use change in subregions.
Policies play an indispensable role in regional ecosystem management and carbon emissions. Since 2010, various policies have been released to continuously advance high-quality development, such as the permanent basic farmland delineation, the arable land occupation, replenishment balance, and the land consolidation project. According to our results, there is still a large amount of farmland occupied due to the relatively low farmland occupation cost and the flat terrain characteristics of farmland. In other words, the occupation of farmland still occurs during the process of urbanization. Some ecological protection projects are having a positive effect, such as returning the grain plots to forestry, and the mountain–river–forest–farmland–lake–grassland system project [60]. Our results indicated that the forestland experienced little loss from 2010 to 2020. Of course, there is a spatial heterogeneity for the effectiveness of the above policies.
In this study, we applied the partition results to explore the effects on land use change and carbon emissions. It has to be mentioned that the partitioned results can be improved by optimizing the classification system, dominant driving forces, policies, etc.
4.2. Path Way to Achieve Carbon Neutrality
The differentiated low-carbon strategies are beneficial for achieving the goal of “carbon neutrality”. Regional integrated development should be promoted, particularly in the core urban area (Xiamen, Zhangzhou, and Quanzhou). Meanwhile, differentiation in the coastal areas and inland areas should be considered. The coordination of land use demand and the complement of land use types should be considered in land use planning. For example, an industry transfer from the coastal area to the inland areas would be beneficial to maximize resources and achieve common prosperity. Therefore, urban expansion in the inland areas should be encouraged. Additionally, the expansion of construction land in coastal areas should pay close attention to the land utilization efficiency.
At the county scale, the adjustment of land use structures should refer to the ECC and ESC results. For example, Changtai had a high ECC and a low ESC, which meant on the one hand, the natural land (forestland, grassland, and wetland) must be strictly protected, and on the other hand, more low-carbon industries should be developed. Similarly, the Siming district of Xiamen also had a high ECC and a low ESC. For these areas, both the adjustment of the industrial structure and the fine management of the limited natural resources should be enhanced at the same time.
Countries around the world have successively formulated carbon neutrality measures. Though urban growth patterns and changes were different in the urban agglomerations, regional differences objectively exist [61]. The carbon neutrality strategy can provide references for similar regions. Zone-based policy implementation, the coordinated development between carbon sink function zone and high-carbon optimization zone, would be meaningful.
4.3. Limitations and Future Research
Here are some limitations of this study. Firstly, the selected county-level CO2 emissions and sequestration data in 2017 were applied due to limited data availability. They might be slightly different from those in 2020. Secondly, driving factors were stable in land use simulations, which could lead to the results’ uncertainty. Thirdly, the partition based on carbon neutrality was coarse, and there were some economic and physical geographical differences within the county. In future, it is urgent and necessary to develop a more accurate and precise partition method for the county interior areas.
5. Conclusions
The dominant landscapes in the XZQ were forestland and farmland during 2010–2020, accounting for 71.5% of the total land area. The main characteristic was that the construction land occupied the farmland, with 260.2 km2 of farmland being converted into construction land. Comprehensive partitioned categories based on carbon neutrality were proposed, and the partitioned results indicated that the main types were a carbon sink function zone (mainly distributed in the western region) and a high-carbon optimization zone (mainly concentrated in the urban area and its surroundings). By integrating a series of driving forces, the non-partitioned and partitioned PLUS models were adopted to simulate the future land use change in 2030 in three scenarios (i.e., ND, ED, and CN). The accuracy of the PLUS model was improved by 19.85% in the partitioned simulation compared to that in the non-partitioned simulation. The simulation results indicated that the construction land would continue to expand by 215.5 km2, 261.0 km2, and 129.5 km2 in the ND, ED, and CN scenarios, respectively. Correspondingly, the area of farmland would decrease by 138.1 km2, 224.2 km2, and 1322.3 km2 in the ND, ED, and CN scenarios, respectively. The large difference between the changes in farmland and construction land in the CN scenario was due to the fact that a large portion of farmland would be converted into forestland. The amount of carbon emissions would increase by 196.2 × 10⁴ tons and 235.4 × 10⁴ tons in the ND and the ED scenarios, but would decrease by 49.0 × 10⁴ tons in the CN scenario. The carbon emissions of partition A2 would account for 83.4%, 83.8%, and 87.3% of the total carbon emissions in the ND, ED, and CN scenarios, respectively.
The partitioned simulation results revealed that zoning development would not change the trend of carbon emissions, and it would only bring a slight decrease in carbon emissions, with a 0.5%, 1.2%, and 1.2% drop in the ND, ED, and CN scenarios, respectively. At the county scale, the land use carbon emissions showed significant spatial differences. Regional integrated development, differentiated development for the coastal areas and inland, could mitigate the deficiency at the city scale, and thus policymakers should attach great importance to these aspects in terms of the XZQ development planning. This study made a beneficial attempt to partition based on carbon neutrality by improving the PLUS model’s simulation results and carbon emission assessment, which could provide methods and references for future similar studies. Additionally, comprehensively understanding the land use change and their effects on carbon emissions was beneficial to achieve carbon neutrality and regional sustainable development. In future research, the zoning research could be conducted at a finer scale, since the partition results were relatively coarse in this study.
Author Contributions
Z.L.: Writing—original draft, Visualization. D.W.: Writing—review and editing, Software, Funding acquisition. B.W.: Conceptualization, Writing—review and editing, Funding acquisition. N.L.: Software, Methodology. All authors have read and agreed to the published version of the manuscript.
Funding
The authors would like to thank the editor and the anonymous reviewers for their helpful and constructive comments that have greatly contributed to improving the final version of this manuscript. This work is supported by the Guangzhou Basic and Applied Basic Research Foundation (No. 2023A04J0945) and the Chinese Academy of Engineering (2023-HYZD-04).
Institutional Review Board Statement
Not applicable.
Informed Consent Statement
Not applicable.
Data Availability Statement
The data that support the findings of this study are available from the corresponding author upon reasonable request.
Conflicts of Interest
The authors declare no conflicts of interest.
References
- Haase, D.; Haase, A.; Kabisch, N.; Kabisch, S.; Rink, D. Actors and factors in land-use simulation: The challenge of urban shrinkage. Environ. Modell. Softw. 2012, 35, 92–103. [Google Scholar] [CrossRef]
- Grimmond, S. Urbanization and global environmental change: Local effects of urban warming. Geogr. J. 2007, 173, 83–88. [Google Scholar] [CrossRef]
- Albert, J.S.; Carnaval, A.C.; Flantua, S.G.A.; Lohmann, L.G.; Ribas, C.C.; Riff, D.; Carrillo, J.D.; Fan, Y.; Figueiredo, J.J.P.; Guayasamin, J.M.; et al. Human impacts outpace natural processes in the Amazon. Science 2023, 379, eabo5003. [Google Scholar] [CrossRef] [PubMed]
- Song, X.-P.; Hansen, M.C.; Stehman, S.V.; Potapov, P.V.; Tyukavina, A.; Vermote, E.F.; Townshend, J.R. Global land change from 1982 to 2016 (vol 560, pg 639, 2018). Nature 2018, 563, E26. [Google Scholar] [CrossRef] [PubMed]
- Steffen, W.; Grinevald, J.; Crutzen, P.; McNeill, J. The Anthropocene: Conceptual and historical perspectives. Philos. Trans. R. Soc. A-Math. Phys. Eng. Sci. 2011, 369, 842–867. [Google Scholar] [CrossRef] [PubMed]
- Foley, J.A.; DeFries, R.; Asner, G.P.; Barford, C.; Bonan, G.; Carpenter, S.R.; Chapin, F.S.; Coe, M.T.; Daily, G.C.; Gibbs, H.K.; et al. Global consequences of land use. Science 2005, 309, 570–574. [Google Scholar] [CrossRef] [PubMed]
- Kulmala, M.; Kokkonen, T.V.; Pekkanen, J.; Paatero, S.; Petaja, T.; Kerminen, V.-M.; Ding, A. Opinion: Gigacity—A source of problems or the new way to sustainable development. Atmos. Chem. Phys. 2021, 21, 8313–8322. [Google Scholar] [CrossRef]
- Li, C.; Liu, M.; Hu, Y.; Wang, H.; Zhou, R.; Wu, W.; Wang, Y. Spatial distribution patterns and potential exposure risks of urban floods in Chinese megacities. J. Hydrol. 2022, 610, 127838. [Google Scholar] [CrossRef]
- Seto, K.C.; Gueneralp, B.; Hutyra, L.R. Global forecasts of urban expansion to 2030 and direct impacts on biodiversity and carbon pools. Proc. Natl. Acad. Sci. USA 2012, 109, 16083–16088. [Google Scholar] [CrossRef] [PubMed]
- Liu, X.; Huang, Y.; Xu, X.; Li, X.; Li, X.; Ciais, P.; Lin, P.; Gong, K.; Ziegler, A.D.; Chen, A.; et al. High-spatiotemporal-resolution mapping of global urban change from 1985 to 2015. Nat. Sustain. 2020, 3, 564–570. [Google Scholar] [CrossRef]
- Zhou, W.; Yu, W.; Qian, Y.; Han, L.; Pickett, S.T.A.; Wang, J.; Li, W.; Ouyang, Z. Beyond city expansion: Multi-scale environmental impacts of urban megaregion formation in China. Natl. Sci. Rev. 2022, 9, nwab107. [Google Scholar] [CrossRef]
- Pickett, S.T.A.; Cadenasso, M.L.; Childers, D.L.; McDonnell, M.J.; Zhou, W. Evolution and future of urban ecological science: Ecology in, of, and for the city. Ecosyst. Health Sustain. 2016, 2, e01229. [Google Scholar] [CrossRef]
- Fu, B.; Liu, Y.; Meadows, M.E. Ecological restoration for sustainable development in China. Natl. Sci. Rev. 2023, 10, nwad033. [Google Scholar] [CrossRef] [PubMed]
- Pereira, P.; Baro, F. Greening the city: Thriving for biodiversity and sustainability. Sci. Total Environ. 2022, 817, 153032. [Google Scholar] [CrossRef] [PubMed]
- Liu, J.; Peng, K.; Zuo, C.; Li, Q. Spatiotemporal variation of land-use carbon emissions and its implications for low carbon and ecological civilization strategies: Evidence from Xiamen–Zhangzhou–Quanzhou metropolitan circle, China. Sustain. Cities Soc. 2022, 86, 104083. [Google Scholar] [CrossRef]
- Hu, X.; Li, Z.; Cai, Y.; Wu, F. Urban construction land demand prediction and spatial pattern simulation under carbon peak and neutrality goals: A case study of Guangzhou, China. J. Geogr. Sci. 2022, 32, 2251–2270. [Google Scholar] [CrossRef]
- Wen, D.; Wang, X.; Liu, J.; Xu, N.; Zhou, W.; Hong, M. Maintaining key ecosystem services under multiple development scenarios: A case study in Guangdong–Hong Kong–Macao greater bay Area, China. Ecol. Indic. 2023, 154, 110691. [Google Scholar] [CrossRef]
- Friedlingstein, P.; Jones, M.W.; O’Sullivan, M.; Andrew, R.M.; Hauck, J.; Peters, G.P.; Peters, W.; Pongratz, J.; Sitch, S.; Le Quere, C.; et al. Global Carbon Budget 2019. Earth Syst. Sci. Data 2019, 11, 1783–1838. [Google Scholar] [CrossRef]
- Gasser, T.; Crepin, L.; Quilcaille, Y.; Houghton, R.A.; Ciais, P.; Obersteiner, M. Historical CO2 emissions from land use and land cover change and their uncertainty. Biogeosciences 2020, 17, 4075–4101. [Google Scholar] [CrossRef]
- Chen, J.; Gao, M.; Cheng, S.; Hou, W.; Song, M.; Liu, X.; Liu, Y.; Shan, Y. County-level CO2 emissions and sequestration in China during 1997–2017. Sci. Data 2020, 7, 391. [Google Scholar] [CrossRef] [PubMed]
- Canedoli, C.; Ferre, C.; Abu El Khair, D.; Comolli, R.; Liga, C.; Mazzucchelli, F.; Proietto, A.; Rota, N.; Colombo, G.; Bassano, B.; et al. Evaluation of ecosystem services in a protected mountain area: Soil organic carbon stock and biodiversity in alpine forests and grasslands. Ecosyst. Serv. 2020, 44, 101135. [Google Scholar] [CrossRef]
- Cui, Y.; Li, L.; Chen, L.; Zhang, Y.; Cheng, L.; Zhou, X.; Yang, X. Land-Use Carbon Emissions Estimation for the Yangtze River Delta Urban Agglomeration Using 1994–2016 Landsat Image Data. Remote Sens. 2018, 10, 1334. [Google Scholar] [CrossRef]
- Liu, X.; Liang, X.; Li, X.; Xu, X.; Ou, J.; Chen, Y.; Li, S.; Wang, S.; Pei, F. A future land use simulation model (FLUS) for simulating multiple land use scenarios by coupling human and natural effects. Landsc. Urban Plan. 2017, 168, 94–116. [Google Scholar] [CrossRef]
- Aslani, Z.H.; Omidvar, B.; Karbassi, A. Integrated model for land-use transformation analysis based on multi-layer perception neural network and agent-based model. Environ. Sci. Pollut. Res. 2022, 29, 59770–59783. [Google Scholar] [CrossRef] [PubMed]
- Liu, M.; Li, C.; Hu, Y.; Sun, F.; Xu, Y.; Chen, T. Combining CLUE-S and SWAT models to forecast land use change and non-point source pollution impact at a watershed scale in Liaoning Province, China. Chin. Geogr. Sci. 2014, 24, 540–550. [Google Scholar] [CrossRef]
- Verburg, P.H.; Soepboer, W.; Veldkamp, A.; Limpiada, R.; Espaldon, V.; Mastura, S.S.A. Modeling the spatial dynamics of regional land use: The CLUE-S model. Environ. Manag. 2002, 30, 391–405. [Google Scholar] [CrossRef] [PubMed]
- Gao, L.; Tao, F.; Liu, R.; Wang, Z.; Leng, H.; Zhou, T. Multi-scenario simulation and ecological risk analysis of land use based on the PLUS model: A case study of Nanjing. Sustain. Cities Soc. 2022, 85, 104055. [Google Scholar] [CrossRef]
- Li, H.; Fang, C.; Xia, Y.; Liu, Z.; Wang, W. Multi-Scenario Simulation of Production-Living-Ecological Space in the Poyang Lake Area Based on Remote Sensing and RF-Markov-FLUS Model. Remote Sens. 2022, 14, 2830. [Google Scholar] [CrossRef]
- Liang, X.; Guan, Q.; Clarke, K.C.; Liu, S.; Wang, B.; Yao, Y. Understanding the drivers of sustainable land expansion using a patch-generating land use simulation (PLUS) model: A case study in Wuhan, China. Comput. Environ. Urban Syst. 2021, 85, 101569. [Google Scholar] [CrossRef]
- Gao, J.; Wang, L. Embedding spatiotemporal changes in carbon storage into urban agglomeration ecosystem management—A case study of the Yangtze River Delta, China. J. Clean. Prod. 2019, 237, 117764. [Google Scholar] [CrossRef]
- Qin, J.; Ou, D.; Gao, X.; Yang, Z.; Zhong, Y.; Yang, W.; Wu, J.; Yang, Y.; Liu, Y.; Sun, J.; et al. Synergizing economic growth and carbon emission reduction in China: A path to coupling the MFLP and PLUS models for optimizing the territorial spatial functional pattern. Sci. Total Environ. 2024, 929, 171926. [Google Scholar] [CrossRef] [PubMed]
- Rong, T.; Zhang, P.; Zhu, H.; Jiang, L.; Li, Y.; Liu, Z. Spatial correlation evolution and prediction scenario of land use carbon emissions in China. Ecol. Inform. 2022, 71, 101802. [Google Scholar] [CrossRef]
- Bacani, V.M.; da Silva, B.H.M.; Sato, A.; Sampaio, B.D.S.; da Cunha, E.R.; Vick, E.P.; de Oliveira, V.F.R.; Decco, H.F. Carbon storage and sequestration in a eucalyptus productive zone in the Brazilian Cerrado, using the Ca-Markov/Random Forest and InVEST models. J. Clean. Prod. 2024, 444, 141291. [Google Scholar] [CrossRef]
- Wu, X.Y.; Shen, C.T.; Shi, L.N.; Wan, Y.Y.; Ding, J.M.; Wen, Q. Spatio-temporal evolution characteristics and simulation prediction of carbon storage: A case study in Sanjiangyuan Area, China. Ecol. Inform. 2024, 80, 102485. [Google Scholar] [CrossRef]
- Guo, Y.; Tong, Z.H.; Chen, H.L.; Wang, Z.B.; Yao, Y.F. Heterogeneity study on mechanisms influencing carbon emission intensity at the county level in the Yangtze River Delta urban Agglomeration: A perspective on main functional areas. Ecol. Indic. 2024, 159, 111597. [Google Scholar] [CrossRef]
- Huang, L.; Chen, X.H.; Ye, C.X.; Yuan, Z.; He, K.L. Multiscale effects and drivers of landscape heterogeneity for water-related ecosystem services in urban agglomerations. Hydrol. Process. 2024, 38, e15081. [Google Scholar] [CrossRef]
- Wang, H.; Wan, Q.N.; Huang, W.; Niu, J.Q. Spatial heterogeneity characteristics and driving mechanism of land use change in Henan Province, China. Geocarto Int. 2023, 38, 2271442. [Google Scholar] [CrossRef]
- Zhang, T.Y.; Cheng, C.X.; Wu, X.D. Mapping the spatial heterogeneity of global land use and land cover from 2020 to 2100 at a 1 km resolution. Sci. Data 2023, 10, 748. [Google Scholar] [CrossRef]
- Xu, Y.; Guo, N.; Ru, K.-L.; Fan, S.-L. Characteristics and optimization strategies of territorial space zone in Fujian Province, China based on carbon neutrality. Ying Yong Sheng Tai Xue Bao—J. Appl. Ecol. 2022, 33, 500–508. [Google Scholar] [CrossRef]
- Fan, Y.Q.; Wang, Y.; Han, R.M.; Li, X.Q. Spatial-Temporal Dynamics of Carbon Budgets and Carbon Balance Zoning: A Case Study of the Middle Reaches of the Yangtze River Urban Agglomerations, China. Land 2024, 13, 297. [Google Scholar] [CrossRef]
- Lu, Y.; Laffan, S.; Pettit, C. A geographically partitioned cellular automata model for the expansion of residential areas. Trans. GIS 2022, 26, 1548–1571. [Google Scholar] [CrossRef]
- Xu, Q.; Wang, Q.; Liu, J.; Liang, H. Simulation of Land-Use Changes Using the Partitioned ANN-CA Model and Considering the Influence of Land-Use Change Frequency. ISPRS Int. J. Geo-Inf. 2021, 10, 346. [Google Scholar] [CrossRef]
- Hu, S.; Zhang, Y.; Yang, Z.; Yan, D.; Jiang, Y. Challenges and opportunities for carbon neutrality in China’s building sector-Modelling and data. Build. Simul. 2022, 15, 1899–1921. [Google Scholar] [CrossRef]
- Zhang, S.; Zhong, Q.; Cheng, D.; Xu, C.; Chang, Y.; Lin, Y.; Li, B. Landscape ecological risk projection based on the PLUS model under the localized shared socioeconomic pathways in the Fujian Delta region. Ecol. Indic. 2022, 136, 108642. [Google Scholar] [CrossRef]
- Lin, T.; Xue, X.; Shi, L.; Gao, L. Urban spatial expansion and its impacts on island ecosystem services and landscape pattern: A case study of the island city of Xiamen, Southeast China. Ocean Coast. Manage. 2013, 81, 90–96. [Google Scholar] [CrossRef]
- Zhang, J.; Li, X.; Zhang, C.; Yu, L.; Wang, J.; Wu, X.; Hu, Z.; Zhai, Z.; Li, Q.; Wu, G.; et al. Assessing spatiotemporal variations and predicting changes in ecosystem service values in the Guangdong–Hong Kong–Macao Greater Bay Area. Giscience Remote Sens. 2022, 59, 184–199. [Google Scholar] [CrossRef]
- Liu, J.; Zhang, Z.; Xu, X.; Kuang, W.; Zhou, W.; Zhang, S.; Li, R.; Yan, C.; Yu, D.; Wu, S.; et al. Spatial patterns and driving forces of land use change in China during the early 21st century. J. Geogr. Sci. 2010, 20, 483–494. [Google Scholar] [CrossRef]
- Guan, D.; Liu, Z.; Geng, Y.; Lindner, S.; Hubacek, K. The gigatonne gap in China’s carbon dioxide inventories. Nat. Clim. Change 2012, 2, 672–675. [Google Scholar] [CrossRef]
- Shan, Y.; Guan, D.; Zheng, H.; Ou, J.; Li, Y.; Meng, J.; Mi, Z.; Liu, Z.; Zhang, Q. Data Descriptor: China CO2 emission accounts 1997–2015. Sci. Data 2018, 5, 170201. [Google Scholar] [CrossRef] [PubMed]
- Wang, Y.; van Vliet, J.; Debonne, N.; Pu, L.; Verburg, P.H. Settlement changes after peak population: Land system projections for China until 2050. Landsc. Urban Plan. 2021, 209, 104045. [Google Scholar] [CrossRef]
- Liao, J.; Shao, G.; Wang, C.; Tang, L.; Huang, Q.; Qiu, Q. Urban sprawl scenario simulations based on cellular automata and ordered weighted averaging ecological constraints. Ecol. Indic. 2019, 107, 105572. [Google Scholar] [CrossRef]
- Wang, X.; Wen, Y.; Liu, X.; Wen, D.; Long, Y.; Zhao, P.; Liu, P.; Zhong, J. Protection Effect and Vacancy of the Ecological Protection Redline: A Case Study in Guangdong–Hong Kong–Macao Greater Bay Area, China. Remote Sens. 2021, 13, 5171. [Google Scholar] [CrossRef]
- Pontius, R.G.; Schneider, L.C. Land-cover change model validation by an ROC method for the Ipswich watershed, Massachusetts, USA. Agric. Ecosyst. Environ. 2001, 85, 239–248. [Google Scholar] [CrossRef]
- Ke, X.; Qi, L.; Zeng, C. A partitioned and asynchronous cellular automata model for urban growth simulation. Int. J. Geogr. Inf. Sci. 2016, 30, 637–659. [Google Scholar] [CrossRef]
- Qian, Y.; Xing, W.; Guan, X.; Yang, T.; Wu, H. Coupling cellular automata with area partitioning and spatiotemporal convolution for dynamic land use change simulation. Sci. Total Environ. 2020, 722, 137738. [Google Scholar] [CrossRef] [PubMed]
- Li, H.R.; Liu, Y.; Li, Y.X.; Li, X.X.; Yan, S.Y.; Zheng, X. How to Realize Synergistic Emission Reduction in Future Urban Agglomerations: Spatial Planning Approaches to Reducing Carbon Emissions from Land Use: A Case Study of the Beijing–Tianjin–Hebei Region. Land 2024, 13, 554. [Google Scholar] [CrossRef]
- Liu, C.; Wang, X.M.; Li, H.Y. County-Level Land Use Carbon Budget in the Yangtze River Economic Belt, China: Spatiotemporal Differentiation and Coordination Zoning. Land 2024, 13, 215. [Google Scholar] [CrossRef]
- Wang, H.; Lu, S.; Lu, B.; Nie, X. Overt and covert: The relationship between the transfer of land development rights and carbon emissions. Land Use Pol. 2021, 108, 105665. [Google Scholar] [CrossRef]
- Liao, J.; Tang, L.; Shao, G.; Su, X.; Chen, D.; Xu, T. Incorporation of extended neighborhood mechanisms and its impact on urban land-use cellular automata simulations. Environ. Modell. Softw. 2016, 75, 163–175. [Google Scholar] [CrossRef]
- Fu, H.W.; Yan, Y.D. Ecosystem service value assessment in downtown for implementing the “Mountain-River-Forest-Cropland-Lake-Grassland system project”. Ecol. Indic. 2023, 154, 110751. [Google Scholar] [CrossRef]
- He, Q.; Zeng, C.; Xie, P.; Tan, S.; Wu, J. Comparison of urban growth patterns and changes between three urban agglomerations in China and three metropolises in the USA from 1995 to 2015. Sustain. Cities Soc. 2019, 50, 101649. [Google Scholar] [CrossRef]


Disclaimer/Publisher’s Note: The statements, opinions and data contained in all publications are solely those of the individual author(s) and contributor(s) and not of MDPI and/or the editor(s). MDPI and/or the editor(s) disclaim responsibility for any injury to people or property resulting from any ideas, methods, instructions or products referred to in the content. |
© 2024 by the authors. Licensee MDPI, Basel, Switzerland. This article is an open access article distributed under the terms and conditions of the Creative Commons Attribution (CC BY) license (https://creativecommons.org/licenses/by/4.0/).