Article

Comparing the Dominant Factors in Coastal Morphology: Inappropriate Infrastructure vs. Climate Change—A Case Study of the Hsinchu Fishery Harbor, Taiwan

Department of Harbor and River Engineering, National Taiwan Ocean University, Keelung City 20224, Taiwan
*
Authors to whom correspondence should be addressed.
Sustainability 2024, 16(13), 5563; https://doi.org/10.3390/su16135563
Submission received: 19 April 2024 / Revised: 24 June 2024 / Accepted: 24 June 2024 / Published: 28 June 2024
(This article belongs to the Special Issue Critical Issues in Ocean and Coastal Engineering)

Abstract

:
The construction of coastal infrastructure alters the natural hydrodynamics, leading to irreversible changes in coastal morphology. Furthermore, there has been an increasing concern about global climate change in recent years, which requires examining how climatic shifts impact the mechanisms that govern oceanic processes, the trends in morphological changes, the extent of the impacts, and the corresponding weightings assigned to coastal infrastructure. This study aims to assess the impacts of climate change on the wave distribution and coastal morphology around the two breakwaters perpendicular to the shoreline of Hsinchu Fishery Harbor in Taiwan at the end of the 21st century. The findings reveal that, by the end of the century, during extreme climatic events, such as typhoons (increasing the maximum wind speed and extreme sea levels), the wave heights around the Hsinchu Fishery Harbor, compared to the present day, may increase by 5.94% to 81.25%. Regarding the potential coastal morphological changes, erosion trends are evident around the harbor, but there is a pronounced tendency toward accretion in the sheltered area. The impact range and weightings of the Hsinchu Fishery Harbor breakwaters under climate change on coastal morphology were then determined based on historical bathymetric data and simulated bathymetric changes using the empirical orthogonal function (EOF) method. Under different-intensity climate change scenarios, the EOF analysis indicates no significant differences in the impact range and weightings on coastal morphological changes. In light of the analysis results, it is evident that structures have a much more substantial impact on coastal morphological change than climate change does.

1. Introduction

Since the middle of the 20th century, intensified human activities and increases in greenhouse gas emissions have led to global climate change, altering the existing meteorological conditions and increasing the frequency of extreme weather events [1]. However, the scope and magnitude of the impacts of climate change in coastal areas vary across different regions, highlighting the need to clarify the extent and degree of influence in specific areas and estimate the downscaling results accordingly [2]. Coastal environments, particularly those characterized by sandy coasts, experience regular alterations in coastal morphology, encompassing coastal erosion and accretion. These transformations arise from many factors, often including human activities, natural processes, or intricate interactions between the two [3]. While coastal erosion, arising from anthropogenic interventions such as establishing commercial ports, constructing groins, and developing offshore industrial parks, has garnered global attention, it remains a major concern [4]. In Taiwan, where coastal areas are vital economic and ecological zones, the deleterious impact of human-induced coastal erosion is a pressing issue that requires significant attention and proactive measures from governmental agencies [5].
The influence of climate change on coastal surroundings is also a significant issue that must be considered worldwide [6]. In Taiwan, government agencies have also formulated relevant strategies to deal with the impact of climate change on the coast [7,8]. The threat of rising sea levels along the coastal region increases the possibility of coastal disasters, including flooding, erosion, and damage to coastal defense. Based on various previous research, climate change has multiple direct effects on coastal regions. Firstly, it causes changes in rainfall patterns and variations in sediment supply within estuarine systems, which differ depending on geographic location and basin characteristics [9]. For instance, in rivers or estuaries without human influence, the amount of sand transported can vary depending on the river channel’s specific characteristics. For example, sediment levels in glacier-fed rivers will continue to decrease, while those in precipitation-fed rivers will continue to increase [10]. Furthermore, when river channels or estuaries are impacted by artificial structures, sediment fluxes in most deltas are expected to decline, primarily due to human activities rather than future climate change [11]. Secondly, Rohini [12] highlighted that the intensification of typhoons within the climate change scenario leads to significant changes in wave dynamics, encompassing changes in the maximum wind speed and maximum significant wave height. Additionally, the increase in sea surface temperatures exacerbates the impacts of typhoons in coastal regions compared to historical occurrences. Consequently, the heightened wave energy brought about by extreme typhoon events may exacerbate coastal erosion, posing significant threats to coastal areas, as demonstrated in studies on the coasts of the Philippines [13] and New Jersey [14]. Additionally, the rise in mean sea level (MSL) and the heightened intensity of typhoons contribute to changes in storm surge patterns, increasing the vulnerability of coastal areas to inundation events. This is illustrated by cases on the east coast of India [12] and the coast of South Korea [15]. Moreover, according to Rao et al. [16], the maximum water elevations are projected to rise by approximately 30% under the climate change scenarios at the end of the 21st century. The maximum water level surge will increase if a typhoon coincides with high tides during landfall. Thus, understanding the multifaceted effects of climate change on coastal environments is paramount in developing effective mitigation and adaptation strategies.
Taiwan, surrounded by the sea and situated in the subtropical monsoon region where typhoons are prevalent, frequently faces severe storms. Under the impact of climate change, the extreme events and powerful wave energy brought about by typhoons pose a significant threat to the safety and property of coastal residents [17]. According to Taiwan’s Integrated Coastal Zone Management Plan (ICZMP) [6], 13 identified coastal erosion hotspots have experienced significant changes in shoreline dynamics due to anthropogenic structures. These alterations have led to serious imbalances in the nearshore coastal morphology. However, the interaction between coastal structures and climate change has further complicated the patterns of coastal morphological evolution. Therefore, to ensure the safety of coastal residents, safeguard their property, and aid policymakers in devising strategies for future climate change adaptation and coastal management, it is imperative to comprehend the evolving trends in the influence of anthropogenic structures on coastal morphology across varying projected climate change scenarios.
To comprehend the alterations in nearshore hydrodynamic mechanisms under climate change conditions and to enhance the accuracy in predicting potential evolutionary trends in coastal morphological changes, the numerical model is very suitable for simulating and analyzing such problems to conduct scenario-based simulation studies [18]. MIKE 21 is a 2D hydrodynamic model and a widely utilized computational tool in coastal hydrodynamics. It has seen widespread utilization among scientists, serving as a useful tool to conduct simulations of nearshore wave fields in coastal areas both with and without structures [19,20] and predict seasonal hydrodynamics and cohesive sediment transport trends in estuarine [21] or nearshore coastal morphological changes driven by typhoons [22]. It is possible to study the effect of anthropogenic structures on coastal surroundings [23], as well as the interaction between marine mechanisms and structures under specific marine conditions. Comparing the simulation results allows us to assess the change in wave and current fields and the pattern of sediment transport [24,25]. Additionally, numerical models can simulate various scenarios for current and future climate conditions, allowing for predictions of coastal morphological trends under climate change scenarios [26,27].
However, intricate simulations were required to determine the dominant factors driving coastal morphological changes. The EOF analysis, also known as the principal component analysis (PCA), can provide a simple and effective way to comprehensively determine whether the impact factors of coastal morphological changes undergo alterations in climate change scenarios, as well as to identify potential spatial variations in the impact ranges of these factors. The EOF method in coastal research was first developed by Winant et al. [28] as a mathematical statistical tool to analyze and compare simulation results. It is a statistical method that is widely utilized in numerous research domains due to its capability to condense large datasets while retaining meaningful spatial structures. This analytical approach decomposes complex data into orthogonal modes with clear physical interpretations. EOF analysis has been widely utilized in numerous studies. It not only assesses the characteristic patterns of shoreline variability [29] but also links nearshore conditions to EOF models, thereby identifying the primary patterns of shoreline variability [30,31]. This method can further aid in identifying the primary factors influencing morphological changes [32] and their corresponding weightings, as well as delineating the extent of their impacts [3].
The Hsinchu Coast, recognized as one of the 13 coastal erosion hotspots by the Ministry of the Interior, Taiwan [6], is distinguished by its dual nature as an estuarine area and a location with significant anthropogenic development. Consequently, the hydrodynamic mechanisms governing the Hsinchu Coast are highly intricate. Over the past two decades, the appearance of the Hsinchu Fishery Harbor has altered the pre-existing hydrodynamic regime, resulting in substantial changes in the coastal morphology. However, with the anticipated exacerbation of the effects of climate change in the future, the presence of this anthropogenic structure—the Hsinchu Fishery Harbor—may lead to new impacts or give rise to novel challenges along the Hsinchu Coast. Therefore, the objective of this study is to utilize climate change scenario parameters from the Intergovernmental Panel on Climate Change (IPCC) and the Taiwan Climate Change Projection Information Platform (TCCIP) to simulate the trends in coastal morphological changes in the study area under the impact of climate change at the end of the 21st century, focusing on the paths of the three most influential typhoons affecting the region. The empirical orthogonal function (EOF) analysis was then conducted to determine the impact factors of coastal morphological changes in the present state and the climate change scenario at the end of the 21st century. As the structure has remained unchanged, it was feasible to analyze whether the impact of the structures on coastal morphology varied under climate change. The anthropogenic influences can be thus derived.

2. Study Area

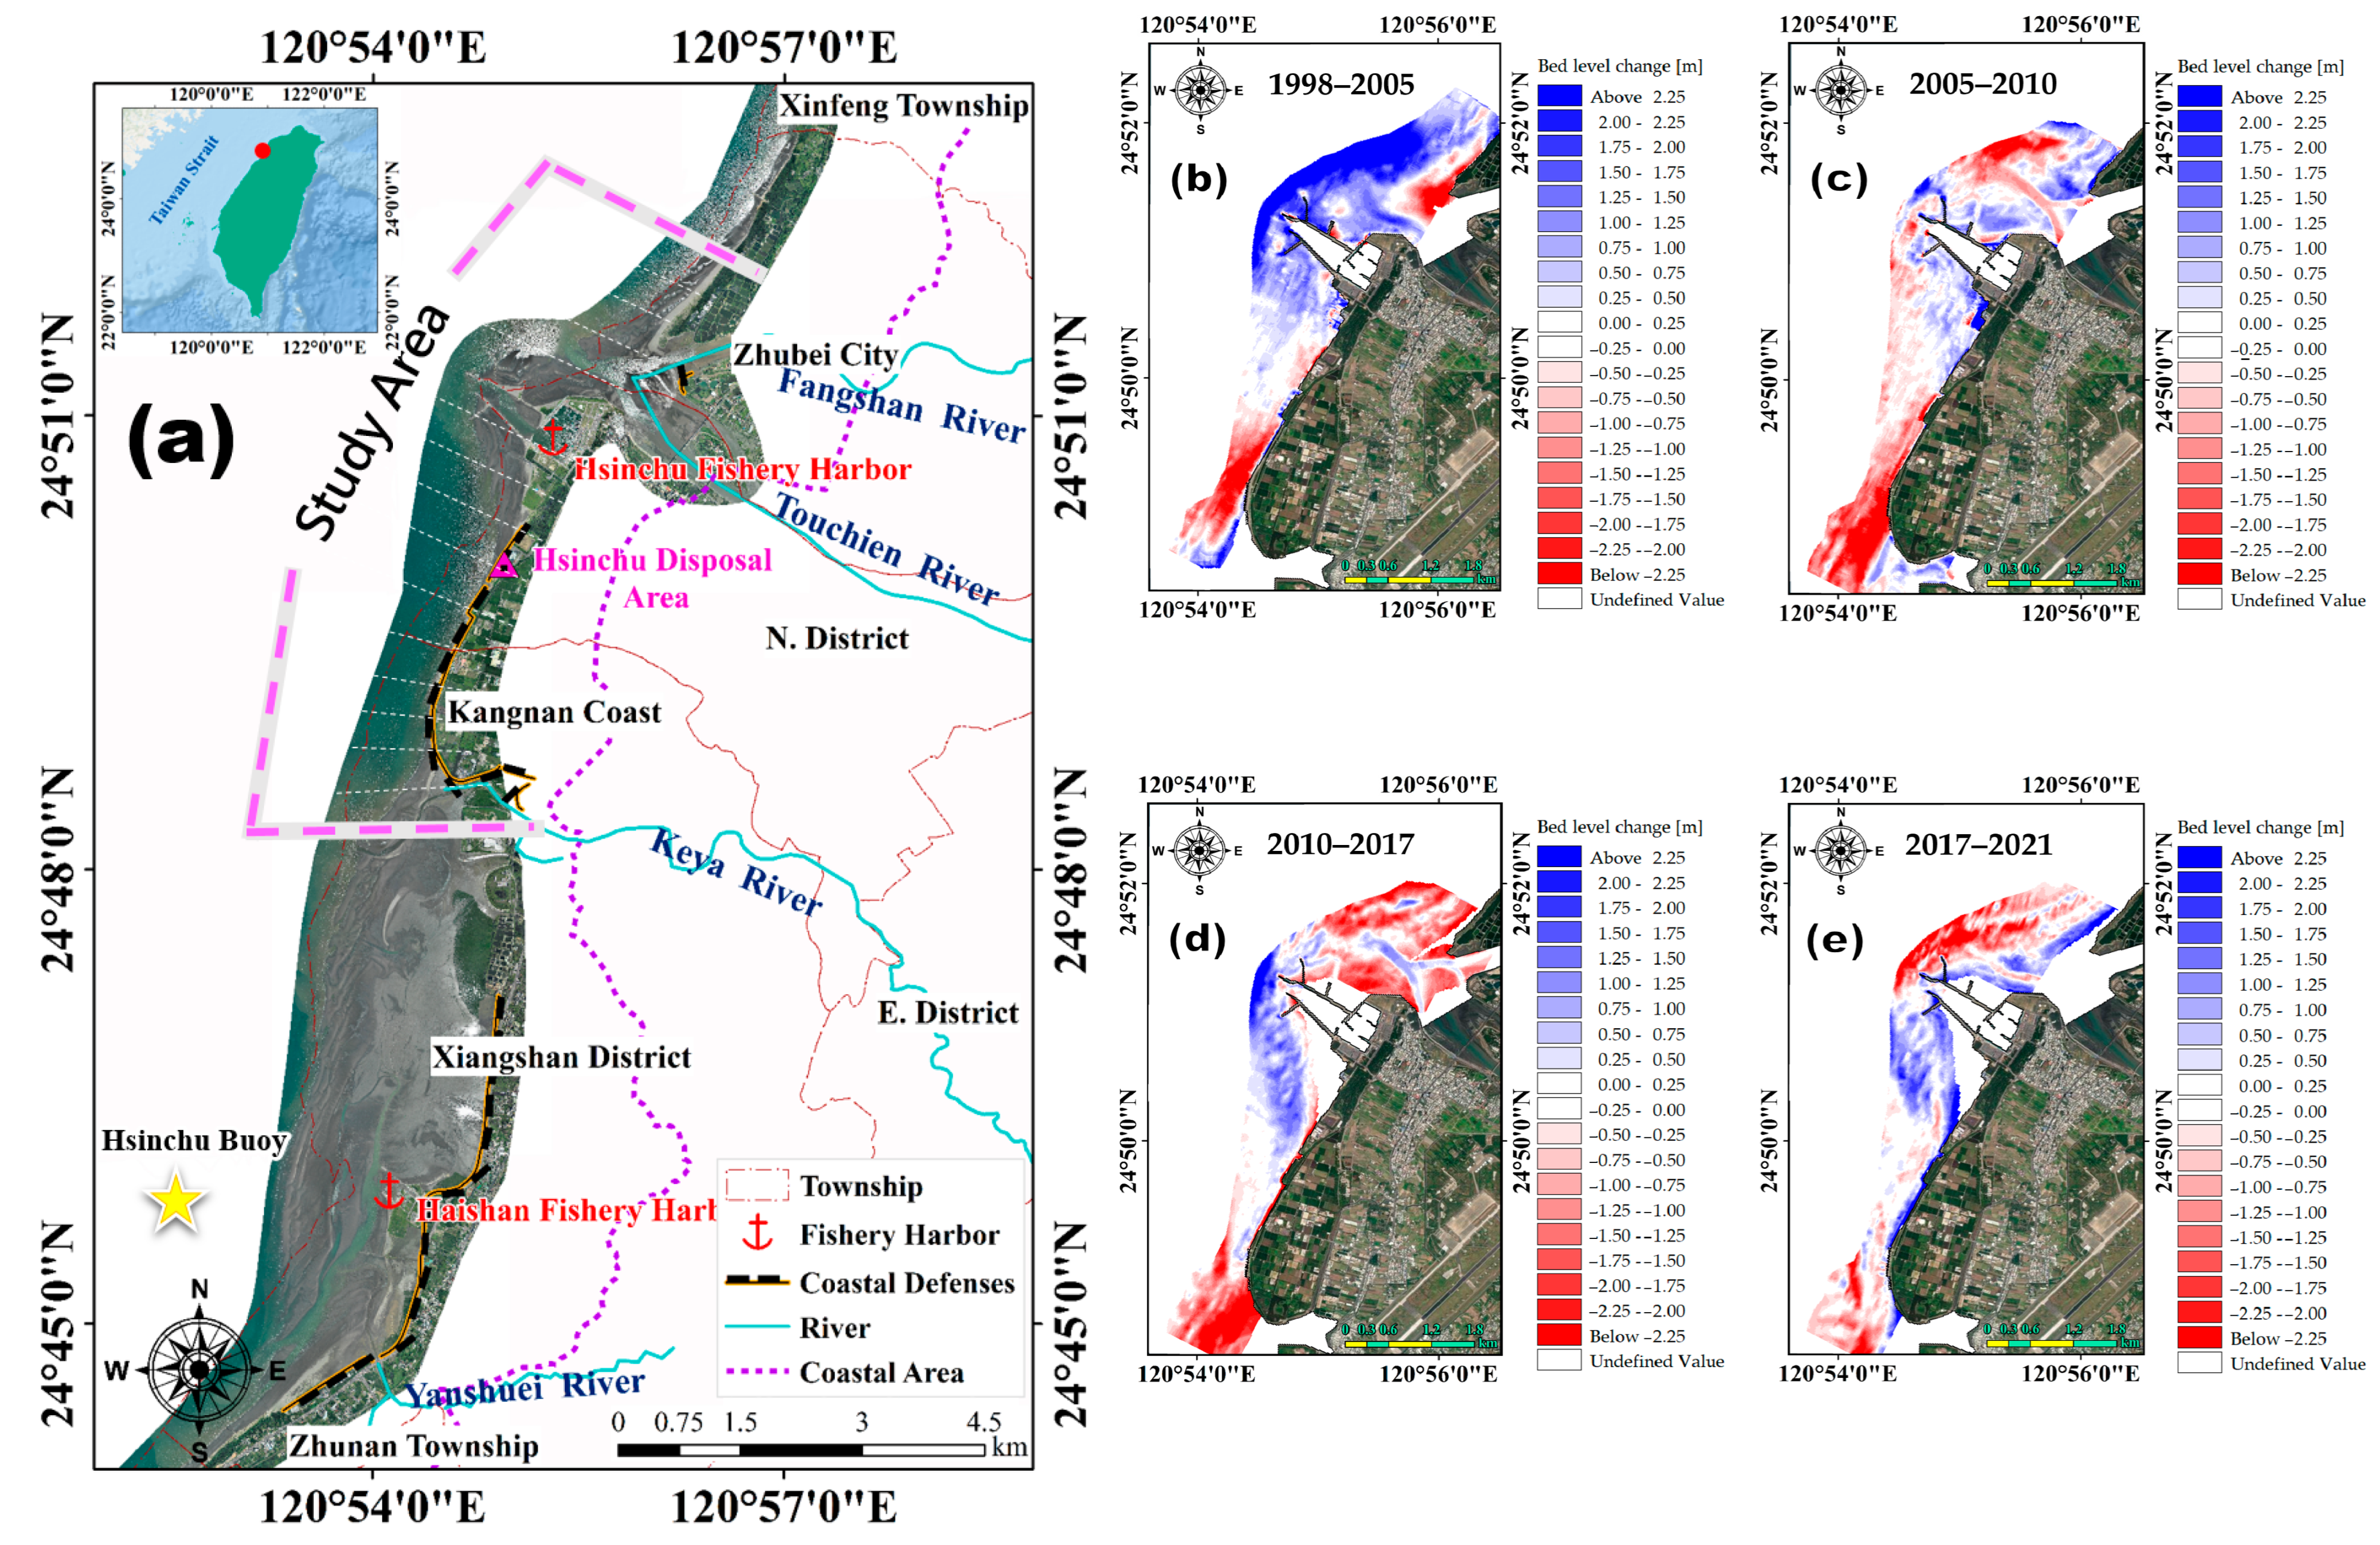
2.1. Description of the Study Area

The Hsinchu Coast was chosen as the research site on the northwestern coast of Taiwan. This study investigated the coastal area spanning 8.5 km from Zhubei to the Keya River, encompassing significant landmarks such as the Hsinchu Fishery Harbor, Kangnan Seawall, Fengshan River, and Touchien River. Detailed information about the study area is shown in Figure 1a. Imbalances in longshore sediment transport caused by the Hsinchu Fishery Harbor have persisted in the region for decades. The establishment of the Hsinchu Fishery Harbor during the early 1980s altered the natural marine hydrodynamic processes, leading to significant transformations in the coastal morphology of the Hsinchu region compared to the previous conditions. According to the historical bathymetric analysis conducted by Huang [3], the coastal morphological changes along the Hsinchu Coast can be divided into three stages. In the first stage (1998–2005), the river mouth experienced significant accretion, while severe erosion was observed along the coastline adjacent to the Kangnan Seawall; then, in the intermediate period (2005–2010), the Hsinchu Coast was eroded; finally, in the recent periods (2010–2017 and 2017–2021), the Kangnan Seawall (the southern perimeter of the Hsinchu Fishery Harbor) has shown a tendency to silt up. This three-stage morphological process has been gradually redrawn (as shown in Figure 1b–e).

2.2. Wave Climate

Wave climate data have been collected at the Hsinchu buoy, operated by the Central Weather Administration, since 1992. Positioned at 24°50′55″ N latitude and 120°55′14″ E longitude (as shown in Figure 1a), the buoy is located southwest of the Hsinchu Fishery Harbor, approximately 1.5 km offshore, with a water depth of around 23 m. The time series encompassing wave weights, wave periods, and wave directions are accessible from the data source. These datasets were instrumental in calibrating the numerical model presented in Section 4.1.
The wave patterns in the study area are primarily influenced by monsoons, with the southwest monsoon prevailing during the summer months (June to August), resulting in waves mainly from the west (W) or southwest (SW) directions. Conversely, the northeast monsoon dominates during the winter months (December to February), causing waves primarily from the northeast (N) and north-northwest (NNW) directions. The long-term wave height has been recorded by the Central Weather Administration. Furthermore, the average significant wave height recorded annually from 1998 to 2023 was 0.95 m. However, over the last five years (2019–2023), this metric has risen to 1.05 m, indicating a notable rise in wave energy along the coast in recent years compared to preceding periods.

2.3. Hydrological Conditions

In the study area, two rivers, namely, the Touchien River (TCR) and the Fangshan River (FSR), are depicted by the blue lines in Figure 1a. These rivers are situated to the north of the Hsinchu Fishery Harbor and flow into the Taiwan Strait, forming the Touchien Estuary. The Water Resources Agency, MOEA, has recorded the discharges of these two rivers at the Jeinkuo Bridge Station (station no. H1017, TCR) and the Xinpu (2) Station (station no. H002, FSR), respectively. The average river discharges of the TCR and FSR in the past 25 years (1998–2022) were 7242.57 m3/s and 3350.56 m3/s, respectively. However, their average river discharges in the past five years (2018–2022) have decreased to 5517.95 m3/s and 1854.33 m3/s, respectively. Subsequently, the time series data of both river discharges during the typhoon period are used as boundary conditions for the nearshore typhoon simulation in Section 4.1.

2.4. Typhoon Information in the Study Area

The statistics indicate that Taiwan experiences an average of 3–4 typhoons annually, leading to coastal disasters [17,22]. When typhoons approach Taiwan, they are influenced by the varying physical conditions across the different regions, such as the Central Mountain Range, resulting in changes in their intensity. Consequently, alterations in the typhoon paths predominantly influence the coastal transformations in different areas. According to the Central Weather Administration of Taiwan’s typhoon classification criteria, typhoons with trajectories near Taiwan can be categorized into nine tracks (Figure 2). Typhoons classified as Tracks 1, 2, and 3, with their centers close to the study area, are highly likely to impact Hsinchu, causing significant coastal morphological changes. In contrast, Tracks 4 to 9 have minimal impacts on the designated region. Furthermore, Table 1 shows that, over the past 30 years, there were 26 typhoons classified as Tracks 1 to 3 affecting Taiwan between 1994 and 2008, with 11 being severe typhoons. In the last 15 years, from 2009 to 2023, there were 12 typhoons classified as Tracks 1 to 3 affecting Taiwan, with 4 being severe.
The Intergovernmental Panel on Climate Change (IPCC) and Taiwan Climate Change Projection Information and Adaptation Knowledge Platform (TCCIP) have highlighted that in response to climate change, there will likely be a reduction in the number of typhoons in Taiwan’s region in the future, accompanied by an increase in the likelihood of intense typhoons. However, the statistical data on typhoons presented in Table 1 reveal inconsistencies in the characteristics of the typhoons within the study area over the past three decades. Contrary to the above projections, the frequency and intensity of typhoons have experienced a notable decline. Given the absence of precise data on future typhoon occurrences, this study adopted typhoon Tracks 1 to 3 to project future trends in coastal morphological changes. These paths provide a suitable situation for simulating potential climate change scenarios and their impacts on coastal morphology. Notably, as indicated in Table 1, in the year 2007, the coast was hit by consecutive typhoons of Tracks 1, 2, and 3, named Sepat, Wipha, and Krosa, respectively. The tracks of these three typhoons are shown in Figure 3. Two sets of bathymetry survey data, obtained in July and October of 2007, respectively, were utilized in this study. They were employed as the initial conditions for the typhoon simulations and the validation of the resulting simulated bathymetry.

3. Data and Methods

This section presents a concise yet comprehensive description of the datasets and methods used to estimate the bathymetric change under various scenarios. Including the numerical model setup, the EOF analysis, and the designated climate change scenarios underscores the meticulous approach taken in this study.

3.1. Datasets

The long-term coastal bathymetric analysis, which is the most direct method for understanding trends in coastal morphological changes, has practical applications in various fields. The resulting measurements are crucial in coastal morphological research, numerical ocean dynamic simulations, coastal morphological alteration assessments, and quantitative analyses. In this study, the morphological dynamics of the Hsinchu Coast were comprehended using information from single-beam surveys conducted at a minimum scale of 1:10,000, spanning from 1998 to 2021.

3.2. Definition of Typhoon and Climate Change Scenarios

The outcomes derived from the climate change scenarios provided by the IPCC [1] are at a global scale. However, to obtain regional climate change parameter values for specific areas, conduct simulations at a finer spatial resolution, and comply with the data sources referenced by agency policies, this study utilized the regional scale data computed by the Taiwan Climate Change Projection Information and Adaptation Knowledge Platform (TCCIP) based on the global-scale information from the IPCC (AR5) as the boundary conditions. Subsequently, the numerical simulations described in the following subsection (Section 3.4) obtained representative values at the local scale. In light of the TCCIP’s downscaling analysis of Taiwan’s historical typhoon data conducted within the framework of the AR5 RCP 8.5 scenario, discernible trends indicated a projected increase in the typhoon wind speeds ranging from approximately 2% to 12% by the end of the century. On average, this surge is estimated to amount to around 8%. The wave dynamics considered in the scope of this study were predicated upon the 8% increase in the average typhoon wind speeds and a corresponding 12% increase in the extreme typhoon wind speeds, serving as pivotal boundary conditions for the simulation of typhoon-induced wave phenomena. The anticipated extreme sea level (ESL) was derived by the TCCIP using the IPCC AR6 scenario. By the end of this century, if the temperature increases by 2 °C, the sea level in the vicinity of Taiwan is expected to rise by 0.5 m. A 4 °C temperature rise is projected to result in a sea level increase of 1.2 m. This study adopted this end-of-century climate boundary condition as the parameter for the water level boundaries in the subsequent numerical simulations. Table 2 shows the information on typhoons considered in this study.

3.3. Numerical Modeling

To assess the impacts of extreme typhoon events on coastal morphological trends, this study employed the 2D hydrodynamic model, MIKE 21, to simulate changes in the magnitude of the wave height and the coastal morphology in the study area under climate change scenarios, as well as the present situation.

3.3.1. Two-Dimensional Hydrodynamic Model

Numerical modeling is a widely recognized computational method, especially in the realm of coastal hydrodynamics [33]. In this research, a coupled morphological model package, the MIKE 21/3 coupled model FM, was employed to investigate potential changes. This integrated model package, developed by the Danish Hydraulic Institute (DHI), comprises a spectral wave (SW) module, a hydrodynamic (HD) module, and a non-cohesive sediment transport module (ST), which collectively simulate the wave characteristics, hydrodynamics, and sediment transport processes [34].
Specifically, the SW module [35] functions as a non-structural grid wind wave model that is adept in simulating the generation, attenuation, and transmission processes of wind waves in both oceanic and nearshore regions. Subsequently, the HD module [35] is employed to conduct simulations of the current fields based on solving the incompressible Reynolds-averaged Navier–Stokes equations [36]. Moreover, the ST module [35] primarily calculates the drift potential of the non-cohesive alongshore sediment under the influence of waves and tidal currents, alongside predicting morphological alterations in the seabed. For further theoretical insights, readers are directed to the MIKE 21 manual [35].

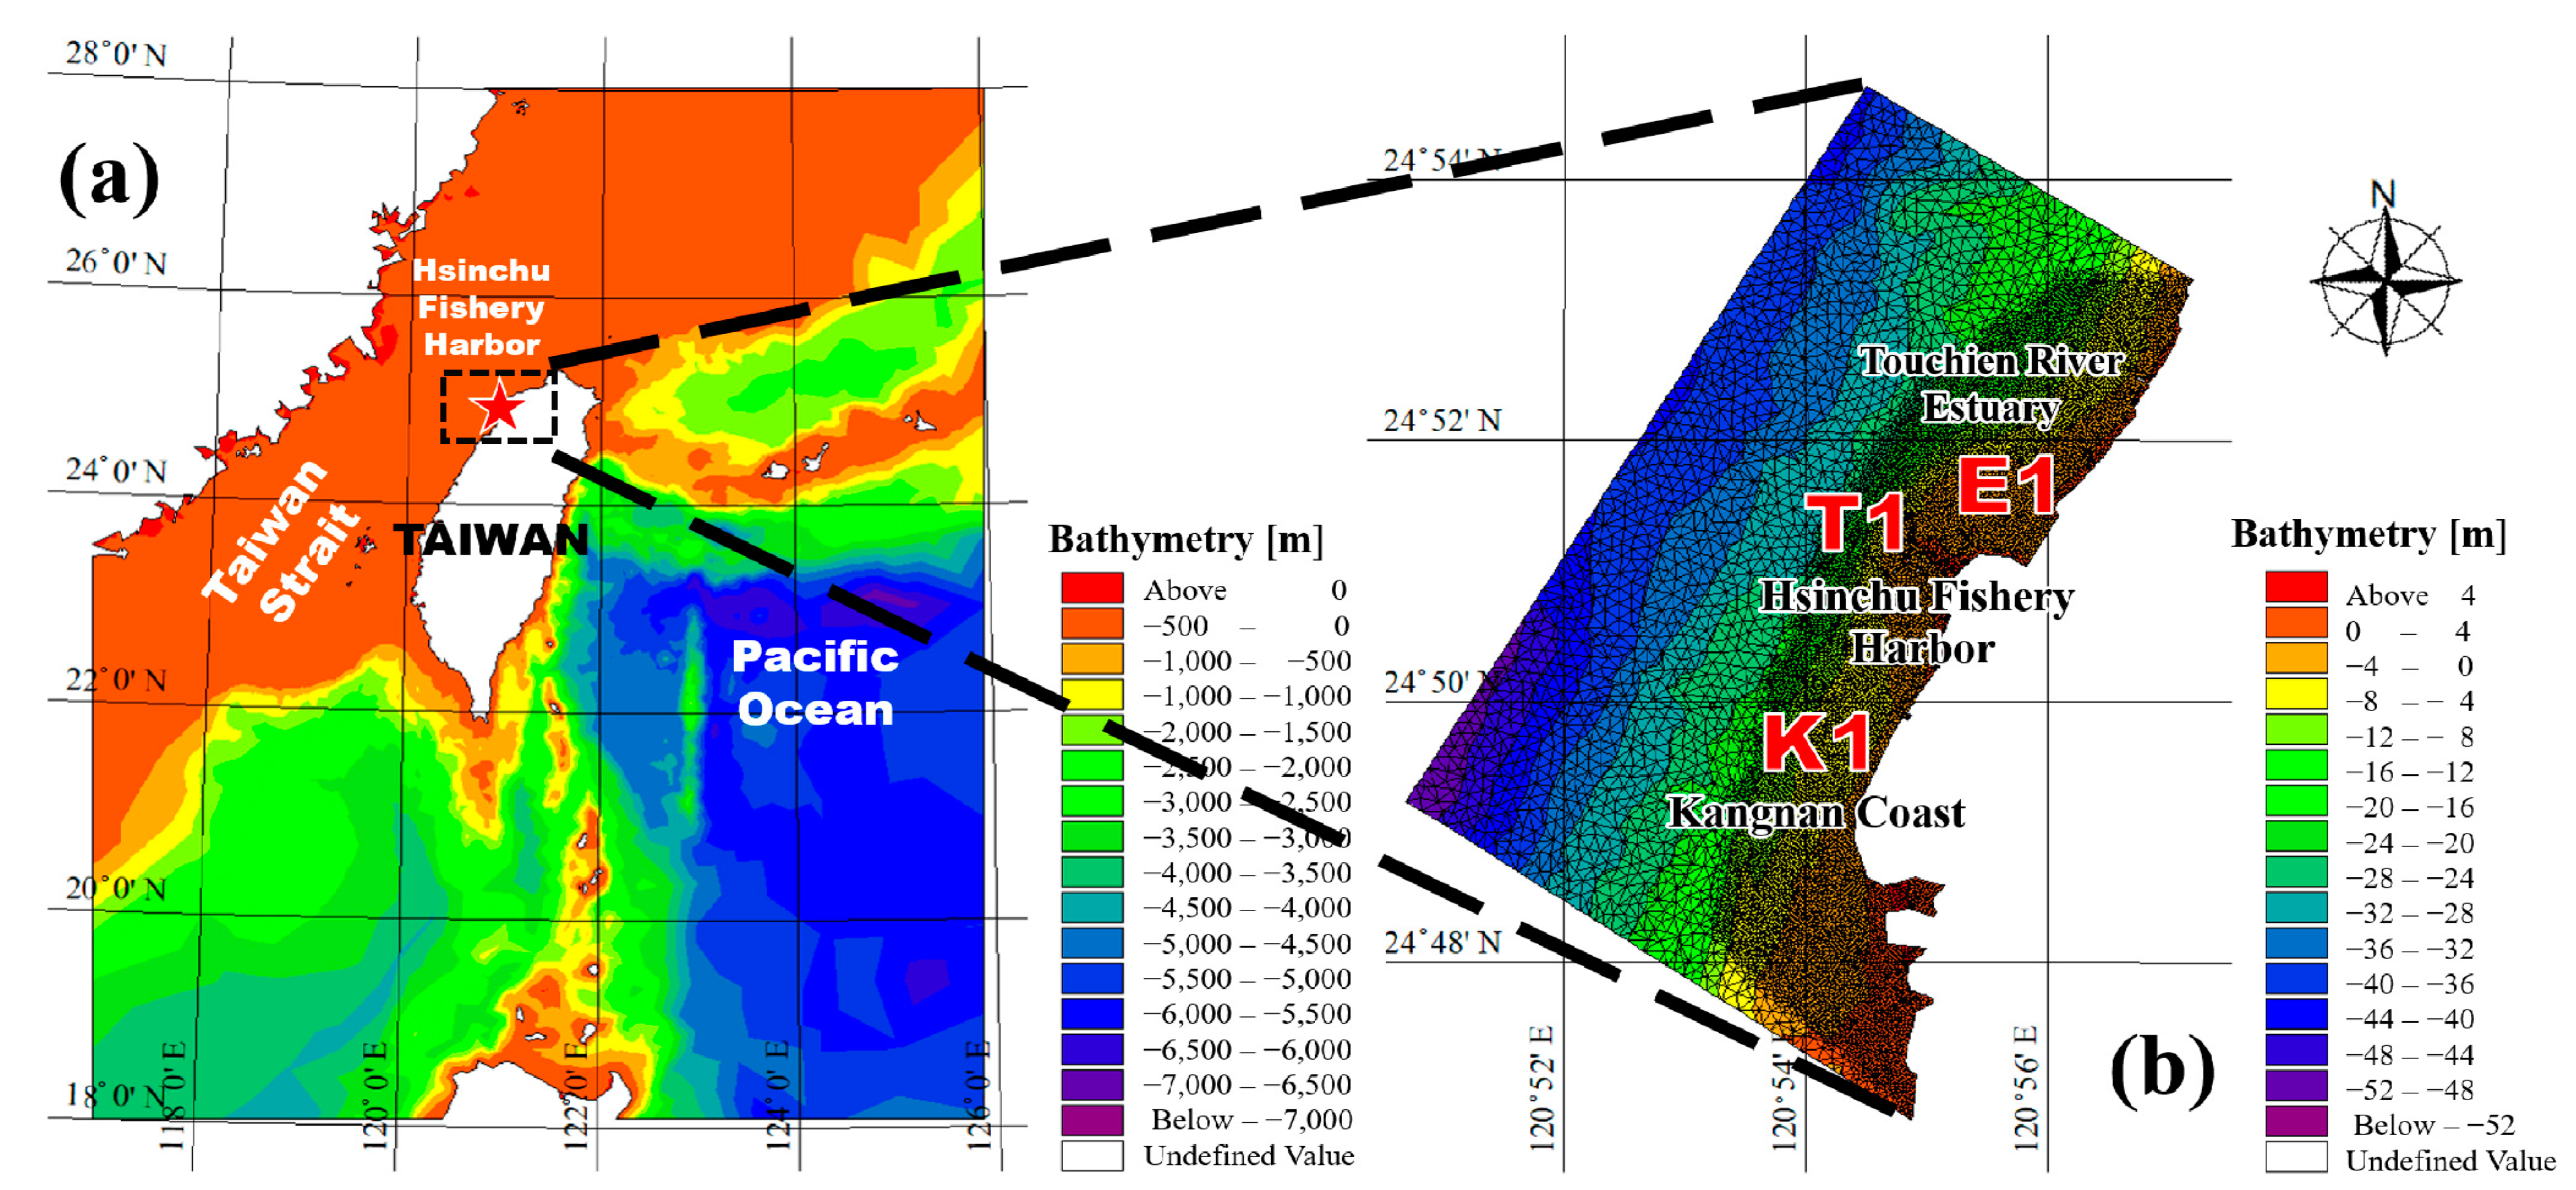
3.3.2. Computational Domain and Grid

Given the absence of wave data for the nearshore simulation boundary within the study area, it was necessary to compute this information. In this research, two unstructured grids were created utilizing the Mesh Generator tool within Mike Zero. The first grid delineated the “offshore region”, while the other depicted the “nearshore region”. The offshore area spanned 117° E to 126° E longitude and 18° N to 28° N latitude, as visualized in Figure 4a. In addition, as illustrated in Figure 4b, the nearshore domain encompassed the region between 120°46′ N and 120°56′ N longitude and 24°40′ E and 24°60′ E latitude. The computational grid of the offshore area was used to simulate the waves formed by typhoons for the boundary conditions of the nearshore simulation. The offshore simulation used the cyclone wind generation (CWG) module and (SW) of MIKE 21 and the typhoon data in the typhoon database of the Central Weather Administration (CWA), including the time series of the lowest central pressure, the maximum wind speed near the center, the radii, and the path coordinates. The simulation period commenced when the typhoon’s storm circle made landfall in Taiwan and concluded once the storm circle exited Taiwan, ensuring the comprehensive consideration of all the typhoon’s effects.
The computational grid of the nearshore zone, an unstructured mesh composed of 10,181 nodes and 19,696 elements, was employed to model the evolution of the nearshore hydrodynamic conditions and coastal morphology alterations during the subsequent climate change scenario simulations. The resultant morphological transformations in the nearshore vicinity were subsequently juxtaposed with historical bathymetry survey data to validate the model parameters’ capacity to capture the hydrodynamic variations and morphological change mechanisms within the study area.
Typhoons Sepat, Wipha, and Krosa were selected as the focus of this study because all three typhoons occurred within the same two sets of bathymetry survey data, and the path classifications of these three typhoons were different. More detailed information on these three typhoons is shown in Figure 4.

3.4. EOF Analysis

In coastal sciences, the EOF technique was first applied by Winant et al. [28]. Since then, numerous studies have utilized the EOF method to analyze coastal morphology. For instance, it has been applied to 1D cross-shore beach profile variations [28], 2D bathymetric surfaces [37], and morphological changes in estuaries [38] or morphological variability due to beach nourishment [39]. Therefore, this research employed the EOF method to disentangle the spatial and temporal components of the bathymetric dataset and assess the influential factors using distinct modes. The EOF approach serves as a mathematical tool to identify a set of orthogonal functions or eigenvectors and decompose the original bathymetry survey dataset at any specific location over the study period [40]. The method employs spatial eigenfunctions (spatial components) and temporal eigenvectors (temporal components), denoted as en(x′, y′) and cn(t), respectively, which can be used to explain the variations in the nearshore observed in the bathymetry survey data. The EOF method was used to analyze eight sets of bathymetry survey data—from 2005 to 2010 and from 2017 to 2021—with the four scenarios’ results. Next, by analyzing historical bathymetry data and comparing it with simulation results, it can assess the extent and impact of human activities on changes in coastal morphology in the study area under the influence of climate change. The detailed process is illustrated in Figure 4. The bathymetry survey data were classified into spatial and temporal components, which were then segregated into temporal eigenvectors and spatial eigenfunctions, as demonstrated in Equation (1) [3].
h x , y , t = n = 1 N c n t e n ( x , y )
Here, h represents the elevation of the seabed, x′ and y′ denote the perpendicular and parallel shoreline coordinates in the latitude–longitude system, t signifies the year, cn denotes the temporal eigenvectors (temporal components), en represents the spatial eigenfunctions (spatial components), N is the total number of eigenfunctions, and n denotes the number of modes [3]
Additionally, the individual contribution rates of the impact factors can be elucidated using Equation (2) [3] as follows:
R n = λ n i = 1 N λ i
where Rn denotes the contribution rate, N is the total number of eigenfunctions, λn represents the Nth eigenvalue, and λi represents the eigenvalues of each mode [3].

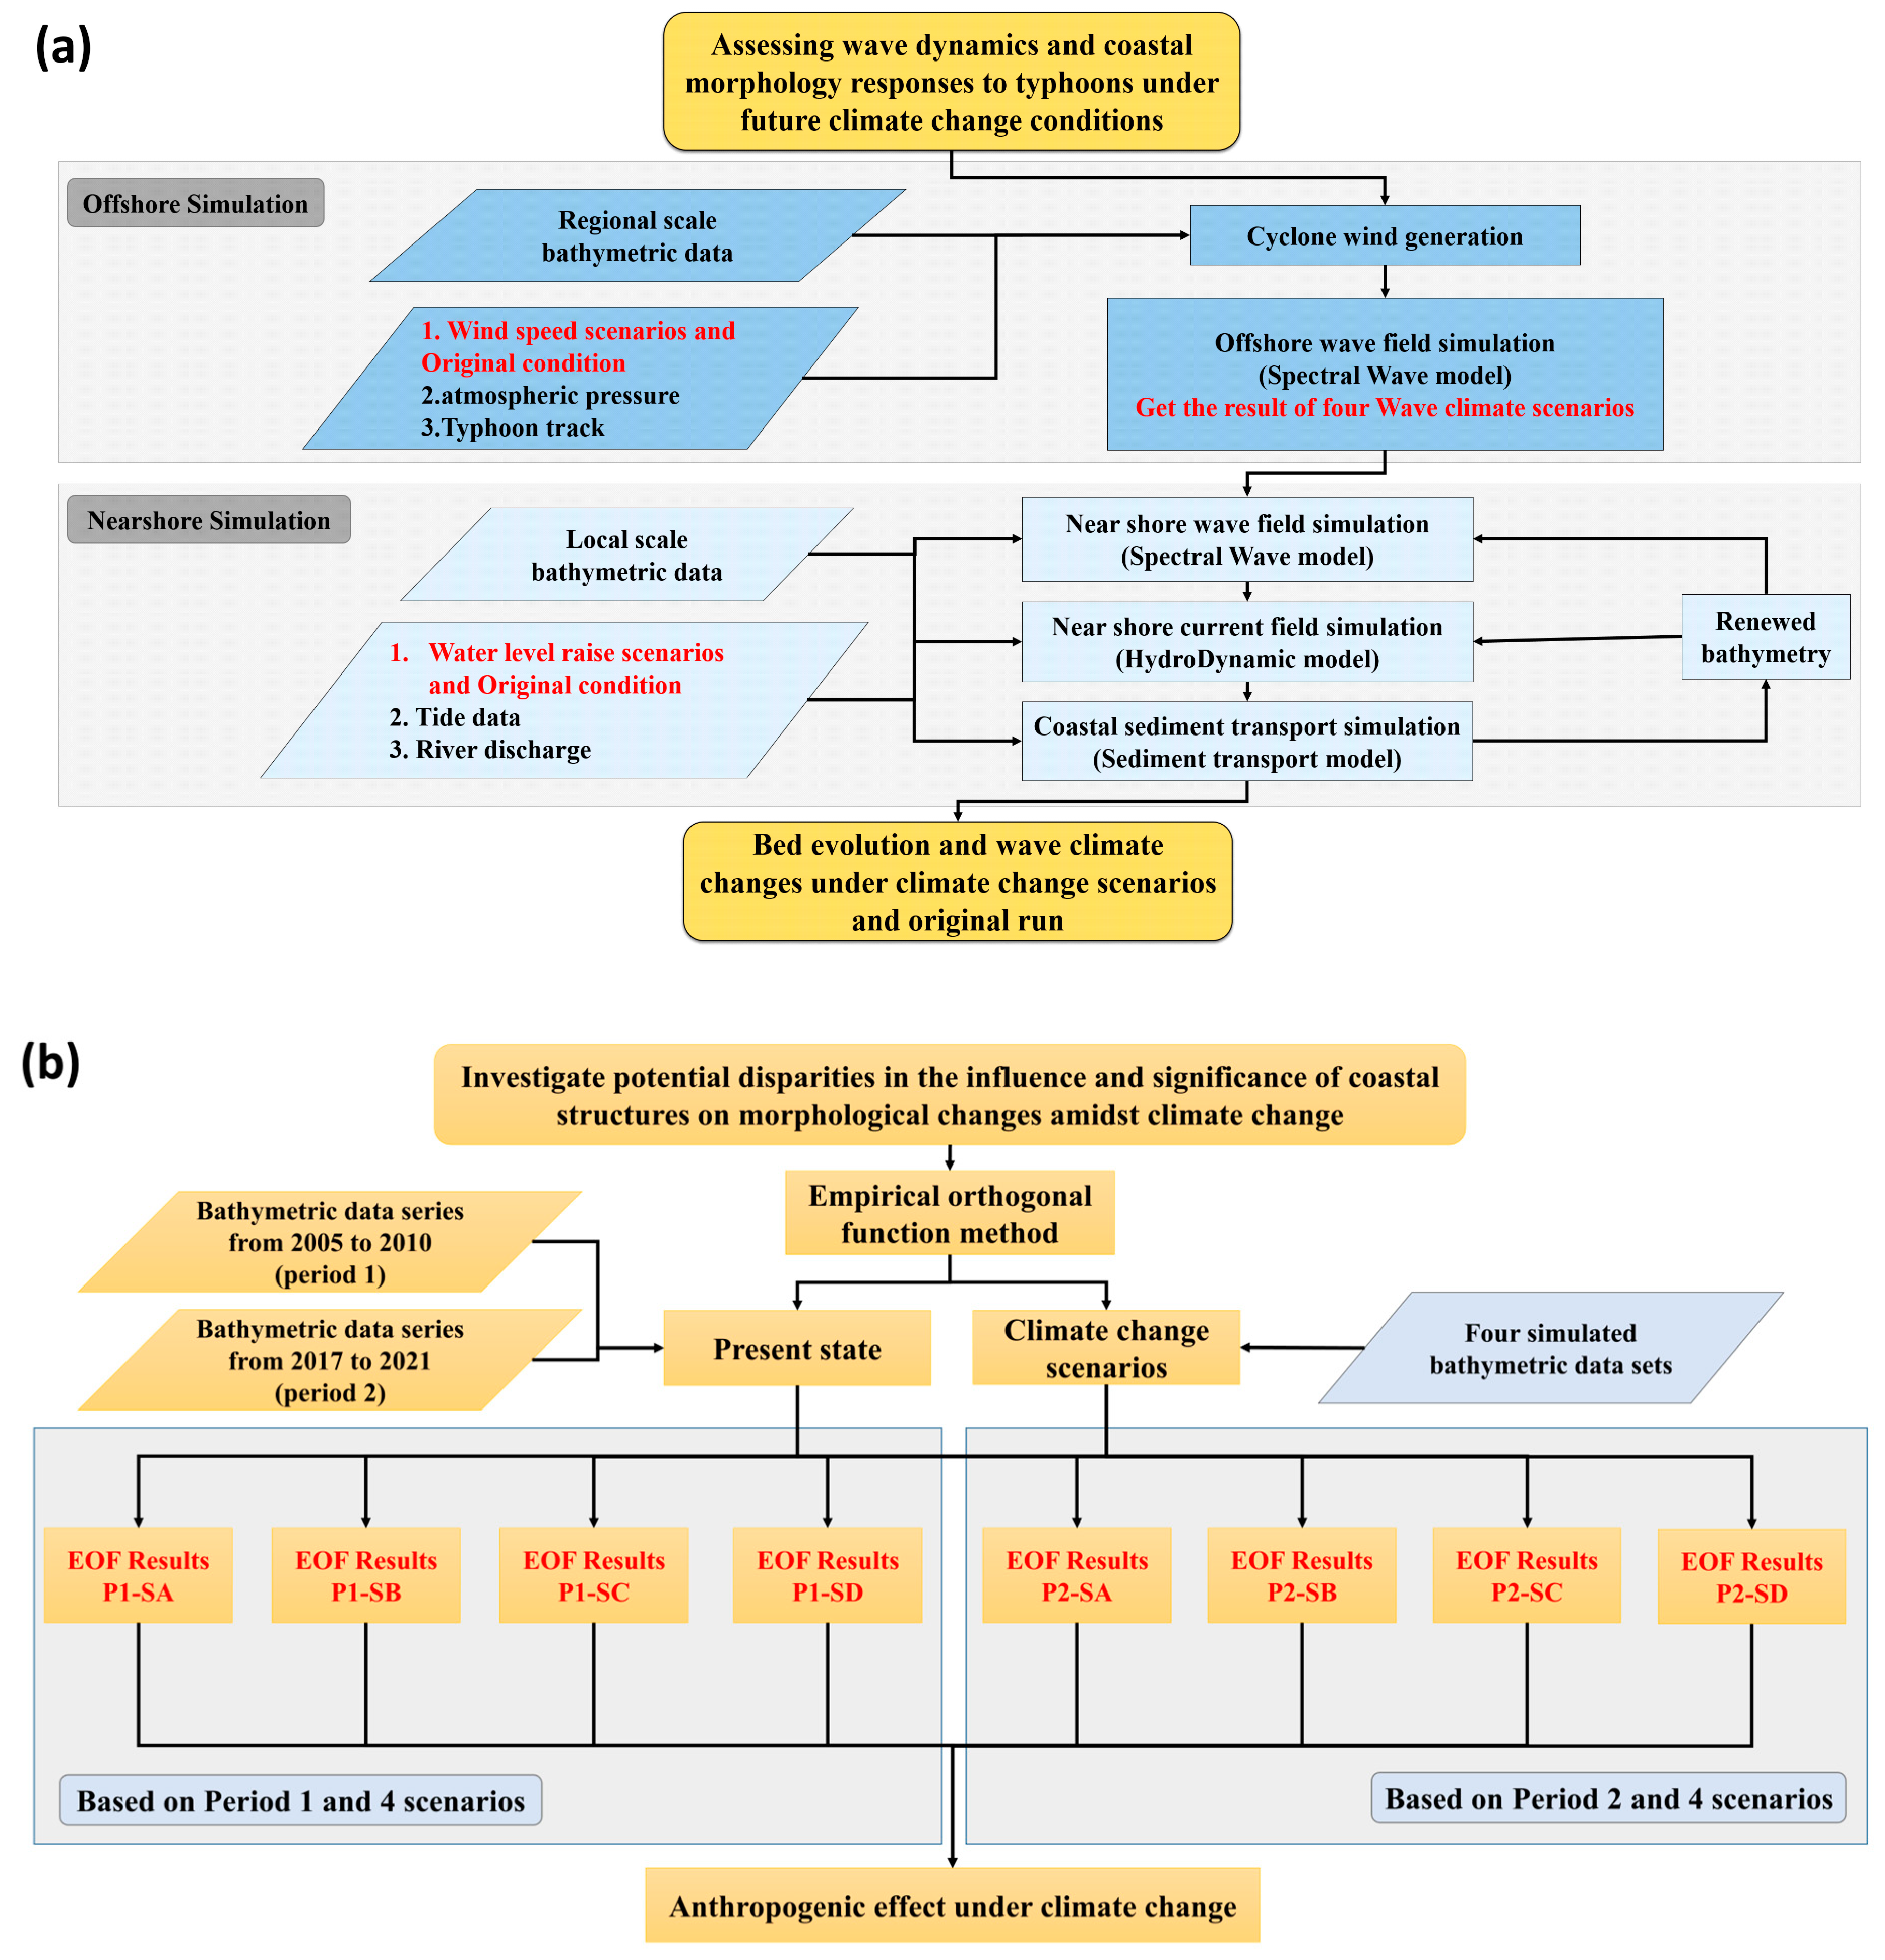
3.5. Methodological Approach

The research was divided into two primary sections. The initial segment applied the MIKE 21 numerical model by DHI to simulate both current-day typhoon occurrences and those under four climate change scenarios. This was carried out to discern the impacts on wave climate and coastal morphological patterns along the Hsinchu Coast across various scenarios. Then, in the second part, this research uses the EOF method to analyze the “simulation results of coastal morphological changes in the study area under the influence of climate change”. By examining historical bathymetric data and comparing simulation results, it is possible to assess how anthropogenic structures’ impact range and corresponding weighting on coastal morphological changes in the study area may vary under the effects of climate change.
The detailed simulation process in the first part is outlined as follows. First, this study employed data from the typhoon database (CWA) to compute the typhoon wind field over an offshore region using the cyclone wind generation (CWG) of MIKE 21. Subsequently, the wind field results were used to estimate the wave field in the offshore area using the spectral wave (SW) module. The diverse topography of Taiwan, compounded by the barrier effect of the Central Mountains in Central Taiwan, influences the intensity and paths of typhoons approaching from the east, consequently resulting in varying impacts on the Hsinchu Coast (Figure 5a—offshore simulation).
Then, the wave time series extracted from the large-area (offshore region) wave field results at the study area served as the boundary conditions for the localized nearshore wind wave field. Utilizing the bathymetry survey data from July 2007, along with factors such as the tide levels, river discharges, and bed friction, this study simulated and analyzed changes in the wave field and coastal morphology in the study area during typhoon events. Next, the sediment transport patterns around the Hsinchu Coast were simulated. In the simulation system, the morphological changes induced by the first typhoon were used as the initial bathymetry for subsequent typhoon simulations. This iterative process was repeated for each subsequent typhoon, resulting in three distinct paths. The coastal morphological change trends along the coastline following the impact of the typhoons were then evaluated (Figure 5a—nearshore simulation). Through the above steps, depending on the input parameter conditions, the potential results of coastal morphological change in the study area can be obtained for the original typhoon event and the typhoon event facing climate change conditions.
The second segment entailed an EOF analysis, comparing the outcomes of the four distinct scenarios of morphological variations with two sets of coastal bathymetry survey data from different time spans, as follows: 2005 to 2010 and 2017 to 2021. Due to the difficulties in acquiring bathymetric data annually, existing data must be utilized, as depicted in Figure 1c,e. Noticeable disparities in morphological alterations between the periods of 2005–2010 and 2017–2021 exist, with the bathymetric information within these timeframes being more extensive than in other periods. By comparing the outcomes of the eight different scenarios, this study evaluated whether the interaction between structures and wave energy altered the impact weightings and impact ranges regarding the coastal morphology along the Hsinchu Coast under climate change conditions. A detailed schematic of the analytical process is illustrated in Figure 5b.
In Figure 5b, results P1-SA to P2-SD represent the EOF analysis results after combining the bathymetry survey data series from 2005 to 2010 with the simulation results of Scenarios A to D, respectively, while results P2SA to P2-SD represent the bathymetric data series from 2017 to 2021. The EOF results were obtained after combining the simulation results of Scenarios A to D (Table 2) (P1 = 2005 to 2010; P2 = 2017 to 2021), (SA = Scenario A; SB = Scenario B, etc.). The research methodology is further elucidated as follows.

4. Results and Discussion

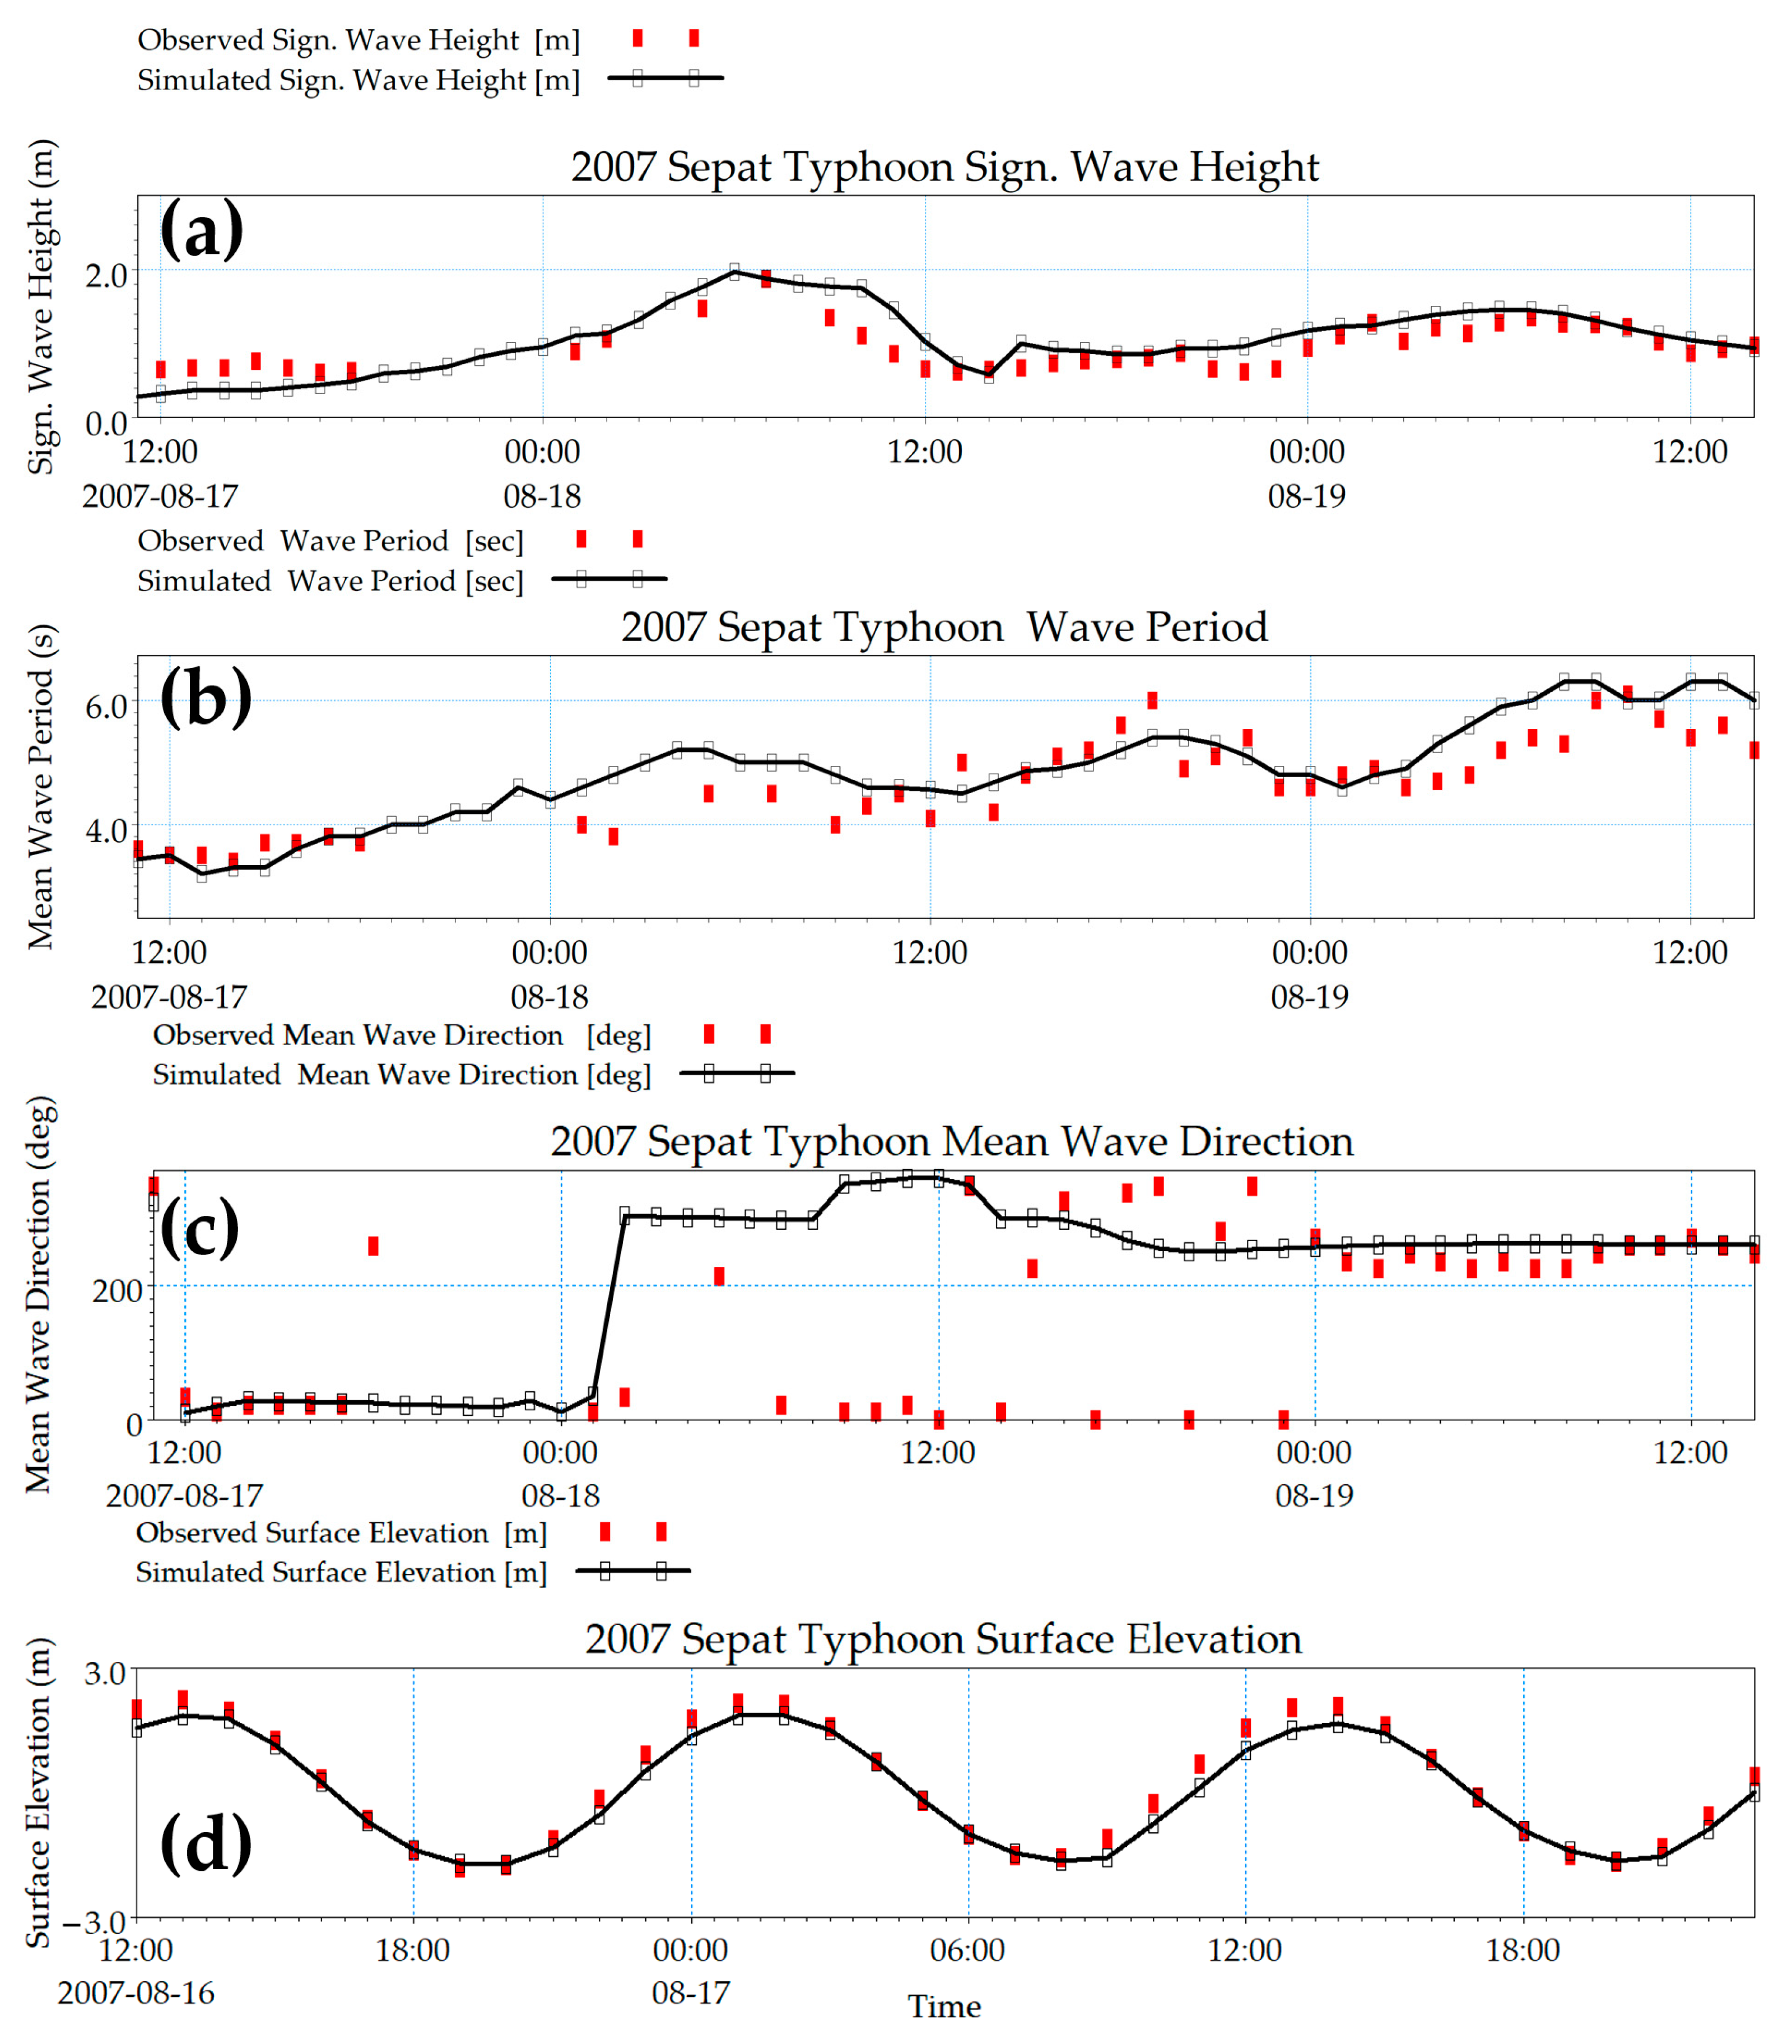
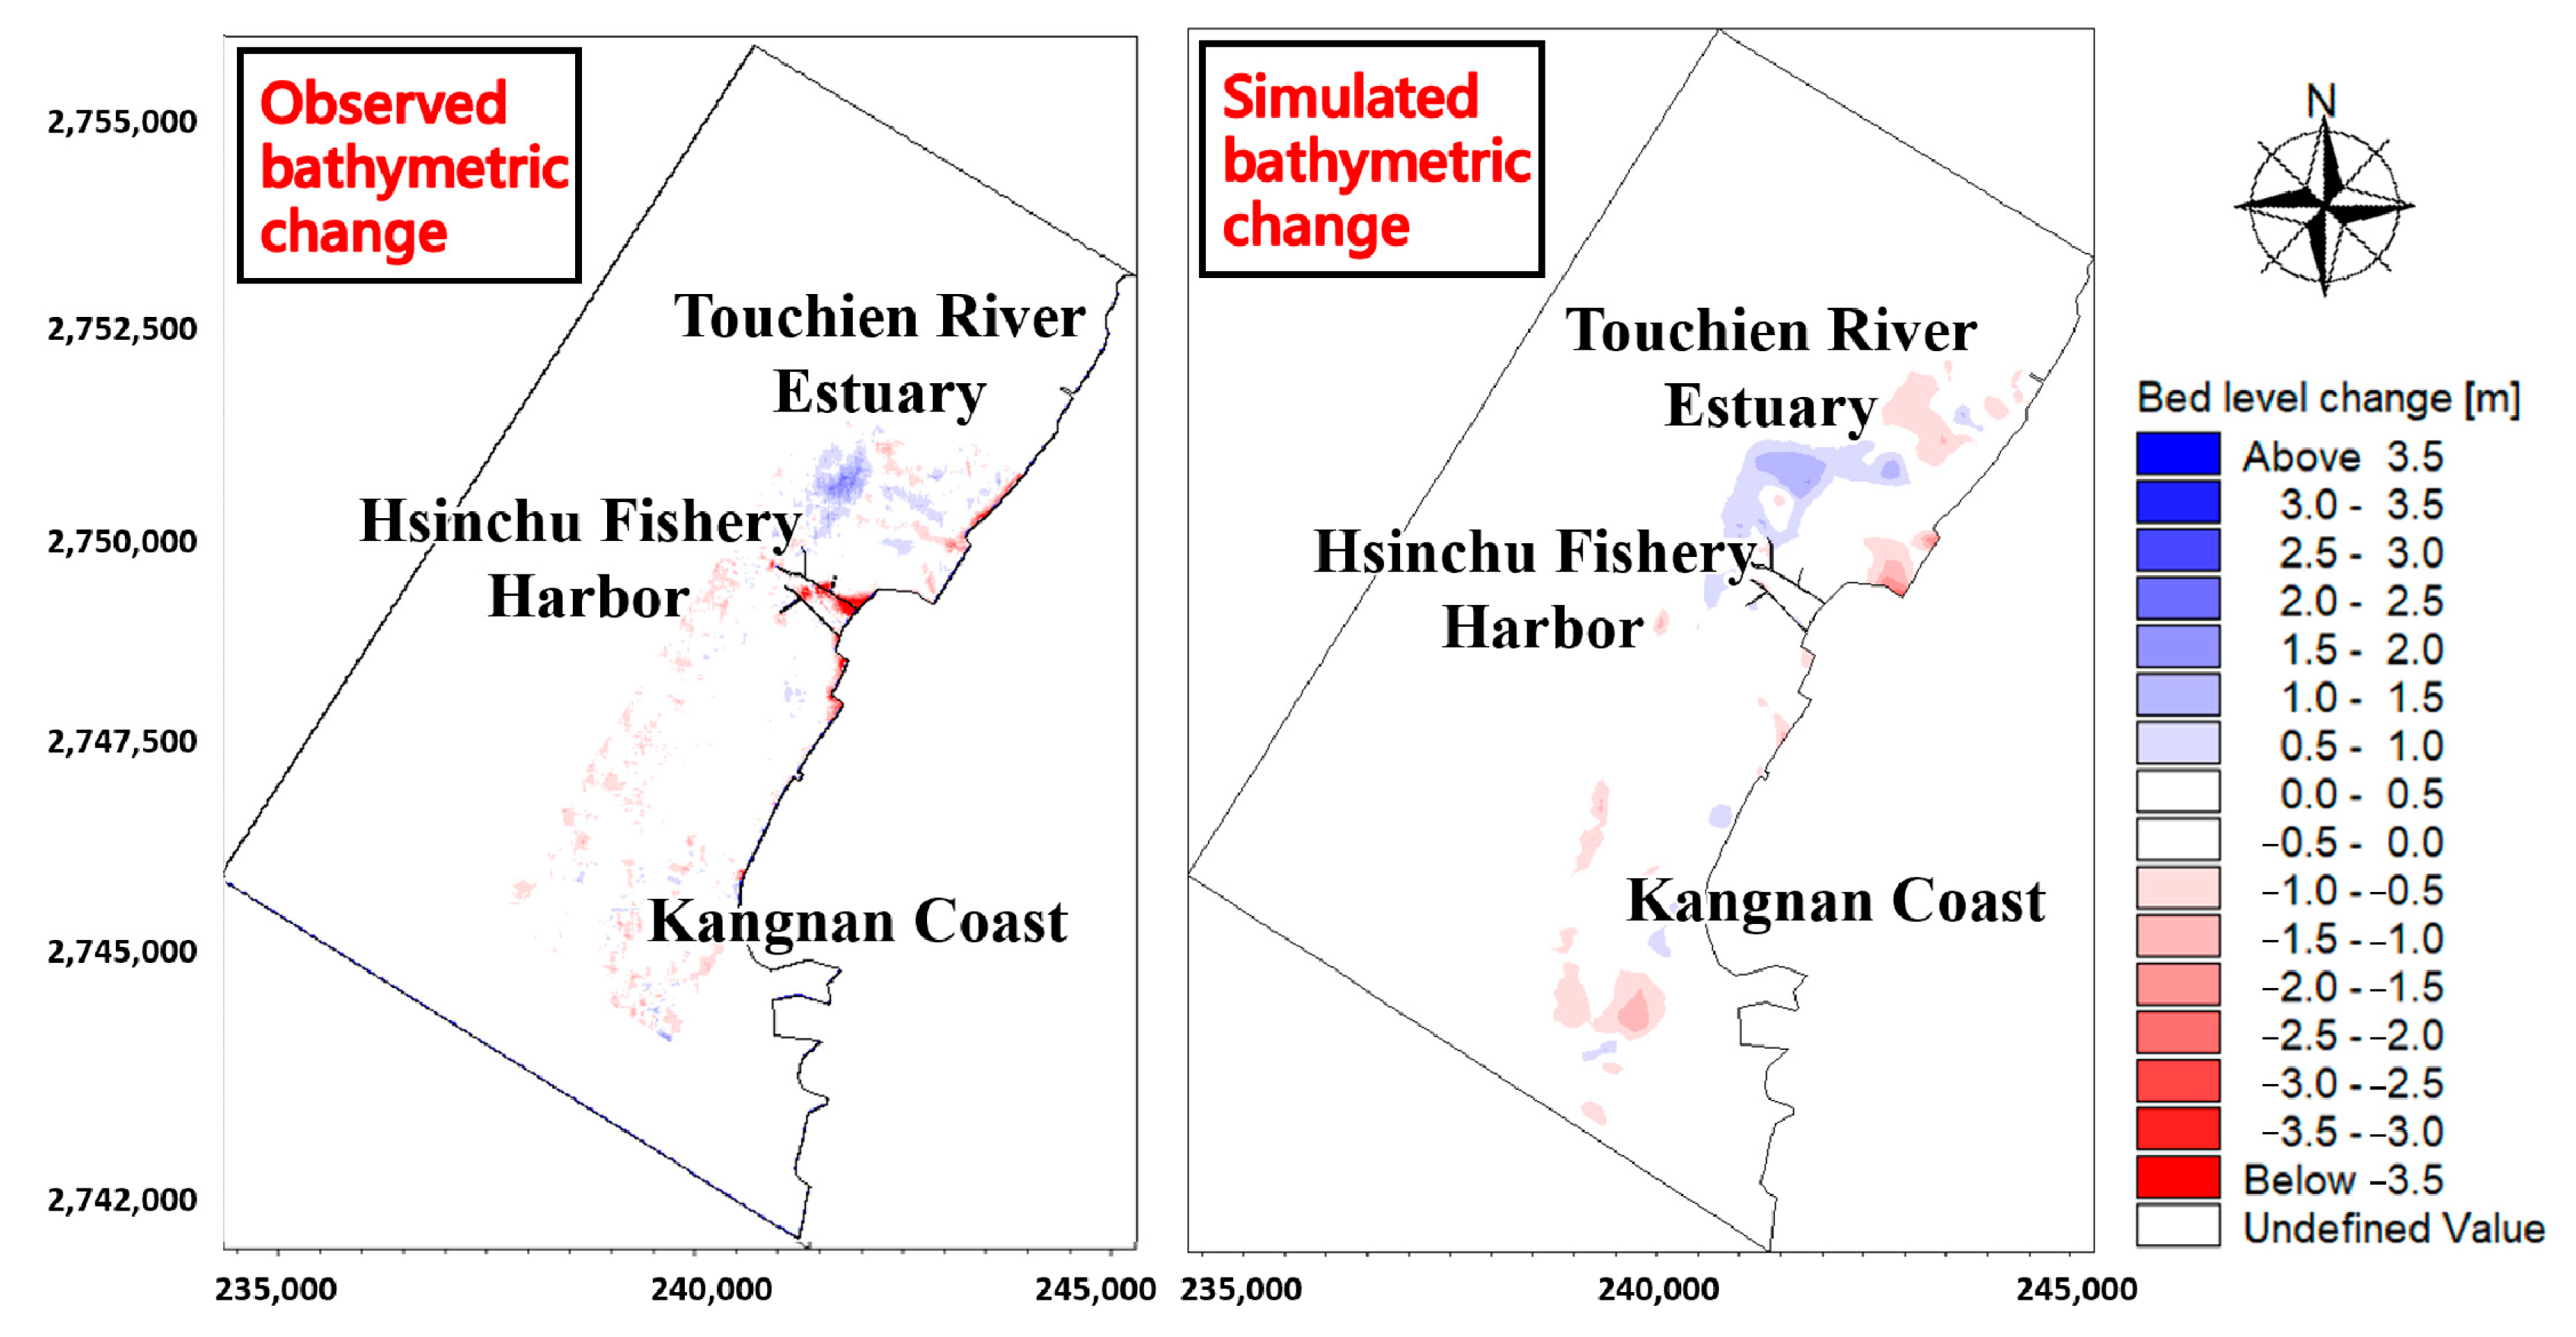
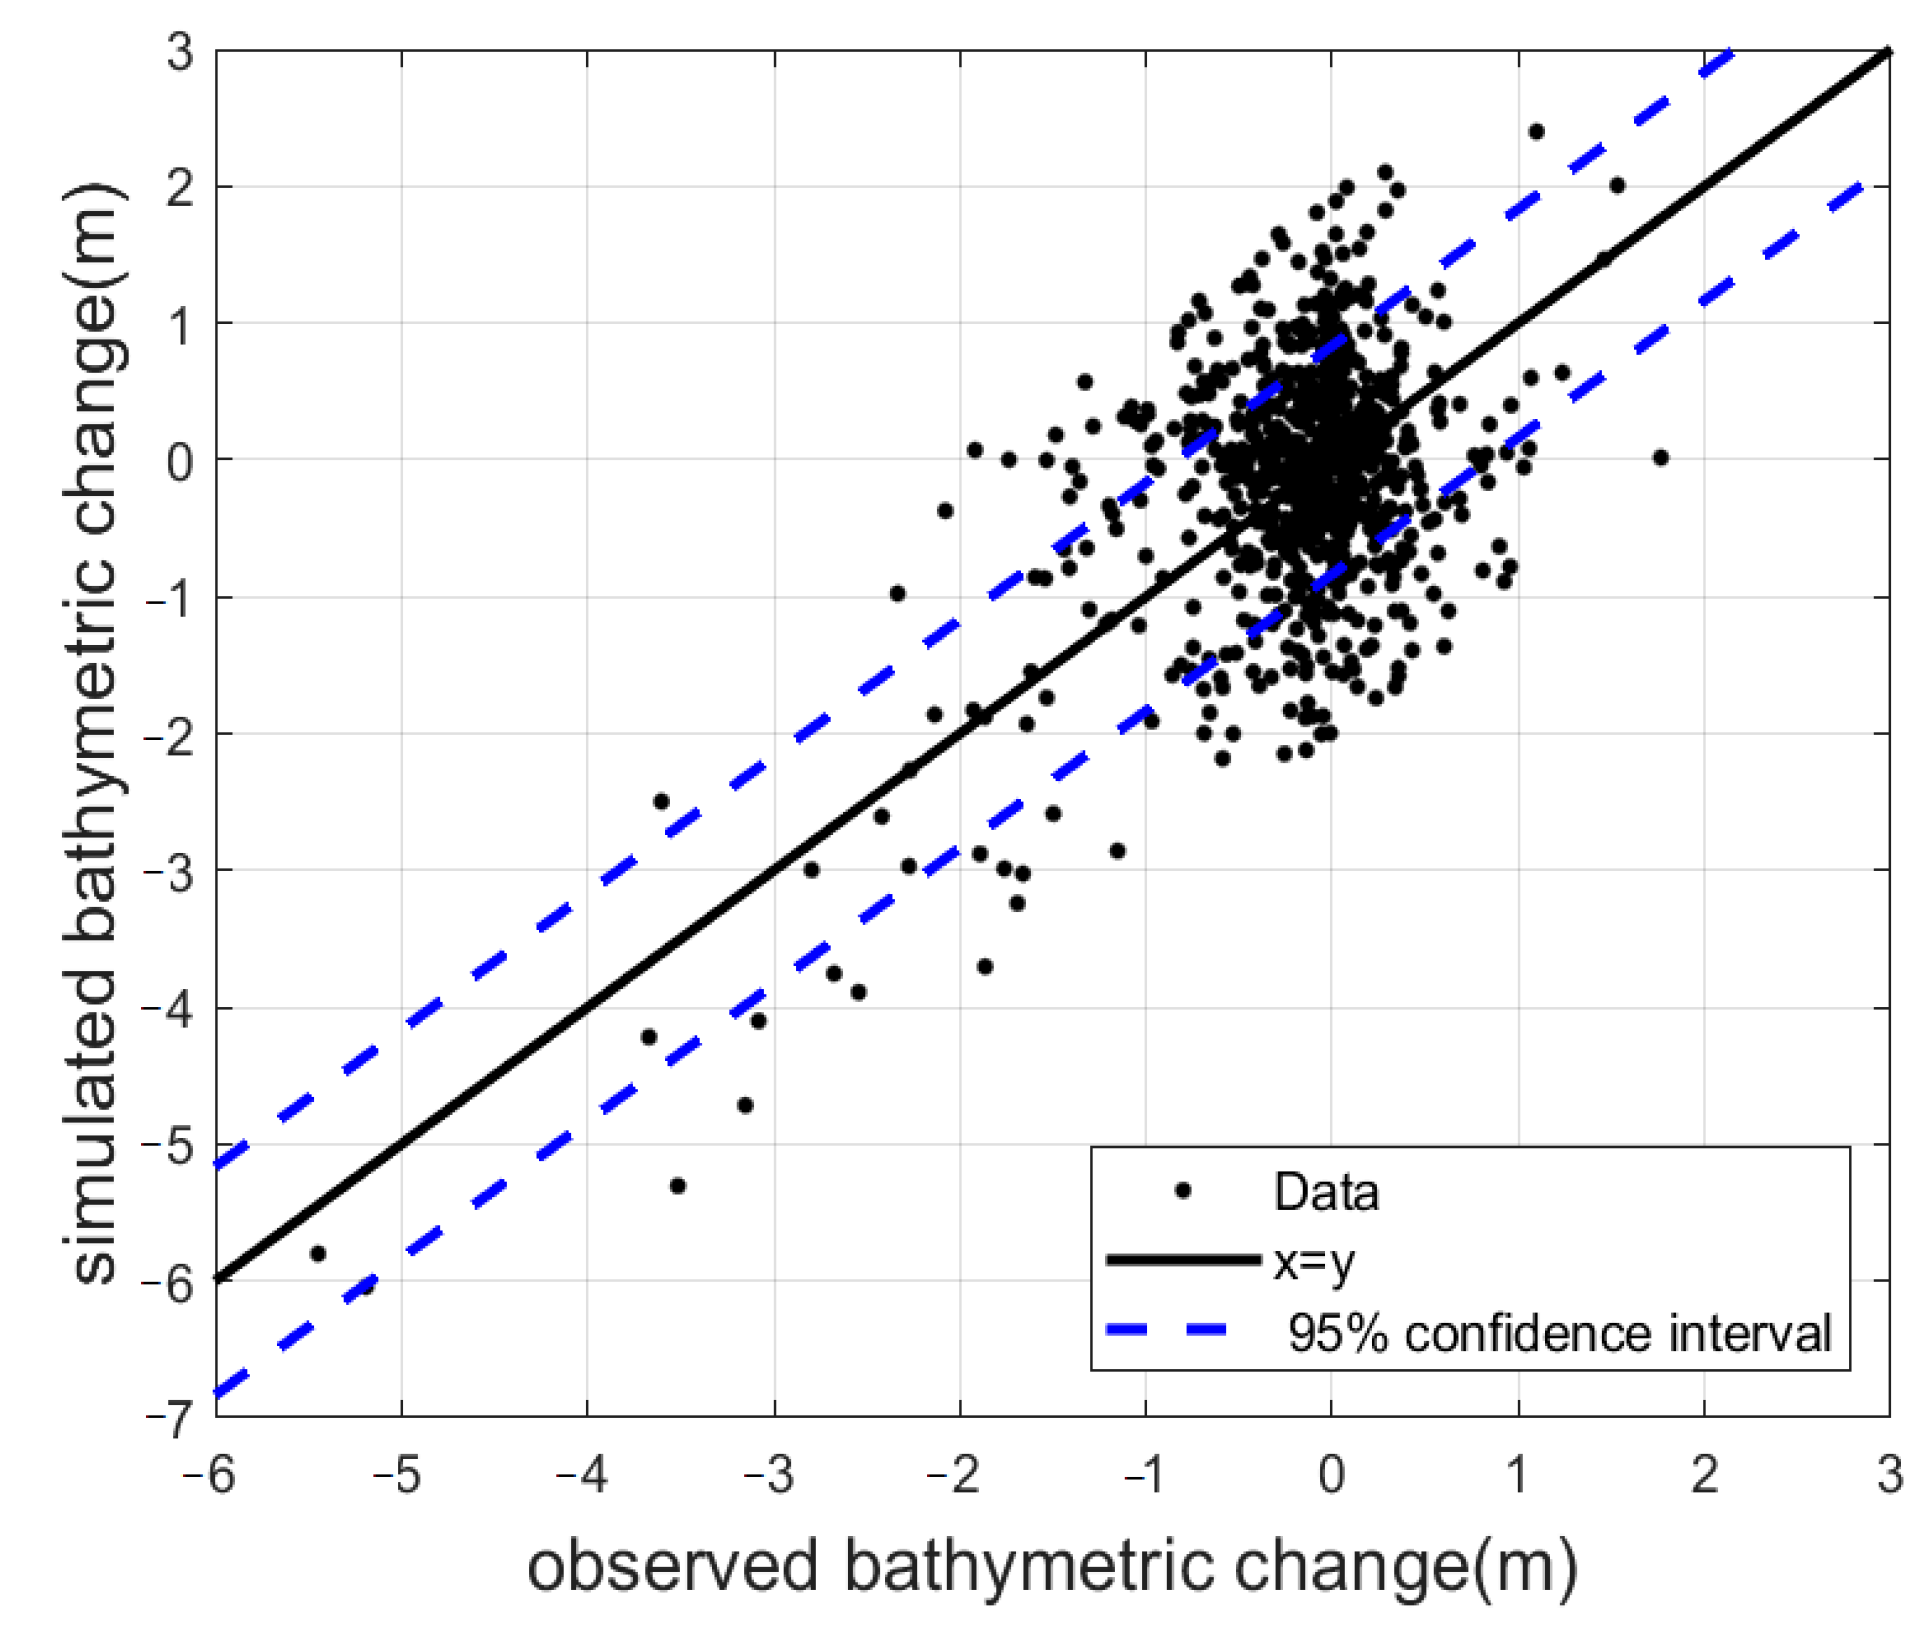
4.1. Model Calibration and Bathymetric Validation

The offshore simulation results of control run offshore wave fields for the three typhoon tracks are shown in Figure 6. Figure 6a–i represent the typhoons Sepat, Wipha, and Krosa at landfall, post-landfall, and post-departure. Then, the wave time series extracted from the large area (offshore region) of those wave field results at the study area served as the boundary conditions for the localized nearshore wind wave field.
The numerical model employed in this study adjusted the parameter values utilizing Typhoon Sepat from 2007. This typhoon originated southwest of Guam, proceeded northwesterly, and ultimately made landfall in Hualien County. The typhoon’s minimum central pressure throughout its lifespan measured 920 hPa, while its wind speed peaked at 53 m/s. Figure 7 visually compares the measured and simulated wave height, period, direction values, and tidal elevation for Typhoon Sepat, presented in descending order from the top. The observed and simulated results for all parameters were closely aligned at each time step, with the error of the maximum value in the time series being less than 10%. Upon completing the trajectory calculation of Typhoon Sepat, the established parameters were utilized for the simulations of the subsequent typhoons, Wipha and Krosa. Figure 8 illustrates the simulation outcomes regarding the coastal morphological variations induced by the three typhoons and the differences between the bathymetry survey data from July 2007 and October 2007. The simulated and observed data demonstrated consistent trends in the morphological changes. Furthermore, the computed alterations in the bathymetry along the Hsinchu Coast resulting from these three typhoons were subsequently validated by comparing the outcomes at all grid nodes with the corresponding measured changes. The mean absolute error for the nearshore nodes, as shown in Figure 8, was 0.34 m, with a standard deviation of 0.83 m. In Figure 9, the two dotted blue lines represent the 95% confidence interval, with the majority of the estimated outcomes falling within this range. Hence, the simulation can be considered satisfactory. This simulation effectively elucidated the hydrodynamic alteration mechanism and the potential shifts in the coastal morphology within the study area.

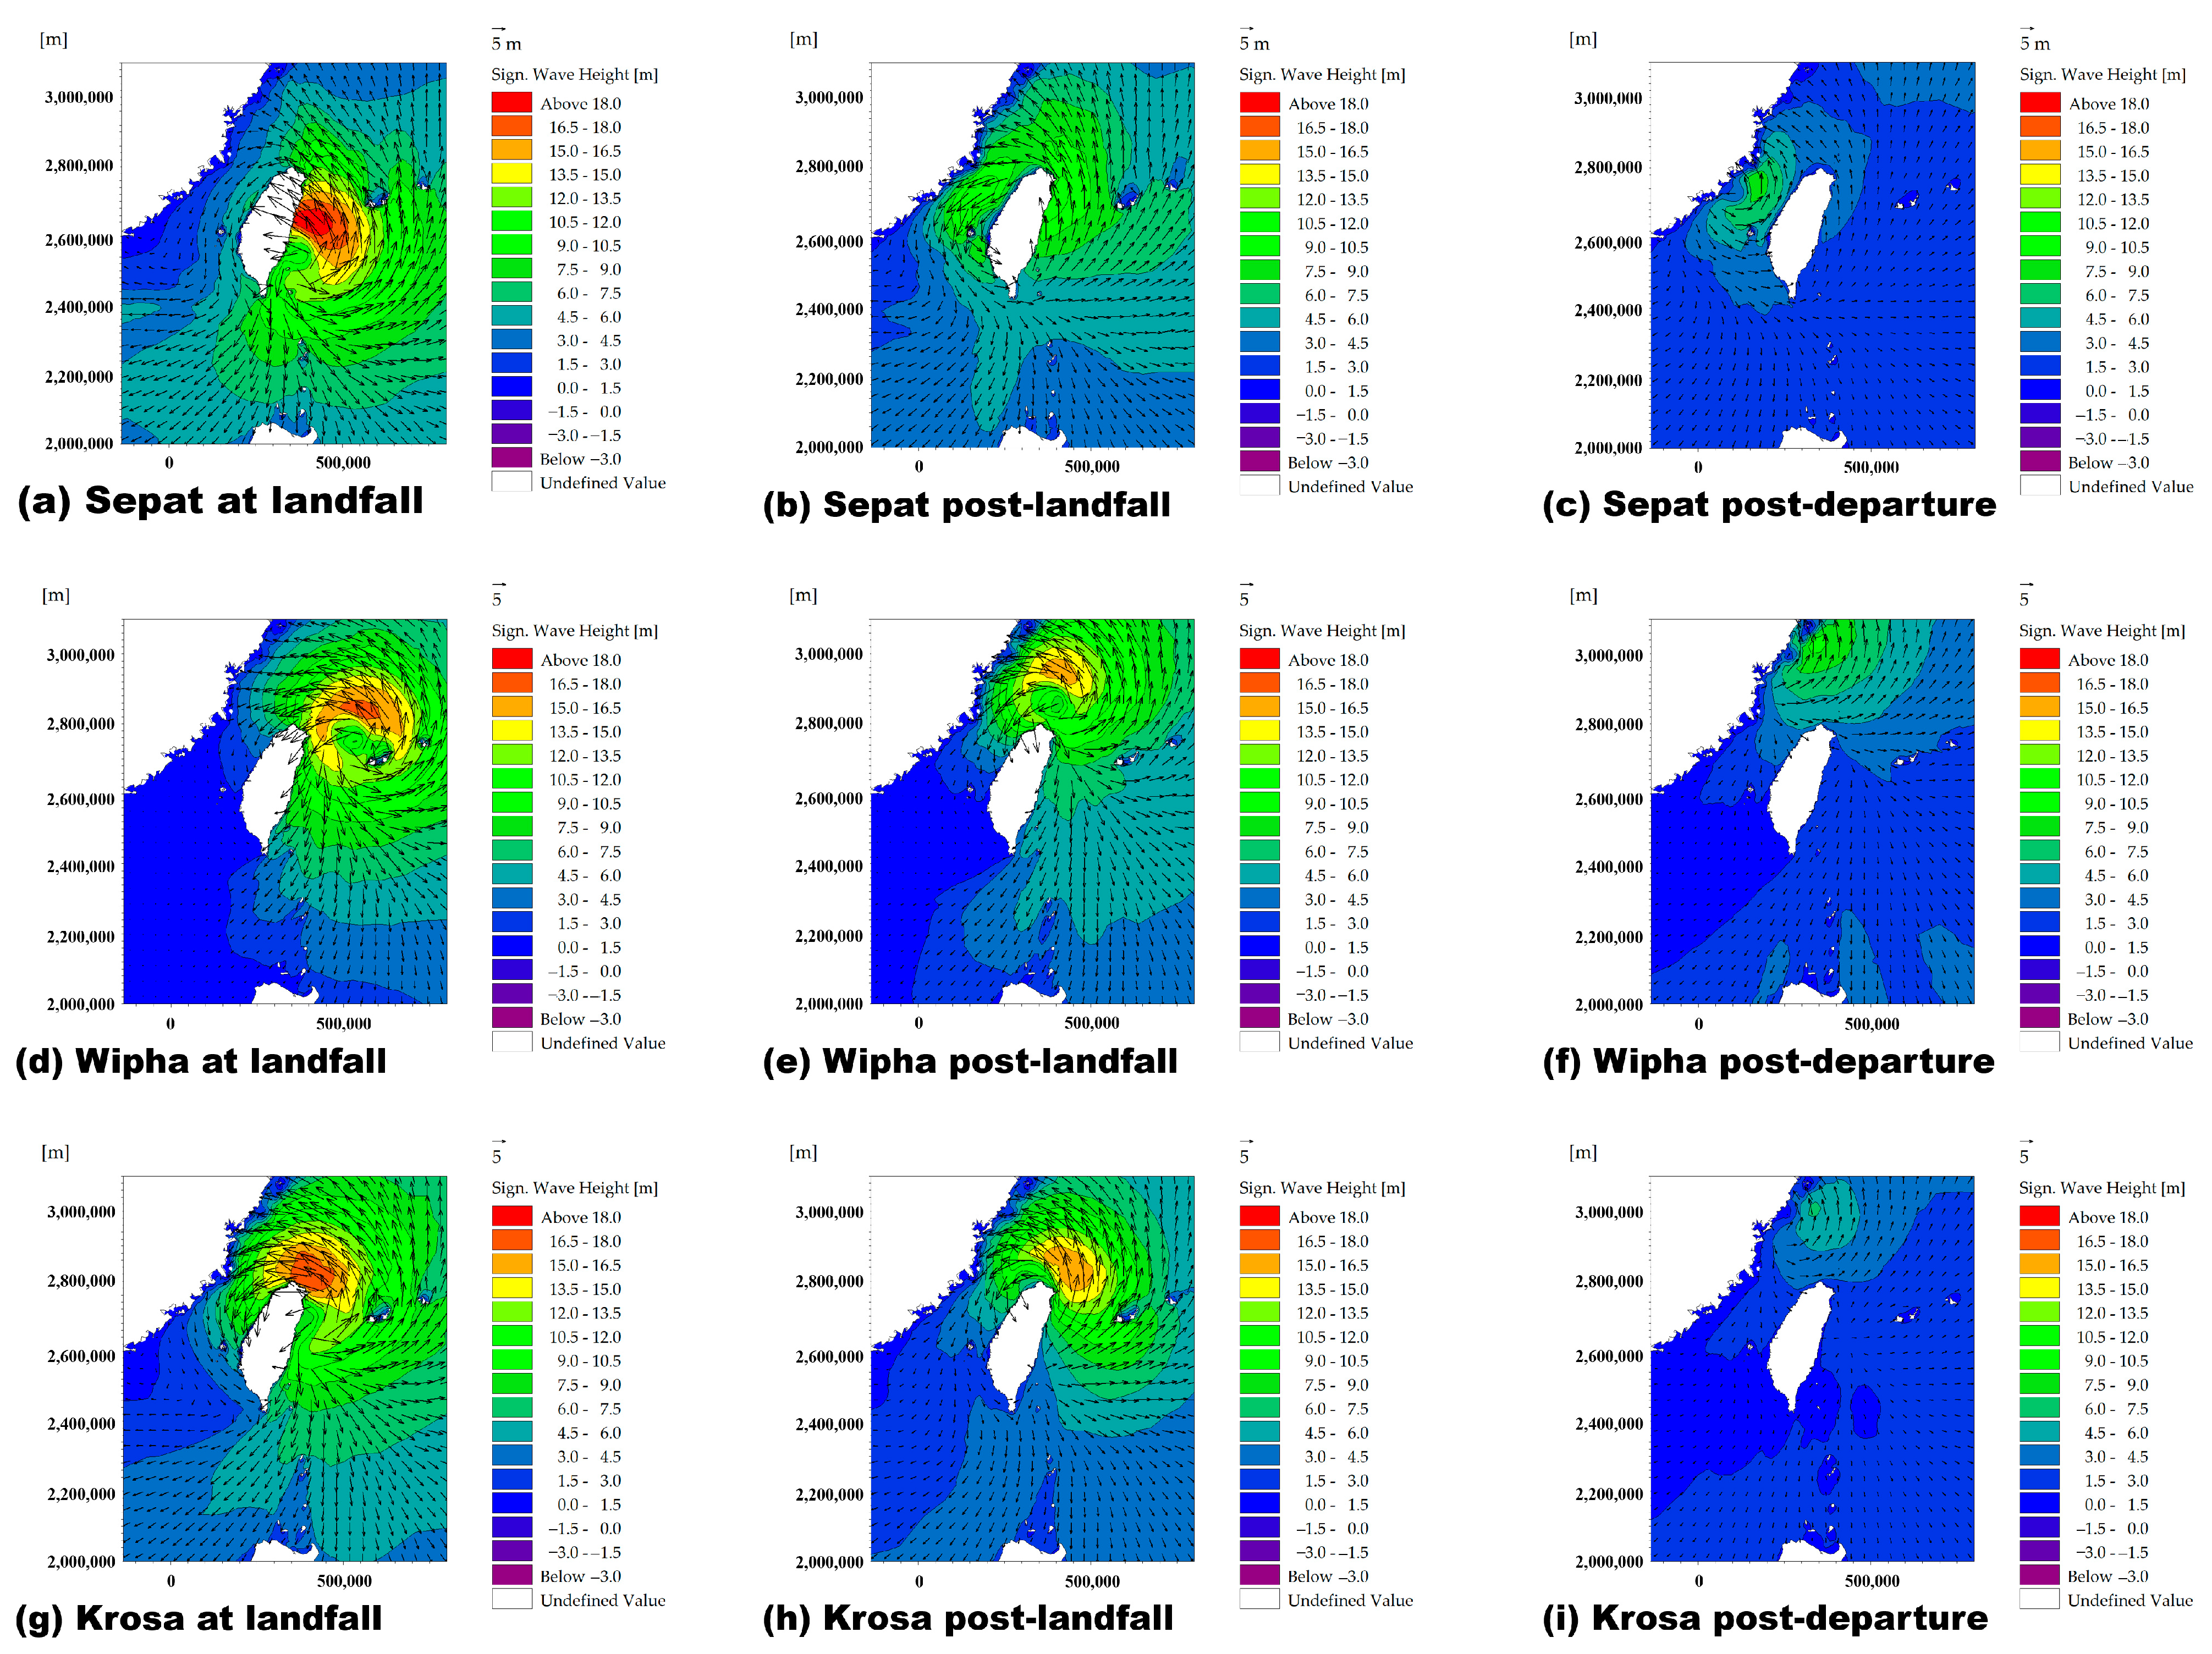
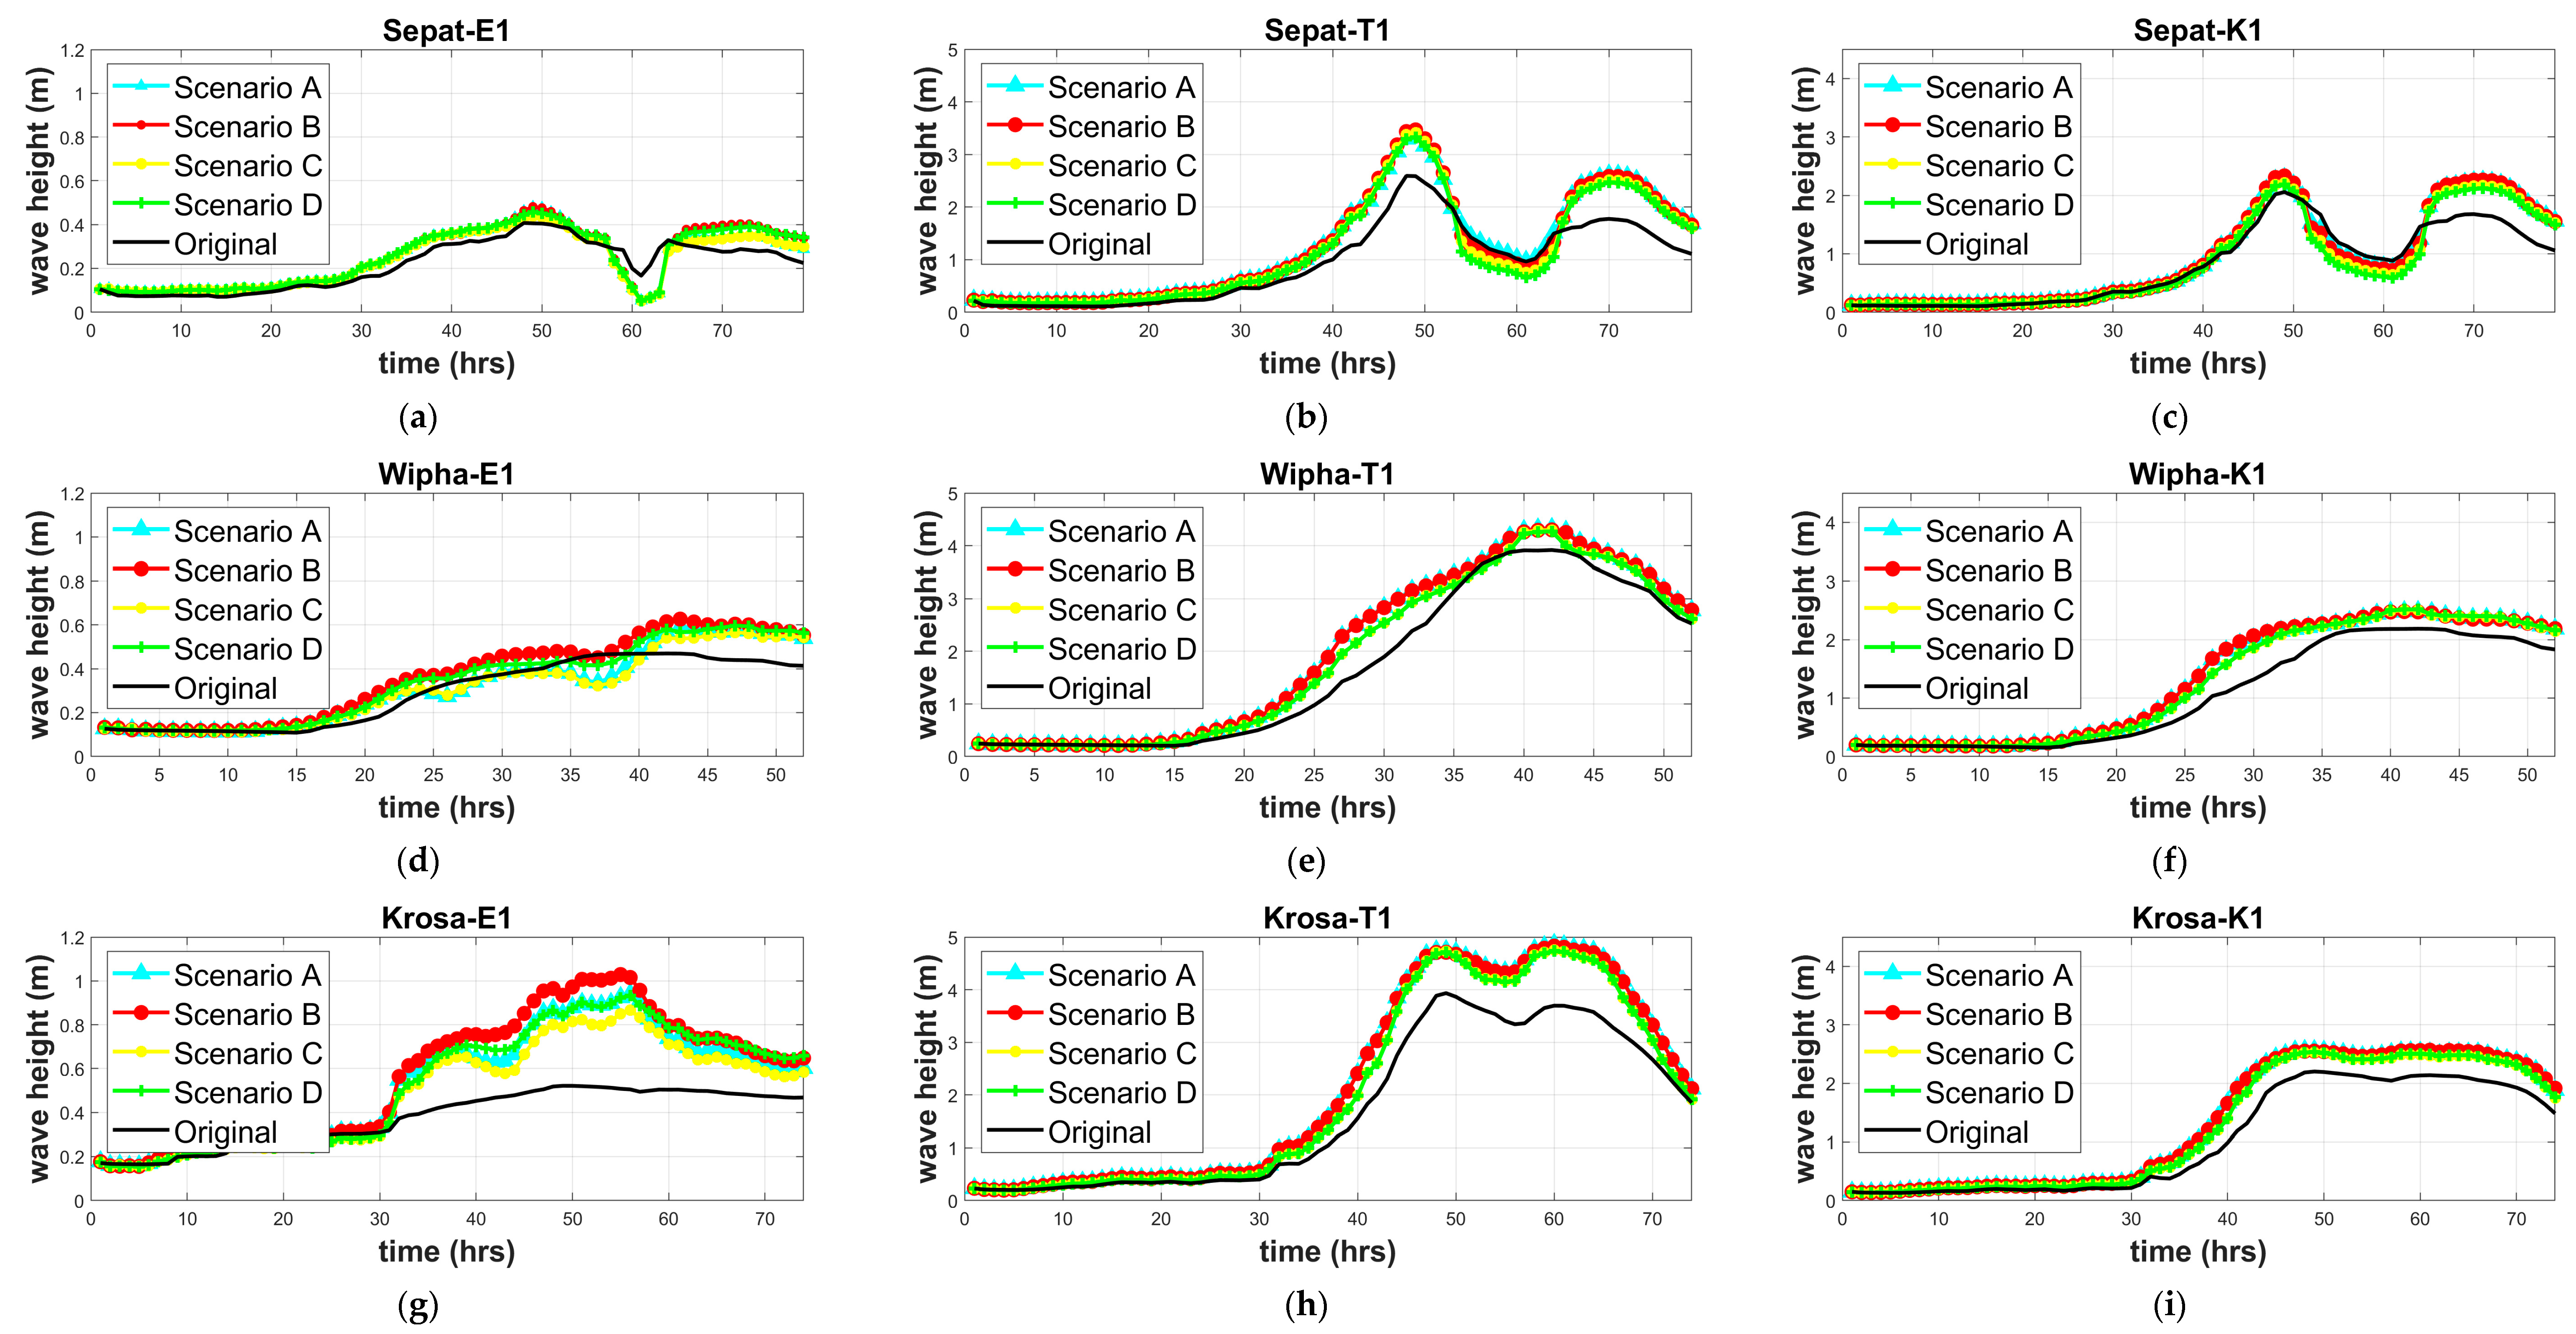
4.2. Impact of Climate Change on Nearshore Wave Processes

The primary results of the simulated nearshore wave height distributions under various climate change scenarios, incorporating extreme water levels and the heightened maximum wind speeds of typhoons, are depicted in Figure 10. The detailed parameter settings are shown in Table 2. The wave height time series at three locations with different characteristics were analyzed and compared. These locations were the Touchien Estuary (E1), the head of the north groin of the Hsinchu Fishery Harbor (T1), and the sea area in front of the Kangnan Seawall (K1). These precise locations are indicated by the red text in Figure 5b. Different scenario outcomes are denoted by lines of varying colors, with climate change Scenarios 1 to 4 represented in blue, red, yellow, and green, respectively. Additionally, the result of the control run simulation is depicted in black. The potential variations in the tides, attributed to astronomical influences over this century [40,41], were not accounted for in the simulated scenarios.
Figure 10a,d,g represent the significant wave height results of the Touchien Estuary (E1) affected by the three typhoons under the climate change scenarios. The comparative analysis revealed the intricate nature of the morphological alterations in the estuarine region. With minimal slopes, the impact range was broader when the sea levels rose. Consequently, the surf zone in this vicinity tended to shift toward the shoreline due to the increased nearshore water depths, which increased the wave height in this area. This phenomenon was particularly pronounced during the occurrence of Typhoons Wipha and Krosa. As the typhoons neared the river mouth, the wave heights during Scenario B (red line) and Scenario D (green line) surpassed those observed during stages Scenario A (blue line) and Scenario C (yellow line). Comparing the scenario results with the control case, it can be found that the wave height simulation results of Tracks 1 and 3 in the estuary area were similar. The typhoon along Track 2 was closest to the study area, so the results were obviously different, and the wave height increased the most.
Figure 10b,e,h, respectively, represent the significant wave height results of the head of the Hsinchu Fishery Harbor’s breakwater (T1) affected by the three typhoons under the climate change scenarios. The waves within the marine vicinity surrounding the head of the breakwater in the Hsinchu Fishery Harbor underwent refraction, resulting in the concentration of the wave energy toward the breakwater head, thereby leading to the highest wave heights at this location. Minimal disparities were observed among the four scenarios. However, akin to the estuarine scenario, the wave height at the head position of the secondary path experienced a more pronounced impact compared to the control case.
Finally, Figure 10c,f,i, respectively, represent the significant wave height results of the sea area in front of the Kangnan Seawall (K1) affected by the three typhoons under the climate change scenarios. The similarity in the results between Tracks 1 and 2 can be attributed to the geographical location of the Kangnan area, situated on the southern side of the Hsinchu Fishery Harbor. Consequently, the waves emanating from the north were obstructed by the fishery harbor, resulting in minimal disparities in the wave conditions across the climate scenarios. Despite the waves along typhoon Track 2 remaining unaffected by the presence of the Hsinchu Fishery Harbor, the typhoon’s potency notably diminished as it traveled from east to west, primarily due to the influence of the Central Mountains. Consequently, the simulation outcomes pertaining to the wave height along the southern coast of the harbor closely resembled those of the control scenario.
In addition, the maximum wave heights during the simulation period of the three tracks for the four climate change scenarios and the corresponding statistical results are presented in Table 3. Based on the wave statistics presented in Table 3, it is observed that in the study area, under the influence of climate change, significant variations occurred in the typhoon-induced waves, particularly along Tracks 1 (Typhoon Wipha) and 2 (Typhoon Krosa), resulting in substantial alterations in the estuarine region, ranging from 21.28% to 34.04% and from 21.28% to 98.08%, respectively. Similarly, for Track 3 (Typhoon Sepat), noteworthy wave changes were noted at the embankment head, ranging from 27.41% to 29.43%. Furthermore, when assessing the impact of climate change on the coastal area in the study region, Track 2 (Typhoon Krosa) exhibited the most pronounced effects. The average predicted increase in the wave height by the end of the century ranged from 15.68% to 81.25%, which was significantly higher than the corresponding changes along Tracks 1 (Typhoon Wipha) and 3 (Typhoon Sepat), which ranged from 5.94% to 28.18% and 9.69% to 27.13%, respectively.

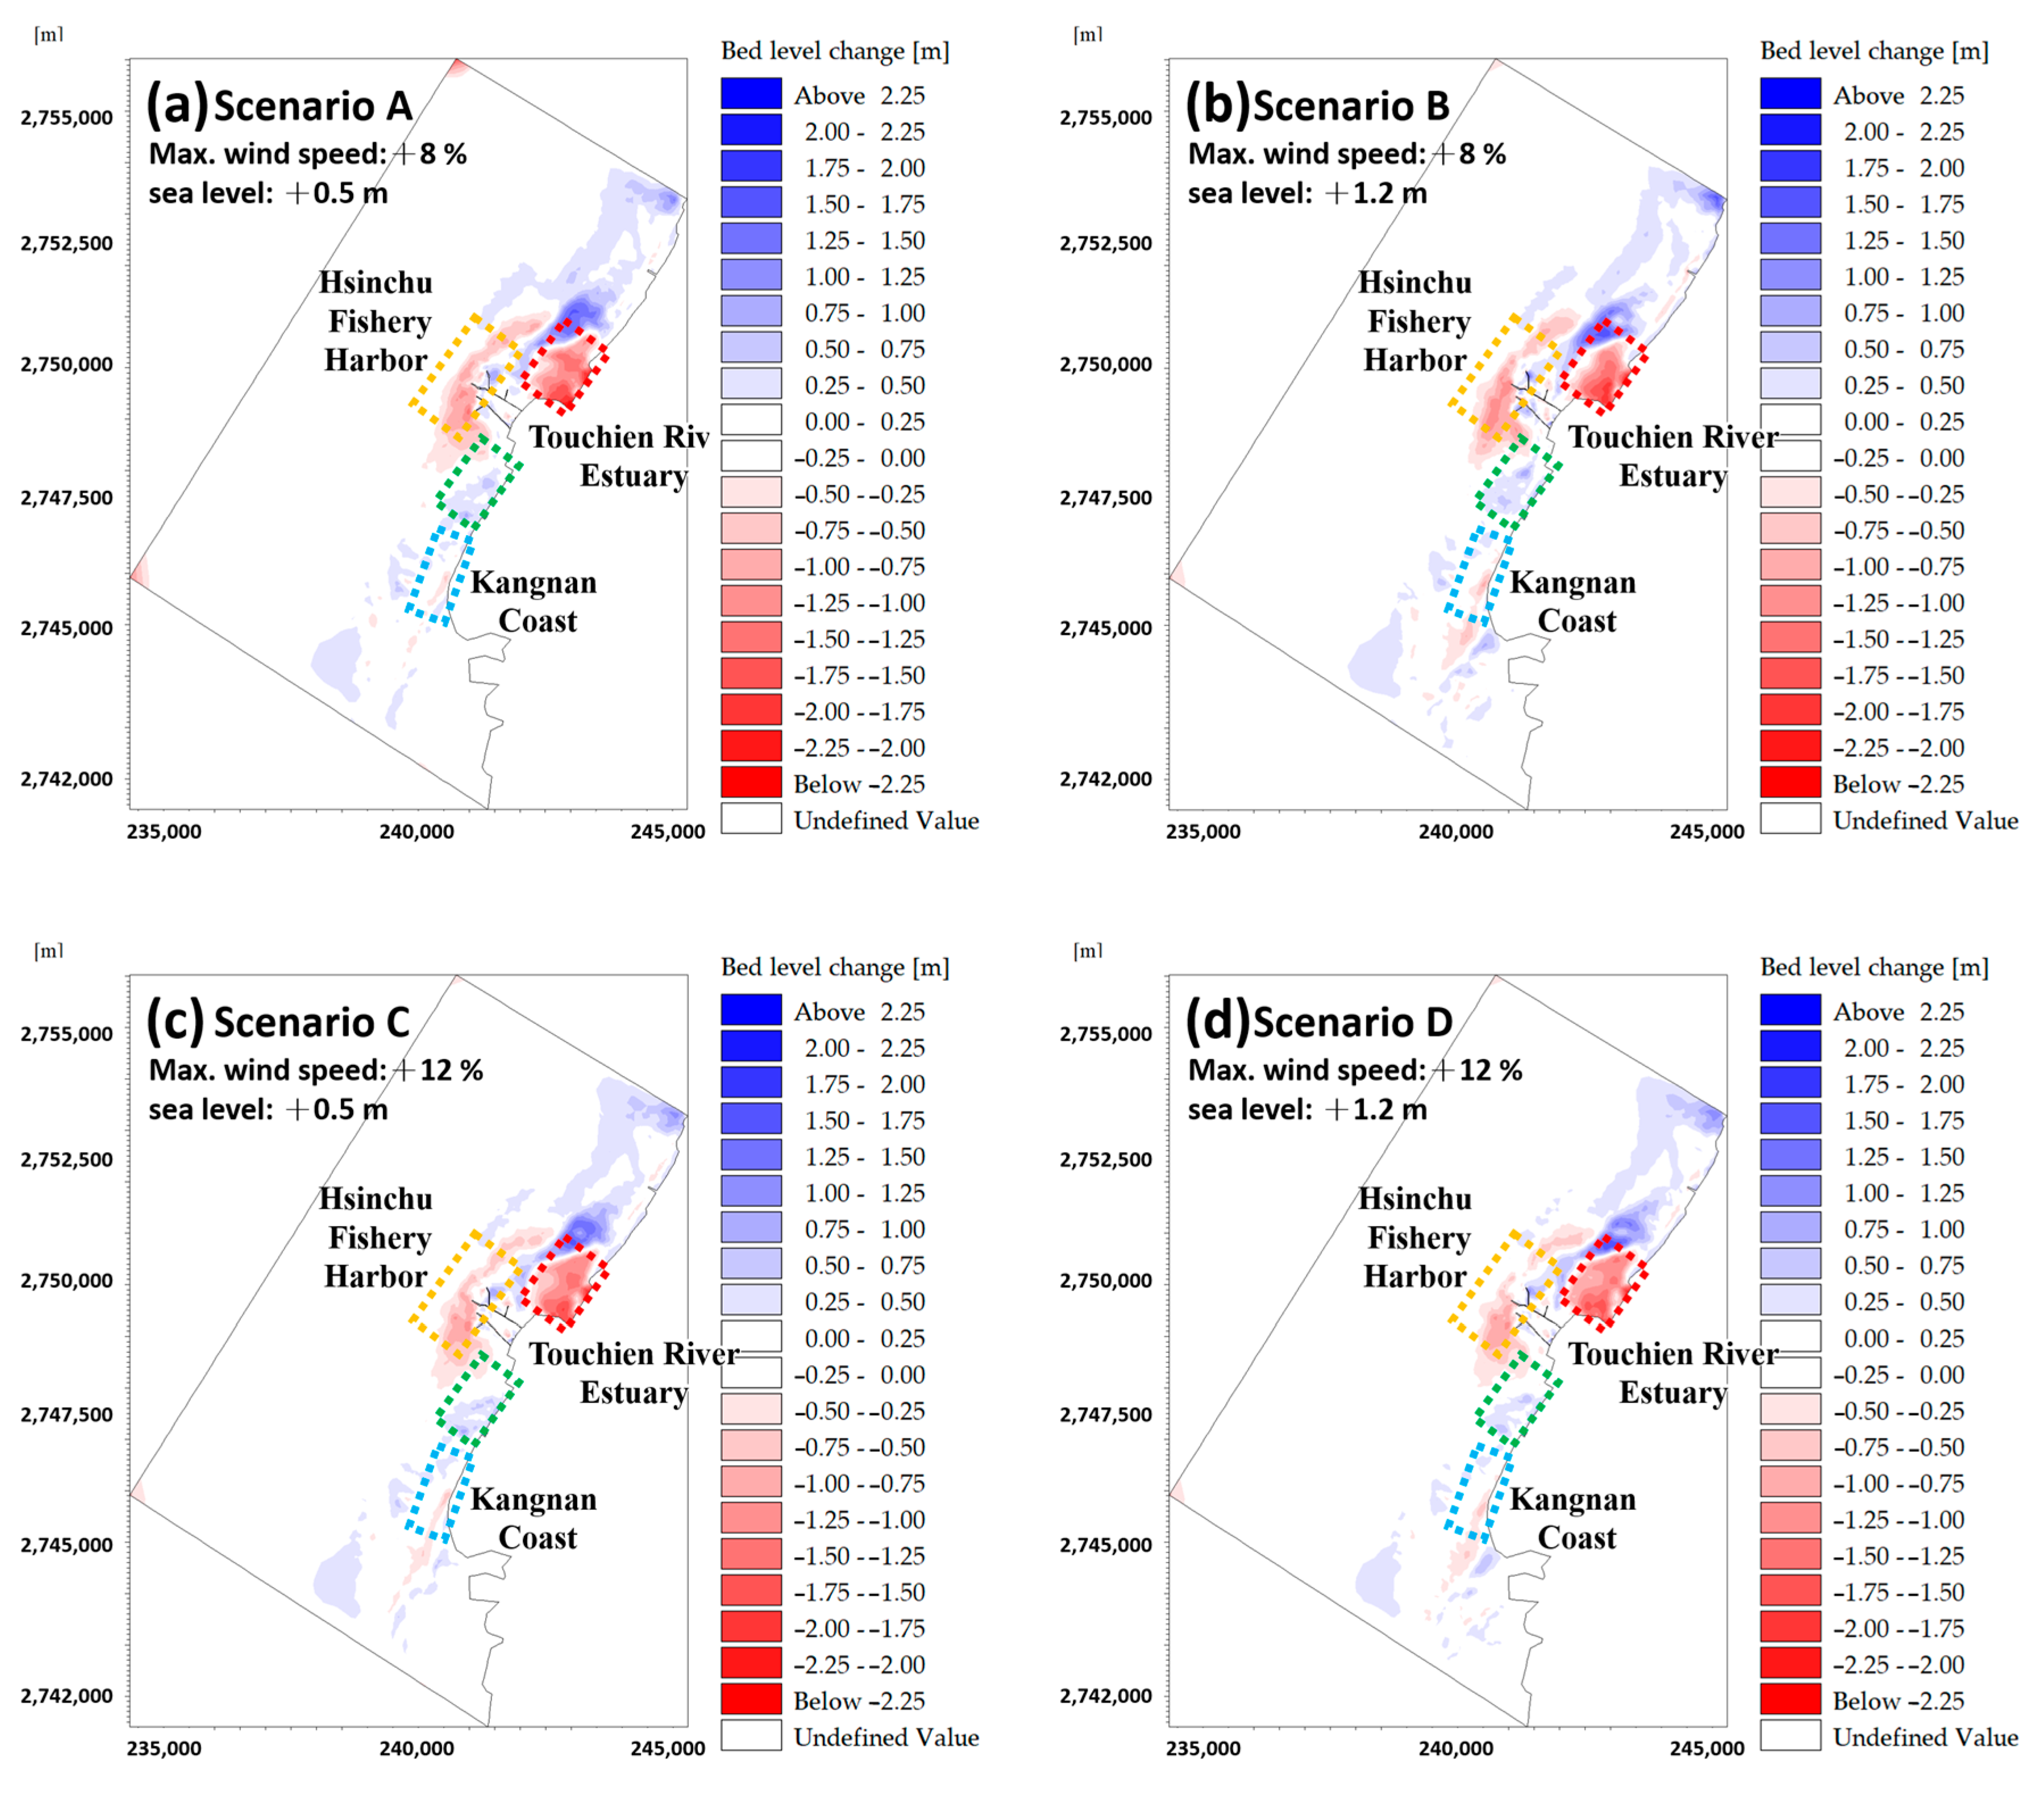
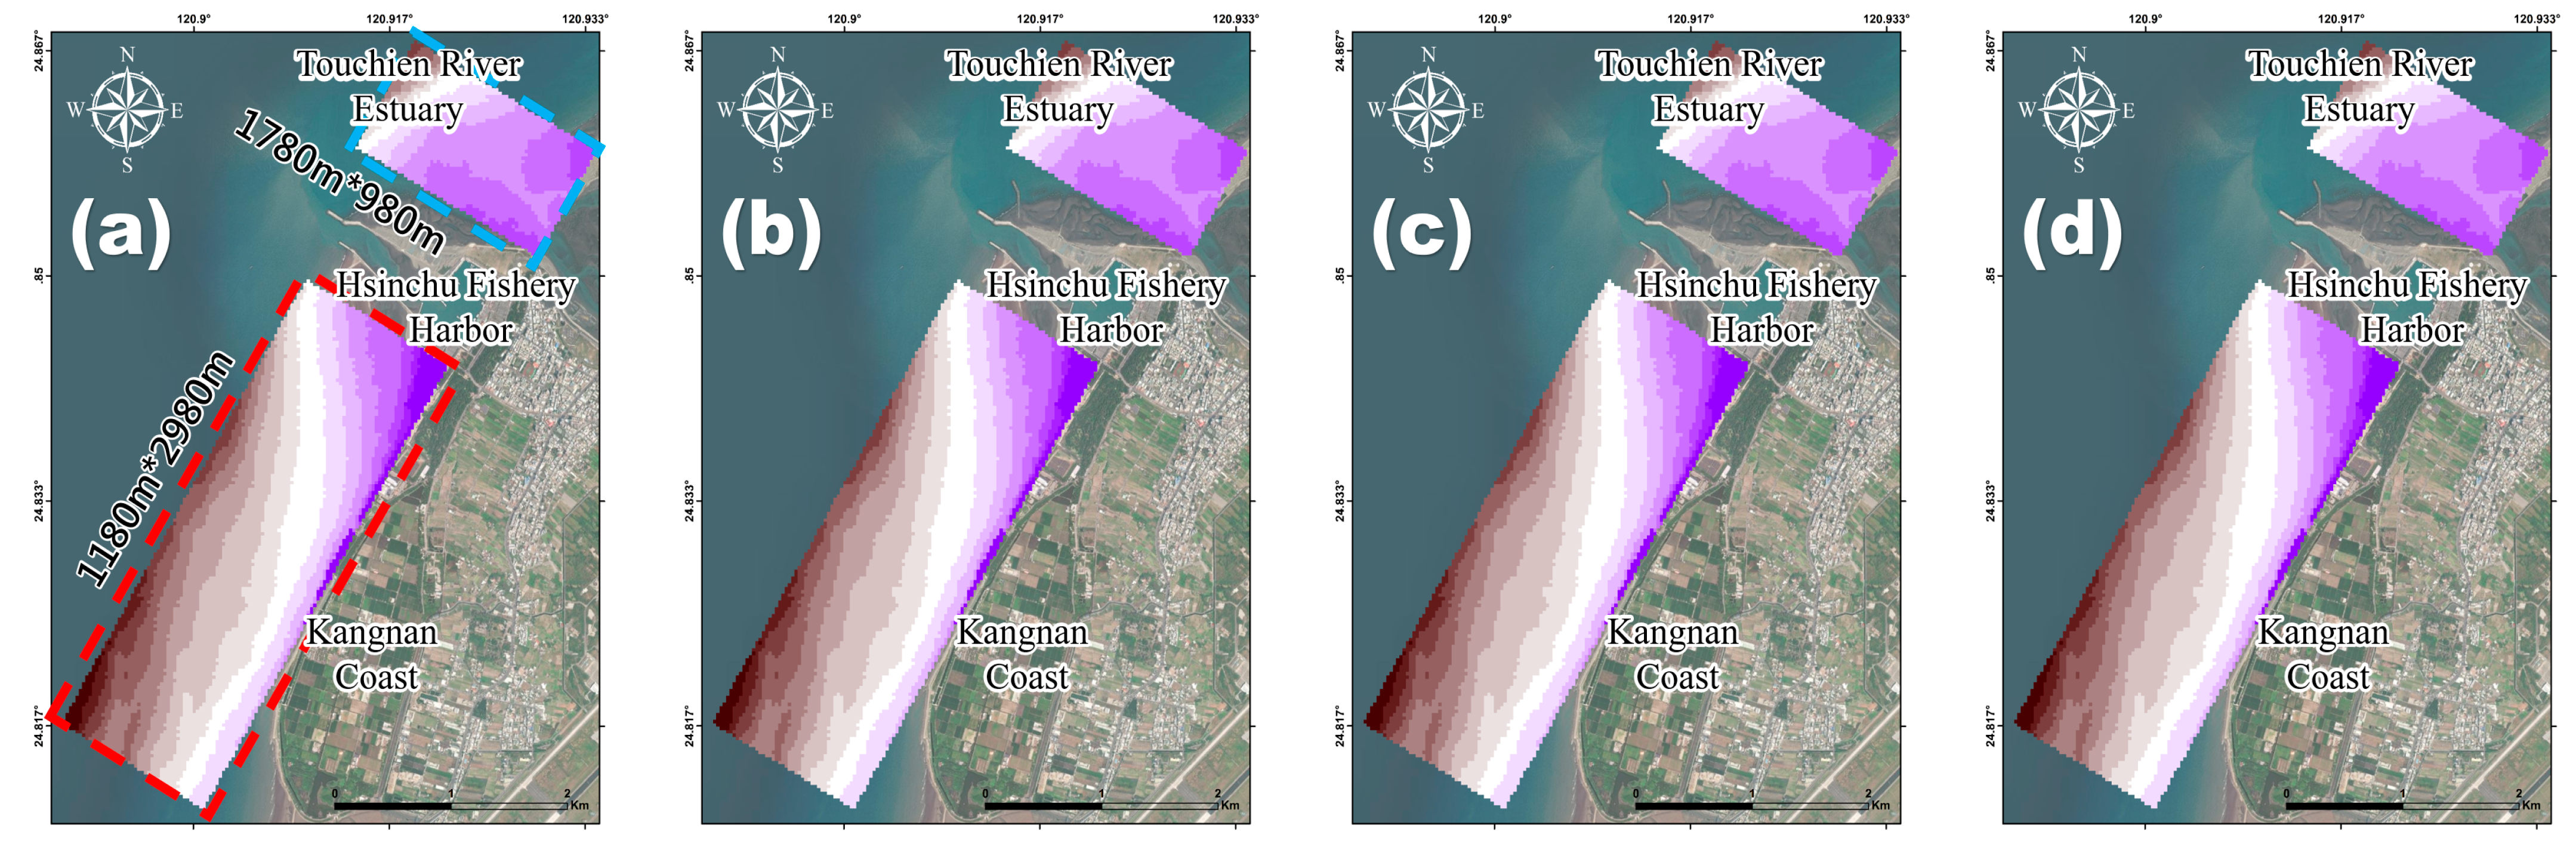
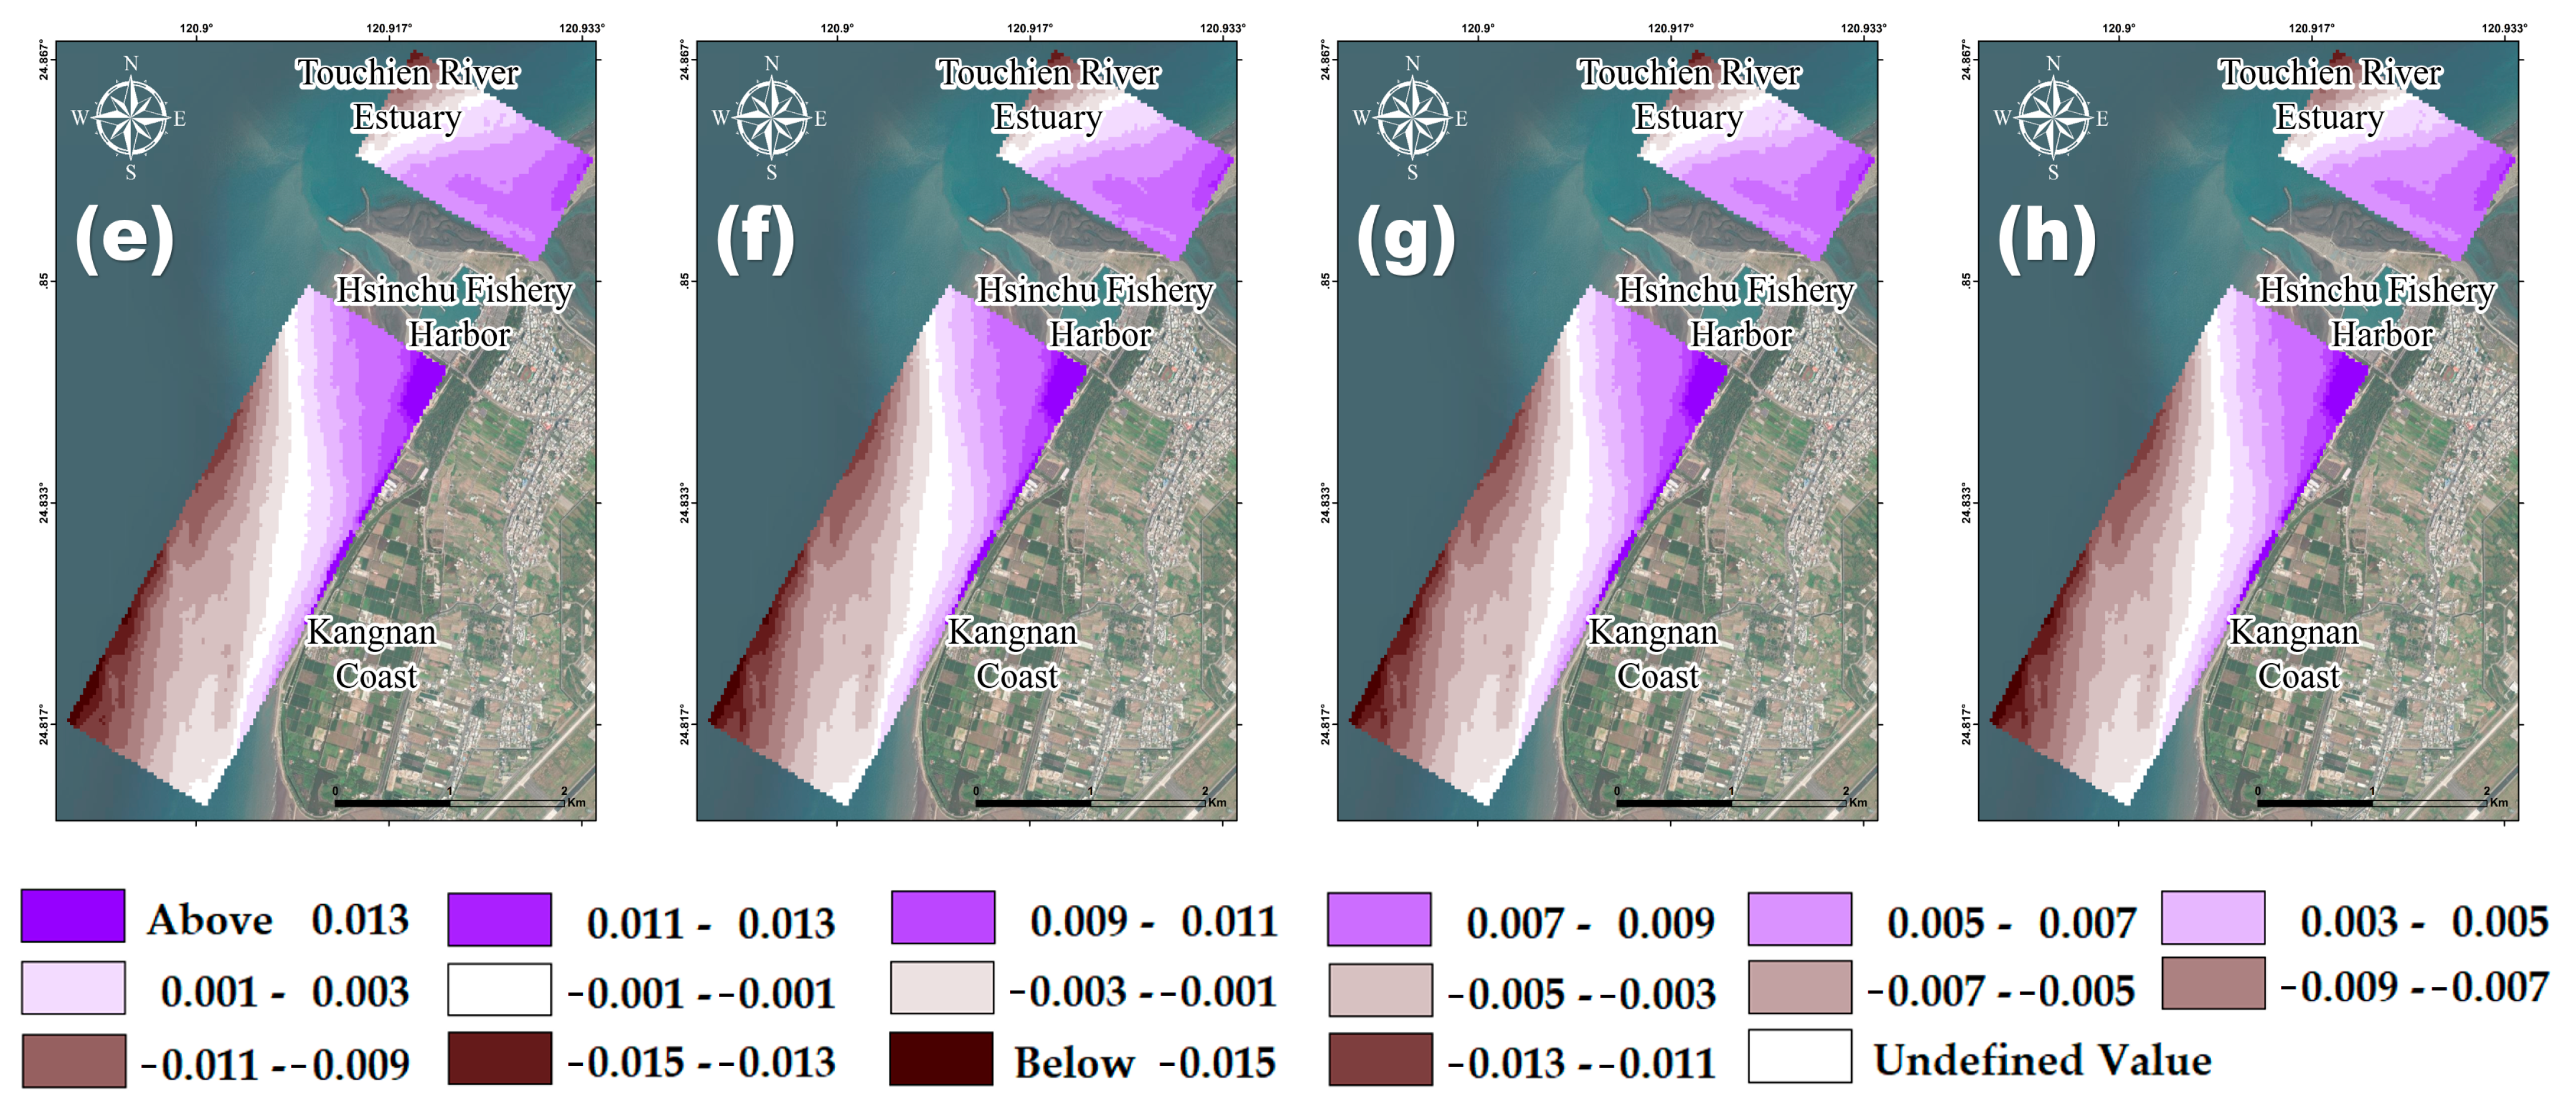
4.3. Impact of Climate Change on Nearshore Morphological Processes

Typhoons typically induce significant erosion and accretion along the Taiwanese coast due to the intense waves and currents, which serve as dynamic forces propelling sediment transport [12,22]. In this simulation project, during the period spanning July to October 2007, three typhoons, namely, Sepat, Wipha, and Krosa made landfall in the northeast or very close to the study area. The simulation results of the extreme typhoon events under the four climate change scenarios regarding the coastal morphological trends on the Hsinchu Coast are shown in Figure 11a–d, respectively. The blue color represents sediment accumulation, while the red color signifies sediment erosion.
For the analysis and discussion, the morphological change simulations were categorized into four distinct areas as follows: the estuary area, the head of the breakwater, the sheltered area, and the Kangnan coast section. These areas are delineated by red, orange, blue, and green in Figure 11, respectively. First, in the Touchien Estuary (marked by the red frame), the estuarine areas were increasingly vulnerable to the effects of climate change. Predicting the shifting patterns of river discharge and sediment transport has emerged as a key objective for numerous researchers. However, estuaries and river basins exhibit diverse regional features [42]. Consequently, the influence of climate change on river discharge and sediment generation varies considerably from one location to another. For instance, regions such as Spain [43], the Rhine–Meuse delta in the Netherlands [44], the Gold Coast of Australia [45], and the debris flow system in the Swiss Alps (the Illgraben) [46] are experiencing a trend of diminished river discharge or reduced sand supply.
In the study region, the river discharge statistics, as detailed in Section 2.3, indicated a significant decline in the average river discharge in the Touchien Estuary along the Hsinchu Coast over the past 5 years, compared to the preceding 25 years, decreasing by 30.2%, from an average of 10,593.13 m3/s to 7392.28 m3/s. However, in simulating typhoon events, the model in this study utilized actual flow time series data, neglecting variations in the river discharge due to climate change. Nevertheless, the examination of the coastal morphological changes under the four scenarios depicted in Figure 11a–d illustrated a persistent trend of substantial erosion in the estuarine area. This suggests a forthcoming escalation in estuarine erosion as climate change exacerbates river discharge and sediment supply reductions.
Furthermore, observations at the head of the breakwater (marked by the orange frame) and the sheltered area (marked by the green frame) revealed significant impacts on the coastal dynamics. The sea area in front of the breakwater experienced concentrated wave energy, leading to erosion tendencies. The sediment disturbed in this area was then transported south toward the Hsinchu Fishery Harbor and gradually deposited in the sheltered area characterized by lower wave energy, thereby fostering a trend of accretion. These simulation outcomes align with the findings of long-term coastal morphological change trend analyses, as illustrated in Figure 1b–e.
Lastly, in the coastal vicinity of the Kangnan Seawall, unlike the Touchien Estuary, there is an insufficient sandy beach area for retreat. Consequently, a rise in the sea level will directly increase the water depth in this location, displacing the surfing zone toward the roadside, where substantial wave energy is present. This situation may result in seawall damage or the occurrence of wave overtopping, thereby disadvantaging protection targets on the inland side. Consequently, the erosion trend in the seawall area depicted in Figure 11b–d is anticipated to be more severe than that in Figure 11a–c.

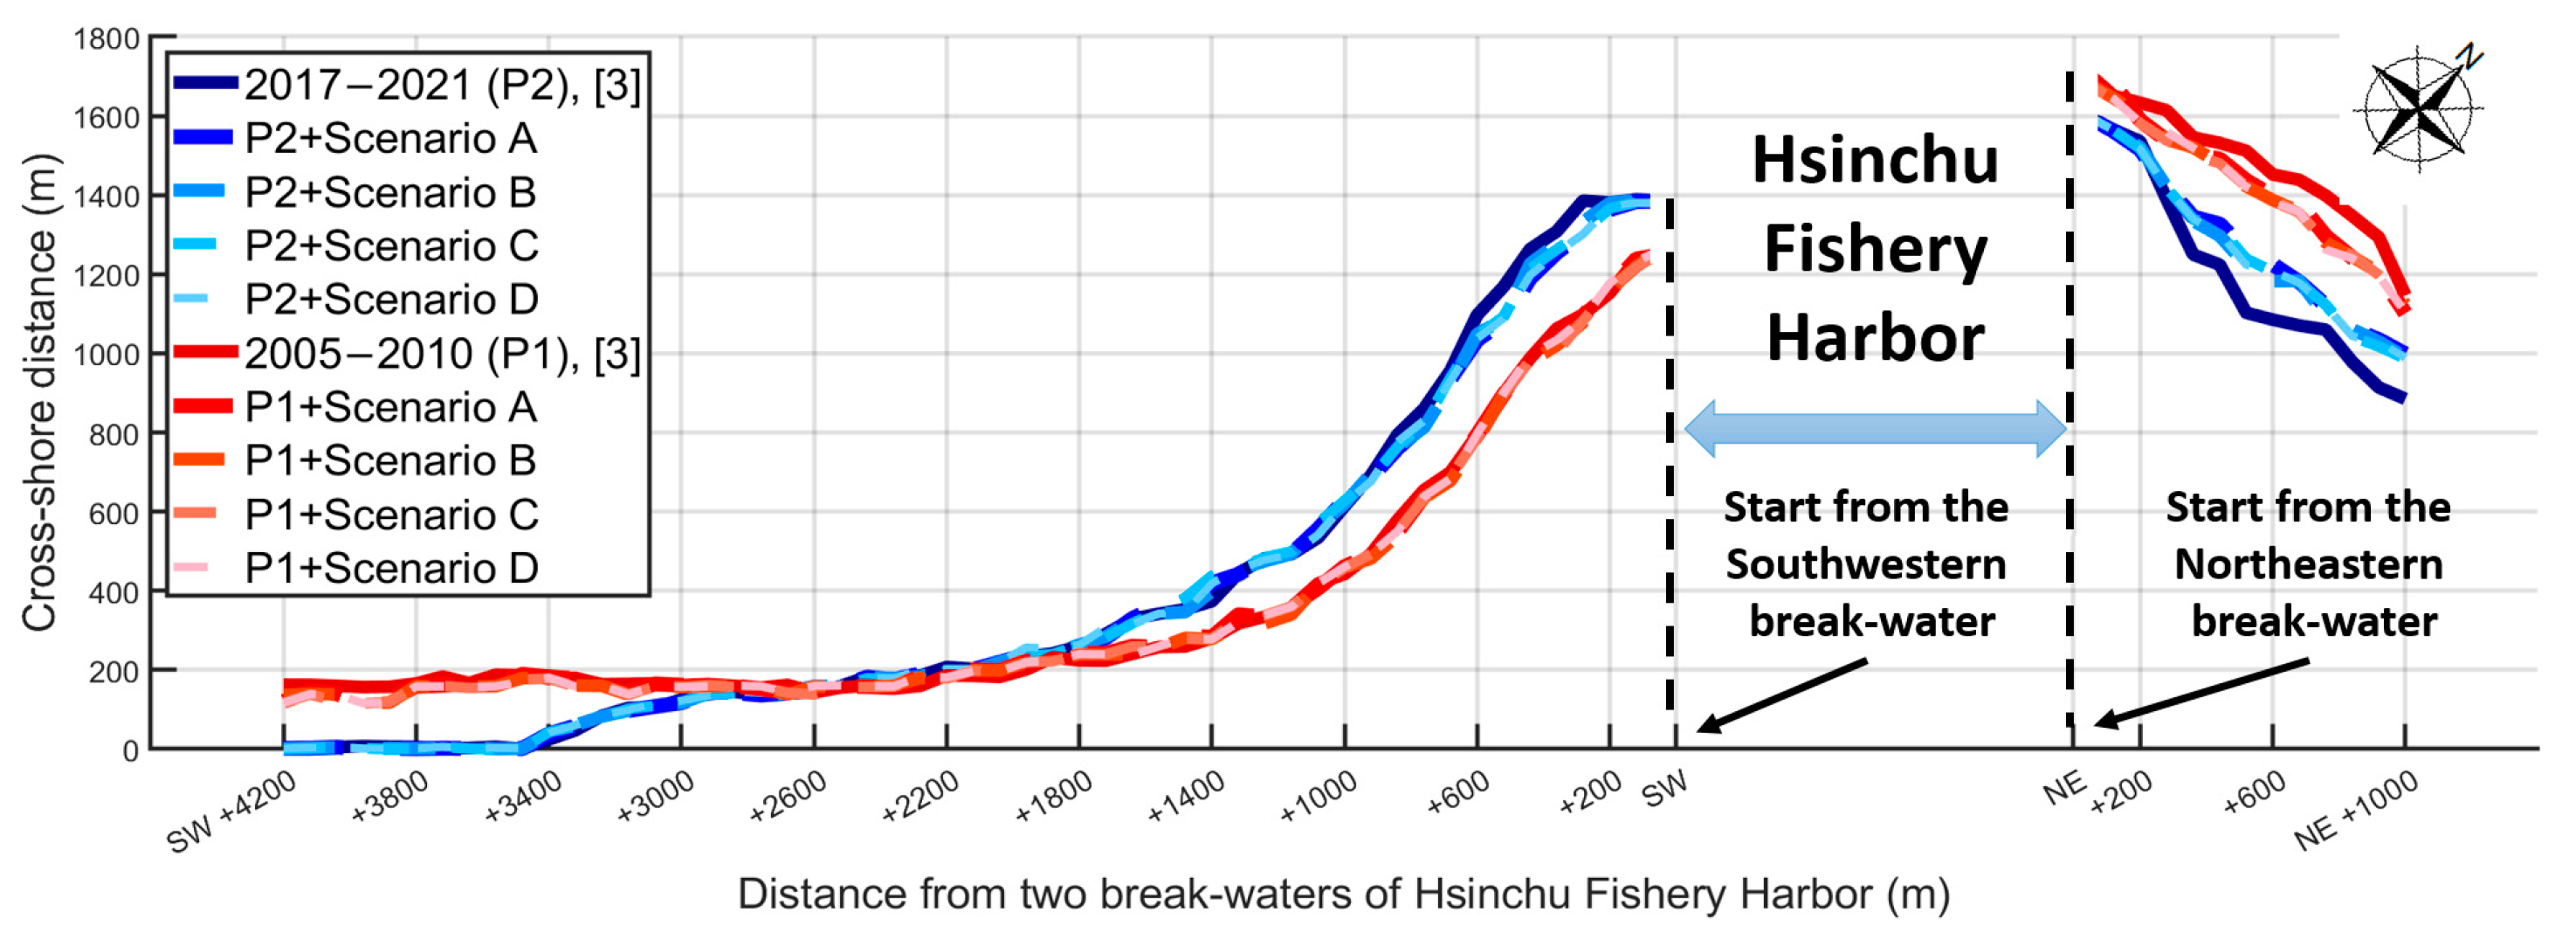
4.4. Impact of Climate Change on Anthropogenic Influences along the Hsinchu Coast

This study employed the EOF method to analyze two Hsinchu coastal bathymetry datasets (2005 to 2010 and 2017 to 2021) alongside the four distinct climate change scenarios, aiming to discern the primary influential factors impacting the study area—specifically, the relationship between the structure and wave energy [3]. It sought to ascertain whether this interaction would alter the magnitude and extent of the impact on the coastal morphology along the Hsinchu Coast under the conditions of climate change. Building upon the original analytical framework proposed by Huang [3], this study expanded the analysis to incorporate climate change scenarios. Drawing from Huang’s delineation of two different time intervals for the EOF analysis (2005–2010 and 2017–2021), nine soundings from 1998 to 2021 were sampled for each interval, spanning 2005 to 2010 and 2017 to 2021. The dataset was then interpolated and standardized into two grids measuring 1800 m × 1000 m and 1400 m × 4200 m, encompassing a total of 19,200 elements (shown in Figure 12a).
The EOF analysis results of the first set of bathymetry survey data (2005–2010) examined under the four distinct climate change scenarios are depicted in Figure 12a–d. Similarly, the EOF analysis outcomes of the second set of bathymetry survey data (2017–2021), scrutinized under the same four climate change scenarios, are presented in Figure 12e–h. In Figure 12, the positive component (depicted in purple) signifies the morphological changes associated with structures, whereas the negative component (illustrated in dark brown) signifies the morphological changes unrelated to structures.
Figure 13 represents the one-dimensional impact range of the primary influential factor, defined as the interaction between the wave energy and anthropogenic structures, depicted for the study area. The red and blue lines illustrate the analysis outcomes for Scenarios A through D during the respective periods of 2005–2010 and 2017–2021. The colors, ranging from dark to light, denote the results obtained by Huang [3] and Scenarios A through D.
Through the comparison depicted in Figure 13, we analyzed the variations in the extent of the influence across different scenarios. Aside from some alterations observed in the Touchien Estuary, the influence range in the coastal area south of the Hsinchu Fishery Harbor remained broadly consistent, irrespective of the coastal direction, with no significant changes noted. Furthermore, in addition to assessing differences in the impact range, attention was also directed toward variations in the impact weighting. Table 4 presents the corresponding impact weightings of the eight EOF analysis outcomes obtained in this study, alongside those of Huang (2023) [3], derived from the EOF analysis results spanning 2005 to 2010 and 2017 to 2021. The data in Table 4 indicate that the disparity in the current situational results based on the first and second sets of bathymetry survey data and the analysis outcomes of Huang (2023) [3] was within 2.5%. Overall, the difference remained relatively unchanged. Therefore, based on the comparison of the aforementioned impact ranges and their corresponding weightings, it can be inferred that the impact of anthropogenic structures on the coastal morphology surpasses that of climate change on such alterations. Similar concepts were identified by Dunn [10]. This research simulated the impact of anthropogenic structures on sediment transport in estuaries under future climate change scenarios based on the end of the 21st century. The findings indicated that sediment fluxes in most of the deltas studied are projected to decline, with the reduction primarily driven by human activities, such as altered land management practices and dam construction, rather than by future climate change. Despite the research area and characteristics of Dunn [10] being different from this study, both studies were analyzed using the same time scale and assumptions (both are analyzed with references AR5 and AR6), leading to consistently similar conclusions. Thus, the findings of this analysis are inferred to hold significant reference value. It is clear that in certain coastal areas, the impact of anthropogenic structures is more significant than that of climate change on coastal morphology. This underscores the need to not only actively mitigate climate change effects on coastal areas presently but also develop corresponding strategies to mitigate the impact of anthropogenic constructions on coastal morphology, thereby promoting sustainable coastal development.

5. Conclusions

A numerical model, MIKE 21, was employed to simulate the distribution of waves and the trends of the coastal morphological changes at the Hsinchu Fishery Harbor by the end of the century under various climate change scenarios. The results indicated that the wave height distribution along the coast of the Hsinchu Fishery Harbor increased notably under the influence of a typhoon following Track 2. This increase ranged from 15.68% to 81.25%. Along Tracks 1 and 3, the increase ranged between 5.94% and 28.18% and 9.69% and 27.13%, respectively. Regarding changes in coastal morphology, the diminishing river discharge due to climate change would exacerbate the erosion potential in the estuary. As the wave energy amplifies over time, erosion in the breakwater head of the Hsinchu Fishery Harbor would persist, with sediment disturbances and shifts leading to deposition in sheltered areas. Ultimately, the Kangnan Seawall area would face the risks of erosion and potential wave overtopping in the future. Furthermore, this study uses the empirical orthogonal function method to analyze the simulation results of coastal morphological change trends in climate change scenarios. Then, using the results of EOF analysis to compare the impact ranges and weightings of anthropogenic structures in both current and future scenarios reveals minimal changes in their influence on coastal morphology under climate change scenarios. Therefore, it is concluded that anthropogenic structures significantly impact coastal morphology more than climate change. This study also provides a new method for other coastal areas with similar coastal characteristics to evaluate the relationship between climate change and the impact of structures on coastal morphological changes.

Author Contributions

Conceptualization, W.-P.H. and J.-C.H.; formal analysis, W.-P.H., J.-C.H. and C.-J.Y.; methodology, W.-P.H. and J.-C.H.; resources, W.-P.H.; software, J.-C.H. and C.-J.Y.; supervision, W.-P.H.; visualization, W.-P.H. and J.-C.H.; writing—original draft, W.-P.H. and J.-C.H.; writing—review and editing, W.-P.H. and J.-C.H. All authors have read and agreed to the published version of the manuscript.

Funding

The authors gratefully acknowledge the Ministry of Science and Technology, Taiwan, Project No. NSTC 112-2625-M-019-003-.

Institutional Review Board Statement

Not applicable.

Informed Consent Statement

Not applicable.

Data Availability Statement

Publicly available datasets were analyzed in the present study. The data can be found as follows: https://ocean.cwb.gov.tw/V2/ (accessed on 1 January 2023).

Acknowledgments

The authors would like to thank the Central Weather Administration (CWA), the Water Resource Agency (WRA), and the Taiwan Climate Change Projection Information and Adaptation Knowledge Platform (TCCIP), Taiwan, for providing the wave, current, and river discharge measurements, weather data, and typhoon information.

Conflicts of Interest

The authors declare no conflicts of interest. The funders had no role in the design of this study; the collection, analyses, or interpretation of data; the writing of the manuscript; or the decision to publish the results.

References

  1. IPCC. Contribution of Working Groups I, II and III to the Fifth Assessment Report of the Intergovernmental Panel on Climate Change; Synthesis Report; IPCC: Geneva, Switzerland, 2014. [Google Scholar]
  2. Ekström, M.; Grose, M.; Whetton, P.V. An appraisal of downscaling methods used in climate change research. WIREs Climate Change 2015, 6, 301–319. [Google Scholar] [CrossRef]
  3. Huang, W.-P.; Hsu, J.-C.; Ye, C.-J. Assessing the impact factors and corresponding weights affecting the coastal morphology of Hsinchu Coast, Taiwan. J. Sea Res. 2023, 195, 102432. [Google Scholar] [CrossRef]
  4. Gao, A.; Yang, S.L.; Li, G.; Li, P.; Chen, S.L. Long-term morphological evolution of a tidal island as affected by natural factors and human activities, the Yangtze estuary. J. Coast. Res. 2010, 26, 123–131. [Google Scholar] [CrossRef]
  5. Jordan, C.; Visscher, J.; Viet Dung, N.; Apel, H.; Schlurmann, T. Impacts of Human Activity and Global Changes on Future Morphodynamics within the Tien River, Vietnamese Mekong Delta. Water 2020, 12, 2204. [Google Scholar] [CrossRef]
  6. Robins, P.E.; Skov, M.W.; Lewis, M.J.; Giménez, L.; Davies, A.G.; Malham, S.K.; Neill, S.P.; McDonald, J.E.; Whitton, T.A.; Jack-son, S.E.; et al. Impact of climate change on UK estuaries: A review of past trends and potential projections. Estuar. Coast. Shelf Sci. 2016, 169, 119–135. [Google Scholar] [CrossRef]
  7. Lin, L.-Y.; Lin, C.-T.; Chen, Y.-M.; Cheng, C.-T.; Li, H.-C.; Chen, W.-B. The Taiwan Climate Change Projection Information and Adaptation Knowledge Platform: A Decade of Climate Research. Water 2022, 14, 358. [Google Scholar] [CrossRef]
  8. Ministry of the Interior. The Integrated Coastal Zone Management Plan—The First Overall Review; Ministry of the Interior: Taipei, Taiwan, 2021. [Google Scholar]
  9. Trenberth, K.E. Changes in precipitation with climate change. Clim. Res. 2011, 47, 123–138. [Google Scholar] [CrossRef]
  10. Dunn, F.E.; Darby, S.E.; Nicholls, R.J.; Cohen, S.; Zarfl, C.; Fekete, B.M. Projections of declining fluvial sediment delivery to major deltas worldwide in response to climate change and anthropogenic stress. Environ. Res. Lett. 2019, 14, 084034. [Google Scholar] [CrossRef]
  11. Wild, A.L.; Kwoll, E.; Lintern, D.G.; Fargey, S. Fluvial Response to Climate Change in the Pacific Northwest: Skeena River Discharge and Sediment Yield. Water 2023, 15, 167. [Google Scholar] [CrossRef]
  12. Rohini, S.; Sannasiraj, S.A.; Sundar, V. Investigation on influence of RCP-based climate scenarios on the hydrodynamic and morphodynamic changes during extreme events. Appl. Ocean Res. 2023, 138, 103660. [Google Scholar] [CrossRef]
  13. Holden, W.N.; Marshall, S.J. Chapter 24—Climate Change and Typhoons in the Philippines: Extreme Weather Events in the Anthropocene. In Integrating Disaster Science and Management; Samui, P., Kim, D., Ghosh, C., Eds.; Elsevier: Amsterdam, The Netherlands, 2018; pp. 407–421. [Google Scholar]
  14. Marsooli, R.; Jamous, M.; Miller, J.K. Climate change impacts on wind waves generated by major tropical cyclones off the coast of New Jersey, USA. Front. Built Environ. 2021, 7, 774084. [Google Scholar] [CrossRef]
  15. Ku, H.; Maeng, J.H.; Cho, K. Climate change impact on typhoon-induced surges and wind field in coastal region of South Korea. J. Wind Eng. Ind. Aerodyn. 2019, 190, 112–118. [Google Scholar] [CrossRef]
  16. Rao, A.D.; Upadhaya, P.; Pandey, S.; Poulose, J. Simulation of extreme water levels in response to tropical cyclones along the Indian coast: A climate change perspective. Nat. Hazards 2020, 100, 151–172. [Google Scholar] [CrossRef]
  17. Chang, C.-H.; Shih, H.-J.; Chen, W.-B.; Su, W.-R.; Lin, L.-Y.; Yu, Y.-C.; Jang, J.-H. Hazard Assessment of Typhoon-Driven Storm Waves in the Nearshore Waters of Taiwan. Water 2018, 10, 926. [Google Scholar] [CrossRef]
  18. Warren, I.R.; Bach, H.K. MIKE 21: A modelling system for estuaries, coastal waters and seas. Environ. Softw. 1992, 7, 229–240. [Google Scholar] [CrossRef]
  19. Anton, I.A.; Rusu, L.; Anton, C. Nearshore Wave Dynamics at Mangalia Beach Simulated by Spectral Models. J. Mar. Sci. Eng. 2019, 7, 206. [Google Scholar] [CrossRef]
  20. Parvathy, K.G.; Gopinath, D.I.; Noujas, V.; Thomas, K.V. Wave Transformation along Southwest coast of India using MIKE 21. Int. J. Ocean Clim. Syst. 2014, 5, 23–34. [Google Scholar] [CrossRef]
  21. Nguyen, V.T.; Vu, M.T.; Zhang, C. Numerical investigation of hydrodynamics and cohesive sediment transport in Cua Lo and Cua Hoi Estuaries, Vietnam. J. Mar. Sci. Eng. 2021, 9, 1258. [Google Scholar] [CrossRef]
  22. Huang, W.-P. Modelling the effects of typhoons on morphological changes in the Estuary of Beinan, Taiwan. Cont. Shelf Res. 2017, 135, 1–13. [Google Scholar] [CrossRef]
  23. Huang, W.-P. Impact of coastal development on coastal morphology of Taiwan: Case studies and proposed countermeasures. J. Sea Res. 2022, 186, 102234. [Google Scholar] [CrossRef]
  24. Ghaderi, D.; Rahbani, M. Simultaneous employment of hydrodynamical simulation and RS imageries for analyzing the influence of an anthropogenic construction on shoreline transformation. J. Hydraul. Struct. 2023, 9, 14–31. [Google Scholar] [CrossRef]
  25. Irmawan, M.; Alam, R.R.R.; Refani, A.N.; Aini, A.N. Hydrodynamic Analysis-Based Modeling of Coastal Abrasion Prevention (Case Study: Pulau Baai Port, Bengkulu). Appl. Sci. 2024, 14, 940. [Google Scholar] [CrossRef]
  26. Tuan, V.M.; Thanh, N.V.; Lai, T.D. Accessing impacts of climate change-driven sea level rise on hydrodynamics and sediment dynamics along Ba Lang beaches in Nha Trang Bay, Khanh Hoa, Vietnam. Water Sci. Eng. 2023; in press. [Google Scholar] [CrossRef]
  27. Dastgheib, A.; Reyns, J.; Thammasittirong, S.; Weesakul, S.; Thatcher, M.; Ranasinghe, R. Variations in the Wave Climate and Sediment Transport Due to Climate Change along the Coast of Vietnam. J. Mar. Sci. Eng. 2016, 4, 86. [Google Scholar] [CrossRef]
  28. Winant, C.D.; Inman, D.L.; Nordstrom, C.E. Description of seasonal beach changes using empirical eigenfunctions. J. Geophys. Res. 1975, 80, 1979–1986. [Google Scholar] [CrossRef]
  29. Miller, J.K.; Dean, R.G. Shoreline variability via empirical orthogonal function analysis: Part I temporal and spatial characteristics. Coast. Eng. 2007, 54, 111–131. [Google Scholar] [CrossRef]
  30. Miller, J.K.; Dean, R.G. Shoreline variability via empirical orthogonal function analysis: Part II relationship to nearshore conditions. Coast. Eng. 2007, 54, 133–150. [Google Scholar] [CrossRef]
  31. Taaouati, M.; Parisi, P.; Passoni, G.; Lopez-Garcia, P.; Romero-Cozar, J.; Anfuso, G.; Vidal, J.; Muñoz-Perez, J.J. Influence of a Reef Flat on Beach Profiles Along the Atlantic Coast of Morocco. Water 2020, 12, 790. [Google Scholar] [CrossRef]
  32. Hu, Y.; Cao, M.; Ma, A.; Dou, X.; Wen, Y. An Analysis of the Periodic Evolution of the Jingjiang Sandbank in the Tidal Reach of the Yangtze River. Water 2020, 12, 1652. [Google Scholar] [CrossRef]
  33. Afentoulis, V.; Papadimitriou, A.; Belibassakis, K.; Tsoukala, V. A coupled model for sediment transport dynamics and prediction of seabed morphology with application to 1DH/2DH coastal engineering problems. Oceanologia 2022, 64, 514–534. [Google Scholar] [CrossRef]
  34. Mercier, P.; Thiébaut, M.; Guillou, S.; Maisondieu, C.; Poizot, E.; Pieterse, A.; Thiébot, J.; Filipot, J.-F.; Grondeau, M. Turbulence measurements: An assessment of Acoustic Doppler Current Profiler accuracy in rough environment. Ocean Eng. 2021, 226, 108819. [Google Scholar] [CrossRef]
  35. Belibassakis, K.A.; Karathanasi, F.E. Modelling nearshore hydrodynamics and circulation under the impact of high waves at the coast of Varkiza in Saronic—Athens Gulf. Oceanologia 2017, 59, 350–364. [Google Scholar] [CrossRef]
  36. DHI. MIKE 21 and MIKE 3 Flow Model FM Hydrodynamic and Transport Module Scientific Documentation; DHI Water and Environment: Hørsholm, Denmark, 2012. [Google Scholar]
  37. Reeve, D.E.; Horrillo-Caraballo, J.M.; Magar, V. Statistical analysis and forecasts of long-term sandbank evolution at Great Yarmouth, UK. Estuar. Coast. Shelf Sci. 2008, 79, 387–399. [Google Scholar] [CrossRef]
  38. Wang, X.; Zhang, W.; Tong, C.; Huang, R. Unraveling the control factors of long-term morphological evolution in the Yangtze Estuary: A synthesis of natural processes and human interventions. Estuar. Coast. Shelf Sci. 2024, 304, 108842. [Google Scholar] [CrossRef]
  39. Keshtpoor, M.; Puleo, J.A.; Gebert, J.; Plant, N.G. Beach response to a fixed sand bypassing system. Coast. Eng. 2013, 73, 28–42. [Google Scholar] [CrossRef]
  40. Ray, R.D.; Foster, G. Future nuisance flooding at Boston caused by astronomical tides alone. Earth’s Future 2016, 4, 578–587. [Google Scholar] [CrossRef]
  41. Melo, W.; Pinho, J.; Iglesias, I.; Bio, A.; Avilez-Valente, P.; Vieira, J.; Bastos, L.; Veloso-Gomes, F. Hydro- and Morphodynamic Impacts of Sea Level Rise: The Minho Estuary Case Study. J. Mar. Sci. Eng. 2020, 8, 441. [Google Scholar] [CrossRef]
  42. Rameshwaran, P.; Bell, V.A.; Davies, H.N.; Kay, A.L. How might climate change affect river flows across West Africa? Clim. Chang. 2021, 169, 21. [Google Scholar] [CrossRef]
  43. Rodríguez-Blanco, M.L.; Arias, R.; Taboada-Castro, M.M.; Nunes, J.P.; Keizer, J.J.; Taboada-Castro, M.T. Potential Impact of Climate Change on Suspended Sediment Yield in NW Spain: A Case Study on the Corbeira Catchment. Water 2016, 8, 444. [Google Scholar] [CrossRef]
  44. Cox, J.R.; Dunn, F.; Nienhuis, J.; van der Perk, M.; Kleinhans, M. Climate change and human influences on sediment fluxes and the sediment budget of an urban delta: The example of the lower Rhine-Meuse Delta distributary network. Anthr. Coasts 2021, 4, 251–280. [Google Scholar] [CrossRef]
  45. Zarifsanayei, A.R.; Etemad-Shahidi, A.; Cartwright, N.; Strauss, D. Long-term prediction of longshore sediment transport in the context of climate change. Coast. Eng. Proc. 2020, 36, 15. [Google Scholar] [CrossRef]
  46. Hirschberg, J.; Fatichi, S.; Bennett, G.L.; McArdell, B.W.; Peleg, N.; Lane, S.N.; Schlunegger, F.; Molnar, P. Climate change impacts on sediment yield and debrisflow activity in an Alpine catchment. J. Geophys. Res. Earth Surf. 2021, 126, e2020JF005739. [Google Scholar] [CrossRef]
Disclaimer/Publisher’s Note: The statements, opinions, and data contained in all publications are solely those of the individual author(s) and contributor(s) and not of MDPI and/or the editor(s). MDPI and/or the editor(s) disclaim responsibility for any injury to people or property resulting from any ideas, methods, instructions, or products referred to in the content.
Figure 1. Study area overview. (a) Detailed depiction of the study area (the yellow star denotes the location of the Hsinchu wave data buoy). Changes in bathymetry along the Hsinchu Coast (b) from 1998 to 2005; (c) from 2005 to 2010; (d) from 2010 to 2017; and (e) from 2017 to 2021. Blue indicates accretion, while red indicates erosion.
Sustainability 16 05563 g001
Figure 2. Classification of typhoons into nine tracks by the Central Weather Administration of Taiwan.
Sustainability 16 05563 g002
Figure 3. The tracks and corresponding intensities of Sepat, Wipha, and Krosa.
Sustainability 16 05563 g003
Figure 4. (a) The bathymetry and mesh with triangles for the Taiwan coast (offshore region). (b) The bathymetry and mesh with a triangle showing the study area (nearshore region). Red terms: E1 is the estuary, T1 is the sea area in front of the Hsinchu Fishery Harbor’s breakwater, and K1 is the sea area in front of the Kangnan Seawall.
Sustainability 16 05563 g004
Figure 5. The structure of the flowchart followed in this study is as follows: (a) first part—numerical simulation process in the offshore and nearshore zone, and (b) second part—EOF analysis process with the two-period dataset and simulation result of three typhoons in a climate change scenario.
Sustainability 16 05563 g005
Figure 6. Simulation results of offshore wave fields for three typhoons before landfall, post-landfall, and after departing Taiwan. (ac), (df), and (gi) represent typhoons Sepat, Wipha, and Krosa at landfall, post-landfall, and post-departure.
Sustainability 16 05563 g006
Figure 7. The comparison between the measured data and simulated results (from top to bottom) includes (a) wave height, (b) period, (c) direction, and (d) water surface elevation at the Typhoon Sepat observation point in August 2007. The observed data are depicted by red solid rectangles, while the simulation results are illustrated by black solid lines and rectangular boxes.
Sustainability 16 05563 g007
Figure 8. The comparison between the observed (left panel) and simulated (right panel) bathymetric changes within the study area. Accretion is observed in the Touchien River Estuary, while erosion is evident on the southern side of the Hsinchu Fishery Harbor.
Sustainability 16 05563 g008
Figure 9. The comparison between the observed and simulated changes in bathymetry at nodal points. The solid black line represents the 1:1 line, while the dashed blue lines indicate the 95% confidence interval.
Sustainability 16 05563 g009
Figure 10. Comparison of the wave heights of the three typhoons, namely, Sepat, Wipha, and Krosa, under four scenarios. Panels (ac) depict comparisons of the wave heights of Typhoon Sepat at the river mouth, the head of the breakwater, and the coastal area in front of the Kangnan Seawall. Similarly, panels (df) and (gi) illustrate comparisons of the wave heights for Typhoon Wipha and Typhoon Krosa, respectively, at the same locations. The scenarios considered are as follows: Scenario A involves a sea level rise of 0.5 m and an 8% increase in the maximum wind speed; Scenario B involves a sea level rise of 1.2 m and an 8% increase in the maximum wind speed; Scenario C entails a sea level rise of 0.5 m and a 12% increase in the maximum wind speed; and Scenario D involves a sea level rise of 1.2 m and a 12% increase in the maximum wind speed. The black line, “Original”, represents the control run.
Sustainability 16 05563 g010
Figure 11. Morphological changes due to three typhoons, Sepat, Wipha, and Krosa, under four varying scenarios.
Sustainability 16 05563 g011
Figure 12. The EOF results and simulation results of the coastal morphological changes in the four climate change scenarios were calculated with bathymetry survey data in two different periods (from 2005 to 2010 and 2017 to 2021). (ad) Represent the analysis outcomes of the first set of bathymetry survey data (2005 to 2010) corresponding to climate change Scenarios A–D, respectively; (eh) represents the analysis outcomes of the second set (2017 to 2021) of bathymetry survey data corresponding to climate change Scenarios A–D, respectively. In addition, (a) illustrates the area subjected to EOF analysis. The blue rectangle represents a grid measuring 1800 m × 1000 m, encompassing 14,700 elements, while the red rectangle denotes a grid measuring 1400 m × 4200 m, containing 4500 elements.
Sustainability 16 05563 g012aSustainability 16 05563 g012b
Figure 13. The one-dimensional impact range regarding the EOF first mode in the study area. The red and blue lines represent the analysis results in the time periods of 2005–2010 and 2017–2021, respectively; “SW” denotes southwest, while “NE” represents northeast [3].
Sustainability 16 05563 g013
Table 1. Statistics on typhoons classified as Tracks 1 to 3 affecting Taiwan in the past 30 years.
YearNo.Typhoon NameTrack CAT.Typhoon
Intensity
YearNo.Typhoon NameTrack CAT.Typhoon
Intensity
199401GLADYS2Moderate200901MORAKOT3Moderate
02FRED1Severe
03CAITLIN3Mild
04TIM3Severe
1995----2010----
199605HERB1Severe2011----
199706AMBER3Moderate201202SAOLA2Moderate
WINNIE1Moderate
199807OTTO3Mild201303FITOW1Moderate
04TRAMI1Mild
05SOULIK2Severe
1999----201406MATMO3Moderate
200008BILIS3Severe201507DUJUAN2Severe
08SOUDELOR3Moderate
200109TORAJI3Moderate201609MEGI3Moderate
200210SINLAKU1Moderate201710NESAT2Moderate
2003----201811MARIA1Severe
200411AERE1Moderate201912LEKIMA1Severe
200512LONGWANG3Severe2020----
13TALIM3Severe
14MATSA1Moderate
15HAITANG3Severe
200616KAEMI3Moderate Mild2021----
17BILIS2
200718WUTIP3Mild2022----
19SEPAT3Severe
20WIPHA1Moderate
21KROSA2Severe
200822JANGMI2Severe2023----
23SINLAKU2Severe
24FUNG-WONG3Moderate
25KALMAEGI2Moderate
Hint: typhoon intensity classification method—typhoons are classified by the Central Weather Administration (CWA) as mild, moderate, and severe typhoons based on the ten-minute maximum average wind speed near the typhoon center. The intensity classification is as follows: mild typhoon (17.2 m/s > average wind speed ≥ 32.6 m/s); moderate typhoon (32.7 m/s > average wind speed ≥ 50.9 m/s); severe typhoon (average wind speed ≥ 51.0 m/s) (CWA). The intensity here refers to the intensity of the typhoon when landing in or approaching Taiwan.
Table 2. Details of the scenarios considered in this study.
CaseScenario AScenario BScenario CScenario D
Wind speed increase (%)8%8%12%12%
Extreme sea levels (ESL)+0.5 m+1.2 m+0.5 m+1.2 m
Table 3. Wave heights of three tracks for four climate change scenarios and the standardized comparison.
Sepat Typhoon (Track No. 3)Wipha Typhoon (Track No. 1)Krosa Typhoon (Track No. 2)
PositionE1T1K1PositionE1T1K1PositionE1T1K1
Max. in S10.48 m3.30 m2.18 mMax. in S10.59 m4.33 m2.48 mMax. in S10.94 m4.86 m2.56 m
Max. in S20.48 m3.30 m2.20 mMax. in S20.63 m4.30 m2.40 mMax. in S21.03 m4.83 m2.56 m
Max. in S30.44 m3.35 m2.17 mMax. in S30.57 m4.30 m2.50 mMax. in S30.87 m4.75 m2.53 m
Max. in S40.46 m3.33 m2.18 mMax. in S40.60 m4.27 m2.52 mMax. in S40.93 m4.74 m2.53 m
Max. in control run0.40 m2.59 m2.06 mMax. control run0.47 m3.92 m2.19Max. control run0.47 m3.94 m2.20 m
Std. in S11.201.271.06Std. in S11.261.101.13Std. in S11.811.231.16
Std. in S21.201.271.07Std. in S21.341.101.10Std. in S21.981.231.16
Std. in S31.101.291.05Std. in S31.211.101.14Std. in S31.671.211.15
Std. in S41.201.291.06Std. in S41.281.091.15Std. in S41.791.201.15
Percentage change in S1 20.0%27.41%5.83%Percentage change in S1 25.53%10.46%12.24%Percentage change in S1 80.76%23.35%16.36%
Percentage change in S220.0%27.41%6.80%Percentage change in S234.04%9.70%9.59%Percentage change in S298.08%22.59%16.36%
Percentage change in S310.0%29.43%5.34%Percentage change in S321.28%9.70%14.16%Percentage change in S367.30%20.56%15.00%
Percentage change in S414.50%28.57%5.83%Percentage change in S427.66%8.93%15.07%Percentage change in S478.85%20.30%15.00%
Avg. S1 to S416.12%28.18%5.94%Avg. S1 to S427.13%9.69%13.01%Avg. S1 to S481.25%21.70%15.68%
Hint: (a) Max. represents the maximum value of the significant wave height (m) in the simulation time series; S1–S4 represent the first to fourth climate change scenarios, respectively. (b) Std. in S1 to S4 represents the ratio of the maximum significant wave height (m) and the control significant wave height (m) of each scenario. (c) Positions E1, T1, and K1 represent the Touchien Estuary (E1), the head of the north groin of the Hsinchu Fishery Harbor (T1), and the sea area in front of the Kangnan Seawall (K1), respectively. (d) The percentage change in S1 to S4 represents the percentage change in the max. significant wave height (m) from the control run under climate change for Scenarios 1 to 4, respectively.
Table 4. The proportion of variability in the primary mode was acquired through EOF analysis (n/a: not applicable in the table).
Huang [3]
Mode-1
With
Scenario A
With
Scenario B
With
Scenario C
With
Scenario D
EOF Model-1
from 2005 to 2010
93.61%95.08%94.08%94.98%94.91%
Comparison of results
from Huang [3]
n/a1.57%0.50%1.46%1.39%
EOF Model-1
from 2017 to 2021
98.29%96.17%96.76%96.22%96.30%
Comparison of results
from Huang [3]
n/a−2.16%−1.56%−2.11%−2.02%
Disclaimer/Publisher’s Note: The statements, opinions and data contained in all publications are solely those of the individual author(s) and contributor(s) and not of MDPI and/or the editor(s). MDPI and/or the editor(s) disclaim responsibility for any injury to people or property resulting from any ideas, methods, instructions or products referred to in the content.

