Article

Study on Improving Physical–Mechanical Properties and Frost Resistance of Straw–Mortar Composite Wall Materials by Pretreatment

1
College of Water Conservancy, Shenyang Agricultural University, Shenyang 110866, China
2
College of Engineering, Shenyang Agricultural University, Shenyang 110866, China
*
Author to whom correspondence should be addressed.
Sustainability 2024, 16(13), 5608; https://doi.org/10.3390/su16135608
Submission received: 19 April 2024 / Revised: 9 June 2024 / Accepted: 10 June 2024 / Published: 30 June 2024

Abstract

:
In recent years, China has increased the material utilization of crop straw, and the strength of straw–mortar composite wall materials is low, which limits their large-scale utilization. Pretreatment can improve the physico-mechanical and frost resistance properties of straw–mortar composite wall materials. In this study, the Box–Behnken design in the Design-Expert software was used to design and carry out a three-factor and three-level interactive experiment and freeze–thaw cycle experiment with the straw content, pretreatment time, and reagent concentration as influencing factors, and the compressive strength, water absorption rate, and dry density as response values. The results showed that the impact of each factor on the response value, from high to low, was the straw content, pre-preparation time, and reagent concentration. When the straw content was 10%, the preparation time was 5 min, and the reagent concentration was 5%, the physical and mechanical properties of the straw–mortar composite wall material were the best. At the same time, the compressive strength was 6.52 MPa, the water absorption rate was 17.7%, and the dry density was 1396.33 kg·m−3, which was 67% higher, 31% lower, and 37% higher than that of the untreated straw–mortar composite wall materials. After the freeze–thaw cycle, the mass loss rate of the composite materials was less than 5%, which met the requirements of the frost resistance specifications; the strength loss rate of the composite materials varied between 19.7% and 27.8%, although some test blocks did not meet the requirements of less than 25% in the specification. The compressive strength was greatly improved compared with the untreated composite materials in the related research, and the water absorption rate was about 25% lower than that of the untreated straw–mortar composite wall materials. Pretreatment significantly improved the physico-mechanical and frost resistance properties of the straw–mortar composite wall materials.

1. Introduction

Crop straw resources are abundant in China, but their comprehensive utilization rate is relatively low, which has a great impact on the environment and human health [1]. Clay bricks widely used in rural areas have many problems, such as high energy consumption and the large utilization of land resources, which have put great pressure on China’s energy resources and living environment protection [2]. It has been found that wall material prepared by combining straw with traditional building materials has the advantages of economy, energy saving, and environmental protection—this is an important form of the material utilization of straw [3]. However, the low strength of straw composite materials is not conducive to their large-scale application in building walls [4].
The poor compatibility between straw and Portland cement and the relatively high moisture content of straw fiber are important reasons for the poor physical and mechanical properties of straw composites [5,6]. The chemical pretreatment of straw can remove most non-cellulosic substances and hydrophilic chemicals on the straw surface [7,8,9,10,11]. It increases the surface roughness of the fiber, enhances the combination of the fiber and matrix, improves the stress transfer mode between the materials [12,13], reduces the water absorption rate, improves the workability of the straw materials, and enhances the physical and mechanical properties of composite materials. With the increase in the solution concentration and pretreatment time, the strength of the straw composites increases [14]. Related studies show that the combined pretreatment has the advantages of being less time-consuming [15], having a better effect, and costing less than a single form of pretreatment. Zhang et al. [16] combined an acid treatment with hydrothermal carbonization, Chen et al. [17] combined an acid–alkali treatment with ball milling, Ma et al. [18] combined an alkali treatment with high-temperature steam blasting, and Akinyemi et al. [19] combined a sodium hydroxide reagent treatment and microwaves. All of these methods can significantly enhance the mechanical properties of composite materials.
The increase in straw content, as a plant aggregate, can lead to a decrease in the density and an increase in the porosity of composite materials, thus affecting the physical and mechanical properties of composite materials [20,21,22]. Feng et al. [23] and Wang et al. [24] concluded that, with the increase in straw content, the strength and dry density of the composite materials decreased and the water absorption rate increased. Huang et al. [25] found that, compared with untreated straw composite materials, the water absorption rate of alkali-treated composite materials decreased significantly.
In severely cold areas, the damage caused by the freeze–thaw cycle to building materials is very significant. The repeated freezing and thawing of a material will lead to the generation, expansion, and penetration of cracks, and then cause serious damage to the structure [26]. Hua et al. [27] found that the compression ratio was highly correlated with the residual strength of cement mortar after a freeze–thaw cycle. Rangel et al. [28] found that the compressive strength and quality of concrete mixtures decreased after 150 and 300 freeze–thaw cycles. Wu et al. [29] found that adding an appropriate amount of basalt fiber could improve the frost resistance of concrete.
It has been found that the chemical modification of straw can effectively improve surface chemical characteristics and adsorption properties [30]. At present, the common modification methods mainly include acid–base modification, grafting modification, and acid–base grafting modification.
The physico-mechanical and frost resistance properties of straw composite materials have difficulty meeting its materialized utilization. In this study, straw–mortar composite wall materials were prepared by the physical–chemical pretreatment of rice straw. Taking the straw dosage, pretreatment time, and reagent concentration as variables, the influence law of the compressive strength, water absorption, and dry density of the straw mortar composite wall material was studied. The regression equation was fitted to obtain the optimal value of each performance index and the influencing factor value. Finally, 5, 10, and 15 freeze–thaw cycles were carried out. The effect of pretreatment on improving the physical–mechanical and frost resistance properties of the composite materials was discussed, which provided a theoretical reference for the large-scale utilization of pretreatment straw composite materials.

2. Materials and Methods

2.1. Experimental Design

According to the Box–Behnken design, 17 groups of three-factor and three-level interactive experiments were carried out. Taking the straw content ( x 1 ), pretreatment time, ( x 2 ) and reagent concentration ( x 3 ) as influencing factors, and the compressive strength ( y f ), water absorption rate ( y w ), and dry density ( y ρ ) of the composite materials as response values, the effects of various influencing factors on the properties of straw–mortar composite wall materials were studied [31]. The main influencing factors and levels are shown in Table 1.

2.2. Experimental Materials

2.2.1. Cement

The ordinary Portland cement was used in the test, and its basic property indices are shown in Table 2.

2.2.2. Rice Straw

The mature rice straw was collected from the paddy field (123°33′50.49″ E, 41°49′7.44″ N) of Shenyang Agricultural University. The redundant roots and ears of rice straw were removed, and straw was crushed by a straw grinder (FS-100, Xingyang Chuangyou Machinery Equipment Co., Ltd., Xingyang, China), then stored in moisture-proof bags.

2.2.3. Aggregate

The fine aggregate used in the test was the natural river sand from Hun River in Liaoning Province.

2.2.4. Water

The water used for the test was ordinary tap water from the laboratory, with a pH value of about 7.

2.2.5. NaOH Reagent

The pretreatment NaOH reagent used in the test was Macklin sodium hydroxide reagent (S835850-500g, Shanghai Chemical Industry Park, Shanghai, China), which was a white solid particle with a component content not less than 99.5%.

2.3. Experimental Methods

2.3.1. Pretreatment

After selecting mature rice to remove straw, clean the surface dust, dry the ventilated place of the ceramic tile place, and crush with the plant grinder. The straw is soaked in the concentration of 5% sodium hydroxide solution, and stirred. The pretreatment time is 5, 15, and 25 min. Fish out the straw after processing, and dry with a dryer for reserve. The crushed straw was soaked in NaOH solution at room temperature at a solid–liquid ratio of 1:15 according to the set time and mass fraction [32]. After pretreatment, the straw was fished out and washed to neutral, then dried and put into moisture-proof bags [33], as shown in Figure 1.

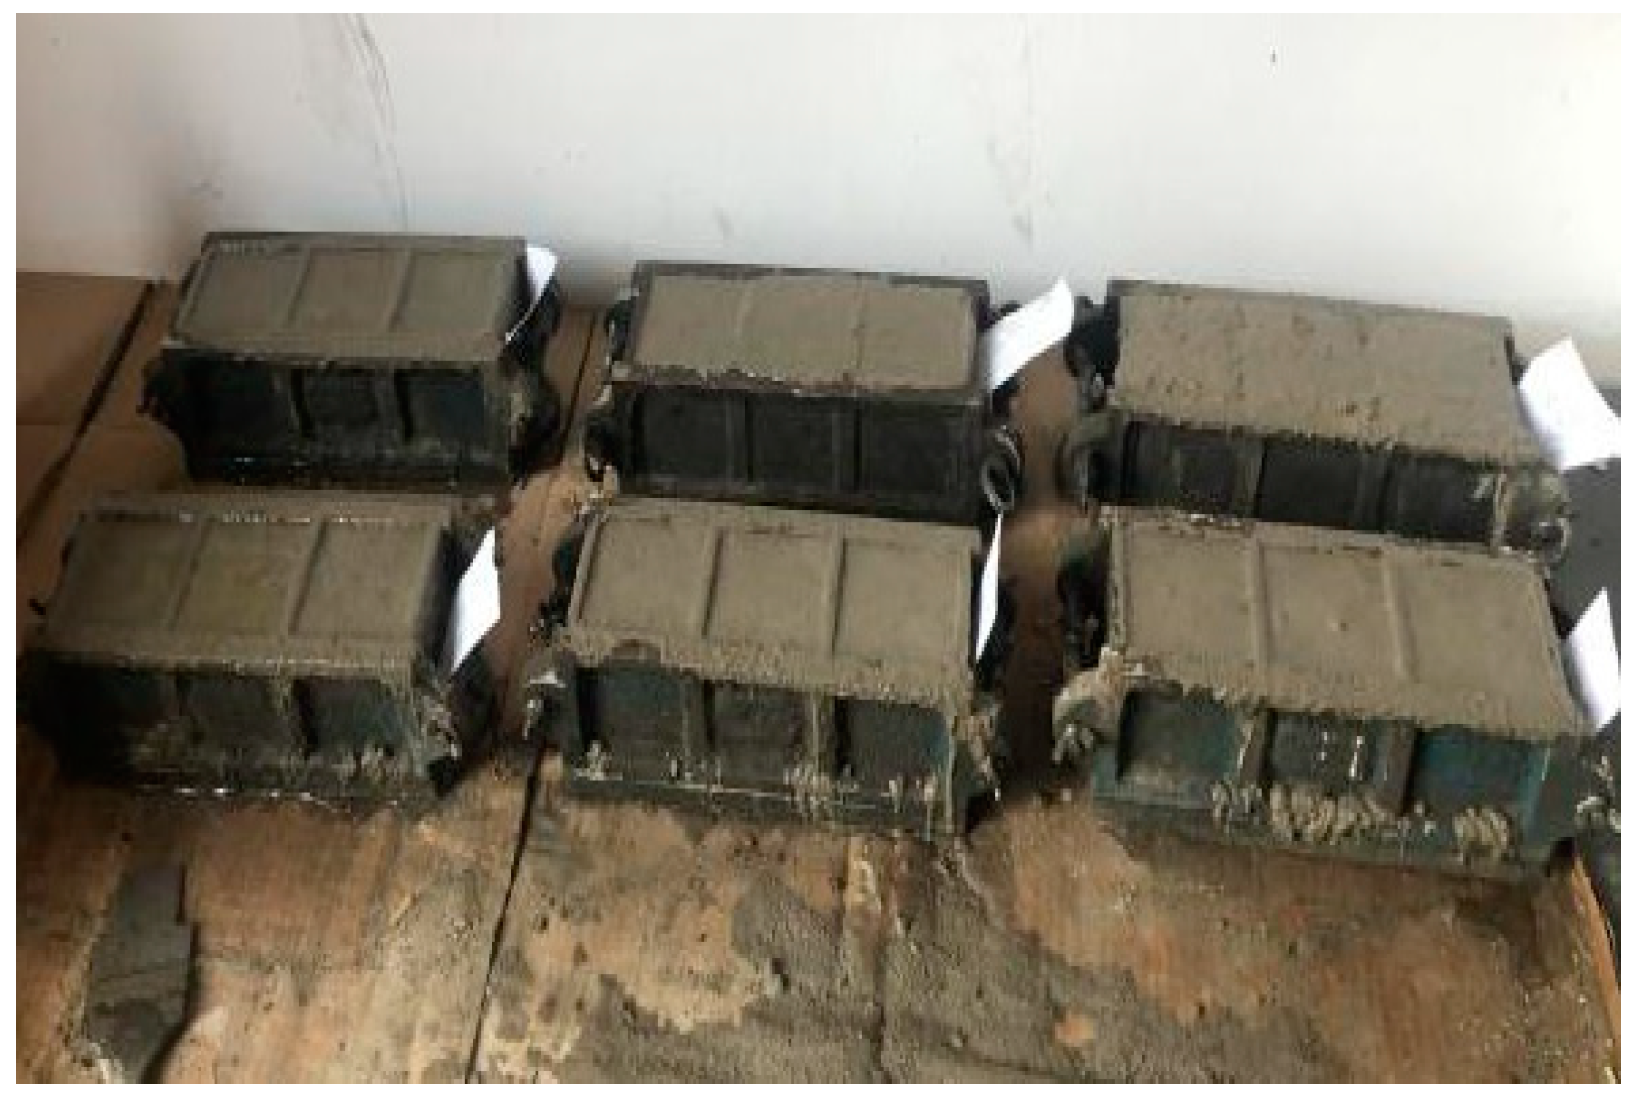
2.3.2. Determination of Compressive Strength

The mix ratio of straw mortar composite block is as follows: cement-and-sand ratio is fixed value m(cement):m(sand) = 1:3, straw content 10%, water–cement ratio 0.85, and water consumption 408.92 kg∙m−3. The compressive strength of composite materials was measured according to “Standard for Test Method of Basic Properties of Construction Mortar” [34], and the block size was 70.7 × 70.7 × 70.7 mm3, as shown in Figure 2 and Figure 3.

2.3.3. Determination of Physical Property

(1)
Water absorption rate
The test block was preserved for 28 days, immersed in water for 2 days, and then taken out. An electronic balance was used to weigh it. The water absorption rate was calculated according to Formula (1):
y w = m 1 m 0 m 0 × 100 %
where y w is the water absorption rate of material, %; m 1 is the mass of specimen after water absorption, g; and m 0 is the mass of dried specimen, g.
(2)
Dry density
After curing for 28 days, the test block was placed in the air-blast drying oven, and the dry density was determined according to “Dry–Mixed Thermal Insulating Mortar for Buildings” [35]. The dry density was calculated according to Formula (2):
y ρ = m 0 v
where y ρ is the dry density of composite materials, kg∙m−3; m 0 is the constant mass of composite materials after drying, g; and v is the volume of composite materials, cm3.

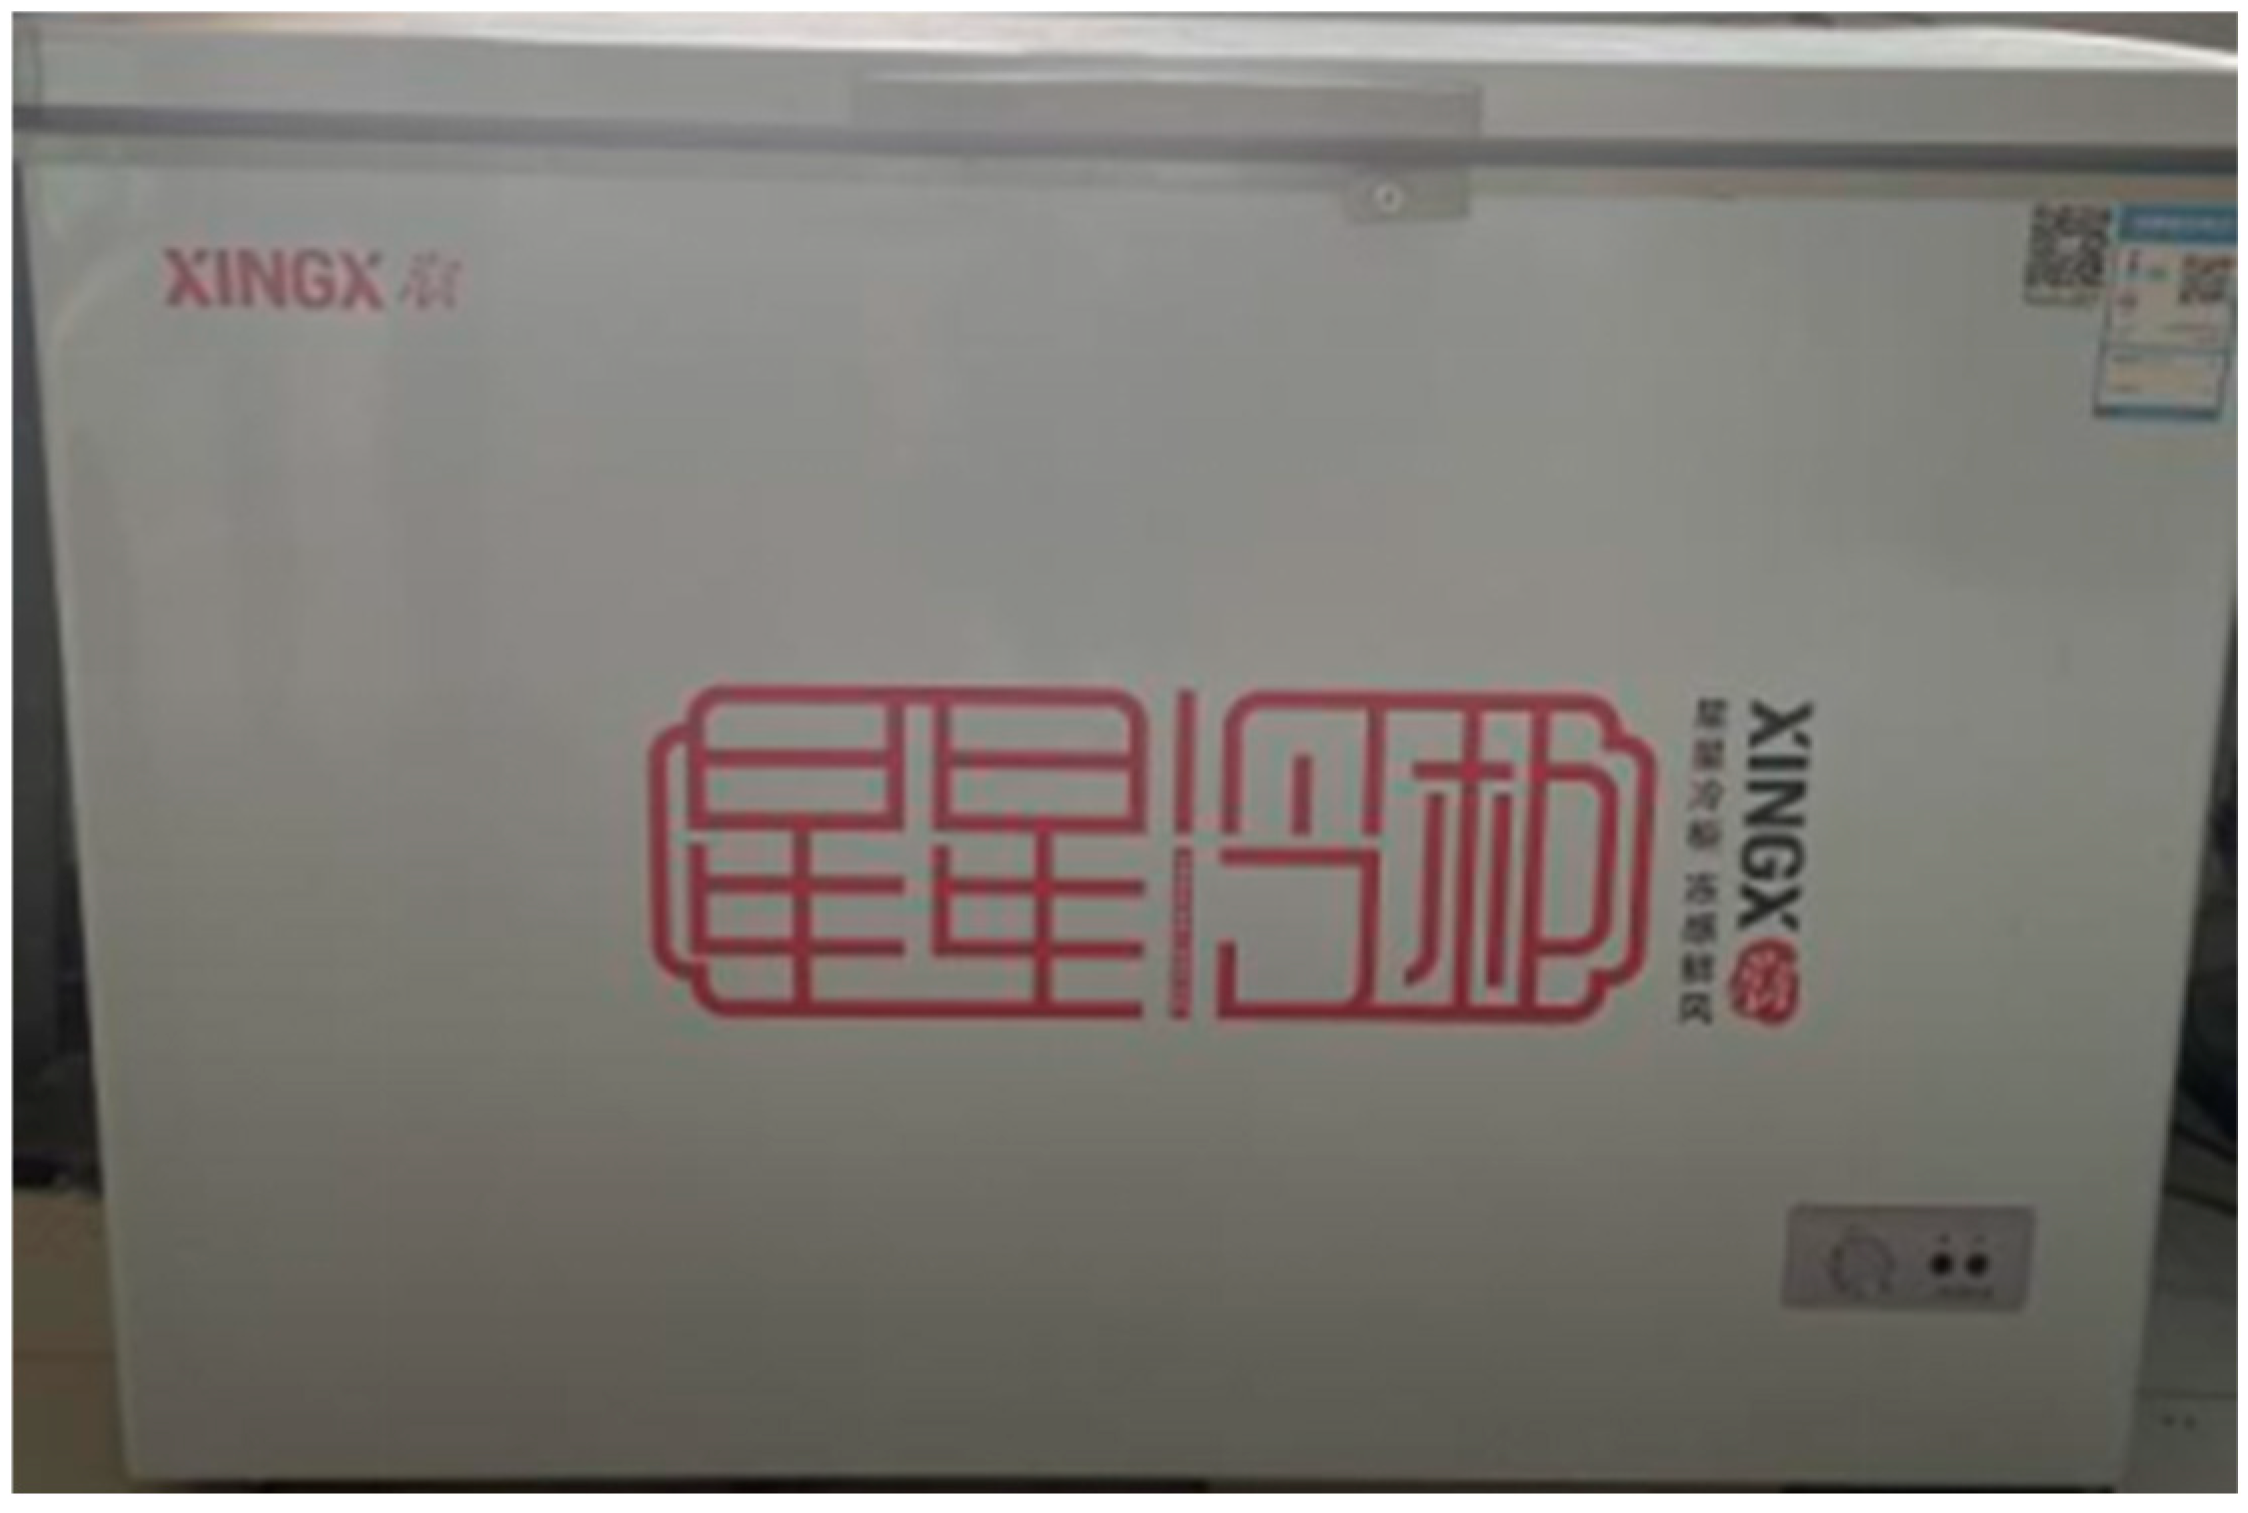
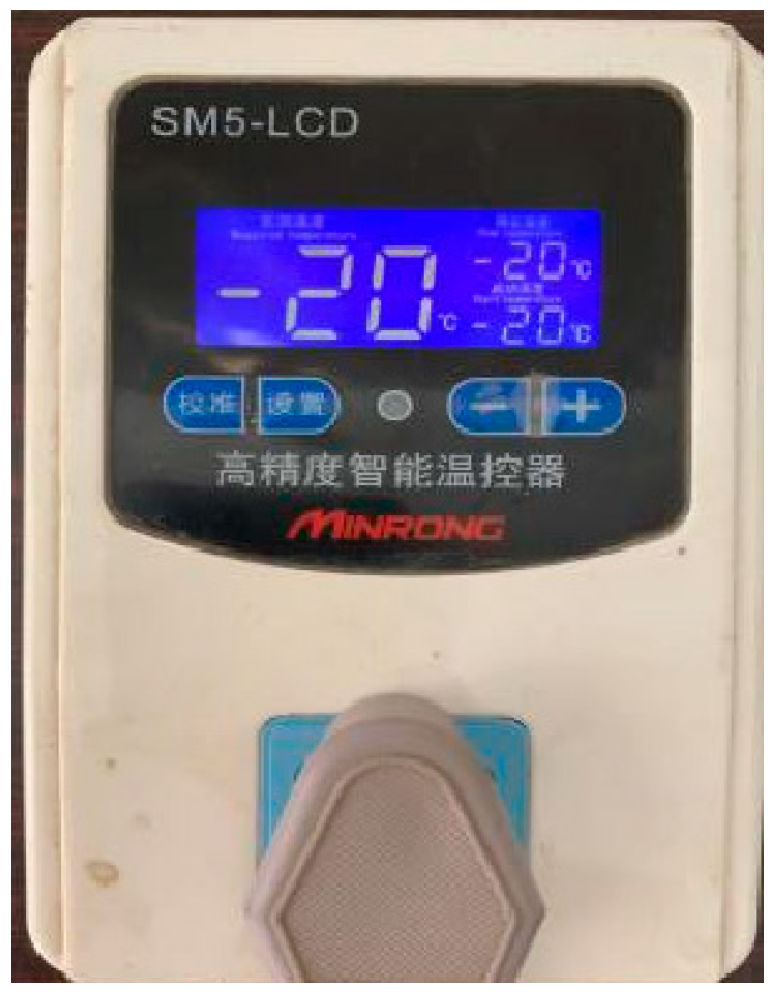
2.3.4. Determination of Frost Resistance

The frost resistance of straw–mortar composite wall materials was studied by water freezing and water melting method. The test referred to the method of “Standard for Test Method of Performance on Building Mortar” (JGJ/T70-2009). The freeze–thaw devices used in this test are shown in Figure 4 and Figure 5.

Mass Loss Rate

The mass loss rate of specimens after freeze–thaw cycles was calculated according to Formula (3):
Δ m = m 1 m 2 m 1 × 100 %
where Δ m is mass loss rate of specimens after freeze–thaw cycles, %; m 1 is constant mass of specimens after drying without freeze–thaw cycles, g; and m 2 is drying mass of specimens after freeze–thaw cycles, g.

Strength Loss Rate

The strength loss rate of specimens after freeze–thaw cycles was calculated according to Formula (4):
Δ y f = y f 1 y f 2 y f 1 × 100 %
where Δ y f is compressive strength loss rate of specimens after freeze–thaw cycles, %; y f 1 is compressive strength of specimens without freeze–thaw cycles, MPa; and y f 2 is compressive strength of specimens after freeze–thaw cycles, MPa.

3. Test Results and Analysis of Physical and Mechanical Property Index of Straw–Mortar Composite Materials

The compressive strength ( y f ), water absorption rate ( y w ), and dry density ( y ρ ) of the test blocks were measured, and the results are shown in Table 3. The ranges of the compressive strength, water absorption rate, and dry density were 2.2~7.3 MPa, 11.8~29.4%, and 1020.06~1672.10 kg∙m−3, respectively. The experimental results of groups 3, 5, 6, 7, 10, and 12 showed that the increase in straw content was inversely proportional to the compressive strength and dry density, and directly proportional to the water absorption rate. The increase in reagent concentration was positively correlated with the compressive strength and dry density, and negatively correlated with the water absorption rate. The increase in pretreatment time was positively correlated with the compressive strength and dry density, and negatively correlated with the water absorption rate.

3.1. Modeling and Analysis of Variance (ANOVA)

By fitting the physical and mechanical property indices in Table 3, a quadratic polynomial regression equation with compressive strength y f , water absorption rate y w , and dry density y ρ as response values and three factors as independent variables was obtained, as shown in Formula (5), (6), and (7), respectively.
y f = 4.2236 + 0.1881 x 1 + 0.0418 x 2 + 0.6188 x 3 0.0219 x 1 x 3 + 0.0135 x 2 x 3 0.0208 x 1 2 0.002 x 2 2 ( R 2 = 0.9958 )
y ω = 9.5049 + 3.5981 x 1 + 3.4363 x 3 + 0.0086 x 1 x 2 0.1023 x 1 2 0.6469 x 3 2 ( R 2 = 0.9261 )
y ρ = 1664.7529 8.2502 x 1 1.1776 x 1 x 2 2.5822 x 1 x 3 + 0.2192 x 1 2 0.794 x 2 2 ( R 2 = 0.8342 )
where x 1 is the straw content of the composite material, % (mass fraction); x 2 is the pretreatment time of straw, min; x 3 is the reagent concentration, % (mass fraction); y f is the compressive strength of the composite material, MPa; y w is the water absorption rate of the composite material, % (mass fraction); and y ρ is the dry density of the composite material, kg∙m−3.
R 2 indicates the extent to which the constructed response surface model reflects the evolution of the results. The closer its value is to 1, the better the model fitting degree is.
The response values of the physical and mechanical properties of each group were analyzed by a variance analysis and significance test, and the results are shown in Table 4.
From the results in Table 4, it could be seen that the straw content had an extremely significant influence on all response variables. The reagent concentration had an extremely significant effect on the compressive strength and a significant effect on the water absorption rate. The pretreatment time had a significant influence on the compressive strength. The interaction between the straw content and reagent concentration had a significant influence on the compressive strength and dry density. The interaction between the pretreatment time and reagent concentration had an extremely significant effect on the compressive strength. The interaction between the straw content and pretreatment time had a significant influence on the water absorption rate and dry density.

3.2. Influence of Interaction of Various Factors on Physical and Mechanical Properties

3.2.1. Influence of Interaction of Various Influencing Factors on Compressive Strength

By observing the response surface diagram, the influence level and regularity of the interaction of various factors on the response value can be significantly analyzed [36]. It could be seen from Figure 6 that, with the increase in reagent concentration, the compressive strength of the straw–mortar composite wall materials increased at a higher rate when the straw content was low and the pretreatment time was long. When the straw content was high and the pretreatment time was short, the compressive strength of the straw–mortar composite wall materials increased slowly. With the increase in straw content, the reduction rate of the compressive strength of straw–mortar composite wall materials with a low reagent concentration was smaller than that with a high reagent concentration. With the increase in pretreatment time, the compressive strength of the straw–mortar composite wall materials increased first, and then decreased with a small change rate when the concentration of the reagent was low. When the reagent concentration was high, the compressive strength of the straw–mortar composite wall materials increased slowly.
The increase in straw content was the main reason for the rapid reduction in compressive strength. As straw fiber replaced part of the cement in cement mortar, the cement dosage decreased and mortar porosity increased; moreover, after the straw was mixed with cement, the hydration reaction between the straw and cement occurred, and the dissolved matter released by the eroded straw was converted into sugar acid, forming a calcium sugar acid shell on the surface of the cement particles, which had a certain retarding effect on cement mortar [37]. However, the properties of the materials depended on the interface between the fiber and the matrix to a certain extent [38]. Compared with the untreated straw, the surface roughness and fiber crystallinity of the straw fiber soaked in an alkaline solution were improved, which could better combine with the cement matrix, enhance the interface compatibility, and reduce the stress concentration, and effectively increase the strength of the composite materials [39,40]. In addition, pretreatment could promote the hydration reaction of cement [41], accelerate the generation of early calcium (hydrated calcium silicate) and ettringite, shorten the setting time, and, thus, improve the early strength of the materials.

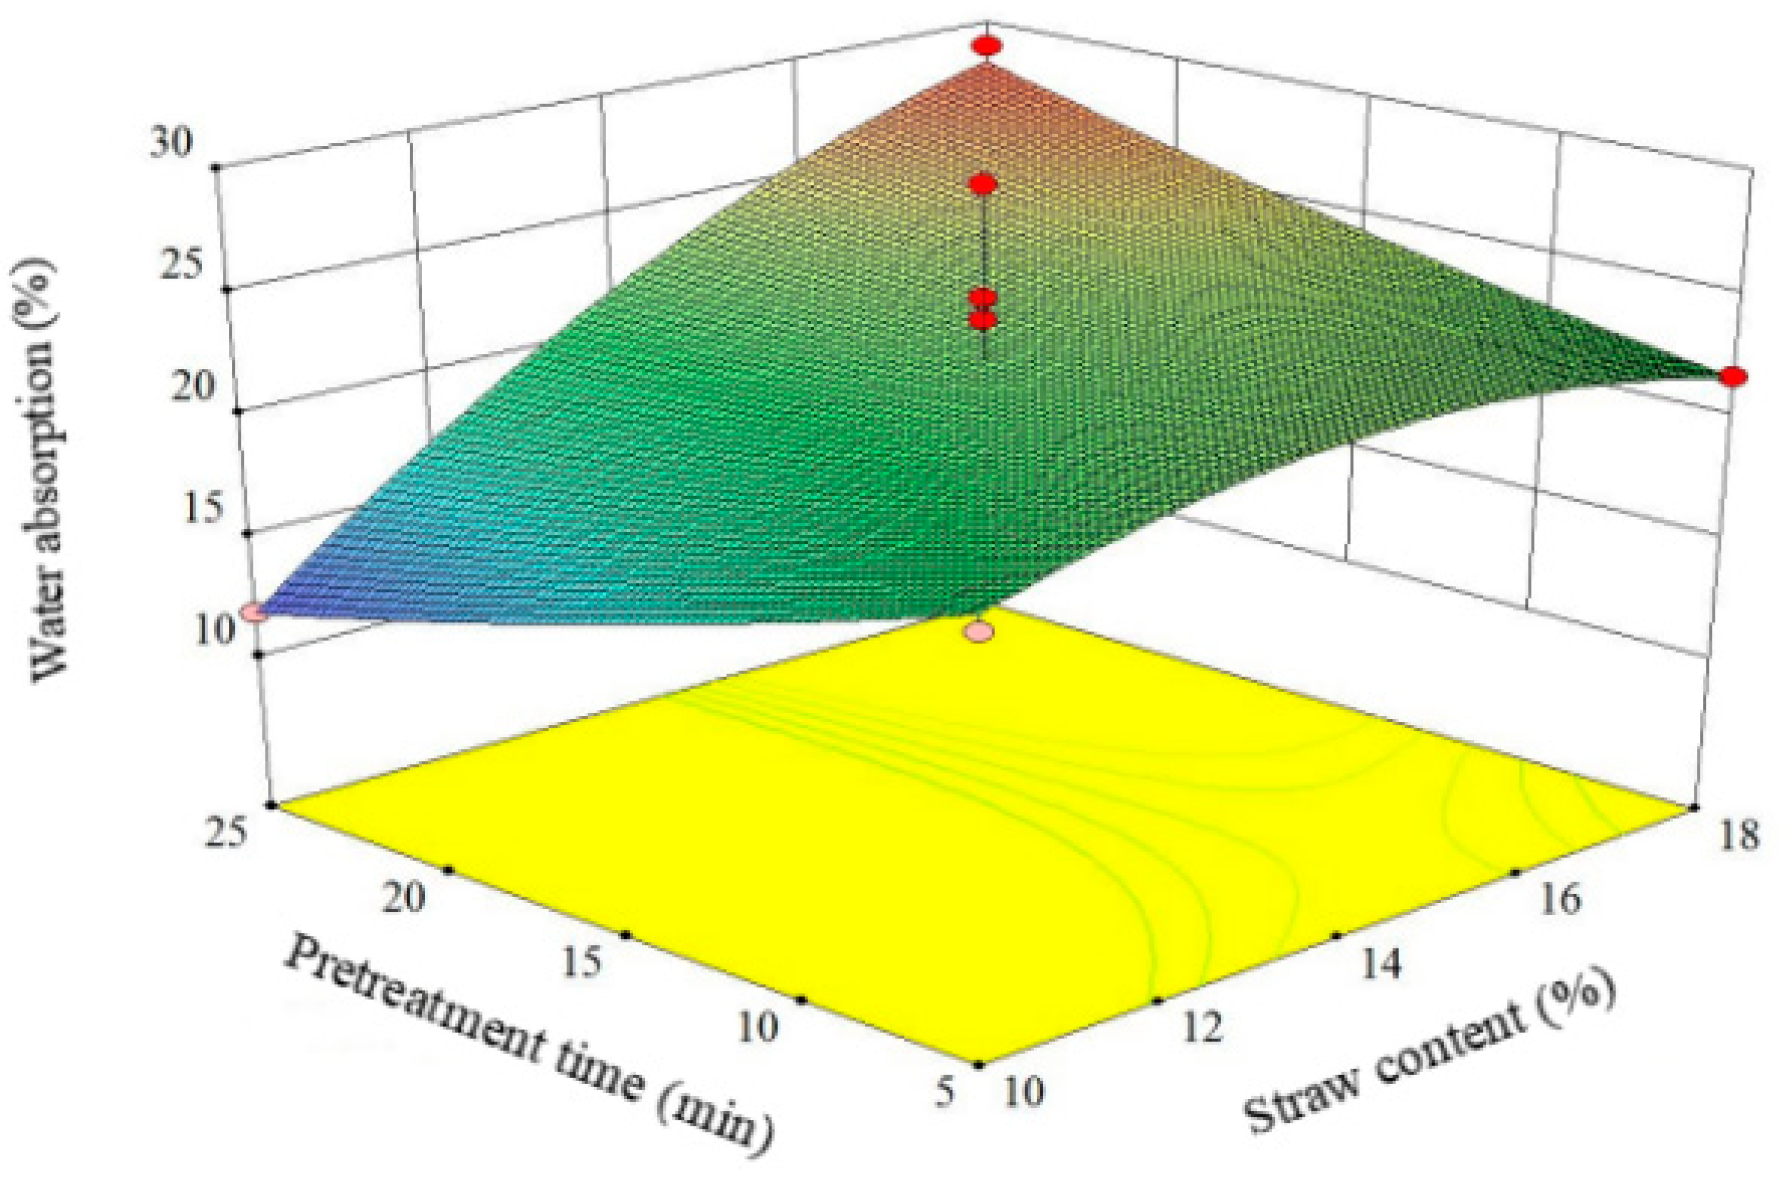
3.2.2. Influence of Interaction of Various Influencing Factors on Water Absorption Rate

It could be seen from Figure 7 that, with the increase in pretreatment time, the water absorption rate of the straw–mortar composite wall materials decreased when the straw content was at a low level, and the decrease rate was relatively slow. When the straw content was at a high level, it increased. With the increase in straw content, the water absorption rate of the straw–mortar composite wall materials increased first, and then decreased when the pretreatment time was short, and increased significantly when the pretreatment time was long.
Straw was a hydrophilic porous material, and the straw–mortar composite wall material was a porous material. Increasing the content of straw would lead to an increase in the internal porosity of the material, so that the water absorption rate of the material would be improved [4]. However, a high water absorption rate would lead to micro-cracks in the composite materials, affecting the property of the composite materials [42]. Pretreatment could degrade the cellulose and hemicellulose in straw [43], and generate an esterification layer on the surface of the straw, which would increase the cohesion of the straw surface [44], reduce the internal porosity of the material, and significantly reduce the water absorption rate of the modified composite material. Jiang et al. [45] found that increasing the pretreatment time could increase the friction properties of the fiber surface, which was conducive to the glass fiber and high-density polyethylene by isopolymerization, thus reducing the water absorption rate of composites.

3.2.3. Influence of Interaction of Various Influencing Factors on Dry Density

It could be seen from Figure 8 that, with the increase in straw content, the dry density of the straw–mortar composite wall materials increased when the pretreatment time was short and decreased significantly when the pretreatment time was long and the reagent concentration was high, and the decrease rate was slow when the reagent concentration was low. With the increase in pretreatment time, the dry density of the straw–mortar composite wall materials increased significantly when the straw content was low, and decreased slowly first, and then rapidly when the straw content was high. With the increase in reagent concentration, the dry density of the straw–mortar composite wall materials increased slowly when the straw content was low, and increased first and then decreased when the straw content was high.
The density of straw was smaller than cement, so the dry density of the block can be obviously reduced by adding straw [46]. With the increase in straw content, the decrease extent of the dry density increased. However, after modification, part of the chemical components of the modified straw were decomposed, and it could be more evenly distributed in the mortar matrix without piling up [47]. Moreover, the combination of the fiber surface structure and the mortar matrix was more compact, so the dry density of the composite materials was higher than that of the unmodified composite materials. With the increase in straw content, the density of the composite materials decreased, but the density of the composite materials made of straw fiber after alkali treatment was higher than that of the untreated straw composite materials [48]. Under the condition of the same straw content, compared with unmodified straw, the sugar substance on the surface of the modified straw fiber had been removed, and, within a reasonable pretreatment time, with the increase in pretreatment time, the removal degree of the substance on the surface of the straw was higher, and the bonding conditions for the contact interface between the straw and mortar were better, so that the straw was more tightly bonded inside the mortar.

3.3. Parameter Optimization and Experimental Verification

Parameter optimization referred to the optimization design with the compressive strength, water absorption rate, and dry density as the target parameters within the horizontal range of three factors. The Design-Expert software 12.0 was used for analysis, and the set constraint conditions are shown in Table 5.
According to the “The Bricks & Blocks Composited Insulation Materials” [49], the strength of the wall block is not less than 3.5 MPa. Therefore, the compressive strength obtained by optimizing the parameters was 6.52 MPa, which showed that the compressive strength of the straw–mortar composite wall materials prepared in this experiment met the masonry requirements. The test results are shown in Table 6.
The optimal conditions after optimization were tested and verified. The test results are shown in Table 7. It was verified that the measured value was close to the predicted value, which proved the accuracy of the optimized design. The experimental results showed that pretreatment could significantly improve the physical and mechanical properties of the straw–mortar composite wall materials. Devnani et al. [48] obtained that the mechanical strength of straw fibers treated with 5% alkali was significantly improved compared with untreated straw. Shang et al. [41] concluded that alkali treatment reduced the water absorption rate of straw fiber composites compared with untreated straw. Vijay et al. [50] found that alkali treatment could reduce the average diameter of the fiber by 21%, and increase the fiber density by 14.1%, because the voids and pores on the surface of the fiber were filled. These conclusions are consistent with the results of this study.

4. Frost Resistance of Straw–Mortar Composite Wall Materials Produced with Treated Straw

In winter, straw–mortar composite wall materials will be eroded by rain and snow and damaged by freezing and thawing, so it is important to test its frost resistance. In this experiment, according to “Standard for Test Method of Performance on Building Mortar” (JGJ/T70-2009), the water freezing and water thawing method was selected to test the materials.

4.1. Influence of Freeze–Thaw Cycle on Mass Loss Rate

We measured the mass loss rate of the test blocks after 5, 10, and 15 freeze–thaw cycles, and the results are shown in Figure 9.
It could be seen from Figure 9 that, with the increase in freeze–thaw cycles, the mass loss rate of 17 groups of straw–mortar composite wall material test blocks showed an increasing trend. Among them, after 5 freeze–thaw cycles, the change range of the mass loss rate of the test blocks was about 0.12~0.42%. After 10 freeze–thaw cycles, the mass loss rate varied from 0.31% to 0.86%. After 15 freeze–thaw cycles, the mass loss rate varied from 0.81% to 2.99%. According to “Building Thermal Insulation Mortar” (GB/T20473-2021), when the mass loss rate is within 5%, the material meets the frost resistance requirements. In this experiment, the mass loss rate under different freeze–thaw cycles were less than 5%, indicating that the material had good frost resistance.

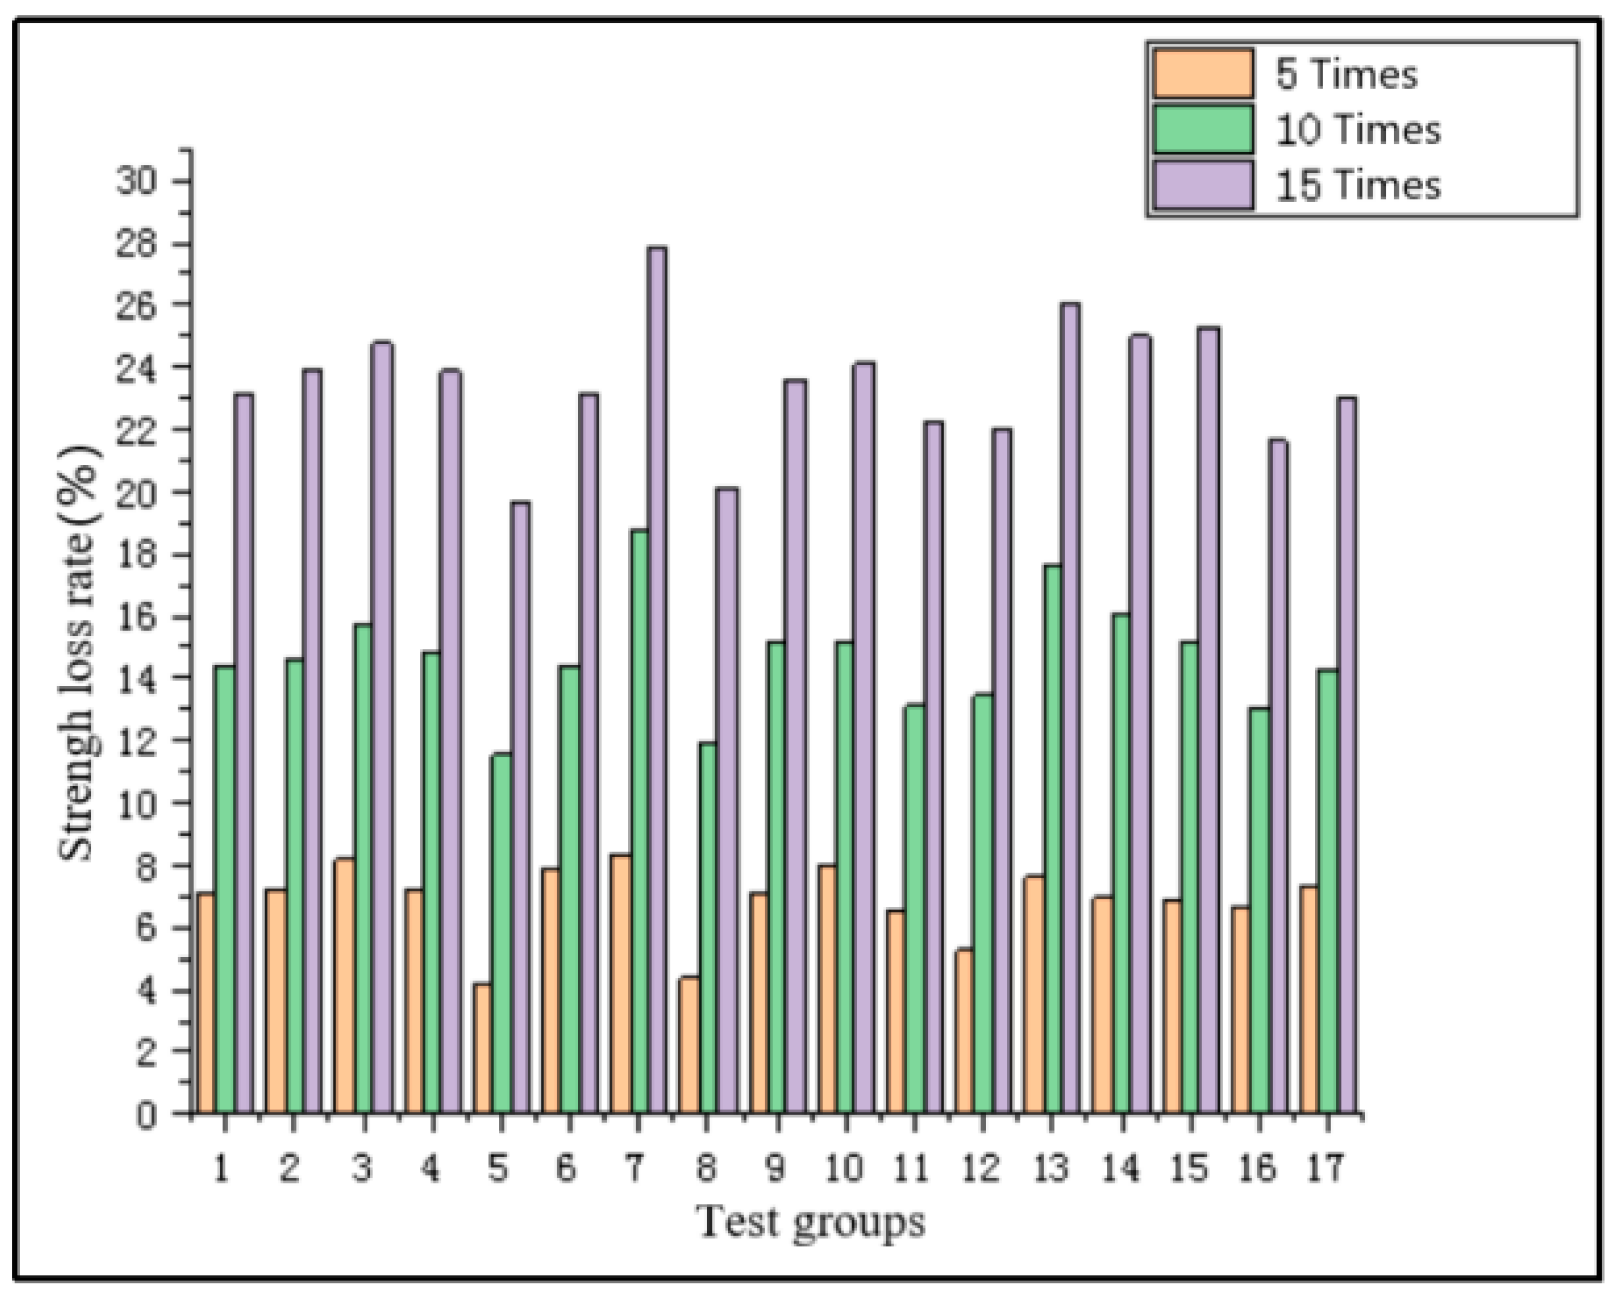
4.2. Influence of Freeze–Thaw Cycle on Strength Loss Rate

We measured the strength loss rate of the test blocks after 5, 10, and 15 freeze–thaw cycles, and the results are shown in Figure 10.
It could be seen from Figure 10 that, with the increase in freeze–thaw cycles, the strength loss rate of 17 groups of straw mortar composite wall blocks showed an increasing trend. Among them, after 5 freeze–thaw cycles, the change range of the strength loss rate of the test block was about 4.2~8.3%. After 10 freeze–thaw cycles, the strength loss rate was about 11.5~18.8%. After 15 freeze–thaw cycles, the strength loss rate was about 19.7~27.8%. According to the specification requirements of “Building Thermal Insulation Mortar” (GB/T20473-2021), the strength loss rate can meet the frost resistance requirements within 25%. In this experiment, the strength loss rate under 5 and 10 freeze–thaw cycles were less than 25%, which indicated that the frost resistance was good. Although the strength loss rate of some test blocks exceeded 25% after 15 freeze–thaw cycles, compared with the strength loss rate of the untreated straw–mortar composite wall materials which was 34.0% after 15 freeze–thaw cycles studied by Yi [51], the compressive strength of the material in this test was greatly improved, up to 3.87 Mpa, and met the strength grade of masonry mortar MU3.5/A2.5. This was because the straw after the physical–chemical combined pretreatment was fibrous, which removed most of the non-cellulose materials on the surface and increased the roughness of the fiber surface [10,11]; the interfacial compatibility of mortar was better than that of segmental straw. After the freeze–thaw cycles, there were cavities in the position of the segmentary straw distribution in the unpretreated composite material, and some water existed in the cavities. When the materials froze, the water froze and expanded; when the expansion stress of the ice exceeded the cement stress of the mortar itself, tiny cracks would occur in the mortar; and, when the materials melted, the ice melted into liquid water and flowed into tiny cracks. After repeated freeze–thaw cycles, the strength of the material was greatly reduced [52]. The physical–chemical combined pretreatment could alleviate the uneven water content in the matrix, thus reducing the influence of the freezing–thawing cycle on cracks in the matrix, so the material had good frost resistance.

4.3. Influence of Freeze–Thaw Cycle on Water Absorption Rate

We measured the water absorption rate of the straw–mortar composite wall materials after 15 freeze–thaw cycles, and obtained the change in water absorption rate of the material at room temperature and after 15 freeze–thaw cycles, as shown in Figure 11.
It could be seen from Figure 11 that the water absorption rate of the material after the freeze–thaw cycle showed an overall upward trend. After 15 freeze–thaw cycles, the water absorption rate of the material ranged from 17.2% to 30.0%, and the water absorption rate of each group was less than 30%, and the water absorption rate after 15 freeze–thaw cycles increased by about 5.5% to 7.2% compared with that at room temperature.

5. Conclusions

Through a response surface methodology analysis, it was gleaned that the influence of the straw content on the compressive strength, dry density, and water absorption rate of straw–mortar composite wall materials was the most significant. The optimum factor level of the composite materials optimized by the Design-Expert software was a straw content of 10%, pretreatment time of 5 min, and reagent concentration of 5%. At the same time, the compressive strength of the material was 6.52 MPa, the water absorption rate was 17.7%, and the dry density was 1396.33 kg∙m−3, which were 67% higher, 31% lower, and 37% higher than those of the untreated straw–mortar composite materials, respectively. The optimum physical and mechanical property parameters and pretreatment conditions provided a theoretical basis for the research and application of straw–mortar composites, and had a positive significance in promoting its large-scale utilization.
After 15 freeze–thaw cycles, the mass loss rate and strength loss rate of the materials showed an increasing trend, and the mass loss rate met the requirement of less than 5% in the standard. The compressive strength was 3.87 MPa, which was greatly improved compared with the untreated composite materials.

Author Contributions

Conceptualization, R.Z. and B.F.; methodology, R.Z.; software, B.F.; validation, R.Z., B.F. and J.F.; formal analysis, B.F.; investigation, J.F.; resources, J.F.; data curation, R.Z.; writing—original draft preparation, R.Z.; writing—review and editing, B.F.; visualization, W.G.; supervision, W.G.; project administration, W.G.; funding acquisition, W.G. All authors have read and agreed to the published version of the manuscript.

Funding

The authors would like to express their gratitude for the financial support received from the National Natural Science Foundation of China (project approval No.: 51508345), the Liaoning Province Natural Science Fund Project (project approval No.: 2022-MS-262), the University Overseas Training Project of Liaoning Provincial Department of education (project approval No.: 2020GJWYB015), and the Key Research and Development Projects in Liaoning Province (project approval No.: 2021JH2/10200022).

Data Availability Statement

The raw data supporting the conclusions of this article will be made available by the authors on request.

Conflicts of Interest

There are no conflicts of interest in this manuscript.

References

  1. Han, L.J.; Yan, Q.J.; Liu, X.Y.; Hu, J.Y. Current situation of crop straw resources and their utilization in China. J. Agric. Eng. 2002, 18, 87–91. [Google Scholar] [CrossRef]
  2. Chen, J.H.; Ji, Z.J. Present research situation and prospect of compound straw wall board. Build. Eng. Eff. 2017, 45, 74–78. [Google Scholar] [CrossRef]
  3. Madurwar, M.V.; Ralegaonkar, R.V.; Mandavgane, S.A. Application of agro-waste for sustainable construction materials: A review. Constr. Build. Mater. 2013, 38, 872–878. [Google Scholar] [CrossRef]
  4. Ahmad, M.R.; Chen, B.; Oderji, S.Y.; Mohsan, M. Development of a new bio-composite for building insulation and structural purpose using corn stalk and magnesium phosphate cement. Energy Build. 2018, 173, 719–733. [Google Scholar] [CrossRef]
  5. Xie, X.L.; Li, H.B. Compatibility between rice straw fibers with different pretreatments and ordinary Portland cement. Materials 2021, 14, 6402. [Google Scholar] [CrossRef]
  6. Çomak, B.; Bideci, A.; Bideci, Ö.S. Effects of hemp fibers on characteristics of cement based mortar. Constr. Build. Mater. 2018, 169, 794–799. [Google Scholar] [CrossRef]
  7. Cai, J.L.; Wang, N.K.; Wang, J.; Li, D.M. Research progress on rice pretreatment technology of rice straw. China Rice 2023, 29, 24–27. [Google Scholar] [CrossRef]
  8. Valles, A.; Capilla, M.; Álvarez-Hornos, F.J.; García-Puchol, M.; San-Valero, P.; Gabaldón, C. Optimization of alkali pretreatment to enhance rice straw conversion to butanol. Biomass Bioenergy 2021, 150, 106131. [Google Scholar] [CrossRef]
  9. Onuaguluchi, O.; Banthia, N. Plant-based natural fibre reinforced cement composites:A review. Cem. Concr. Compos. 2016, 68, 96–108. [Google Scholar] [CrossRef]
  10. Kundu, S.P.; Chakraborty, S.; Roy, A.; Adhikari, B.; Majumder, S.B. Chemically modified jute fibre reinforced non-pressure (NP) concrete pipes with improved mechanical properties. Constr. Build. Mater. 2012, 37, 841–850. [Google Scholar] [CrossRef]
  11. Saha, P.; Manna, S.; Chowdhury, S.R.; Sen, R.; Roy, D.; Adhikari, B. Adhikari. Enhancement of tensile strength of lignocellulosic jute fibers by alkali-steam treatment. Bioresour. Technol. 2010, 101, 3182–3187. [Google Scholar] [CrossRef]
  12. Ramesh, M.; Palanikumar, K.; Reddy, K.H. Plant fibre based bio-composites: Sustainable and renewable green materials. Renew. Sustain. Energy Rev. 2017, 79, 558–584. [Google Scholar] [CrossRef]
  13. Ferreira, S.R.; Silva, F.A.; Lima, P.R.L.; Toledo, R.D. Effect of fiber treatments on the sisal fiber properties and fiber-matrix bond in cement based systems. Constr. Build. Mater. 2015, 101, 730–740. [Google Scholar] [CrossRef]
  14. Negawo, T.A.; Polat, Y.; Buyuknalcaci, F.N.; Kilic, A.; Saba, N.; Jawaid, M. Mechanical, morphological, structural and dynamic mechanical properties of alkali treated Ensete stem fibers reinforced unsaturated polyester composites. Compos. Struct. 2019, 207, 589–597. [Google Scholar] [CrossRef]
  15. Behl, M.; Dahiya, P.; Kumari, D.; Thakur, K.; Devi, M.; Rathour, R.K.; Bhatt, A.K.; Bhatia, R.K. Development of tailored bioprocess for pretreatment and saccharification of corn stalk into bioethanol using hydrolytic enzymes cocktail and fermentative yeasts. Biocatal. Agric. Biotechnol. 2023, 53, 102896. [Google Scholar] [CrossRef]
  16. Zhang, M.; Li, A.; Yang, C.M.; Guo, C.X. Effect of NaOH pretreatment on mesophilic anaerobic fermentation efficiency of wheat. Acta Agric. Boreali-Occident. Sin. 2023, 32, 2022–2030. [Google Scholar] [CrossRef]
  17. Chen, X.L.; Hu, S.C.; Zhou, Z.W. Effects of pretreatments on the structure and properties of rice straw. J. Funct. Mater. 2010, 41, 275–277. [Google Scholar]
  18. Ma, X.X.; Cai, Y.; Ma, Y.L. Study on pretreatment of corn straw cellulose by alkali/high temperature moist heat method. Appl. Petrochem. Eng. 2020, 39, 104–109. [Google Scholar]
  19. Akinyemi, A.B.; Omoniyi, E.T.; Onuzulike, G. Effect of microwave assisted alkali pretreatment and other pretreatment methods on some properties of bamboo fibre reinforced cement composites. Constr. Build. Mater. 2020, 245, 118405. [Google Scholar] [CrossRef]
  20. Ratsimbazafy, H.H.; Préneron, A.L.; Magniont, C.; Evon, P. A review of the multi-physical characteristics of plant aggregates and their effects on the properties of plant-based concrete. Recent Prog. Mater. 2021, 3, 1–69. [Google Scholar] [CrossRef]
  21. Liu, X.; Wang, H.; Fei, Z.Y.; Zhang, G.P.; Ai, S.Y.; Guo, Y.; Wang, S.J. Effect of slightly cadmium- enriched kenaf straw on the mechanical and thermal properties of cement mortar. Eur. J. Environ. Civ. Eng. 2020, 26, 4093–4111. [Google Scholar] [CrossRef]
  22. Xu, C.W.; Li, Q.H.; Liu, T.S.; Yu, F.P. Influence of straw morphology and dosage on the performance of magnesium oxysulfide cement-based straw lightweight composite. Concrete 2020, 363, 147–149. [Google Scholar] [CrossRef]
  23. Feng, L.Z.; Liu, F.S.; Yue, Q.; Wen, F.S.; Wu, Y.X. Orthogonal test research of wheat straw-MOC composite insulation mortar. New Build. Mater. 2016, 43, 69–72. [Google Scholar] [CrossRef]
  24. Wang, X.Y.; Hu, C.G.; Feng, X.X. Strength of modified wheat straw/cement composite. J. Mater. Sci. Eng. 2017, 35, 139–143. [Google Scholar] [CrossRef]
  25. Huang, Y.T.; Tan, J.L.; Xuan, X.X.; Liu, L.P.; Xie, M.J.; Liu, H.N.; Yu, S.J.; Zheng, G.J. Study on untreated and alkali treated rice straw reinforced geopolymer composites. Mater. Chem. Phys. 2021, 262, 124304. [Google Scholar] [CrossRef]
  26. Wang, L.L.; Zhang, T.T.; Wang, Z.J.; Zheng, Y. The effect of biogas slurry combined with freeze-thaw pretreatment on the physicochemical properties of rice straw. Trans. CSAE 2023, 39, 188–199. [Google Scholar] [CrossRef]
  27. Hua, L.X.; Xiao, F.P.; Li, Y.T.; Huang, H.B.; Zhao, K.W.; Yu, K.X.; Hettiarachchi, C. A potential damage mechanism of rubberized cement under freeze-thaw cycle. Constr. Build. Mater. 2020, 252, 119054. [Google Scholar] [CrossRef]
  28. Rangel, C.S.; Amario, M.; Pepe, M.; Martinelli, E.; Toledo, R.D. Durability of structural recycled aggregate concrete subjected to freeze-thaw cycles. Sustainability 2020, 12, 6475. [Google Scholar] [CrossRef]
  29. Wu, Q.Y.; Ma, Q.Y.; Wang, Y. Compression-tensile tests and meso-structure of basalt fiber-slag powder-fly ash concrete under freeze-thaw cycles. Acta Mater. Compos. Sin. 2021, 38, 953–965. [Google Scholar] [CrossRef]
  30. Chen, H.M.; Hu, Y.S.; Li, Z. Adsorption mechanism of heavy metals by phosphate·solubilizing microorgajlism modified biochar. J. China Environ. Sci. 2021, 41, 684–686. [Google Scholar]
  31. Raid, A.; Noha, S.; Mohamed, M.A.; Ahmed, H.; Basheer, N.; Mahmoud, A.D. Influences of straw alkaline pretreatment on biogas production and digestate characteristics: Artificial neural network and multivariate statistical techniques. Environ. Sci. Pollut. Res. Int. 2024, 31, 13638–13655. [Google Scholar] [CrossRef]
  32. Zhang, Y.W.; Ding, L.; Yang, M.M.; Cheng, C.; Yu, G.S. Preparation and slurry ability of coal water slurry with hydrothermal carbonization pretreatment of corn stalk. Clean Coal Technol. 2023, 12, 1–12. [Google Scholar] [CrossRef]
  33. Jiang, D.M.; An, P.H.; Cui, S.P.; Sun, S.G.; Zhang, J.Z.; Tuo, T.F. Effect of straw fiber modification methods on compatibility between straw fibers and cement-based materials. Adv. Civ. Eng. 2020, 2020, 8392935. [Google Scholar] [CrossRef]
  34. JGJ/T 70-2009; Standard for test method of basic properties of construction mortar. Ministry of Housing and Urban-Rural Development of the People’s Republic of China: Beijing, China, 2009.
  35. GB/T 20473-2021; Dry-mixed thermal insulating mortar for buildings. Standardization Administration of the People’s Republic of China: Beijing, China, 2021.
  36. Raina, N.; Slathia, P.S.; Sharma, P. Experimental optimization of thermochemical pretreatment of sal (Shorea robusta) sawdust by Central Composite Design study for bioethanol production by co-fermentation using Saccharomyces cerevisiae (MTCC-36) and Pichia stipitis (NCIM-3498). Biomass Bioenergy 2020, 143, 105819. [Google Scholar] [CrossRef]
  37. Wang, J.H.; Tian, Y.L.; Xu, C.W.; Qi, H. Effect of corn straw content on the properties of magnesium cement composite building materials. New Build. Mater. 2016, 43, 87–90. [Google Scholar] [CrossRef]
  38. Mak, K.; Fam, A. Performance of SiO2-impregnated flax fibre reinforced polymers under wet dry and freeze thaw cycles. J. Compos. Mater. 2021, 55, 251–263. [Google Scholar] [CrossRef]
  39. Liu, Q.; Cheng, J.W.; Wang, Y.Q.; Lei, W. Study on properties of modified wheat straw powder polypropylene composites. Polym. Bull. 2021, 34, 58–64. [Google Scholar] [CrossRef]
  40. Ajouguim, S.; Stefanidou, M.; Abdelouahdi, K.; Waqif, M.; Saâdim, L. Influence of treated bio-fibers on the mechanical and physical properties of cement mortars. Eur. J. Environ. Civ. Eng. 2022, 26, 3120–3135. [Google Scholar] [CrossRef]
  41. Shang, X.Y.; Yang, J.W.; Song, Q.; Wang, L. Efficacy of modified rice straw fibre on properties of cementitious composites. J. Clean. Prod. 2020, 276, 124184. [Google Scholar] [CrossRef]
  42. Wang, F.; Zhou, S.J.; Yang, M.Q.; Chen, Z.Q.; Ran, S.Y. Thermo-mechanical performance of polylactide composites reinforced with alkali-treated bamboo fibers. Polymers 2018, 10, 401. [Google Scholar] [CrossRef]
  43. Jiang, D.M.; Cui, S.P.; Xu, F.; Tuo, T.F. Impact of leaf fibre modification methods on compatibility between leaf fibres and cement-based materials. Constr. Build. Mater. 2015, 94, 502–512. [Google Scholar] [CrossRef]
  44. Jiang, J.; Mei, C.T.; Pan, M.Z.; Lian, H.L.; Lu, F. Effect of low temperature plasma pre-treatment on the mechanical properties for wood plastic composites reinforced by glass fibers. China For. Prod. Ind. 2010, 56, 3–7. [Google Scholar] [CrossRef]
  45. Cai, J.W.; Jia, X.Y.; Yan, S.J.; Cao, X.; Liu, X.Y.; Li, W.J.; Wang, H.Y. Study on mechanical properties of cement-based straw fiber composite materials. China Cem. Concr. Prod. 2019, 7, 55–57. [Google Scholar]
  46. Wu, W.L.; Chen, F.Y. Preparation and interfacial modification of corn straw reinforced crumb rubber composite. Synth. Rubbing India 2021, 44, 51–55. [Google Scholar] [CrossRef]
  47. Nguyen, V.C.; Mangat, P.S. Properties of rice straw reinforced alkali activated cementitious composites. Constr. Build. Mater. 2020, 261, 120536. [Google Scholar] [CrossRef]
  48. Devnani, G.L.; Sinha, S. African teff straw as a potential reinforcement in polymer composites for light-weight applications: Mechanical, thermal, physical, and chemical characterization before and after Alkali treatment. J. Nat. Fibers 2020, 17, 1011–1025. [Google Scholar] [CrossRef]
  49. GB/T 29060-2012; The bricks & blocks composited insulation materials. Standardization Administration of the People’s Republic of China: Beijing, China, 2012.
  50. Vijay, R.; Singaravelu, D.L.; Vinod, A.; Sanjay, M.R.; Siengchin, S.; Jawaid, M.; Khan, A.; Parameswaranpillai, J. Characterization of raw and alkali treated new natural cellulosic fibers from Tridax procumbens. Int. J. Biol. Macromol. 2019, 125, 99–108. [Google Scholar] [CrossRef]
  51. Yi, X.Y. Study on the Physical and Frost Resistance of Rice Straw Mortar Composites. Master’s Thesis, Shenyang Agricultural University, Shenyang, China, 2020. [Google Scholar] [CrossRef]
  52. Grubeša, I.N.; Vračević, M.; Ducman, V.; Markovic, B.; Szenti, I.; Kukovecz, A. Influence of the size and type of pores on brick resistance to freeze-thaw cycles. Materials 2020, 13, 3717. [Google Scholar] [CrossRef]
Figure 1. Combined pretreatment.
Sustainability 16 05608 g001
Figure 2. Testing block preparation.
Sustainability 16 05608 g002
Figure 3. Determination of compressive strength.
Sustainability 16 05608 g003
Figure 4. Testing device of freeze–thaw cycles.
Sustainability 16 05608 g004
Figure 5. Controller.
Sustainability 16 05608 g005
Figure 6. Response surface diagram of interaction of various factors on the compressive strength.
Sustainability 16 05608 g006
Figure 7. Response surface diagram of interaction between straw content and pretreatment time on the water absorption rate.
Sustainability 16 05608 g007
Figure 8. Response surface diagram of interaction of various factors on the dry density.
Sustainability 16 05608 g008
Figure 9. Mass loss rate of testing blocks after different number of freeze–thaw cycles.
Sustainability 16 05608 g009
Figure 10. Strength loss rate of testing blocks after different number of freeze–thaw cycles.
Sustainability 16 05608 g010
Figure 11. Water absorption rate of composite materials at room temperature after 15 freeze–thaw cycles.
Sustainability 16 05608 g011
Table 1. Testing factors and levels of straw–mortar composite wall materials.
FactorsLevels
−101
x 1 (%)101418
x 2 (min)51525
x 3 (%)135
Table 2. Physical and mechanical properties of cement.
Specific Surface Area
(cm2·g−1)
Density
(kg·m−3)
Setting Time (Min)Compressive Strength (MPa)
Initial SettingFinal Setting3 d28 d
3245315018323725.449.5
Table 3. Physical and mechanical properties of composite materials based on the Box–Behnken experimental design.
Number x 1
(%)
x 2
(Min)
x 3
(%)
y f
(MPa)
y w
(%)
y ρ
(kg∙m−3)
0101533.8813.51020.06
1141535.0624.91478.93
2141535.0113.71651.73
314514.4024.91307.64
4141535.1129.41318.58
5102536.5011.81672.10
614554.8023.61278.78
7181512.2024.81295.76
8101557.3016.31569.10
9141535.0824.11358.57
10142514.0222.71359.71
11142555.5021.91369.33
1210536.1020.21402.72
1318532.5021.81432.72
14181553.2024.41315.56
15182532.9028.91195.02
16101515.6017.11466.67
17141535.0420.21465.53
where x 1 is the straw content (%, mass fraction); x 2 is the pretreatment time (min); x 3 is the reagent concentration (%, mass fraction); y f is the compressive strength (MPa); y w is the water absorption rate (%, mass fraction); and y ρ is the dry density (kg∙m−3).
Table 4. Coefficient values and variance analysis of the fitted model for different responses of composite materials.
Response VariableSourceSum of Squares d f Mean SquaresF Valuep ValueSignificance
Compressive strengthModel31.0793.45186.01<0.0001**
x 1 27.01127.011455.57<0.0001**
x 2 0.1610.168.450.0228*
x 3 2.6212.62141.30<0.0001**
x 1 x 3 0.1210.126.600.0370*
x 2 x 3 0.2910.2915.710.0054**
x 1 2 0.4710.4725.080.0016**
x 2 2 0.2210.2211.740.0110*
Lack of fit0.1230.04128.530.0037
Water absorption rateModel148.47916.509.750.0033**
x 1 102.461102.4660.560.0001**
x 3 1.3211.320.780.0463*
x 1 x 2 0.4710.470.280.0447*
x 1 2 11.29111.296.670.0363*
x 3 2 28.19128.1916.660.0047**
Lack of fit10.4933.5010.310.0236
Dry densityModel1.413 × 105915,705.003.910.0429*
x 1 96,965.07196,965.0724.160.0017**
x 1 x 2 64,280.00164,280.006.300.0404*
x 1 x 3 1706.9311706.930.170.0447*
x 1 2 3055.5113055.510.300.0312*
x 2 2 26,544.84126,544.846.610.0369*
Lack of fit3921.8931307.300.220.8805
where x 1 is the straw content (%, mass fraction); x 2 is the pretreatment time (min); x 3 is the reagent concentration (%, mass fraction); “*” means generally significant difference at p < 0.05 level; and “**” means extremely significant difference at p < 0.01 level.
Table 5. Optimization goal of variables during straw–mortar composite wall materials production.
VariableGoalLevel of Importance
Independent
Straw content (%, mass fraction)In range (10–18)
Pretreatment time (min)In range (5–25)
Reagent concentration (%, mass fraction)In range (1–5)
Response
Compressive strength (MPa)MaximizeFirst
Water absorption rate (%, mass fraction)MinimizeSecond
Dry density (kg∙m−3)MaximizeThird
Table 6. Optimum conditions for producing straw–mortar composite wall materials.
x 1 (%) x 2 (Min) x 3 (%) y f (MPa) y ω (%) y ρ   ( kg · m 3 )
10556.5217.71396.33
where x 1 is the straw content (%, mass fraction); x 2 is the pretreatment time (min); x 3 is the reagent concentration (%, mass fraction); y f is the compressive strength (MPa); y w is the water absorption rate (%, mass fraction); and y ρ is the dry density (kg∙m−3).
Table 7. Verification of experimental results.
x 1 (%) x 2 (Min) x 3 (%) y f (MPa) y ω (%) y ρ   ( kg · m 3 )
10556.4917.81397.5
where x 1 is the straw content (%, mass fraction); x 2 is the pretreatment time (min); x 3 is the reagent concentration (%, mass fraction); y f is the compressive strength (MPa); y w is the water absorption rate (%, mass fraction); and y ρ is the dry density (kg∙m−3).
Disclaimer/Publisher’s Note: The statements, opinions and data contained in all publications are solely those of the individual author(s) and contributor(s) and not of MDPI and/or the editor(s). MDPI and/or the editor(s) disclaim responsibility for any injury to people or property resulting from any ideas, methods, instructions or products referred to in the content.

