Abstract
The study investigates water quality in a small water body in an agricultural catchment in a zone of temperate climate (East Poland). The pond is affected by annual mass cyanobacterial blooms, limiting its use. The improvement of the state of water quality involved the application of underwater aerating reactors. The economic analysis of their application was also an important issue. The analysis of the effectiveness of the proposed solution was conducted from February to October 2021. The results from the analysis of water from the pond showed that the nutrient content and phytoplankton structure conformed to the trophic status of eutrophy–hypertrophy. The primary factors causing excessive eutrophication of the pond included nutrient supply from the river, sediments, and fallen tree leaves. No development of cyanobacterial scum was observed in the water body, a phenomenon which was interpreted as the effect of the operation of the aerators ensuring additional water circulation in the pond and promoting its aeration. It was found that permanent improvement of the water quality in the studied water body is largely dependent on limiting the nitrogen and phosphorus supply to the pond. This should involve the application of systems combining traditional hydrotechnical infrastructure with Nature-Based Solutions (NBS). The economic analysis of the use of underwater aeration reactors confirmed the validity of searching for alternative solutions to power them, e.g., a photovoltaic installation. When designing a reactor system with a photovoltaic installation, it is necessary to choose the correct dimensions to reduce construction costs and, thus, increase the profitability of the potential investment.
1. Introduction
One of the most serious problems regarding the functioning of water bodies include water eutrophication [1,2,3,4,5,6]. The phenomenon has considerably accelerated in recent years as a result of human activities such as discharge of industrial, municipal, and urban sewage, intensification of fertilization in agriculture, and an increase in erosion in catchments [7,8,9,10]. The process results in an increase in the nutrient content in the water and, therefore, a worsening of its quality [11].
The development and bloom of phytoplankton is of key importance, particularly the development of cyanobacteria [12,13,14]. It causes a decrease in water transparency and the potential development of scum on the surface. Its mass accumulation may lead to oxygen deficits [15,16,17,18]. Some cyanobacteria produce hazardous toxins, consequently causing the death of flora and fauna and even posing a threat to human health [19,20,21,22,23].
Limiting water blooms relies on many methods of water restoration that are of technical, biological, chemical, and ecohydrological nature [24,25,26,27,28,29,30,31,32]. These measures are undertaken for the purpose of limiting the pool of nutrients available in the water body through the control of internal mechanisms in the ecosystem and/or by limiting the external loads [33,34,35].
One of these technical measures is artificial aeration/oxygenation, which can improve water quality through an increase in the activity of autochthonic organisms and the restoration of natural cleaning processes. Aeration or oxygenation that increases the dissolved oxygen in the bottom water layer and reduces the release of nutrients from sediments has been broadly investigated in deep water bodies [36]. In Poland, the most popular solution is the use of wind-driven pulverizing aerators [29]. It has also been reported that (vertical) water mixing through aeration can limit the growth of phytoplankton, including cyanobacteria, and, in some cases, improve water transparency [37]. Aeration systems have also been deployed in many ponds in municipal parks and lakes [38,39,40]. Despite the shallow water, the stagnant character of ponds causes thermal stratification, oxygen deficit at the bottom, and surface cyanobacterial bloom [41,42]. Various of the commonly used aeration systems (e.g., axial flow pumps, surging aerators, and paddle wheels) may be insufficient to create an appropriate water circulation throughout the water volume [43,44,45].
Eutrophication of water bodies, as one of the most serious environmental problems, has negative ecological, socio-economic, and health effects. Such issues also concern small water bodies [46], including those constructed/used by individual persons. Small water bodies in agricultural areas have been relatively underinvestigated as environmental systems. Next to their recreational function and their role in fish farming, this type of water bodies can also be used for field irrigation. It has been of great importance during draughts in the growing season which have occurred in recent years in Central Europe [47,48,49]. In agricultural areas, where waters are rich in nutrients, the construction of small ponds forces the search for efficient and cost-effective solutions to maintain good quality of their waters.
The main objective of this study was the assessment, during the growing season, of both the trophic status of the waters of a small water body in an agricultural catchment and the effect of underwater aeration reactors (TAYLOR LLC.) on limiting the occurrence of cyanobacterial blooms. Another important objective was the economic analysis of the application of underwater reactors. The water body featured annual mass cyanobacterial blooms that limited its use.
The experiment revealed that an important part of the treatment process entails the improvement of oxygen conditions through both aeration and the improvement of water circulation/mixing in the water body, further promoted by pumps. However, using mechanical devices for this purpose incurs costs related to their maintenance and electricity consumption. Therefore, it seems necessary to explore various scenarios to identify the most cost-effective way of using underwater reactors in practice. The effects of the application of the aerators were determined by analyzing common indices used for the assessment of the degree of water eutrophication: oxygen conditions, water transparency, nutrient (N and P) content, chlorophyll concentration, and abundance and species structure of phytoplankton. During the experiment, the focus was also on whether cyanobacterial scum would occur in the water body, as this is often a clear symptom of pond eutrophication in the summer.
2. Materials and Methods
2.1. Aerating Reactors
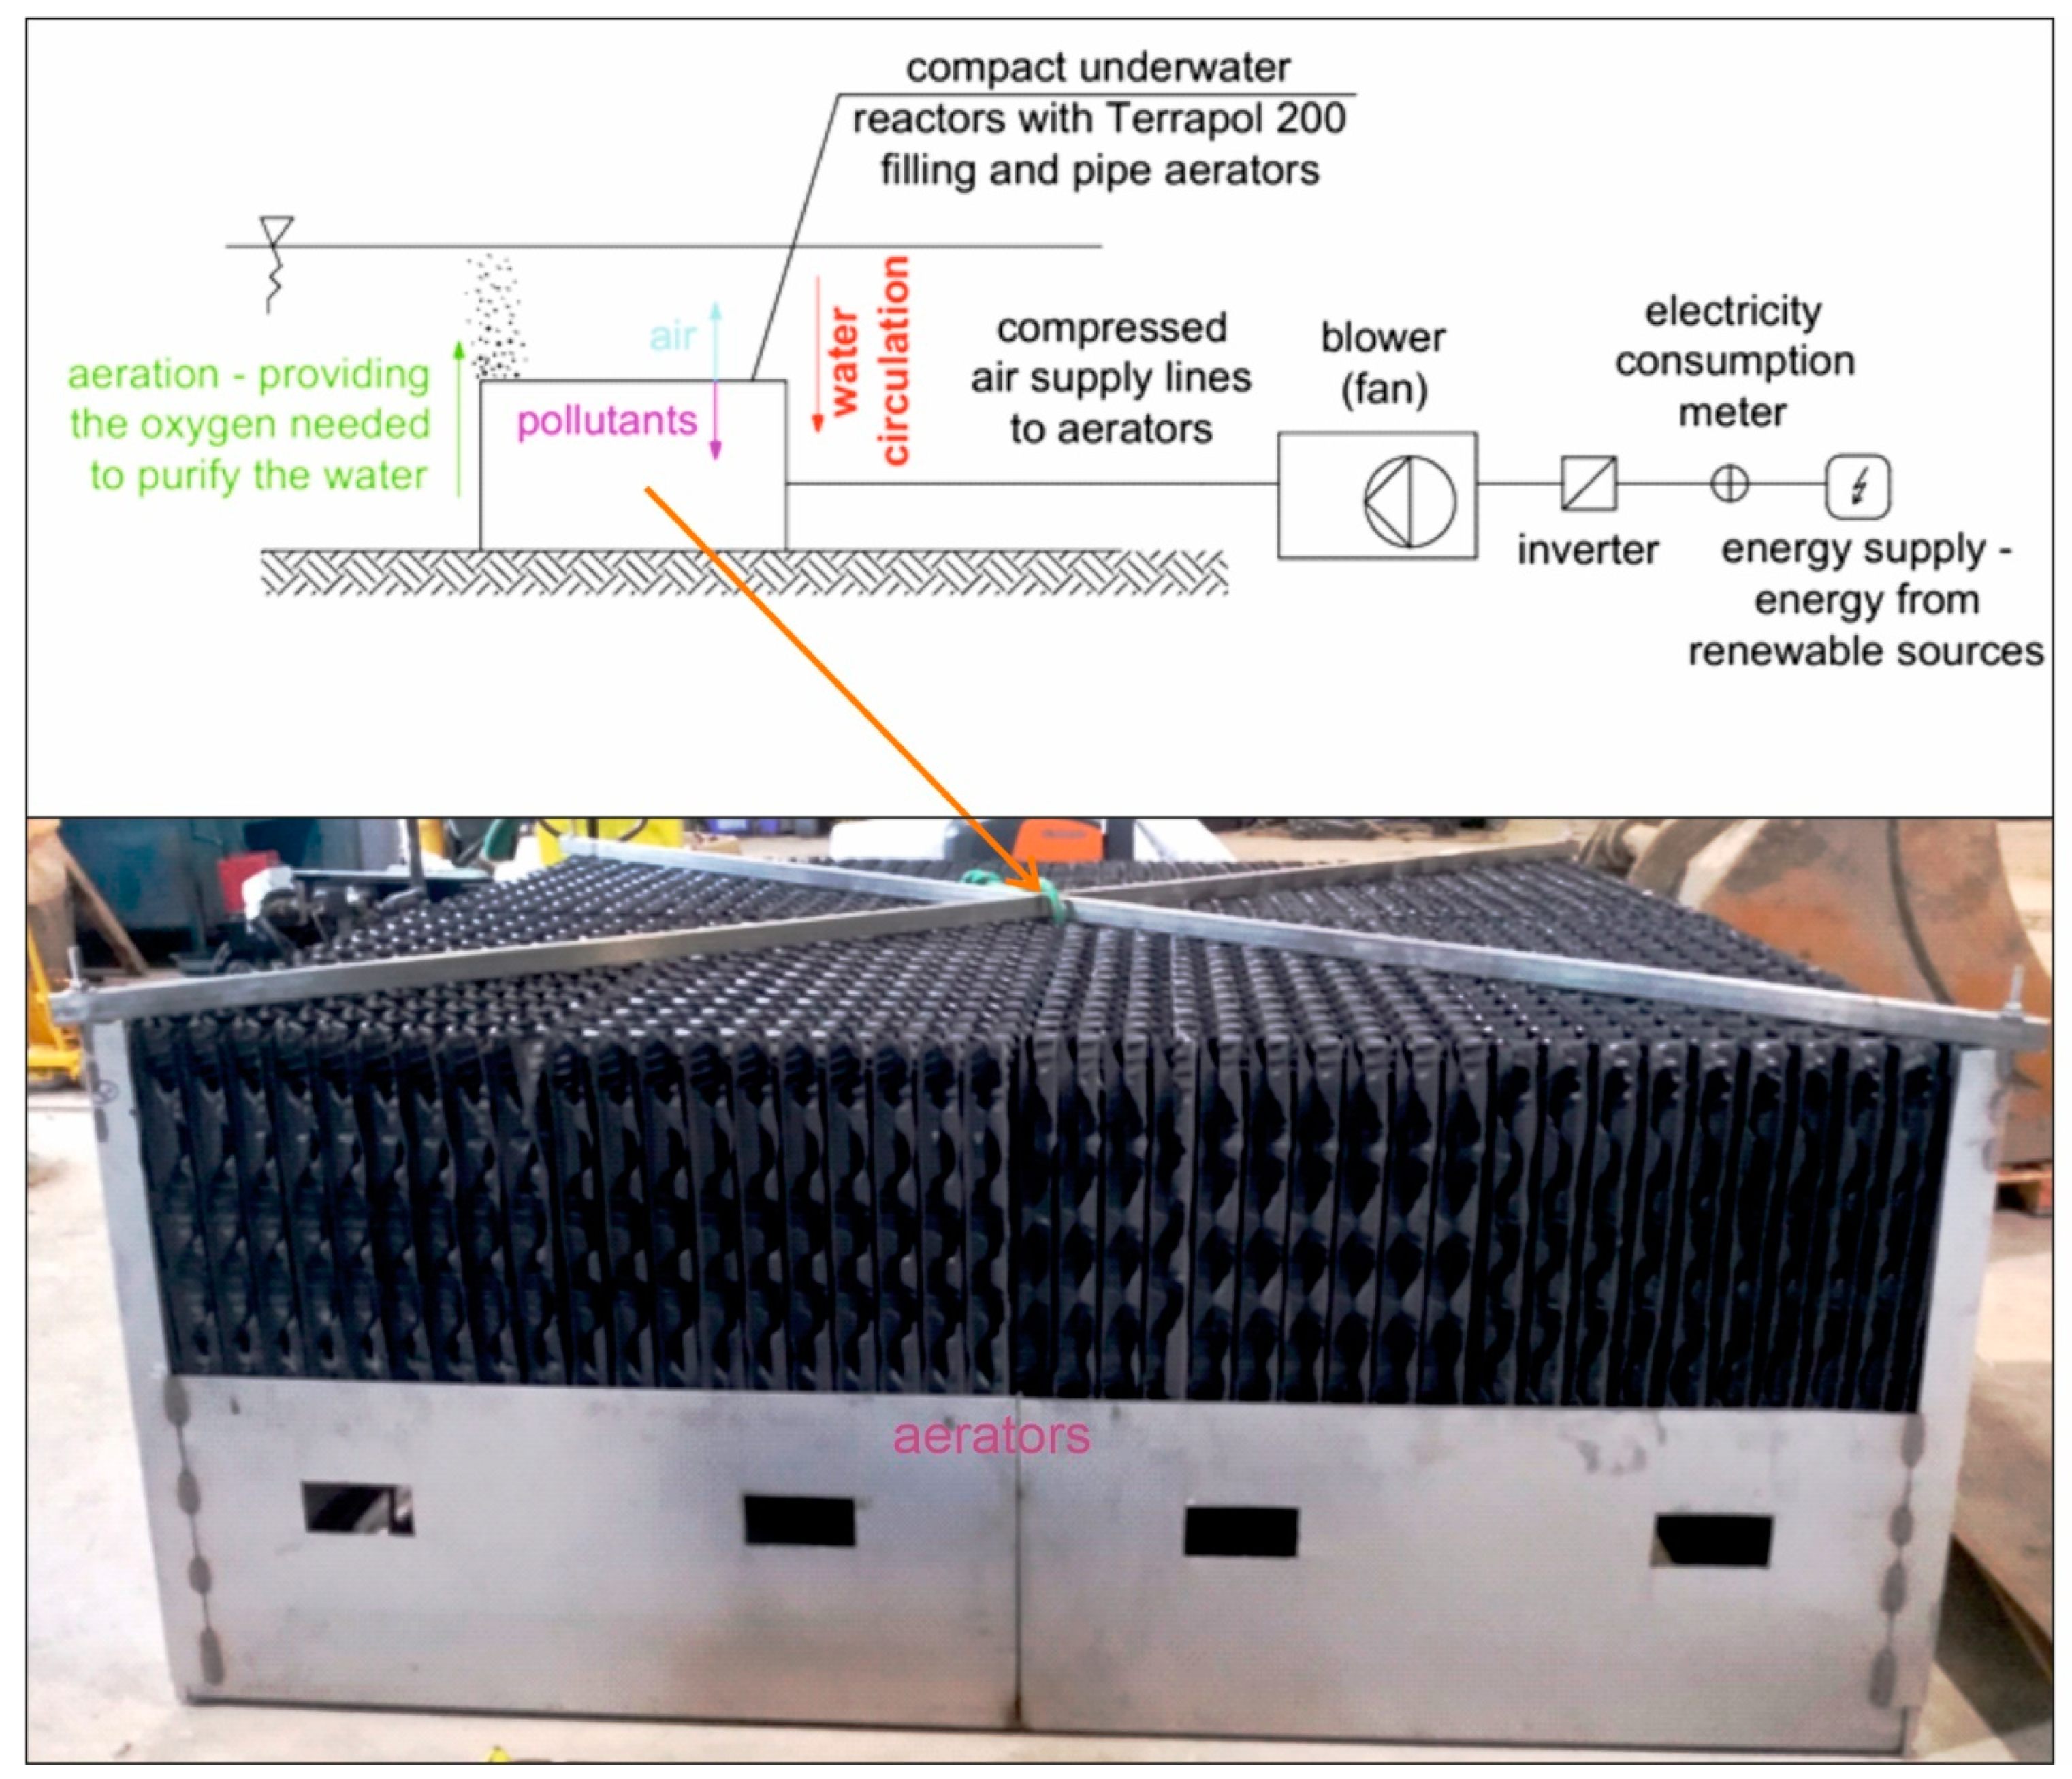
The study employed compact underwater aerating reactors (Figure 1). Two reactors were installed in the pond in November 2020. Their prototype was developed and manufactured by the company Taylor LLC. (Lublin, Poland). The task of the aerating reactors was to increase the amount of oxygen in the pond and ensure water movement. The aerating device was built using pipe aerators characterized by terrapol®200 (AF20/200 Terracon-pol, Krapkowice, Poland) filling and a specific surface of 200 m2/m3.
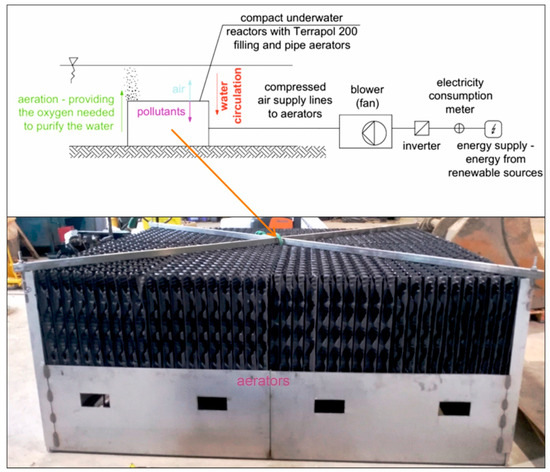
Figure 1.
Diagram of the underwater reactor aerating the pond.
This filling, which is made of plastic (PVC), is standardly used in biological filters. This type of technology allows for a large active surface area of the filter to be obtained alongside an optimal distribution and mixing of liquids and air throughout the entire volume of the filling channels. The impact of the aerators on the water aeration process and on the improvement of the water quality is associated with the supply of oxygen to the water to oxidize organic pollutants. By increasing the contact surface area between water and air, aerators accelerate oxidation processes. In the process of water mixing, the aerators also promote the uniform distribution of oxygen throughout the entire reservoir, preventing algal blooms by providing the appropriate oxygen concentration to inhibit algal growth [50,51].
The entire system was aerated by using a blower (fan) with a maximum efficiency of 350 m3/h. The air compressed in the blowers was supplied, through pipes, to aerators, i.e., elements introducing air in the water. The devices were situated in the vicinity of the bottom of the pond, at a depth of about 0.7 m. The reactors were powered by the electricity network.
2.2. Study Area
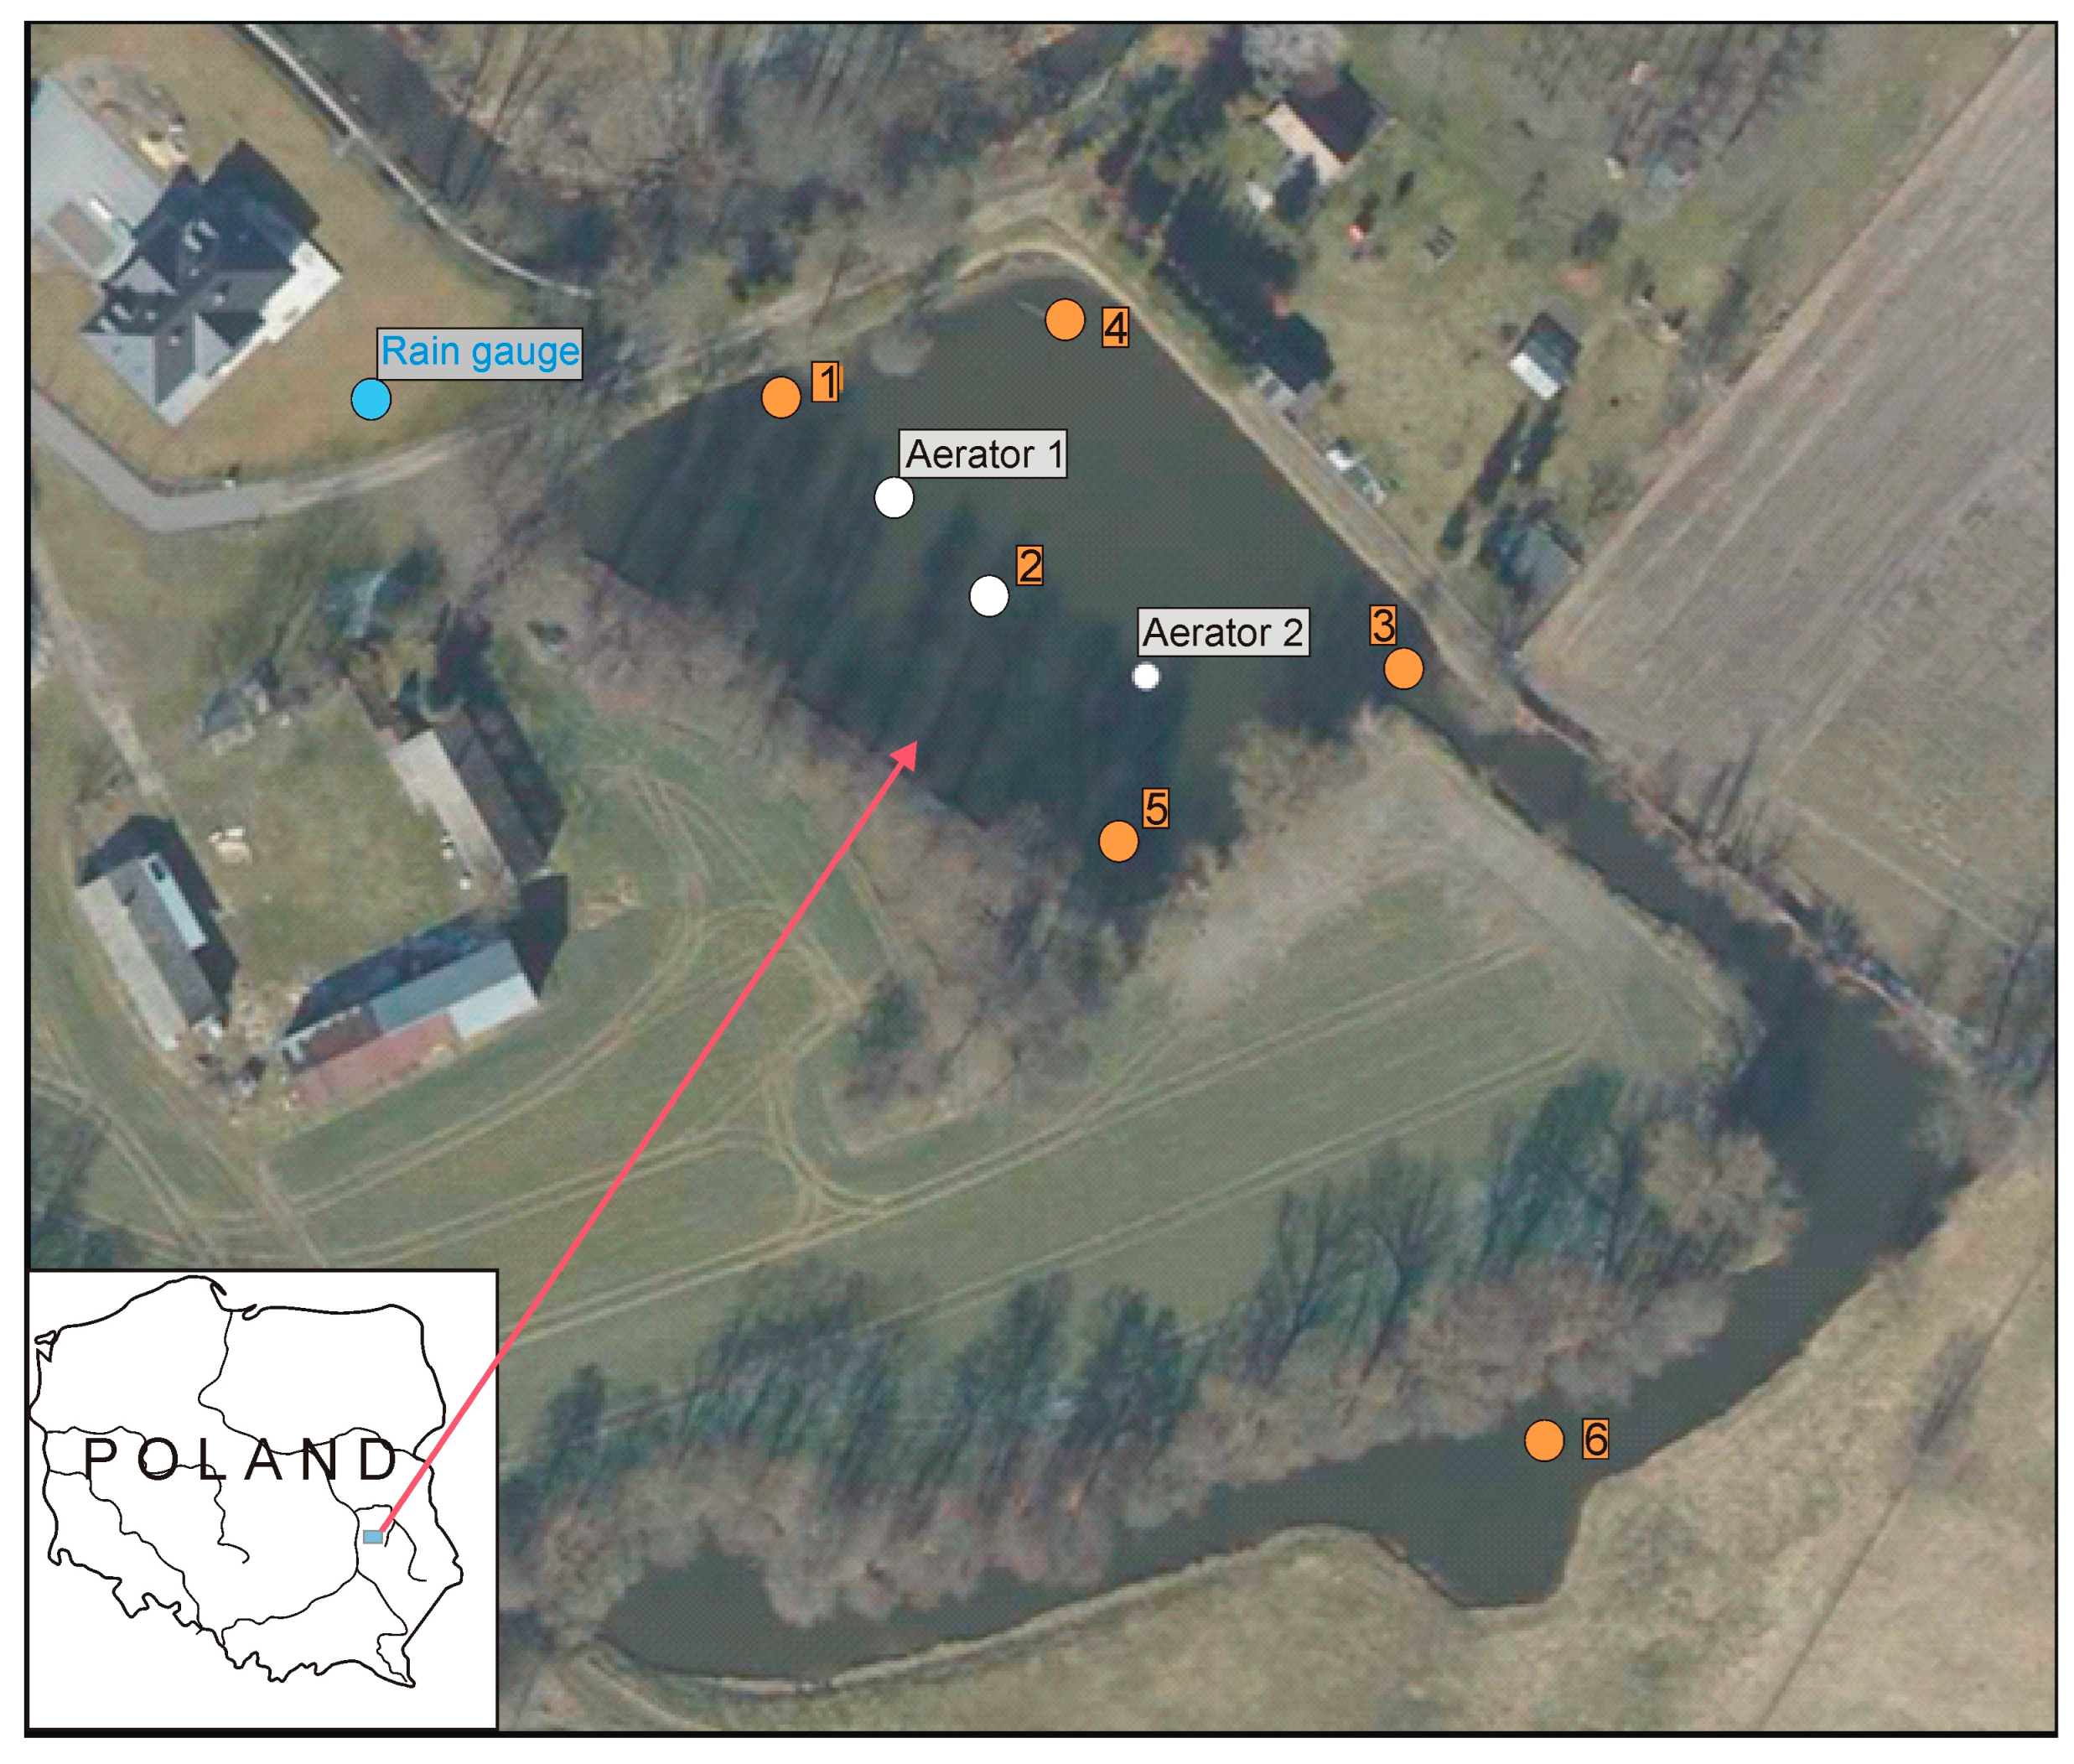
The study object was a pond in the municipality of Strzeszkowice Duże (N 51°8′54″; E 22°24′50″), in the central part of the Lublin Upland, Poland (Figure 2). The pond is located in an agricultural area (surrounded by fields and rural building developments) with a share of arable land exceeding 80%. The pond is a small artificial reservoir with a surface area of 0.45 ha, a flat bottom, a mean depth of 0.9 m, and a maximum depth 1.2 m which is phytoplankton-dominated and presents no macrophytes. It is supplied by groundwater and, laterally, by the Krężniczanka River. At the time of this study, the water inflow from the river to the pond was at a level of 0.007 m3/s, and the outflow from the pond was in the range of 0.003 m3/s to 0.008 m3/s. The volume of retained water was ~4000 m3, meaning that complete water exchange in the pond could occur within approximately one week. In the years preceding the installation of the aeration reactors, blooms of cyanobacteria (mainly Microcystis aeruginosa) had been observed in the pond during the summer months, most often in August.
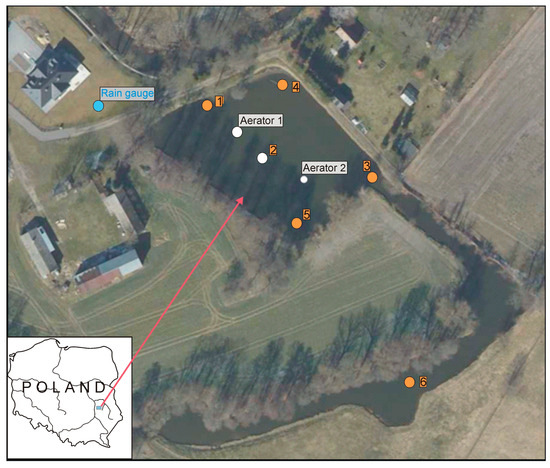
Figure 2.
Location of sample collection points (1–6) for the determination of physico-chemical properties (orange color), aerators (white color), and rain gauge (blue color).
2.3. Field Research
Research on the water quality of the pond and on the effectiveness of underwater aerating reactor implementation was conducted from February to October 2021. Two reactors were installed in the analyzed pond (Figure 2). The aerators functioned cyclically from February to October 2021, switching on twice during the day, 2 h in the morning and 2 h in the afternoon. In total, the aerators worked 4 h a day. The aerators were operated manually at fixed times. In the research period between February and the end of September, they were operated at a flow rate of 350 m3/h, whereas, from October, the efficiency was reduced to approximately 35 m3/h. The strategy of intermittent aeration (periods of aeration and non-aeration) instead of continuous operation of the aerators was aimed at reducing energy consumption costs while simultaneously maintaining good water quality.
Continuous monitoring was conducted at three designated locations in the pond: 1—inflow of waters to the pond from the Krężniczanka River, 2—central part of the water body between the aerators, 3—outflow from the pond (Figure 2). At these locations, multiparametric sondes were installed at a depth of about 0.3 m. The data recorded included the following water indices, hourly: temperature, reaction (pH), electrolytic conductivity (COND), turbidity (YSI 600XLM), and dissolved oxygen (Onset HOBO U26). Due to an equipment failure, no measurements were collected in the period from 19 April to 20 May 2021. Moreover, periodical (monthly) measurements were conducted at six locations designated within the area of the pond (Figure 2). The measurements included water temperature, pH, COND, and oxygen (sonde YSI 600XL). Turbidity, total chlorophyll a, and cyanobacterial chlorophyll a were also determined (sonde Algae Torch). The flow rate of the inflow to and outflow from the pond was measured using a Hega 2 type current meter.
Water samples for hydrochemical and quantitative and qualitative analyses of phytoplankton were collected monthly. The sampling of surface waters was conducted in accordance with [52,53]. Samples for analysis were collected from the subsurface layer, from a depth of approx. 0.3 m, at the following locations: the site of inflow to the pond (point No. 1), the middle of the pond (point No. 2), the site of outflow from the pond (point No. 3), the right-bank shore zone (point No. 4), the left-bank shore zone (point No. 5), and a neighboring pond considered to be the control (point No. 6). It is a reservoir of a similar nature, with no direct water supply from the Krężniczanka River and no installed reactor (Figure 2).
Phytoplankton determinations were based on both non-concentrated samples (quantitative analyses) and those pre-concentrated from a volume of 50 L on a plankton mesh (20 µm, qualitative analyses). The samples were preserved by means of Lugol’s iodine (Chempur, 10%). All the collected water samples were transported to the laboratory in a thermal box at a temperature of 4 °C, with no exposure to solar radiation.
In addition to hydrochemical analyses in the vicinity of the pond (N 51°8′54.902″; E 22°24′47.138″) (Figure 2), meteorological measurements were conducted, i.e., air temperature and precipitation (Vaisala Rain Gauge RG13), as well as measurements of the flow rate at the sites of inflow to and outflow from the pond. Descriptions of results and data are presented in the Supplementary Materials (SM) (Figure S1).
2.4. Laboratory Analyses and Calculations
The laboratory analyses concerned the determination of the content of anions and cations by means of an ion chromatograph by Metrohm (model MIC-3). The determination of anions (Cl−, NO2−, NO3−, SO42−) employed the Metrosep A SUPP5 250 column, while the determination of cations (Na+, NH4+, K+, Ca2+, Mg2+) employed the Metrosep C2 150 column. The following parameters were also determined in the water samples: total nitrogen (TN), total phosphorus (TP), and their mineral dissolved forms (NH4+, NO3−, NO2−, PO43−), biological oxygen demand (BOD5), chemical oxygen demand (CODCr), and total organic carbon (TOC). Detailed information regarding the scope of the performed laboratory analyses as well as the methodology is presented in SI—Table S1.
The trophic status of the analyzed waters was calculated using the Trophic State Index (TSI) [54,55]. It was calculated as the average value of four values, namely the concentration of total phosphorus TSITP = 14 ln (TP) + 4.15, chlorophyll a TSICHL = 9.81 ln (CHLa) + 30.6, Secchi visibility TSISD = 60–14.41 LN(SD), and total nitrogen TSITN = 14.43 ln (TN) + 54.45.
The abundance and biomass of phytoplankton were determined by means of an inverted microscope (Microscope Olympus CKX53 with EP50 camera Olympus, Tokyo, Japan), in accordance with the guidelines for conducting field and laboratory research on lake phytoplankton [56].
Based on measurements of flow rate and nutrient content at measurement location No. 1, calculations of the mineral load of N and P supplied to the pond by waters of the Krężniczanka River were also conducted. The assessment of the possibility of internal nutrient supply in the pond was based on a leachability test using surface sediments sampled from the pond and leaves fallen onto the water surface. The conditions for conducting the experiment entailed the preparation of a solution in proportions of 1:10 (sediment/leaves:water) and its extraction using an orbital shaker during 24 h. Bottom sediment samples were collected once (in May) into polycarbonate pipes from five locations in the pond. The top 10 cm layer of bottom sediments was collected for laboratory analyses. Sediment samples were air-dried and, then, they were sieved through a sieve with a mesh size of 2 mm, mixed, and ground in an agate mortar. In the case of tree leaves, samples taken from the reservoir surface (in October) were dried and then ground. From the material prepared in this way, 100 g of bottom sediments and tree leaves were used for the leaching test.
Significance of the differences between the means of the pond samples was determined using a one-way analysis of variance and a Duncan’s post hoc test (with the significance level set to α = 0.05). The results were analyzed using STATISTICA version 13.3.
3. Results and Discussion
3.1. Physico-Chemical Water Properties: Continuous Monitoring
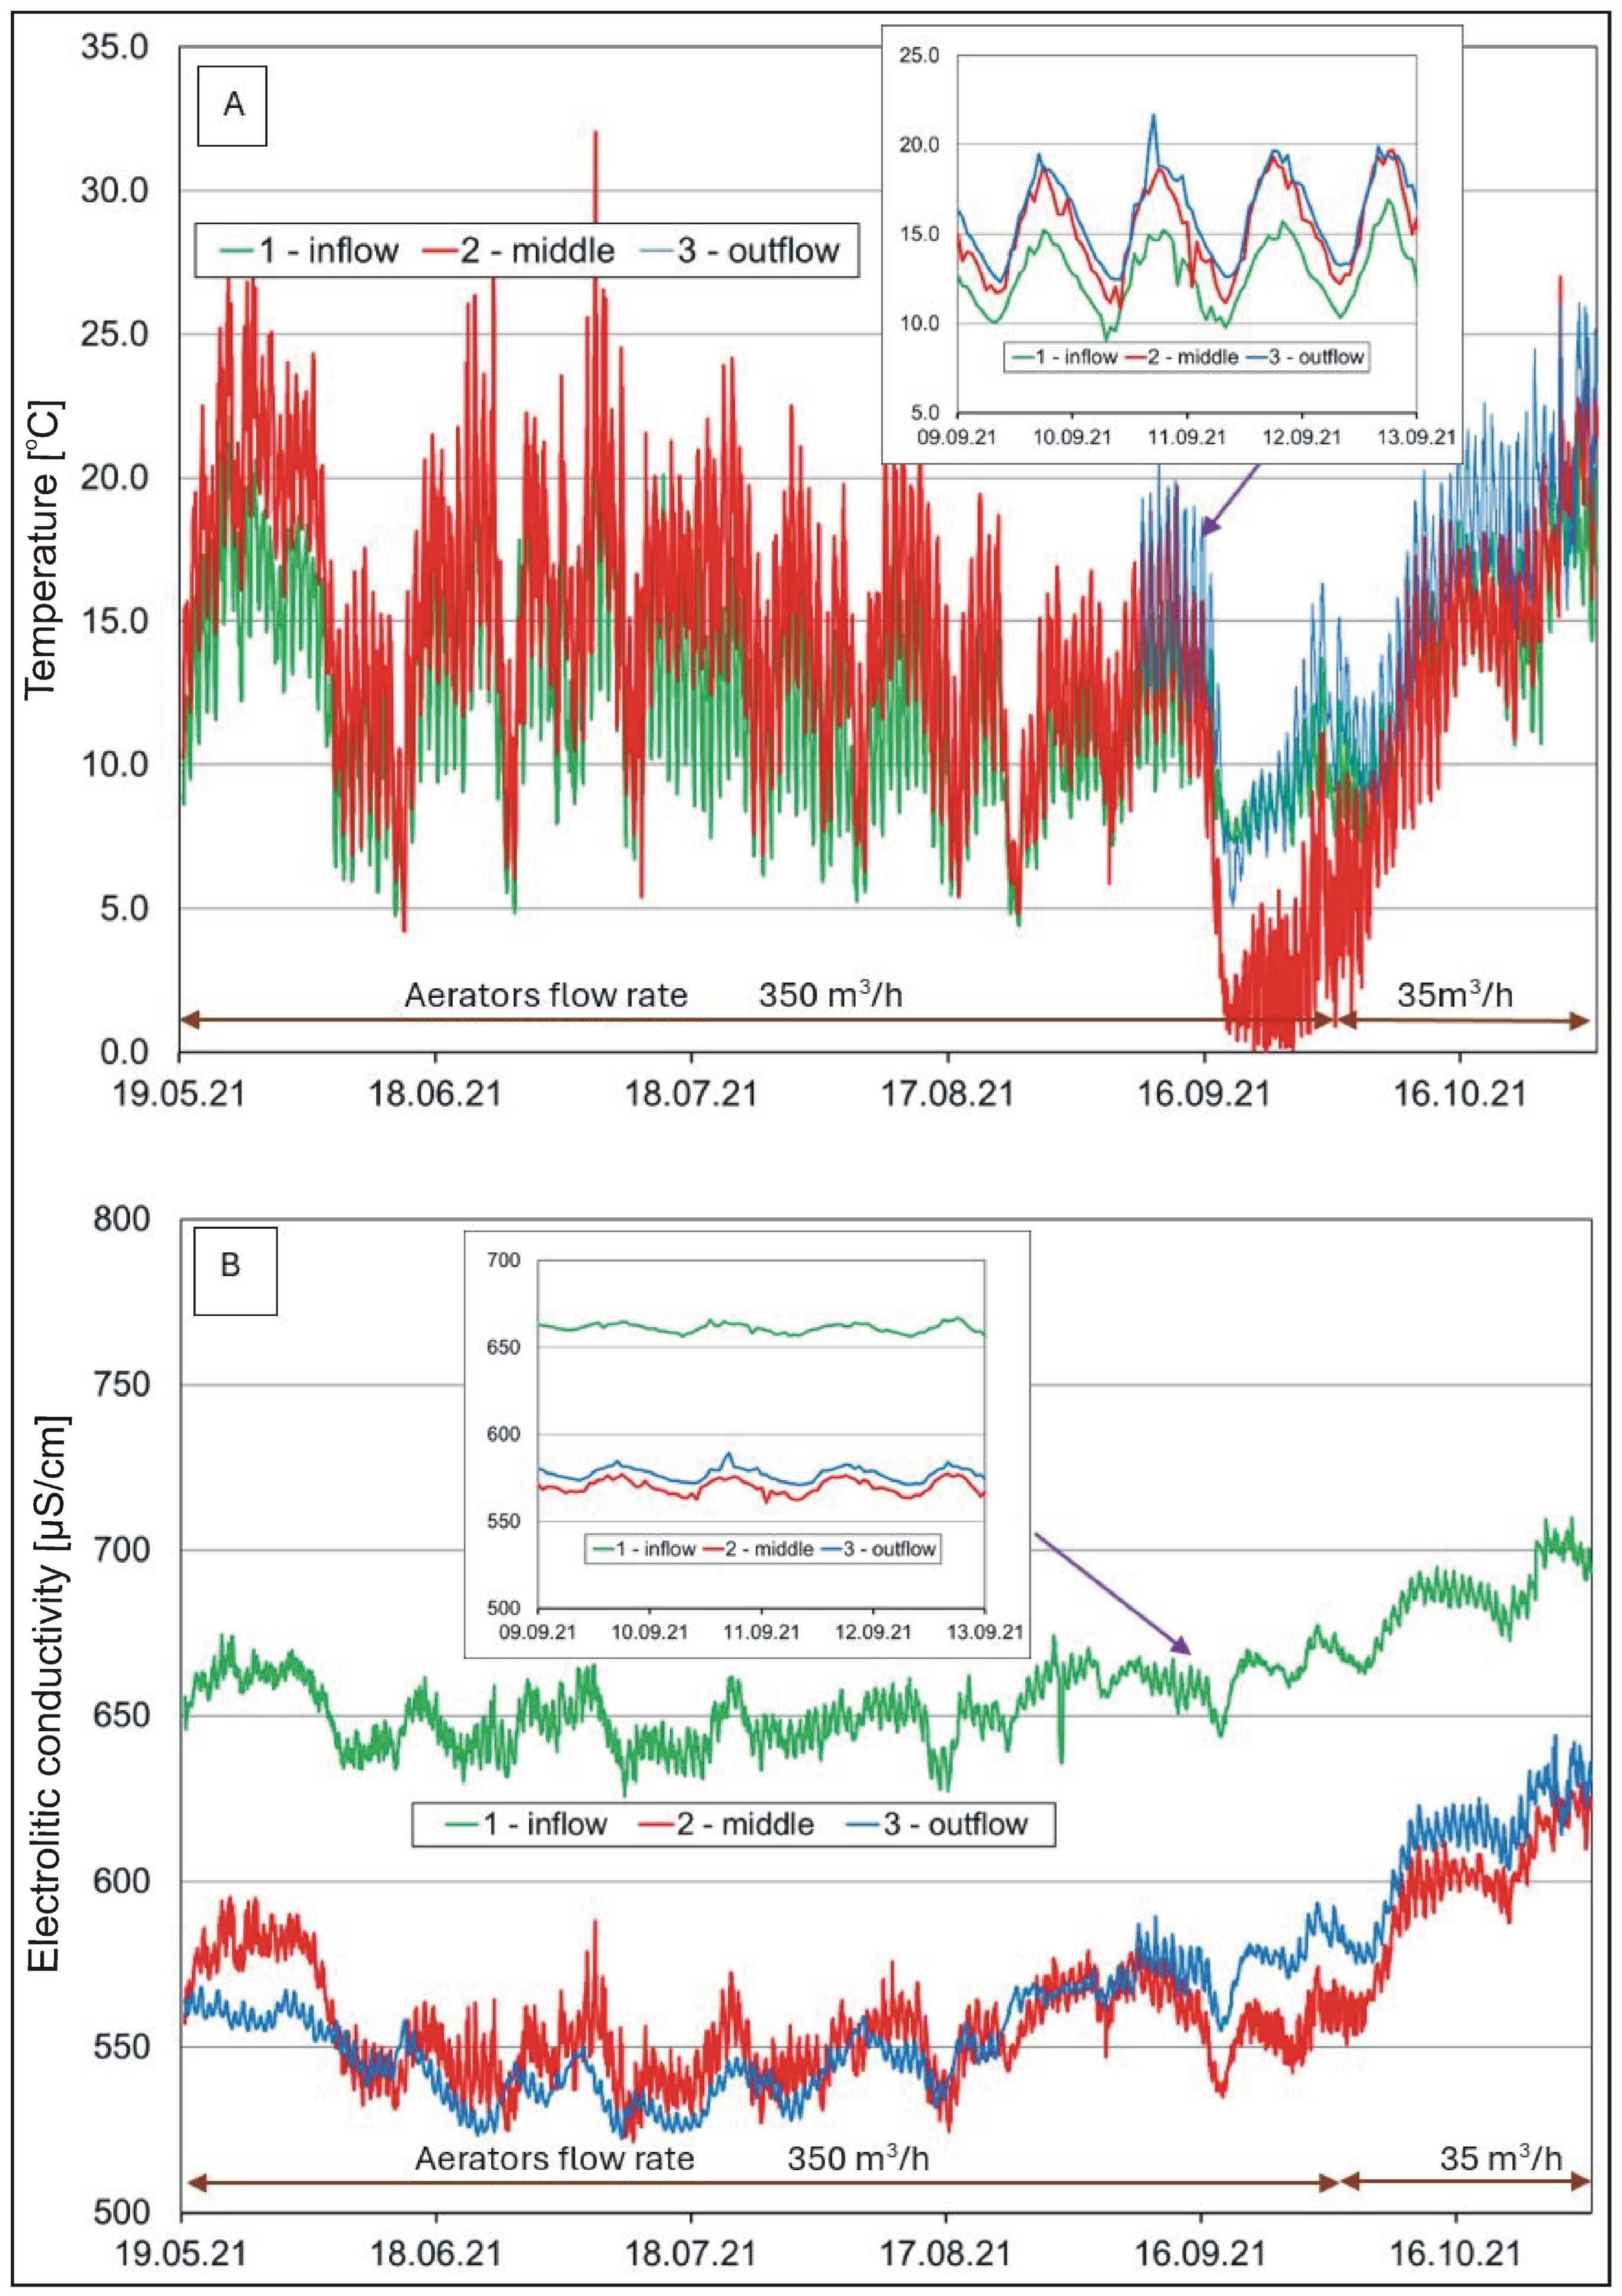
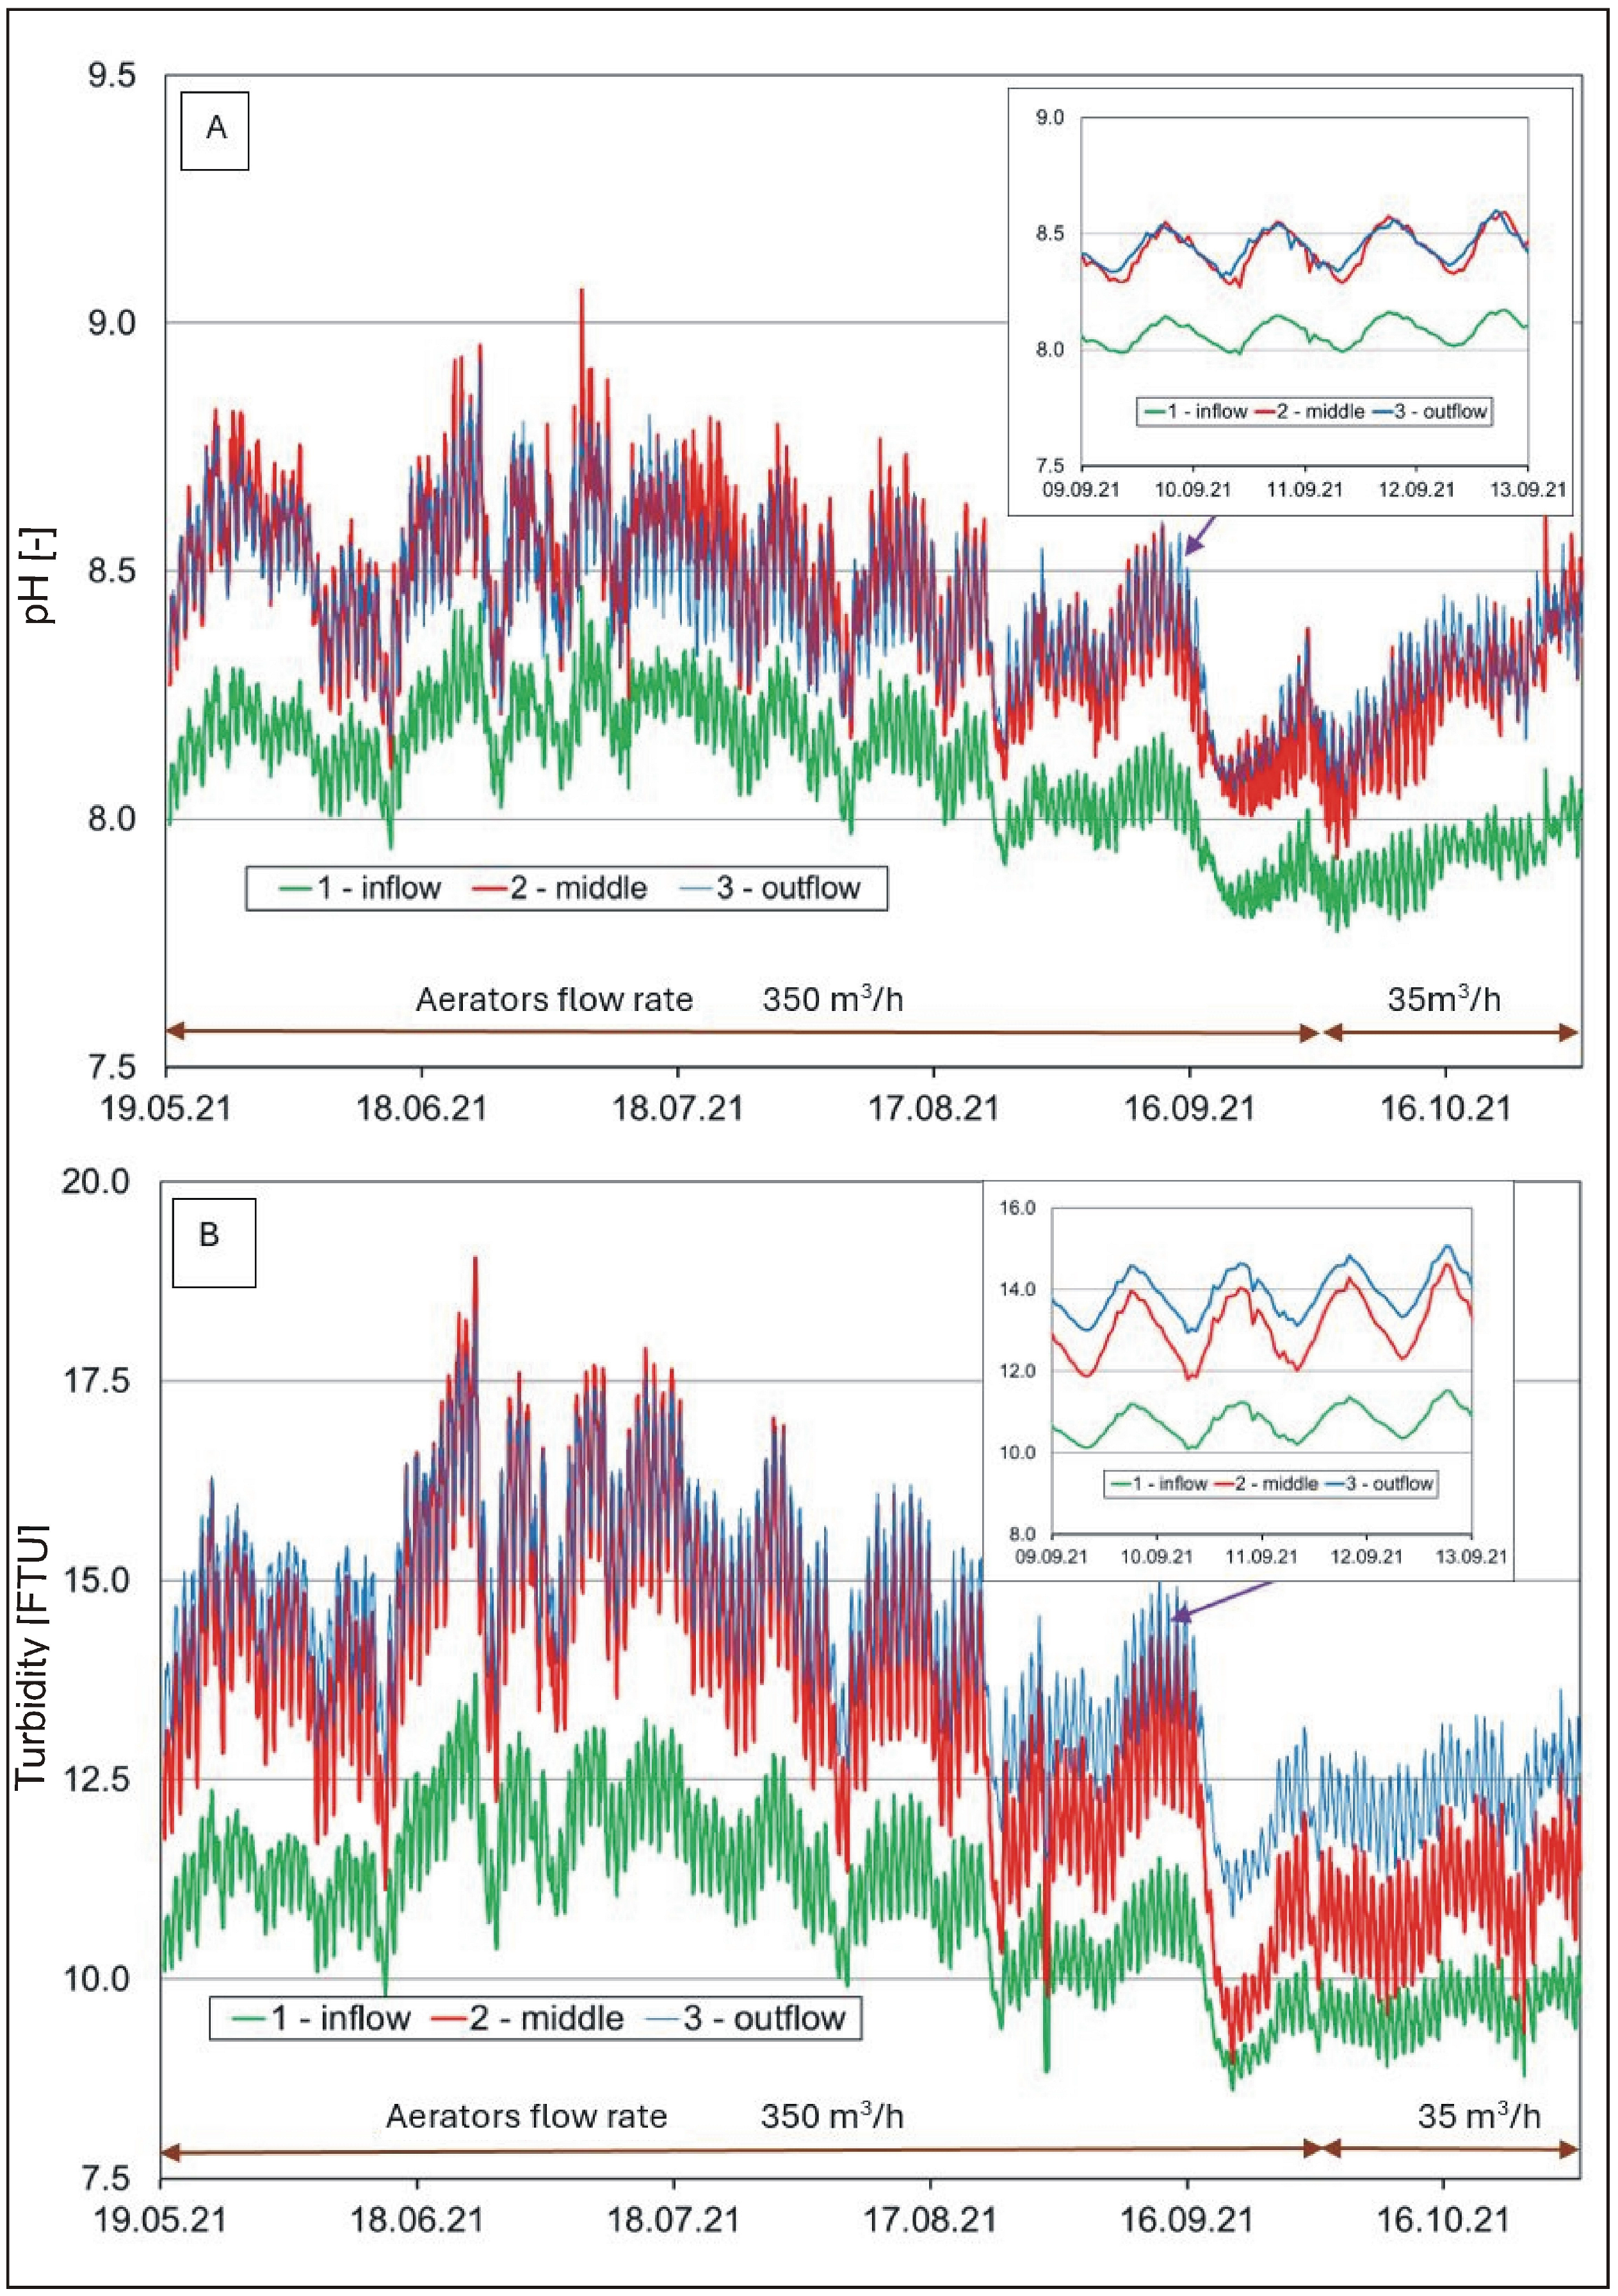
The results of continuous monitoring regarding the selected physico-chemical water properties in the analyzed pond are presented in Figure 3, Figure 4 and Figure 5 and in Table S2.
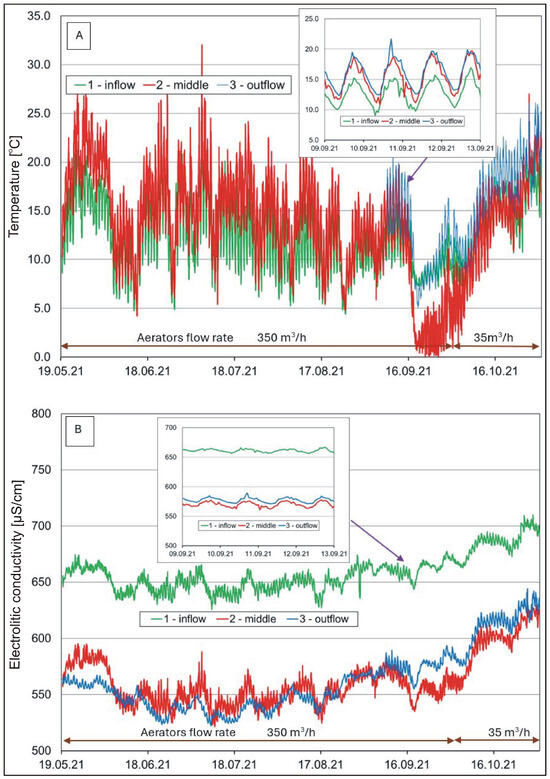
Figure 3.
Hourly changes in (A) water temperature and (B) electrolytic conductivity in the pond.
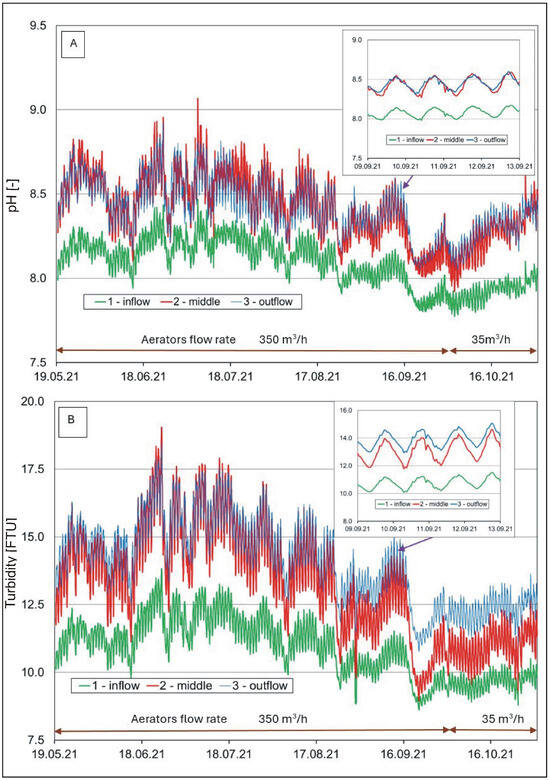
Figure 4.
Hourly changes in (A) water reaction and (B) water turbidity in the pond.
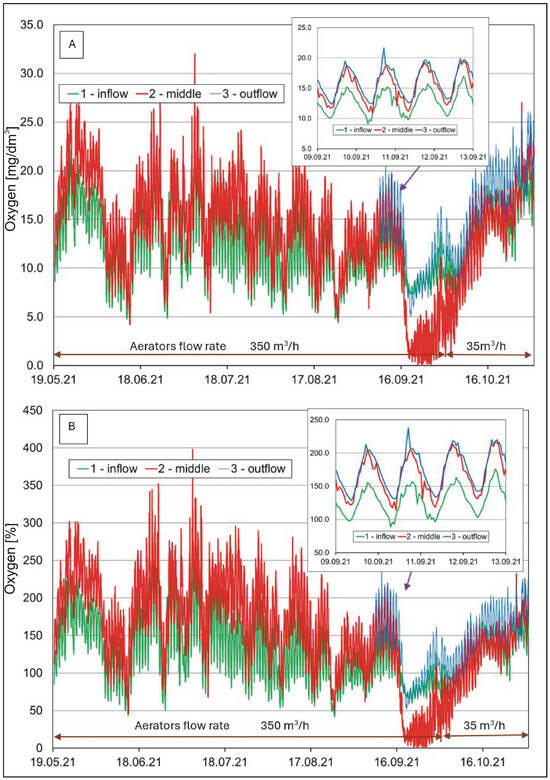
Figure 5.
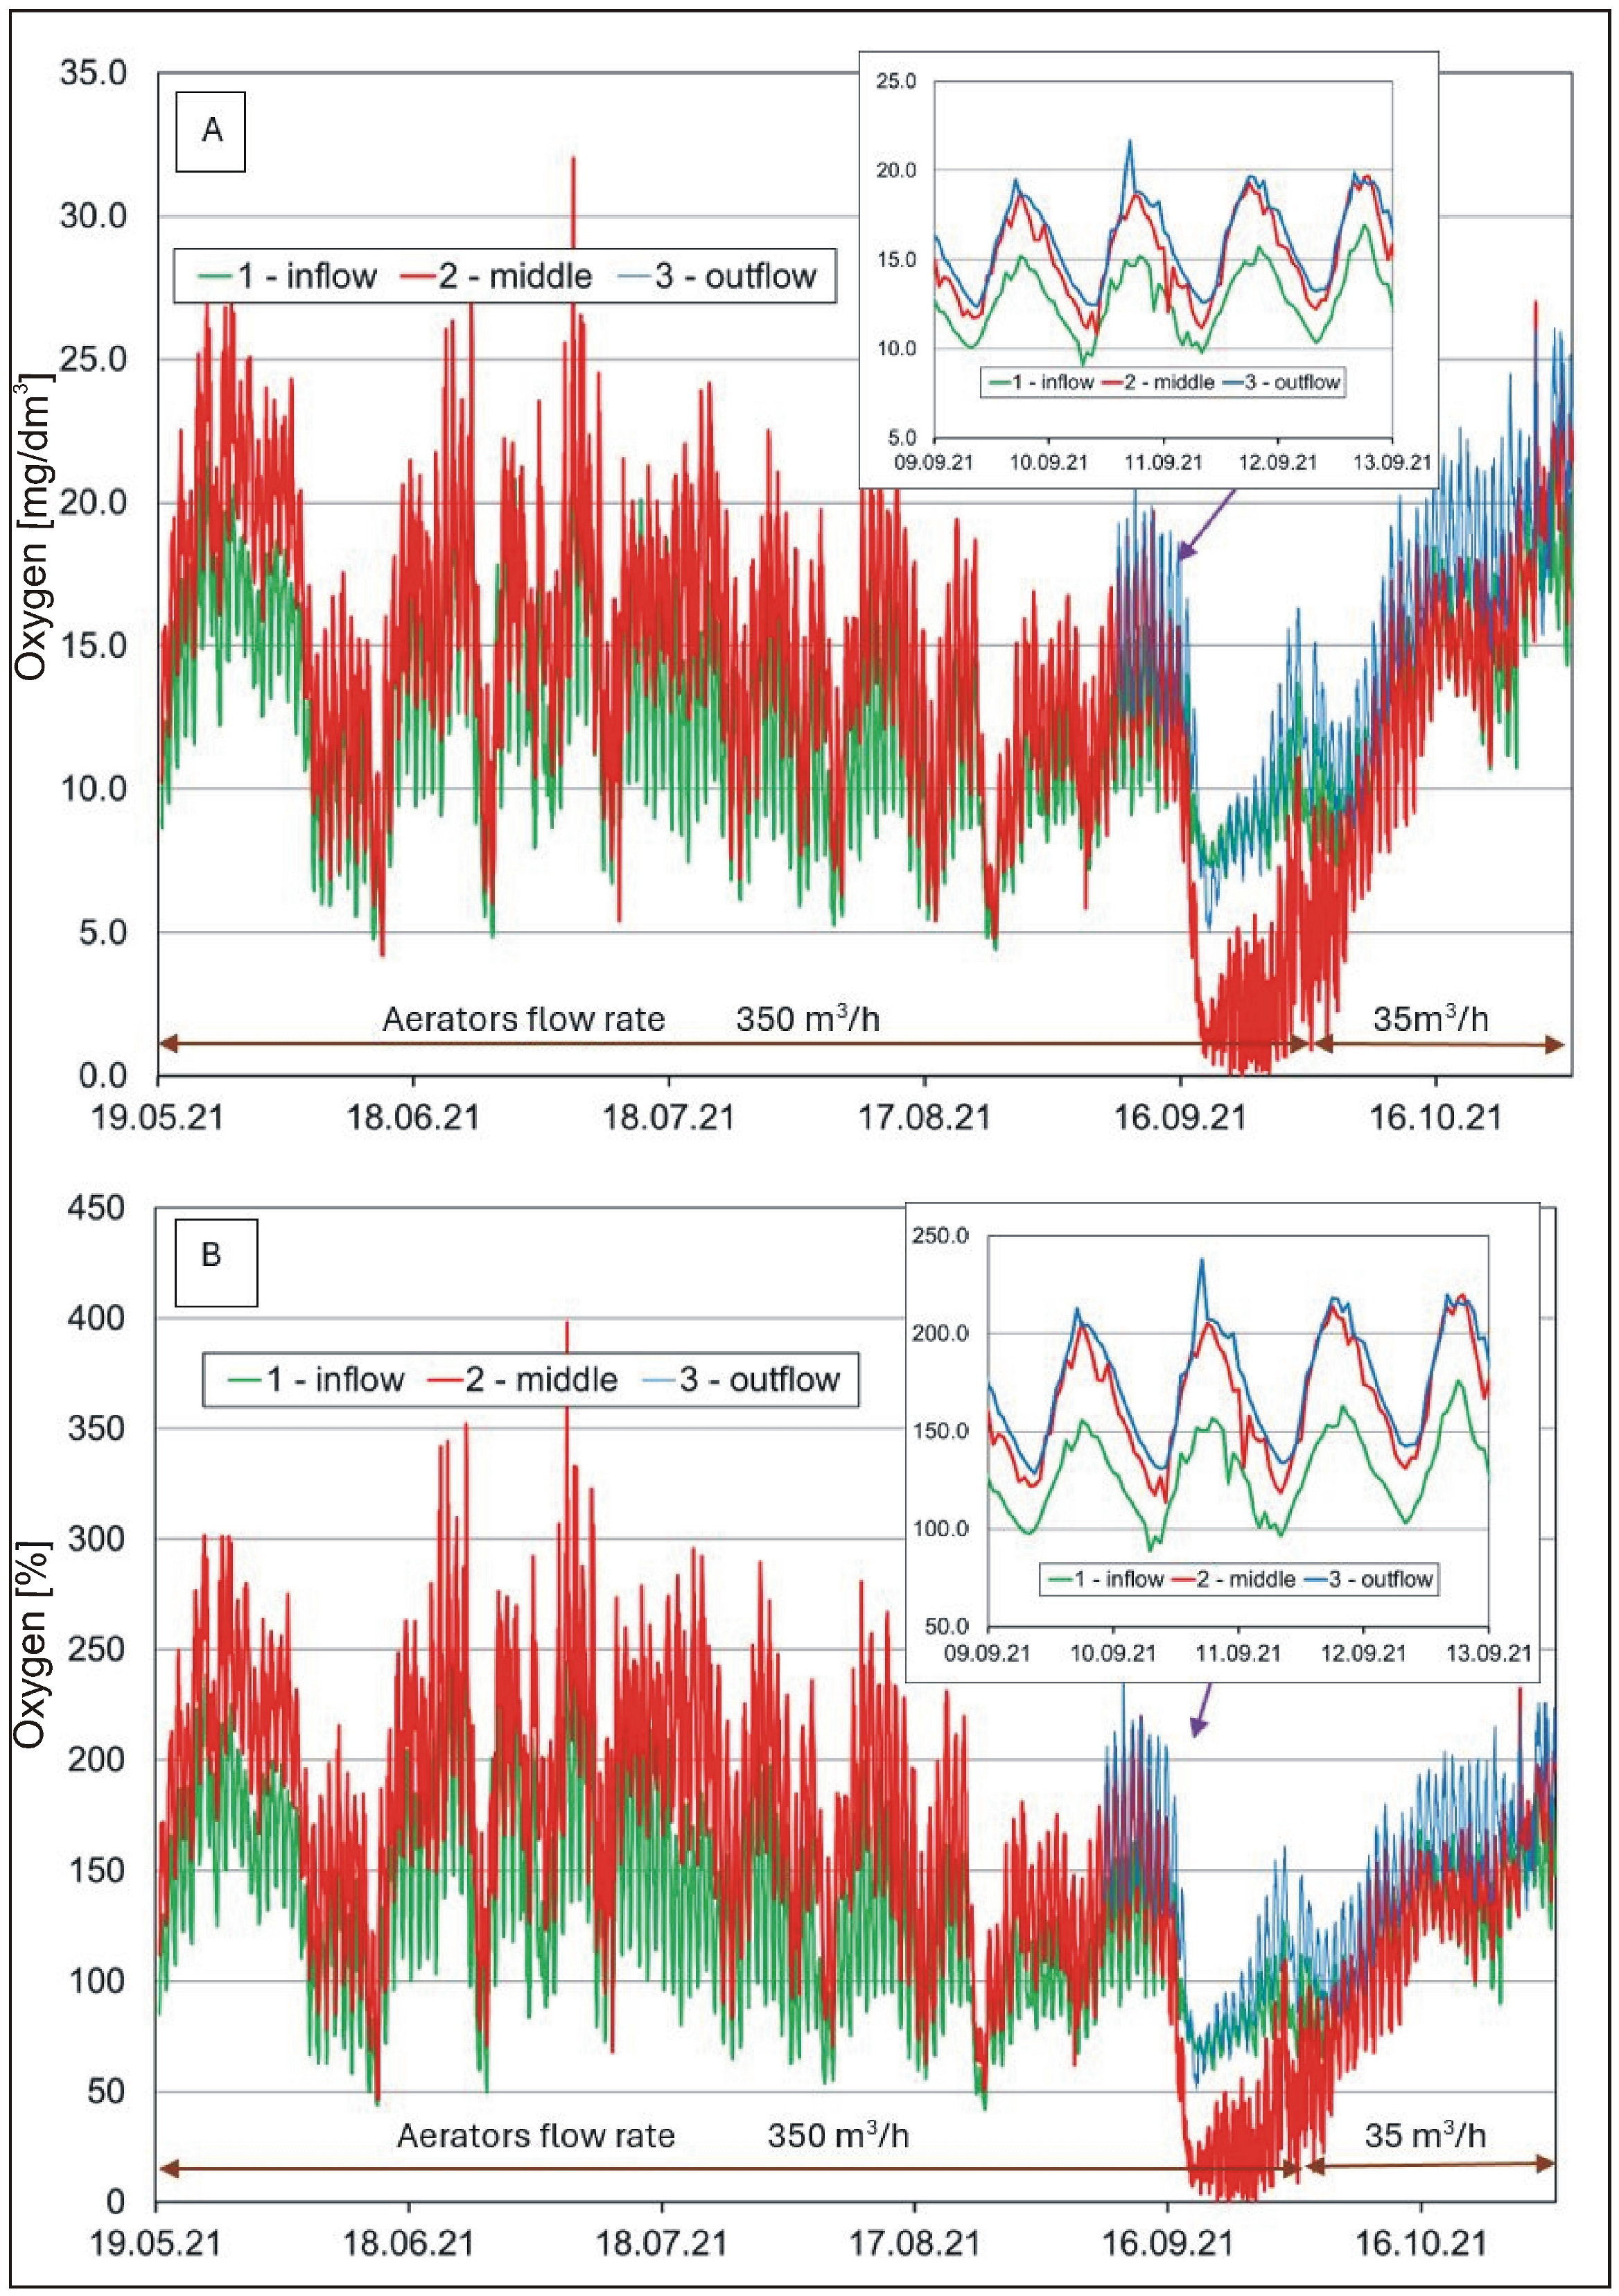
Hourly oxygen concentrations (A) and saturation (B) in the water of the pond.
Measurements of water temperature (Figure 3A) at the analyzed locations showed seasonal changes typical of the temperate climatic zone [57]. The lowest temperatures were recorded in winter (<5 °C) and the highest in summer (>15 °C). In winter, the temperature in the pond was lower than in the river, while, in the summer, the situation reversed. Temperature differences reached several degrees Celsius. Daily fluctuations in water temperature were greater in the water supplied to the pond than in the water in the pond.
In the case of electrolytic conductivity (COND), the highest values were determined in winter (>680 μS/cm), both in the river and in the pond (Table 1). At that time, the river and pond were supplied with groundwater characterized by a relatively high content of dissolved compounds, especially bicarbonates. Considerably lower values were observed in the period of surface overflow and after rainfall (<600 μS/cm). During phytoplankton development, the water in the pond showed values that were lower by almost 100 μS/cm in comparison to the waters of the Krężniczanka River (Figure 3B). This phenomenon was associated with a lower content of minerals, especially bicarbonate ions and calcium (Table 1) at these time points. This decrease may be associated with the use of carbonate minerals in the life processes of aquatic organisms and/or their partial accumulation in sediments.

Table 1.
Characteristic values of physico-chemical water properties determined in a monthly cycle (minimum-maximum/average).
The reaction of the analyzed waters (Figure 4A) was within a range from neutral to weakly alkaline (from 7.1 to 9.1). It was usually lower in the river than in the pond. Water reaction fluctuations showed a seasonal and diurnal cycle. At lower water temperatures, the reaction usually decreased, while it increased at higher temperatures. Higher values were also recorded in afternoon hours. In the growing period, it was usually high (>8 pH), suggesting intensive development of phytoplankton that uses carbon dioxide in the process of photosynthesis [58,59]. A similar situation occurred with respect to turbidity (Figure 4B). High turbidity values in the pond water were recorded in the period of intensive development of phytoplankton (>13 NTU) and water supply from the Krężniczanka River, in the snowmelt period, and after downpours, usually >15 NTU.
The content of dissolved oxygen (Figure 5A,B) in the waters pointed to a relatively high amplitude of seasonal and diurnal changes. The lowest values were recorded in the cold period, and high values were recorded in the summer. In the case of diurnal changes, the highest values occurred in the afternoon/evening, and the lowest occurred in the morning. The amplitude of changes reached up to a dozen mg O2/L and more than 100% in the case of oxygen saturation. Such changes are typical of water bodies with eutrophic and hypertrophic waters experiencing an intensive photosynthetic process [60]. Measurement results showed no occurrence of oxygen deficits by night/in the morning, although the processes of photosynthesis did not occur at the time. It was a positive effect of water aeration by aerators [39,61]. Their operation prevented the occurrence of night-time oxygen deficits in the water. The effectiveness of aeration by means of aerators was also evident in the results from August and September, where the lack of one of the two aerators (failure of reactor No. 2 from 15 to 30 September) was evidently marked by a decrease in oxygen concentration at the measurement location No. 2. During the monthly phytoplankton measurement cycle, no changes related to the reactor failure were observed. In the growing period, the water in the pond usually showed a higher content of dissolved oxygen than the water at the inflow site, a phenomenon which was due to the intensive production of phytoplankton.
A one-way ANOVA analysis to investigate the differences between the means (calculates the F statistic, which is the ratio of between-group variability to within-group variability) showed that the mean water temperature was significantly lower (F(2.17631) = 222.42, p < 0.001, ηp2 = 0.025) and COND significantly higher (F(2.17631) = 1712.06, p < 0.001, ηp2 = 0.163) at location 1 (inflow) than at locations 2 (middle) and 3 (outflow). However, in the case of water pH (F(2.15808) = 4392.62, p < 0.001, ηp2 = 0.357) and oxygen (F(2.9474) = 216.20, p < 0.001, ηp2 = 0.044), the differences between the means were significant for locations 2 and 3 in relation to location 1. Similar relationships were found with respect to turbidity (F(2.17631) = 102.15, p < 0.001, ηp2 = 0.011).
3.2. Monthly Changes in Physico-Chemical Water Properties
The study involved the analysis of seasonal changes in and spatial variability of the studied hydrochemical and biological indices in the water of the pond and the inflowing Krężniczanka River. Characteristic values of physico-chemical water properties in a monthly cycle (minimum-maximum/average) are presented in the collective table (Table 1), and the correlations (Pearson’s coefficient) between the studied indicators are presented in Table S4.
In hydrochemical terms, the analyzed water samples showed dominance of HCO3− and Ca2+ ions. Their concentration in the pond during the growing season decreased by about 40 mgCaCO3/dm3 in relation to the river water. The increase in biomass in the pond resulted in the depletion of carbon dioxide resources dissolved in the water, used in the photosynthesis process. As a result, there was an increase in the pH of the water and its oxygenation.
The concentration of dissolved oxygen and pH exhibited a trend similar to that presented in the hourly research (Table 1 and Table S2). The main sources of dissolved oxygen in the pond are its diffusion from the atmosphere and photosynthesis. As a result of photosynthesis, the level of water oxygen saturation changes throughout the day and is highest in the afternoon, when the measurements were taken. Algae, as photosynthetically active species, can be the dominant source of oxygen in water bodies and account for “percentage saturation” values up to 500% [62]. This has been confirmed by research conducted in Poland [63], in which values close to 200% saturation were recorded. COND was at a level of 550–680 µS/cm, and the pH varied from approximately 7 to almost 9. Moreover, increasing the number of measurement points in the water body permitted a more accurate analysis of the spatial variability of oxygen saturation in the water. Higher values at location No. 2 (between the aerators) stood out among the measurements from the remaining sampling locations (Figure 2, Table 1). This suggests a direct, positive contribution from the applied aerators to water oxygenation [39].
In hydrochemical research, particular attention has been paid to nutrient indices (nitrogen and phosphorus) and the related water trophic status (Table 1). Mineral nitrogen in the inflow to the pond constituted approximately ¾ of total nitrogen. The mean concentration of mineral forms of nitrogen was at a level of 1.36 mg N-NO3−/dm3, the ammonium nitrogen concentration was 0.21 mg N-NH4+/dm3, and the nitrite nitrogen concentration was 0.05 mg N-NO2−/dm3. In February–May and September–October, the content of mineral nitrogen at the inflow site was in the range of 3–5 mg/dm3, while from June to August it did not exceed 1 mg/dm3. The decrease in the content of mineral forms of nitrogen in the tributary in the months of May–July was caused by the development of macrophytes and phytoplankton in the river. Similar relationships are quite commonly observed in agricultural catchments [64,65]. In the water of the pond, under the conditions of abundant phytoplankton development, mineral forms of nitrogen occurred at a very low level, even below 0.1 mg Nmin/dm3. The restriction to phytoplankton development because of mineral nitrogen has been confirmed by Czech research [66].
In the case of mineral phosphorus, its share in the pool of total phosphorus was usually lower than that of nitrogen, falling below 50%. In the summer period, both in the river and in the pond, the concentration of mineral phosphorus was below 0.05 mg/dm3. The content of nitrogen and phosphorus in the studied waters and the distribution of their forms in the inflow and in the pond (Table 1) pointed to an intensive increase in primary production, consequently leading to a decrease in water quality. The threshold concentration of mineral nitrogen (Nm) and phosphorus (Pm) causing intensive phytoplankton development has been estimated, in some cases, at 0.3 mg Nm/dm3 and 0.03 mg Pm/dm3, respectively [67].
The obtained study results showed no direct effect of the reactors on the content of nutrients in water (particularly mineral forms of nitrogen and phosphorus), although it has been reported in other studies [29,39]. At location No. 2, between the reactors, no differences were found in the concentration of the analyzed indices, considering the remaining sampling locations in the pond and the neighboring pond (location No. 6). No reduction of nutrients in waters flowing through the reactor, sampled directly after its passing, was recorded either.
Chlorophyll a showed a high concentration in the studied waters (Table 1). An increase in its concentration was recorded in the pond already in April, and its content in the pond was higher than that in the waters of the Krężniczanka River. At the beginning of the measurement (cold) period, the concentration of chlorophyll a did not exceed several µg/dm3, and, in the summer, its concentration was higher than 200 µg/dm3. A high content of chlorophyll in the pond waters caused low water transparency, usually not exceeding 0.5 m (Table 1). An increase in chlorophyll and a decrease in water transparency have also been reported during the surface aeration of ponds in China [39]. In the case of cyanobacterial chlorophyll a (Table 1), its absence or low concentration (<10 µg/dm3) was recorded from February to July. Its highest concentration was observed in August (up to a dozen µg/dm3). In the autumn months, the value decreased to a level of several µg/dm3.
A one-way ANOVA analysis of the significance of the differences between the mean values of the studied indicators showed that the COND values were significantly higher (F(5.90) = 7.06, p < 0.001, ηp2 = 0.282) and the pH significantly lower (F(5.90)) = 3.16, p = 0.11, ηp2 = 0.149) at location 1 (inlet to the pond from the river) than at the other measurement locations. In the case of oxygen, it was shown that the values at locations 4 (left edge of the pond) and 2 (middle of the pond) were significantly higher (F(5.90) = 114.81, p = 0.011, ηp2 = 0.150 and (F(5.90) = 319, p = 0.011, ηp2 = 0.150, respectively) than at locations 1 (entry into the pond from the river) and 6 (neighboring pond). There were no significant (p > 0.05) differences among the measurement locations for the other studied indicators.
3.3. Monthly Changes in Phytoplankton
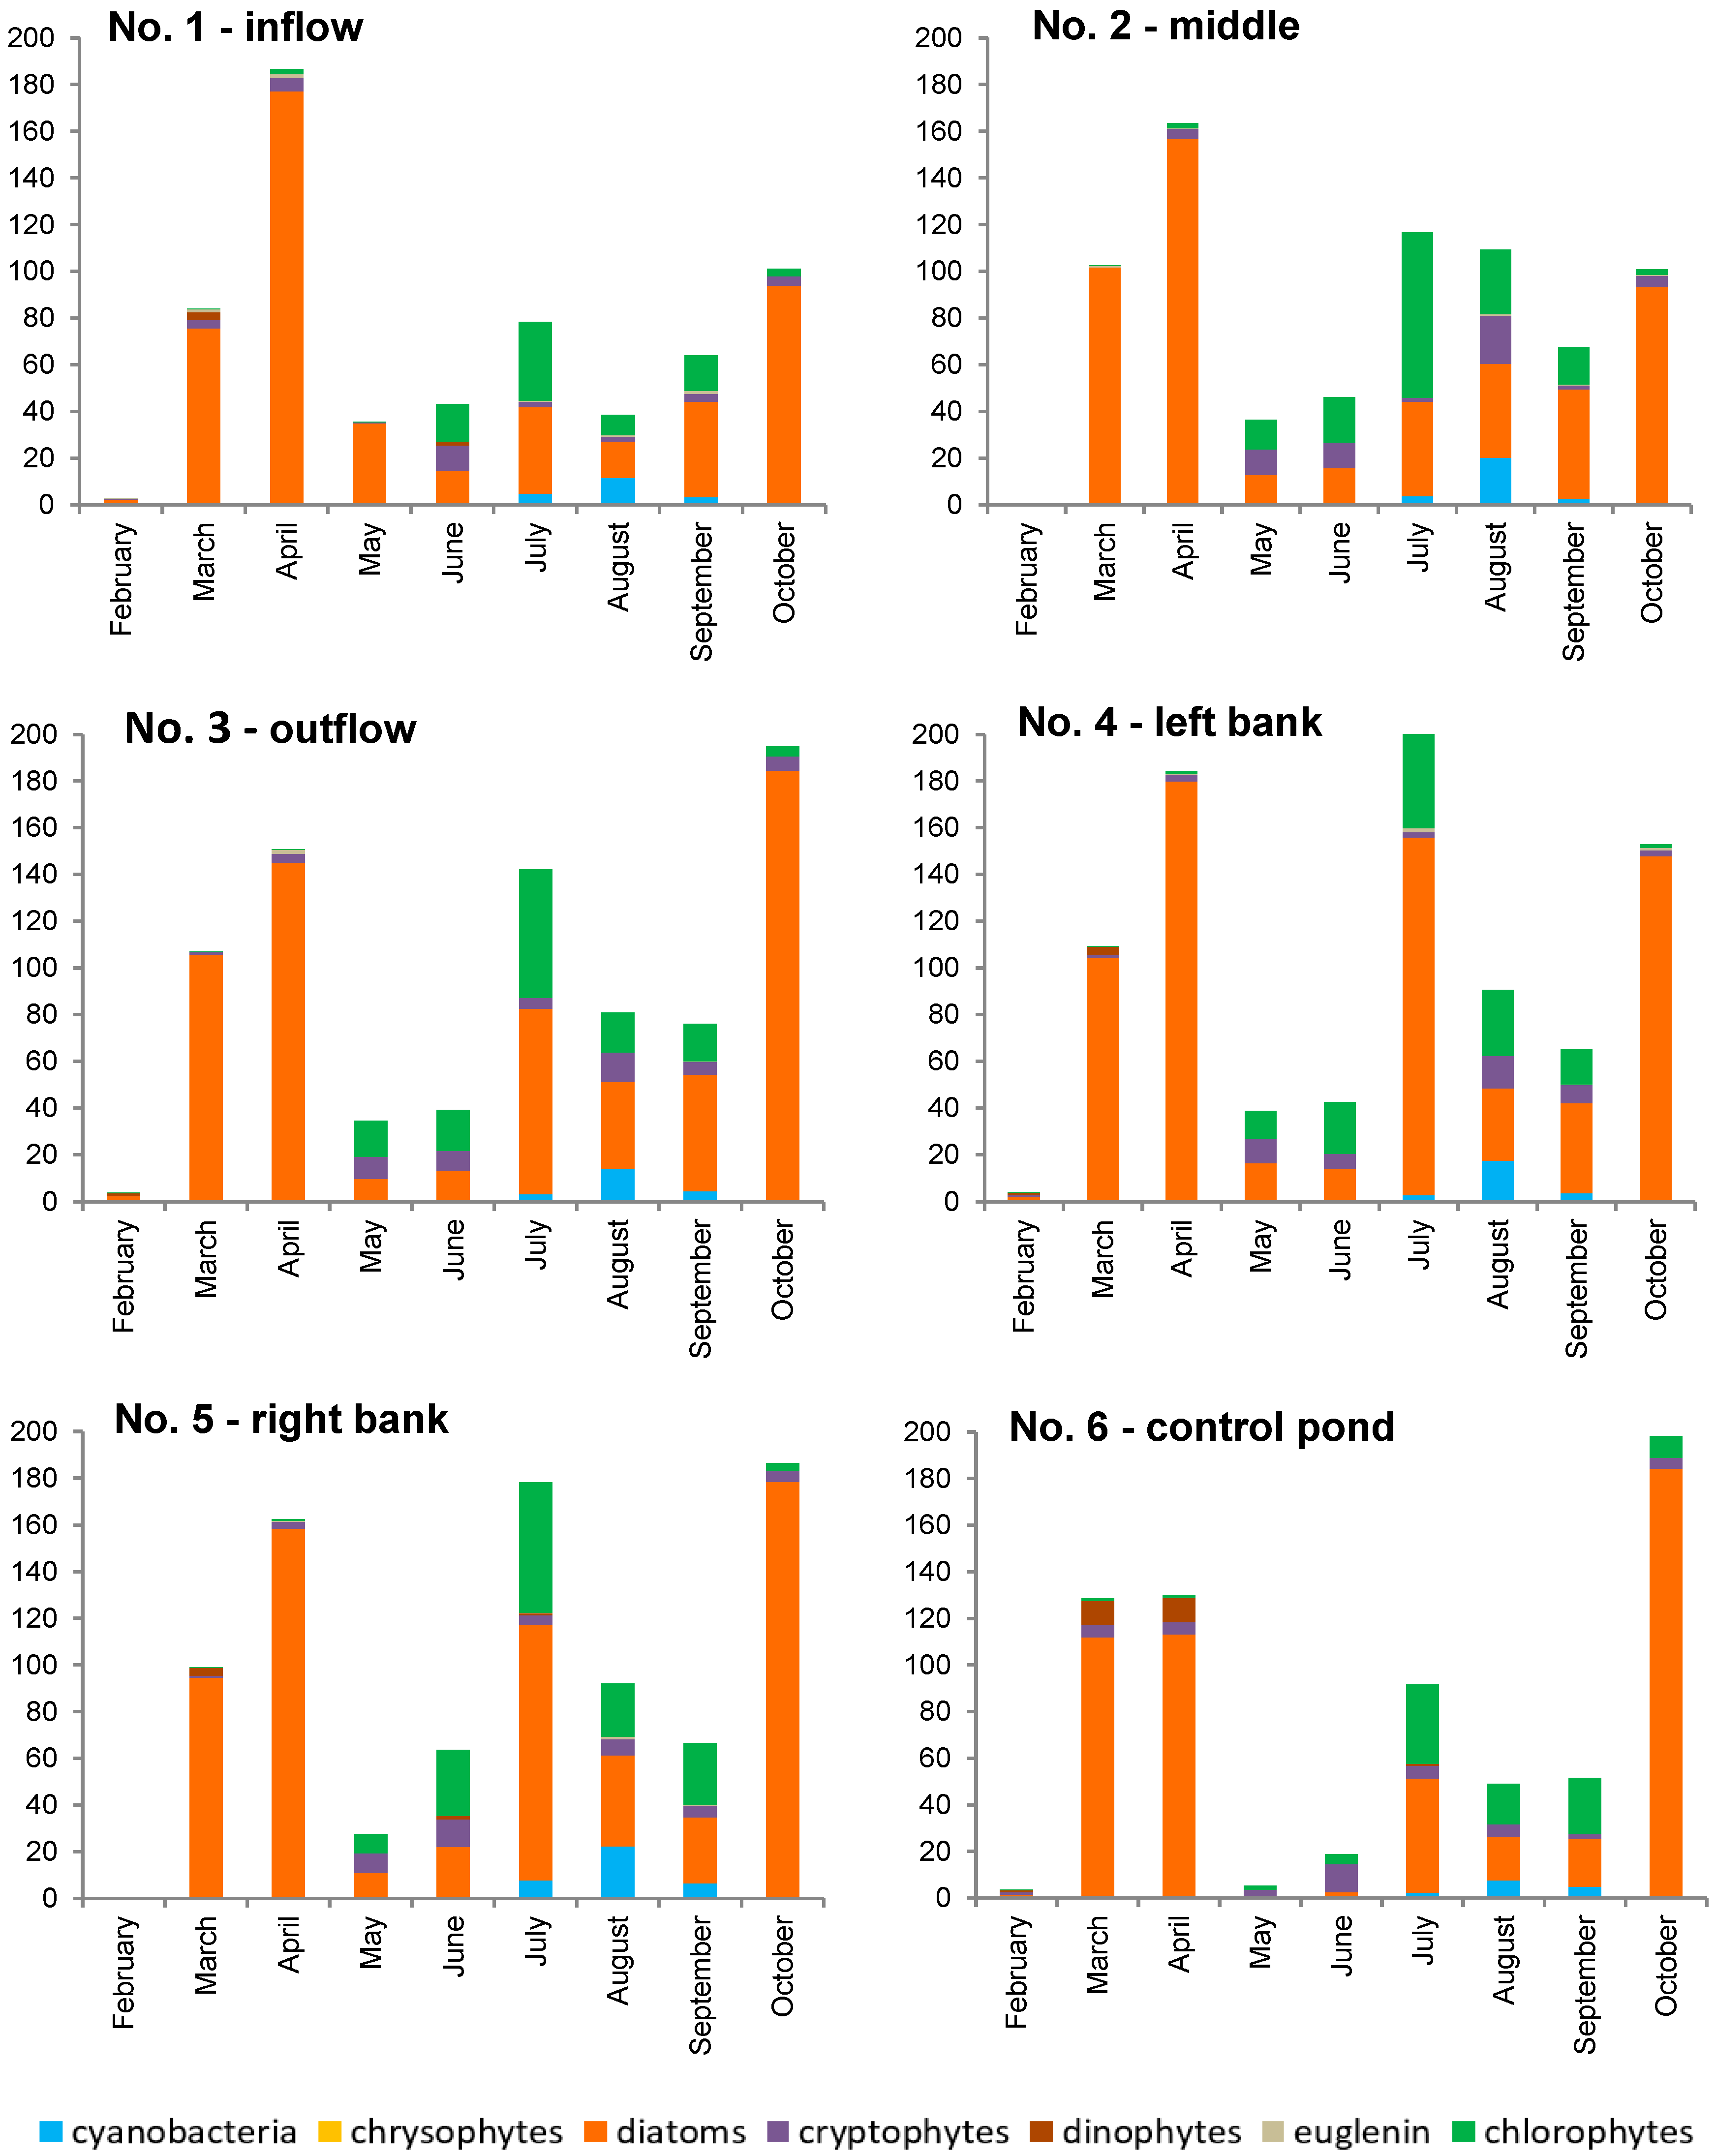
In the collected material, about 50 species were identified, with the greatest species diversity found in chlorophytes in the summer (up to 21 species in the sample) and diatoms in spring (up to 11 species in the sample). Seasonal changes in phytoplankton were characterized by two maxima of abundance and biomass (spring and early autumn). High phytoplankton biomass correlating with high abundance occurred in March, April, and October (Figure 6 and Figure S2). Moreover, in July, an increase in biomass was observed as a result of the development of high-volume phytoplankton organisms (some species of chlorophytes and diatoms). In the middle of the pond (location 2, aerator), it was during the summer (July-August), and not during autumn months, that the second maximum of abundance and biomass was recorded. It has been reported in other studies [39,44] that the aerator can successfully eliminate the cyanobacterial blooms, while slightly increasing the phytoplankton biomass at the same time.
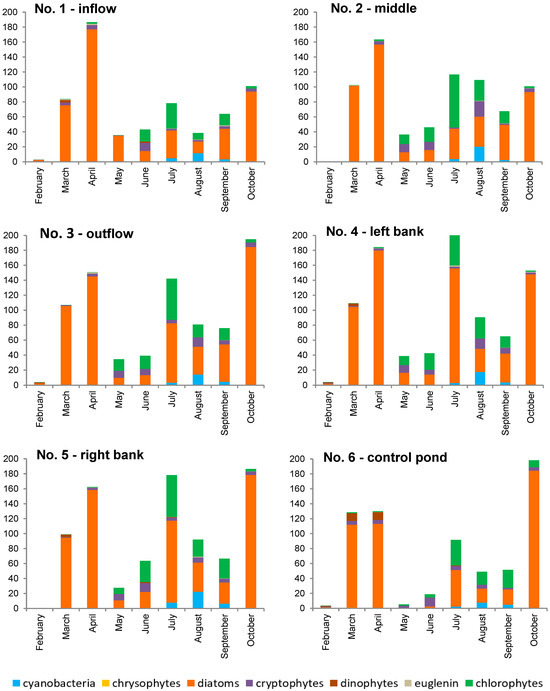
Figure 6.
Phytoplankton biomass at six study locations within the Strzeszkowice pond [mg/dm3].
For a major part of the study period, the biomass and abundance of phytoplankton were dominated by diatoms (Thalassiosira sp. and Cyclotella spp.). In late spring and during the summer months, the share of chlorophyte biomass increased (e.g., Phacotus lenticularis, Coenococcus planctonicus, and species of the genus Desmodesmus), as well as the share of cryptophyte abundance (Cryptomonas ovata, C. erosa, and the most numerous Rhodomonas sp.). It was most pronounced in the middle of the pond (location No. 2 between the aerators). At the inflow site from the river (location No. 1), the dominance of diatoms in terms of biomass was maintained the longest, and the development of chlorophytes was less evident due to the inflow of river phytoplankton. The share of cyanobacteria relative to the total phytoplankton biomass was evident from July to September, although it was significant only in August, and reached a level of 16–30% of total biomass (Figure 6). Planktotrix agardhii dominated among several identified species of cyanobacteria. It is commonly believed that, in temperate climate conditions, optimum conditions for a water “bloom” occur in August and early September [68]. In that period (as well as in the remaining ones), no typical water “bloom” was observed in the pond.
Such a distribution can be associated with the operation of the aerators forcing additional water movement and promoting water aeration—they limited the possibility of cyanobacterial scum development, observed by [39]. Pumping compressed air at the bottom of the pond has been shown to cause additional water circulation throughout the pond volume [38]. The phytoplankton circulating in the water column was exposed to considerably less light than it would have experienced had it floated near the water surface. This was confirmed by the results from the turbidity measurements (Table 1, Figure 4B), pointing to its increase during the operation of the reactors and to a decrease in Secchi visibility. This way, the conditions of mass development of cyanobacterial worsened [27,37,44]. In turn, the study of the response of cyanobacteria to the fountain-based water aeration system and to the mixing of lake water has showed disturbed abundance dynamics, but no evidence of growth inhibition [45].
The analysis of meteorological data showed (Figure S1) that cyanobacterial development could have also been influenced by the weather conditions. In the period most favorable for the development of cyanobacteria [68], very high levels of precipitation occurred. The total precipitation in August (214.4 mm) accounted for more than 40% of the total precipitation in the measurement period from February to October (523 mm). Moreover, it was an exceptionally cold month (in comparison to previous years). The mean monthly air temperature was 16.9 °C. Water temperature was found to be an important factor with respect to phytoplankton development (Table 1). The small depth of the pond favored the process of its warming in the growing period. Water temperatures in the pond exceeding 15 °C, favorable for the development of cyanobacteria [68,69], were recorded already at the end of April. Although the maximum temperature of the surface water in the summer period was 26.5 °C, owing to the operation of the reactor and high precipitation, no cyanobacterial water “bloom” occurred and the phytoplankton community was dominated by diatom and green algae species [39].
The assessment of the possibility of development of phytoplankton in water bodies often uses the Redfield ratio (RR), calculated based on the molar ratio of nitrogen to phosphorus [70]. The optimum RR for the maintenance of good water quality in water bodies is in the range of 10–22 (Nm/Pm) [70]. RR values exceeding that range point to unfavorable changes related to the development of algae/cyanobacteria. The calculations of the Nm:Pm ratio in the waters of the inflow and in the pond revealed seasonal changes. In colder months, RR had a value of more than 16, and, in the period of intensive vegetation, it exhibited a value below 16. When RR < 16, the biomass of other groups of phytoplankton organisms developed, and their development was limited by nitrogen. In the case of a lack of mineral forms of nitrogen, cyanobacteria can create them from nitrogen dissolved in the water (N2). Algae have no such possibility—their development requires both nitrates and phosphates [66]. Without aerators, the development in summer of cyanobacteria of the order Nostocales, capable of using gaseous nitrogen, is expected. However, the aerators prevented their proliferation owing to cyanobacteria’s light-demanding nature. Species of the order Oscillatoriales (mainly Planktotrix agardhii), which are shade tolerant, appeared in their place.
3.4. Water Trophic Status
The assessment of the trophic status of the studied waters employed the TSI (Trophic State Index, Figure S3), proposed by Carlson (1977) and Kratzer and Brezonik (1981) [54,55]. TSI values denoting oligotrophy are below 40, values denoting mesotrophy are 40–50, values denoting eutrophy are 50–70, and values denoting hypertrophy are above 70. The analyzed waters showed a high degree of eutrophication in the range from eutrophic to hypertrophic waters. The TSI index had high values both at the inflow site to the pond and at the outflow site, whereas the values of TSITN and TSITP were dominated by their mineral forms. Seasonal changes showed that the TSI index had values in the eutrophy range only in February, whereas TSITN and TSITP values were at the level of hypertrophy and TSISD and TSICHL fell in the range of eutrophic waters. In the remaining months, at all the analyzed points, the waters showed a hypertrophic status. Studies of pulverizing aerator use in lake waters have confirmed that they do not have any significant effect on the TSI index [29].
The species composition of phytoplankton, as well as their variability, abundance, and biomass, also pointed to a high trophic status of the water, characteristic of strongly eutrophic/hypertrophic water bodies.
3.5. Nitrogen and Phosphorus Load Supplied to the Pond
The nitrogen and phosphorus load supplied to the pond from the Krężniczanka River was 1.29 kg/d for mineral nitrogen and 0.09 kg/d for mineral phosphorus. According to Kajak (2001) [71], the values considerably exceeded the acceptable (0.07 gP/m2/year) values and hazardous (0.13 gP/m2/year) nutrient loads in the pond in accordance with the hydrodynamic Vollenweider model [6,72]. The values pointed to possible algal blooms caused by water inflow from Krężniczanka.
An additional pool of nutrients in the water may originate from bottom sediments deposited in modern times [17,18]. A decrease in oxygen concentration at the measuring location 2 to a level below 5 mg/dm3 was recorded in September. At that time, aerator no. 2 was not working due to a failure. Under conditions of limited periodical oxygen access in sediments and/or in the case of sediment resuspension, the sediment may release mineral forms of nitrogen and phosphorus that consequently contribute to phytoplankton development. The study results pointed to a potential high release of nutrients from the sediments (Table S3), particularly ammonium and orthophosphate ions. Their desorption can therefore constitute a considerable pool of nutrient supply to the waters of the pond, intensifying its eutrophication.
Fallen tree leaves can also constitute an important source of substances in the waters of the analyzed pond (Table S3). Water extracts from leaves showed very high concentrations of ammonium (14.08 mg/dm3) and orthophosphate ions (296.2 mg/dm3). Therefore, this path of nitrogen and phosphorus supply can also substantially contribute to the processes of water eutrophication.
3.6. Costs and Perspectives
In times of a water crisis, or in times characterized by a general human pressure and excessive exploitation of the environment, it proves necessary to search for methods to improve the quality of water bodies. Their implementation is, however, frequently prevented by investment costs. Due to this, the determination of the efficiency of a given technology/installation also requires a financial calculation. The construction of a compact aerating reactor with the necessary additional installations costs approximately €2.5k. It should be emphasized, however, that the number of the applied reactors is strongly dependent on the size of the water body. In the case of our research on a pond with a surface area of 0.45 ha, it was necessary to install two such devices. An important aspect of using such a system was the cost of the electricity necessary to power the aerating reactors, a cost which depends on the number of aerating units as well as on their efficiency settings. The total energy consumption (for two reactors) over the study period (February–October 2021) was 11,000 kWh. Therefore, the total cost of powering the proposed system from the electricity network is estimated at approximately €2k.
In the current unstable situation in terms of energy prices, it appears justified to search for alternative solutions, e.g., a photovoltaic installation. The current market price of a free-standing photovoltaic installation with a power of approximately 11 kWp, meeting the requirements of operating two reactors, is within the range of €10.5–13.0k. Considering the current energy price, the costs of the photovoltaic installation would be counterbalanced within approximately 5 years. Given the unfavorable dynamics of the changes in energy prices [73], however, that period may be considerably reduced. The use of renewable energy sources would also be beneficial with respect to environmental protection [74].
It should be emphasized, however, that, in the case of a system with reactors powered by a photovoltaic installation, it would be necessary to analyze individual needs and appropriate adjustments of the efficiency of the fan should be made with respect to the surface area of the water body, as well as with respect to the power output of the installed photovoltaic installation. Proper sizing of the installation would allow for a reduction of the costs of its construction, and, therefore, increase the cost-efficiency of the potential investment. The need for cost reductions, therefore, forces continuous modernization of the used devices and methods of control of the analyzed process. One of the necessary directions in research is currently the search for alternative solutions to further reduce electricity consumption. In the case described herein, another interesting technical solution worth investigating is making the fan operation in the reactor dependent on energy generation from a photovoltaic installation. Such a change could increase energy autoconsumption, therefore permitting a reduction of power use and costs of construction of the photovoltaic installation.
4. Conclusions
The study analyzed seasonal and diurnal changes in water quality in a small reservoir located in an agricultural catchment area in a temperate climate zone. The pond was affected by massive annual cyanobacteria blooms which limited its usability. Based on hydrochemical studies, it was found that the main cause of excessive eutrophication of the waters was the inflow of mineral forms of nitrogen and phosphorus from the river, as well as their release from bottom sediments and fallen tree leaves, especially during periods of oxygen deficits in the water.
To improve the water quality in the pond, box-type underwater aeration reactors filled with Terrapol 200 plastic media were used. The planned operation cycle of the reactors during the growing season, with 2 h in the morning and 2 h in the evening, was intended to aerate the water and promote its circulation in the pond.
The research results show that the pond did not experience oxygen deficiencies, and no cyanobacterial scum development was observed. This was interpreted as the result of the aerator activity, which promoted additional water circulation in the pond and its aeration. The results of the experiment indicate that underwater aeration reactors can be used to reduce the likelihood of algal blooms in small water reservoirs in agricultural areas. The performed energy cost analysis justifies powering the reactors with photovoltaic installations.
Based on the conducted research, it was concluded that an interesting direction for further studies could be to investigate the conditions that favor the colonization of the reactor by microorganisms and biofilm formation, aiming for better nutrient removal effects. An important issue could also be the analysis of greenhouse gas emissions from the reservoir during aeration and, thus, the carbon footprint of the selected water purification method.
Supplementary Materials
The following supporting information can be downloaded at: https://www.mdpi.com/article/10.3390/su16135629/s1, Figure S1. Hydrometeorological conditions of the study period—daily values; Figure S2. Abundance of phytoplankton [million ind./dm3] in 6 study points (A–F) in the Strzeszkowice pond; Figure S3. Trophic Status Index (TSI) of the analysed waters in year 2021; Table S1. Range of conducted analyses of water quality in pond the Strzeszkowice; Table S2. Characteristic values from hourly measurements of the analysed indices; Table S3. Results of the leachability test from pond sediments and tree leaves; Table S4. Correlation (Pearson coefficient) between the studied indicators of water quality in pond the Strzeszkowice from month measurements (p ≤ 0.05, p ≤ 0.01, p ≤ 0.001).
Author Contributions
Conceptualization, S.C., G.M., and M.B.; methodology, M.Z. and M.K.; validation, S.C.; formal analysis, S.C., M.Z., and M.K.; investigation, S.C., M.Z., M.K., M.P., and B.Z.; resources, S.C.; data curation, S.C., M.P., and S.D.-S.; writing—original draft, S.C., M.Z., and M.K.; writing—review & editing, S.C., G.M., M.Z., M.K., and S.D.-S.; visualization, S.C. and M.Z.; supervision, S.C. and G.M. All authors have read and agreed to the published version of the manuscript.
Funding
This research received no external funding.
Institutional Review Board Statement
Not applicable.
Informed Consent Statement
Not applicable.
Data Availability Statement
Data will be made available on request.
Conflicts of Interest
Authors Grzegorz Maliszewski, Mirosław Biruk and Sylwia Duda-Saternus are employed by the company TAYLOR LLC. The remaining authors declare that the research was conducted in the absence of any commercial or financial relationships that could be construed as a potential conflict of interest.
References
- Carpenter, S.R. Eutrophication of Aquatic Ecosystems: Bistability and Soil Phosphorus. Proc. Natl. Acad. Sci. USA 2005, 102, 10002–10005. [Google Scholar] [CrossRef] [PubMed]
- Górniak, A.; Kajak, Z. Hydrobiology Limnology; PWN: Warsaw, Poland, 2020. [Google Scholar]
- Kończak, M.; Huber, M. Application of the Engineered Sewage Sludge-Derived Biochar to Minimize Water Eutrophication by Removal of Ammonium and Phosphate Ions from Water. J. Clean. Prod. 2022, 331, 129994. [Google Scholar] [CrossRef]
- Li, X.; Nan, R. A Bibliometric Analysis of Eutrophication Literatures: An Expanding and Shifting Focus. Environ. Sci. Pollut. Res. 2017, 24, 17103–17115. [Google Scholar] [CrossRef] [PubMed]
- Reynolds, C.S. The Development of Perceptions of Aquatic Eutrophication and Its Control. Int. J. Ecohydrol. Hydrobiol. 2003, 3, 149–163. [Google Scholar]
- Vollenweider, R.A. Advances in Defining Critical Loading Levels for Phosphorus in Lake Eutrophication. Mem. Dell’istituto Ital. Di Idrobiol. Dott. Marco De. Marchi Verbania Pallanza 1976, 33, 53–83. [Google Scholar]
- Chmiel, S.; Sposób, J.; Mięsiak-Wójcik, K.; Michalczyk, Z.; Głowacki, S. The Effect of a Dam Reservoir on Water Trophic Status and Forms of River Transport of Nutrients. In Polish River Basins and Lakes—Part I: Hydrology and Hydrochemistry; Korzeniewska, E., Harnisz, M., Eds.; The Handbook of Environmental Chemistry; Springer International Publishing: Cham, Switzerland, 2020; pp. 305–320. ISBN 978-3-030-12123-5. [Google Scholar]
- Chmiel, S.; Głowacki, S.; Michalczyk, Z.; Sposób, J. Some Issues in the Assessment of Eutrophication of River Waters as a Consequence of the Construction of a Storage Reservoir (on the Example of the Bystrzyca River). Ecohydrol. Hydrobiol. 2009, 9, 175–179. [Google Scholar] [CrossRef]
- Ignatius, A.R.; Rasmussen, T.C. Small Reservoir Effects on Headwater Water Quality in the Rural-Urban Fringe, Georgia Piedmont, USA. J. Hydrol. Reg. Stud. 2016, 8, 145–161. [Google Scholar] [CrossRef]
- Szczykowska, J.; Siemieniuk, A.; Wiater, J. Agricultural Pollution and Water Quality in Small Retention Reservoir in Korycin. J. Ecol. Eng. 2014, 16, 141–146. [Google Scholar] [CrossRef] [PubMed][Green Version]
- Smith, V.H.; Schindler, D.W. Eutrophication Science: Where Do We Go from Here? Trends Ecol. Evol. 2009, 24, 201–207. [Google Scholar] [CrossRef] [PubMed]
- Cheung, M.Y.; Liang, S.; Lee, J. Toxin-Producing Cyanobacteria in Freshwater: A Review of the Problems, Impact on Drinking Water Safety, and Efforts for Protecting Public Health. J. Microbiol. 2013, 51, 1–10. [Google Scholar] [CrossRef]
- Schindler, D.W.; Vallentyne, J.R. The Algal Bowl: Overfertilization of the World’s Freshwaters and Estuaries; Routledge: Oxford, UK, 2008. [Google Scholar]
- Rousso, B.Z.; Bertone, E.; Stewart, R.; Hamilton, D.P. A Systematic Literature Review of Forecasting and Predictive Models for Cyanobacteria Blooms in Freshwater Lakes. Water Res. 2020, 182, 115959. [Google Scholar] [CrossRef]
- Bucka, H. Ecology of Selected Planktonic Algae Causing Water Blooms. Acta Hydrobiol. 1989, 31, 207–258. [Google Scholar]
- Han, Z.; Cui, B. Performance of Macrophyte Indicators to Eutrophication Pressure in Ponds. Ecol. Eng. 2016, 96, 8–19. [Google Scholar] [CrossRef]
- Søndergaard, M.; Jensen, J.P.; Jeppesen, E. Role of Sediment and Internal Loading of Phosphorus in Shallow Lakes. Hydrobiologia 2003, 506, 135–145. [Google Scholar] [CrossRef]
- Zamparas, M.; Zacharias, I. Restoration of Eutrophic Freshwater by Managing Internal Nutrient Loads. A Review. Sci. Total Environ. 2014, 496, 551–562. [Google Scholar] [CrossRef] [PubMed]
- Glibert, P.M. Eutrophication, Harmful Algae and Biodiversity—Challenging Paradigms in a World of Complex Nutrient Changes. Mar. Pollut. Bull. 2017, 124, 591–606. [Google Scholar] [CrossRef] [PubMed]
- Gong, Z.; Xie, P. Impact of Eutrophication on Biodiversity of the Macrozoobenthos Community in a Chinese Shallow Lake. J. Freshw. Ecol. 2001, 16, 171–178. [Google Scholar] [CrossRef][Green Version]
- Helminen, H.; Karjalainen, J.; Kurkilahti, M.; Rask, M.; Sarvala, J. Eutrophication and Fish Biodiversity in Finnish Lakes. SIL Proc. 1922–2010 2000, 27, 194–199. [Google Scholar] [CrossRef]
- Ibelings, B.W.; Chorus, I. Accumulation of Cyanobacterial Toxins in Freshwater “Seafood” and Its Consequences for Public Health: A Review. Environ. Pollut. 2007, 150, 177–192. [Google Scholar] [CrossRef]
- Kobos, J.; Błaszczyk, A.; Hohlfeld, N.; Toruńska-Sitarz, A.; Krakowiak, A.; Hebel, A.; Sutryk, K.; Grabowska, M.; Toporowska, M.; Kokociński, M.; et al. Cyanobacteria and cyanotoxins in Polish freshwater bodies. Oceanol. Hydrobiol. Stud. 2013, 42, 358–378. [Google Scholar] [CrossRef]
- Abell, J. Ecofish—Shallow Lakes Restoration Review—Final Shallow Lakes: A Literature Review; Waikato Regional Council Technical Report. 2018. Available online: https://www.waikatoregion.govt.nz/assets/WRC/WRC-2019/TR201813.pdf (accessed on 13 June 2024).
- Gołdyn, R.; Podsiadłowski, S.; Dondajewska, R.; Kozak, A. The Sustainable Restoration of Lakes—Towards the Challenges of the Water Framework Directive. Ecohydrol. Hydrobiol. 2014, 14, 68–74. [Google Scholar] [CrossRef]
- Jurczak, T.; Wojtal-Frankiewicz, A.; Kaczkowski, Z.; Oleksińska, Z.; Bednarek, A.; Zalewski, M. Restoration of a Shady Urban Pond—The Pros and Cons. J. Environ. Manag. 2018, 217, 919–928. [Google Scholar] [CrossRef] [PubMed]
- Klapper, H. Technologies for Lake Restoration. J. Limnol. 2003, 62, 73–90. [Google Scholar] [CrossRef]
- Pęczuła, W. Methods Applied in Cyanobacterial Bloom Control in Shallow Lakes and Reservoirs. Ecol. Chem. Eng. A Chem. I Inz. Ekol. A 2012, 19, 795–806. [Google Scholar] [CrossRef]
- Siwek, H.; Włodarczyk, M.; Czerniawski, R. Trophic State and Oxygen Conditions of Waters Aerated with Pulverising Aerator: The Results from Seven Lakes in Poland. Water 2018, 10, 219. [Google Scholar] [CrossRef]
- With, J.S.; Wright, D.I. Lake Restoration by Biomanipulation: Round Lake, Minnesota, the First Two Years. Freshw. Biol. 1984, 14, 371–383. [Google Scholar] [CrossRef]
- Zalewski, M. Ecohydrology—The Use of Ecological and Hydrological Processes for Sustainable Management of Water Resources. Hydrol. Sci. J. 2002, 47, 825–834. [Google Scholar] [CrossRef]
- Zalewski, M.; Wagner, I. Ecohydrology of Urban Aquatic Ecosystems for Healthy Cities. In Aquatic Habitats in Sustainable Urban Water Management; CRC Press: Boca Raton, FL, USA, 2008; ISBN 978-0-429-19246-3. [Google Scholar]
- Bajkiewicz-Grabowska, E.; Markowski, M.; Lemańczyk, K. Application of geoinformation techniques to determine zones of sediment resuspension induced by wind waves in lakes (using two lakes from Northern Poland as examples). Limnol. Rev. 2016, 16, 3–14. [Google Scholar] [CrossRef]
- Li, L.; Li, Y.; Biswas, D.K.; Nian, Y.; Jiang, G. Potential of Constructed Wetlands in Treating the Eutrophic Water: Evidence from Taihu Lake of China. Bioresour. Technol. 2008, 99, 1656–1663. [Google Scholar] [CrossRef]
- Tang, X.; Huang, S.; Scholz, M.; Li, J. Nutrient Removal in Pilot-Scale Constructed Wetlands Treating Eutrophic River Water: Assessment of Plants, Intermittent Artificial Aeration and Polyhedron Hollow Polypropylene Balls. Water Air Soil. Pollut. 2009, 197, 61–73. [Google Scholar] [CrossRef]
- Beutel, M.W.; Horne, A.J. A Review of the Effects of Hypolimnetic Oxygenation on Lake and Reservoir Water Quality. Lake Reserv. Manag. 1999, 15, 285–297. [Google Scholar] [CrossRef]
- Visser, P.M.; Ibelings, B.W.; Bormans, M.; Huisman, J. Artificial Mixing to Control Cyanobacterial Blooms: A Review. Aquat. Ecol. 2016, 50, 423–441. [Google Scholar] [CrossRef]
- Boyd, C.E. Pond Water Aeration Systems. Aquac. Eng. 1998, 18, 9–40. [Google Scholar] [CrossRef]
- Hao, A.; Kobayashi, S.; Xia, D.; Mi, Q.; Yan, N.; Su, M.; Lin, A.; Zhao, M.; Iseri, Y. Controlling Eutrophication via Surface Aerators in Irregular-Shaped Urban Ponds. Water 2021, 13, 3360. [Google Scholar] [CrossRef]
- Wiśniewski, R. The Condition and Potential Methods of Restoration of Shallow, Urban Lake Jelonek. Environ. Prot. Eng. 2007, 33, 231–240. [Google Scholar]
- Chen, C.; Wang, Y.; Pang, X.; Long, L.; Xu, M.; Xiao, Y.; Liu, Y.; Yang, G.; Deng, S.; He, J.; et al. Dynamics of Sediment Phosphorus Affected by Mobile Aeration: Pilot-Scale Simulation Study in a Hypereutrophic Pond. J. Environ. Manag. 2021, 297, 113297. [Google Scholar] [CrossRef] [PubMed]
- Lürling, M.; Mucci, M. Mitigating Eutrophication Nuisance: In-Lake Measures Are Becoming Inevitable in Eutrophic Waters in the Netherlands. Hydrobiologia 2020, 847, 4447–4467. [Google Scholar] [CrossRef]
- Lawson, R.; Anderson, M.A. Stratification and Mixing in Lake Elsinore, California: An Assessment of Axial Flow Pumps for Improving Water Quality in a Shallow Eutrophic Lake. Water Res. 2007, 41, 4457–4467. [Google Scholar] [CrossRef] [PubMed]
- Wang, Y.; He, Q.; Tang, H.; Han, Y.; Li, M. Two-Year Moving Aeration Controls Cyanobacterial Blooms in an Extremely Eutrophic Shallow Pond: Variation in Phytoplankton Community and Microcystis Colony Size. J. Water Process Eng. 2021, 42, 102192. [Google Scholar] [CrossRef]
- Zębek, E. Response of cyanobacteria to the fountain-based water aeration system in Jeziorak Mały urban lake. Limnol. Rev. 2014, 14, 51–60. [Google Scholar] [CrossRef][Green Version]
- Jurik, Ľ.; Húska, D.; Halászová, K.; Bandlerová, A. Small Water Reservoirs—Sources of Water or Problems? J. Ecol. Eng. 2015, 16, 22–28. [Google Scholar] [CrossRef]
- Elliott, J.A. Is the Future Blue-Green? A Review of the Current Model Predictions of How Climate Change Could Affect Pelagic Freshwater Cyanobacteria. Water Res. 2012, 46, 1364–1371. [Google Scholar] [CrossRef] [PubMed]
- Kosten, S.; Huszar, V.L.M.; Bécares, E.; Costa, L.S.; van Donk, E.; Hansson, L.-A.; Jeppesen, E.; Kruk, C.; Lacerot, G.; Mazzeo, N.; et al. Warmer Climates Boost Cyanobacterial Dominance in Shallow Lakes. Glob. Change Biol. 2012, 18, 118–126. [Google Scholar] [CrossRef]
- Mioduszewski, W. Small Water Reservoirs—Their Function and Construction. J. Water Land. Dev. 2012, 17, 45–52. [Google Scholar] [CrossRef]
- Cooke, G.D.; Welch, E.B.; Peterson, S.; Nichols, S.A. Restoration and Management of Lakes and Reservoirs, 3rd ed.; CRC Press: Boca Raton, FL, USA, 2005; ISBN 978-0-429-18923-4. [Google Scholar]
- Lerminiaux, J.; Norton, B.; Wilson, R.J.; Rimas, R.; Lavender, T.M.; Finlay, K. Effects of Aeration on Water Quality in Agricultural Reservoirs in the Northern Great Plains. Lake Reserv. Manag. 2024, 1–21. [Google Scholar] [CrossRef]
- PN-EN ISO 5667-1:2022-07. Water Quality—Sampling—Part 1: Guidelines for Developing Sampling Programs and Sampling Techniques. Technical Committee: Washington, DC, USA, 2022.
- PN-EN ISO 5667-3:2018-08. Water Quality—Sampling—Part 3: Guidelines for the Preservation and Handling of Water Samples. Technical Committee: Washington, DC, USA, 2022.
- Carlson, R.E. A Trophic State Index for Lakes1. Limnol. Oceanogr. 1977, 22, 361–369. [Google Scholar] [CrossRef]
- Kratzer, C.R.; Brezonik, P.L. A Carlson-Type Trophic State Index for Nitrogen in Florida Lakes1. JAWRA J. Am. Water Resour. Assoc. 1981, 17, 713–715. [Google Scholar] [CrossRef]
- Hutorowicz, A.; Pasztaleniec, A. Handbook for Monitoring Biological Elements and Classification of the Ecological Status of Surface Waters, Phytoplankton in Lakes; Environment Monitoring Library: Urbana, IL, USA, 2020; (In Polish). Available online: https://www.gios.gov.pl/images/dokumenty/pms/monitoring_wod/Podrecznik_Monitoringu_Wod.pdf (accessed on 13 June 2024).
- Gizińska, J.; Sojka, M. How Climate Change Affects River and Lake Water Temperature in Central-West Poland—A Case Study of the Warta River Catchment. Atmosphere 2023, 14, 330. [Google Scholar] [CrossRef]
- Hammer, K.J.; Kragh, T.; Sand-Jensen, K. Inorganic Carbon Promotes Photosynthesis, Growth, and Maximum Biomass of Phytoplankton in Eutrophic Water Bodies. Freshw. Biol. 2019, 64, 1956–1970. [Google Scholar] [CrossRef]
- Singh, S.P.; Singh, P. Effect of CO2 Concentration on Algal Growth: A Review. Renew. Sustain. Energy Rev. 2014, 38, 172–179. [Google Scholar] [CrossRef]
- Nguyen, V.D.; Bac, N.; Hoang, T.H. Dissolved Oxygen as an Indicator for Eutrophication in Freshwater Lakes. 2016, p. 47. Available online: https://www.researchgate.net/profile/Duc-Viet-Nguyen-7/publication/308991144_Dissolved_Oxygen_as_an_Indicator_for_Eutrophication_in_Freshwater_Lakes/links/57fcee4208aec496a42b2838/Dissolved-Oxygen-as-an-Indicator-for-Eutrophication-in-Freshwater-Lakes.pdf (accessed on 13 June 2024).
- Łopata, M.; Grochowska, J.K.; Augustyniak-Tunowska, R.; Tandyrak, R. Possibilities of Improving Water Quality of Degraded Lake Affected by Nutrient Overloading from Agricultural Sources by the Multi-Point Aeration Technique. Appl. Sci. 2023, 13, 2861. [Google Scholar] [CrossRef]
- YSI Environmental Environmental Dissolved Oxygen Values above 100% Air Saturation. Available online: https://cdn.ioos.noaa.gov/media/2017/12/super_saturation.pdf (accessed on 13 June 2024).
- Wiśnios, M.; Kanownik, W. Thermal and oxygen conditions in carp ponds during the summer period. J. Ecol. Eng. 2015, 16, 144–150. [Google Scholar] [CrossRef] [PubMed]
- Górski, J.; Dragon, K.; Kaczmarek, P.M.J. Nitrate Pollution in the Warta River (Poland) between 1958 and 2016: Trends and Causes. Environ. Sci. Pollut. Res. 2019, 26, 2038–2046. [Google Scholar] [CrossRef] [PubMed]
- Lawniczak, A.E.; Zbierska, J.; Kupiec, J. Changes of Nutrient Concentrations in Water Sensitive to Nitrate Pollution from Agricultural Sources in the Samica Steszewska River Catchment. Ann. Wars. Univ. Life Sci.—SGGW. Land. Reclam. 2008, 40, 15–25. [Google Scholar] [CrossRef]
- Ivanova, A.P.; Vrba, J.; Potužák, J.; Regenda, J.; Strunecký, O. Seasonal Development of Phytoplankton in South Bohemian Fishponds (Czechia). Water 2022, 14, 1979. [Google Scholar] [CrossRef]
- Chambers, P.A.; McGoldrick, D.J.; Brua, R.B.; Vis, C.; Culp, J.M.; Benoy, G.A. Development of Environmental Thresholds for Nitrogen and Phosphorus in Streams. J. Environ. Qual. 2012, 41, 7–20. [Google Scholar] [CrossRef] [PubMed]
- Yang, Z.; Zhang, M.; Yu, Y.; Shi, X. Temperature Triggers the Annual Cycle of Microcystis, Comparable Results from the Laboratory and a Large Shallow Lake. Chemosphere 2020, 260, 127543. [Google Scholar] [CrossRef] [PubMed]
- Rosińska, J.; Kozak, A.; Dondajewska, R.; Gołdyn, R. Cyanobacteria Blooms before and during the Restoration Process of a Shallow Urban Lake. J. Environ. Manag. 2017, 198, 340–347. [Google Scholar] [CrossRef] [PubMed]
- Galvez, R.; Sanchez, M. Trophic Status Evaluation for 154 Lakes in Quebec, Canada: Monitoring and Recommendations. Water Qual. Res. J. Can. 2007, 42, 252–268. [Google Scholar] [CrossRef]
- Kajak, Z. Hydrobiology—Limnology. Inland Water Ecosystems; PWN: Warsaw, Poland, 2001. [Google Scholar]
- Vollenweider, R.A. Scientific Fundamentals of the Eutrophication of Lakes and Flowing Waters, with Particular Reference to Nitrogen and Phosphorus as Factors in Eutrophication; Organisation for Economic Co-Operation and Development: Paris, France, 1968. [Google Scholar]
- Rokicki, T.; Bórawski, P.; Gradziuk, B.; Gradziuk, P.; Mrówczyńska-Kamińska, A.; Kozak, J.; Guzal-Dec, D.J.; Wojtczuk, K. Differentiation and Changes of Household Electricity Prices in EU Countries. Energies 2021, 14, 6894. [Google Scholar] [CrossRef]
- Novas, N.; Garcia, R.M.; Camacho, J.M.; Alcayde, A. Advances in Solar Energy towards Efficient and Sustainable Energy. Sustainability 2021, 13, 6295. [Google Scholar] [CrossRef]
Disclaimer/Publisher’s Note: The statements, opinions and data contained in all publications are solely those of the individual author(s) and contributor(s) and not of MDPI and/or the editor(s). MDPI and/or the editor(s) disclaim responsibility for any injury to people or property resulting from any ideas, methods, instructions or products referred to in the content. |
© 2024 by the authors. Licensee MDPI, Basel, Switzerland. This article is an open access article distributed under the terms and conditions of the Creative Commons Attribution (CC BY) license (https://creativecommons.org/licenses/by/4.0/).

