Article

Assessing the Spatial Equity of Urban Park Green Space Layout from the Perspective of Resident Heterogeneity

School of Architecture, Southeast University, Nanjing 210096, China
*
Author to whom correspondence should be addressed.
Sustainability 2024, 16(13), 5631; https://doi.org/10.3390/su16135631
Submission received: 17 May 2024 / Revised: 20 June 2024 / Accepted: 28 June 2024 / Published: 30 June 2024

Abstract

:
Urban park green spaces (UPGS) are essential resources for improving the urban ecological environment and meeting residents’ recreational needs. However, during rapid urbanization, the layout of UPGS often exhibits spatial inequity, with significant differences in the resources enjoyed by resident groups with different socioeconomic attributes. Accurately assessing the spatial equity of the UPGS layout (the equal accessibility of UPGS) is crucial for optimizing resource allocation and promoting social equity. This study takes the main urban area of Nanjing as an example and utilizes location-based service (LBS) data and multi-source geographic data to conduct an in-depth characterization of residents’ socioeconomic attributes, recreational behaviors, and park green space layout at the street scale. By constructing indicators of resident heterogeneity and UPGS supply–demand matching degree, it reveals the differences in park green space accessibility among different social groups and locations and explores the correlation between resident heterogeneity and UPGS spatial equity. The study finds that the layout of UPGS in the main urban area of Nanjing exhibits significant spatial inequity, with generally poor accessibility to park green spaces in the central urban area and low-income communities. The higher degree of diversification of residents’ socioeconomic attributes leads to a lower level of UPGS spatial equity in their streets. The results of the big data analysis verify the significant impact of resident heterogeneity on the equity of park green space layout. This study reveals the spatial equity issues of UPGS layout from the perspective of resident heterogeneity, providing new ideas and evidence for optimizing the allocation of park green space resources. Future UPGS planning should pay more attention to the diversity of residents’ recreational needs, focus on improving the accessibility of park green spaces in central urban areas and low-income communities, and balance the interests and demands of different stakeholders through public participation mechanisms.

1. Introduction

Urban park green spaces (UPGS) are essential components of the built environment, ranging from semi-natural to natural areas. They serve as spatial carriers of urban ecological environments [1] and provide various ecosystem services, such as regulating urban climate, maintaining biodiversity, reducing urban pollution, and enhancing environmental comfort [2,3,4]. Moreover, as a type of social public service resource with spatial attributes, UPGS can further expand residents’ leisure and recreational activities, playing a crucial role in promoting residents’ physical and mental health and enhancing urban vitality [5,6]. In the context of rapid global urbanization and increasingly severe environmental problems, UPGS are recognized as scarce and high-quality resources [7]. The rationality and effectiveness of their spatial configuration are vital to urban economic development, ecological balance, and social benefits and have increasingly become a focus of governments in various countries for building livable cities and promoting sustainable development [8,9].
However, a growing number of studies on global case cities have shown that the spatial layout of UPGS is inequitable, with significant disparities in accessibility across different geographical units and social groups [10]. On the one hand, in urban areas with high population density and land value, more abundant and higher-quality UPGS are often allocated, while in suburban or rural areas, significantly fewer people benefit from urban green spaces [11]. On the other hand, in high-density cities, the existing configuration of UPGS neglects residents’ individualized needs, and vulnerable groups such as the elderly, low-income populations, and marginalized racial groups are often recognized as suffering from the unequal supply of UPGS [12]. This reflects the imbalance between the supply level of UPGS and the diverse needs of different urban resident groups. Therefore, from the perspective of group heterogeneity, focusing on residents’ differentiated attributes and demand characteristics and re-examining the spatial equity assessment methods of UPGS layout can help to evaluate the service level and usage of UPGS more precisely. This, in turn, can help identify which spaces and groups face the problem of unequal supply and demand of UPGS, which is crucial for addressing the most pressing issues of green space inequality and optimizing the layout of UPGS.
UPGS equity assessments essentially describe and measure the matching relationship between the supply of UPGS facilities and the recreational needs of urban residents [13]. Although some studies have proposed methods to improve the equity assessment of UPGS, three limitations still exist. First, assessments oriented towards spatial scale and layout equity emphasize spatial supply while neglecting group demand. Existing studies primarily employ spatial accessibility indicators to evaluate the differences in UPGS services across different urban regions. While this approach can broadly assess the overall UPGS equity of an entire city from a macro-scale perspective, it overlooks the differentiated characteristics of complex social groups in cities and their diverse needs for UPGS. Second, even as UPGS layout equity measurement methods gradually shift from a “supply-side” to a “demand-side” perspective, they only focus on the differentiated needs of specific socioeconomic status [14], age groups [15,16], and other vulnerable populations. Influenced by theories of environmental justice and landscape justice, relevant studies often consider the heterogeneous needs of specific groups, such as the elderly, immigrants, and low-income populations, but lack fine-grained identification and characterization of all categories of urban residents. Finally, even with the emergence of spatial equity supply–demand matching assessment methods based on subdivided population types and multiple spatial scales, most studies still rely on small data such as statistical data [17] and questionnaire surveys [18] to investigate spatial differences at the census administrative district level. This approach requires visiting individual households, which is time-consuming and lacks timeliness [19]. Moreover, few studies are based on small-scale geographical spatial units, making it difficult to identify the mismatch between UPGS supply and demand in specific regions and groups [20].
Meanwhile, with the rapid development of high-precision geospatial big data, many scholars have begun to use mobile phone positioning data to investigate residents’ daily activity characteristics in cities [21,22]. The advantages of large sample size, fast data update, and precise spatial location of LBS data can help identify the attribute characteristics of urban populations and their differentiated spatiotemporal needs for UPGS on a large scale, showing the potential to improve the scope and accuracy of UPGS equity assessments [23]. Among them, LBS data, as a type of mobile phone positioning data, provides scholars with favorable assistance in studying the differentiated demand characteristics between different groups due to its inherent social attribute information such as user age, gender, and place of birth [24,25]. Therefore, it is necessary to discuss the group and spatial differences in UPGS equity based on fine-grained geographical units from the dual perspectives of group heterogeneity and spatial heterogeneity. This study aims to bridge the gap in understanding the relationship between residents’ socioeconomic attributes and the spatial equity of urban park green space, providing valuable insights for urban planning and community management. This can help diagnose and explain the problem areas of supply–demand mismatch more intuitively, and it can provide references for urban green space planning and community management models.
This study aims to systematically identify and analyze the supply–demand matching characteristics of UPGS equity among different groups and spatial units from the perspective of residents’ differentiated daily life needs in order to improve the UPGS equity assessment system of previous studies. The contribution of this study is to propose a method to assess UPGS spatial equity based on big data and find that resident heterogeneity is negatively correlated with the spatial equity of UPGS. By utilizing multi-source data such as urban mobile phone LBS data, area of interest (AOI) data, land use data, and housing price data, and taking residential spatial units as the basic research units, this study constructs a measurement framework of UPGS “supply–demand matching” from the perspective of heterogeneity. It quantifies the supply and demand levels of UPGS based on the composition of group types in residential spatial units. An empirical study is conducted in the main urban area of Nanjing to demonstrate the practicality of this framework, and the research results can provide references for future optimization of UPGS layout and community renewal decisions. This paper aims to answer the following questions: (1) Is the supply level of UPGS in residential spatial units spatially balanced? (2) Does the allocation of UPGS resources meet the needs of typical groups in each residential spatial unit? (3) How can the problem units of the UPGS supply–demand imbalance be optimized from the perspective of heterogeneity?

2. Materials and Data
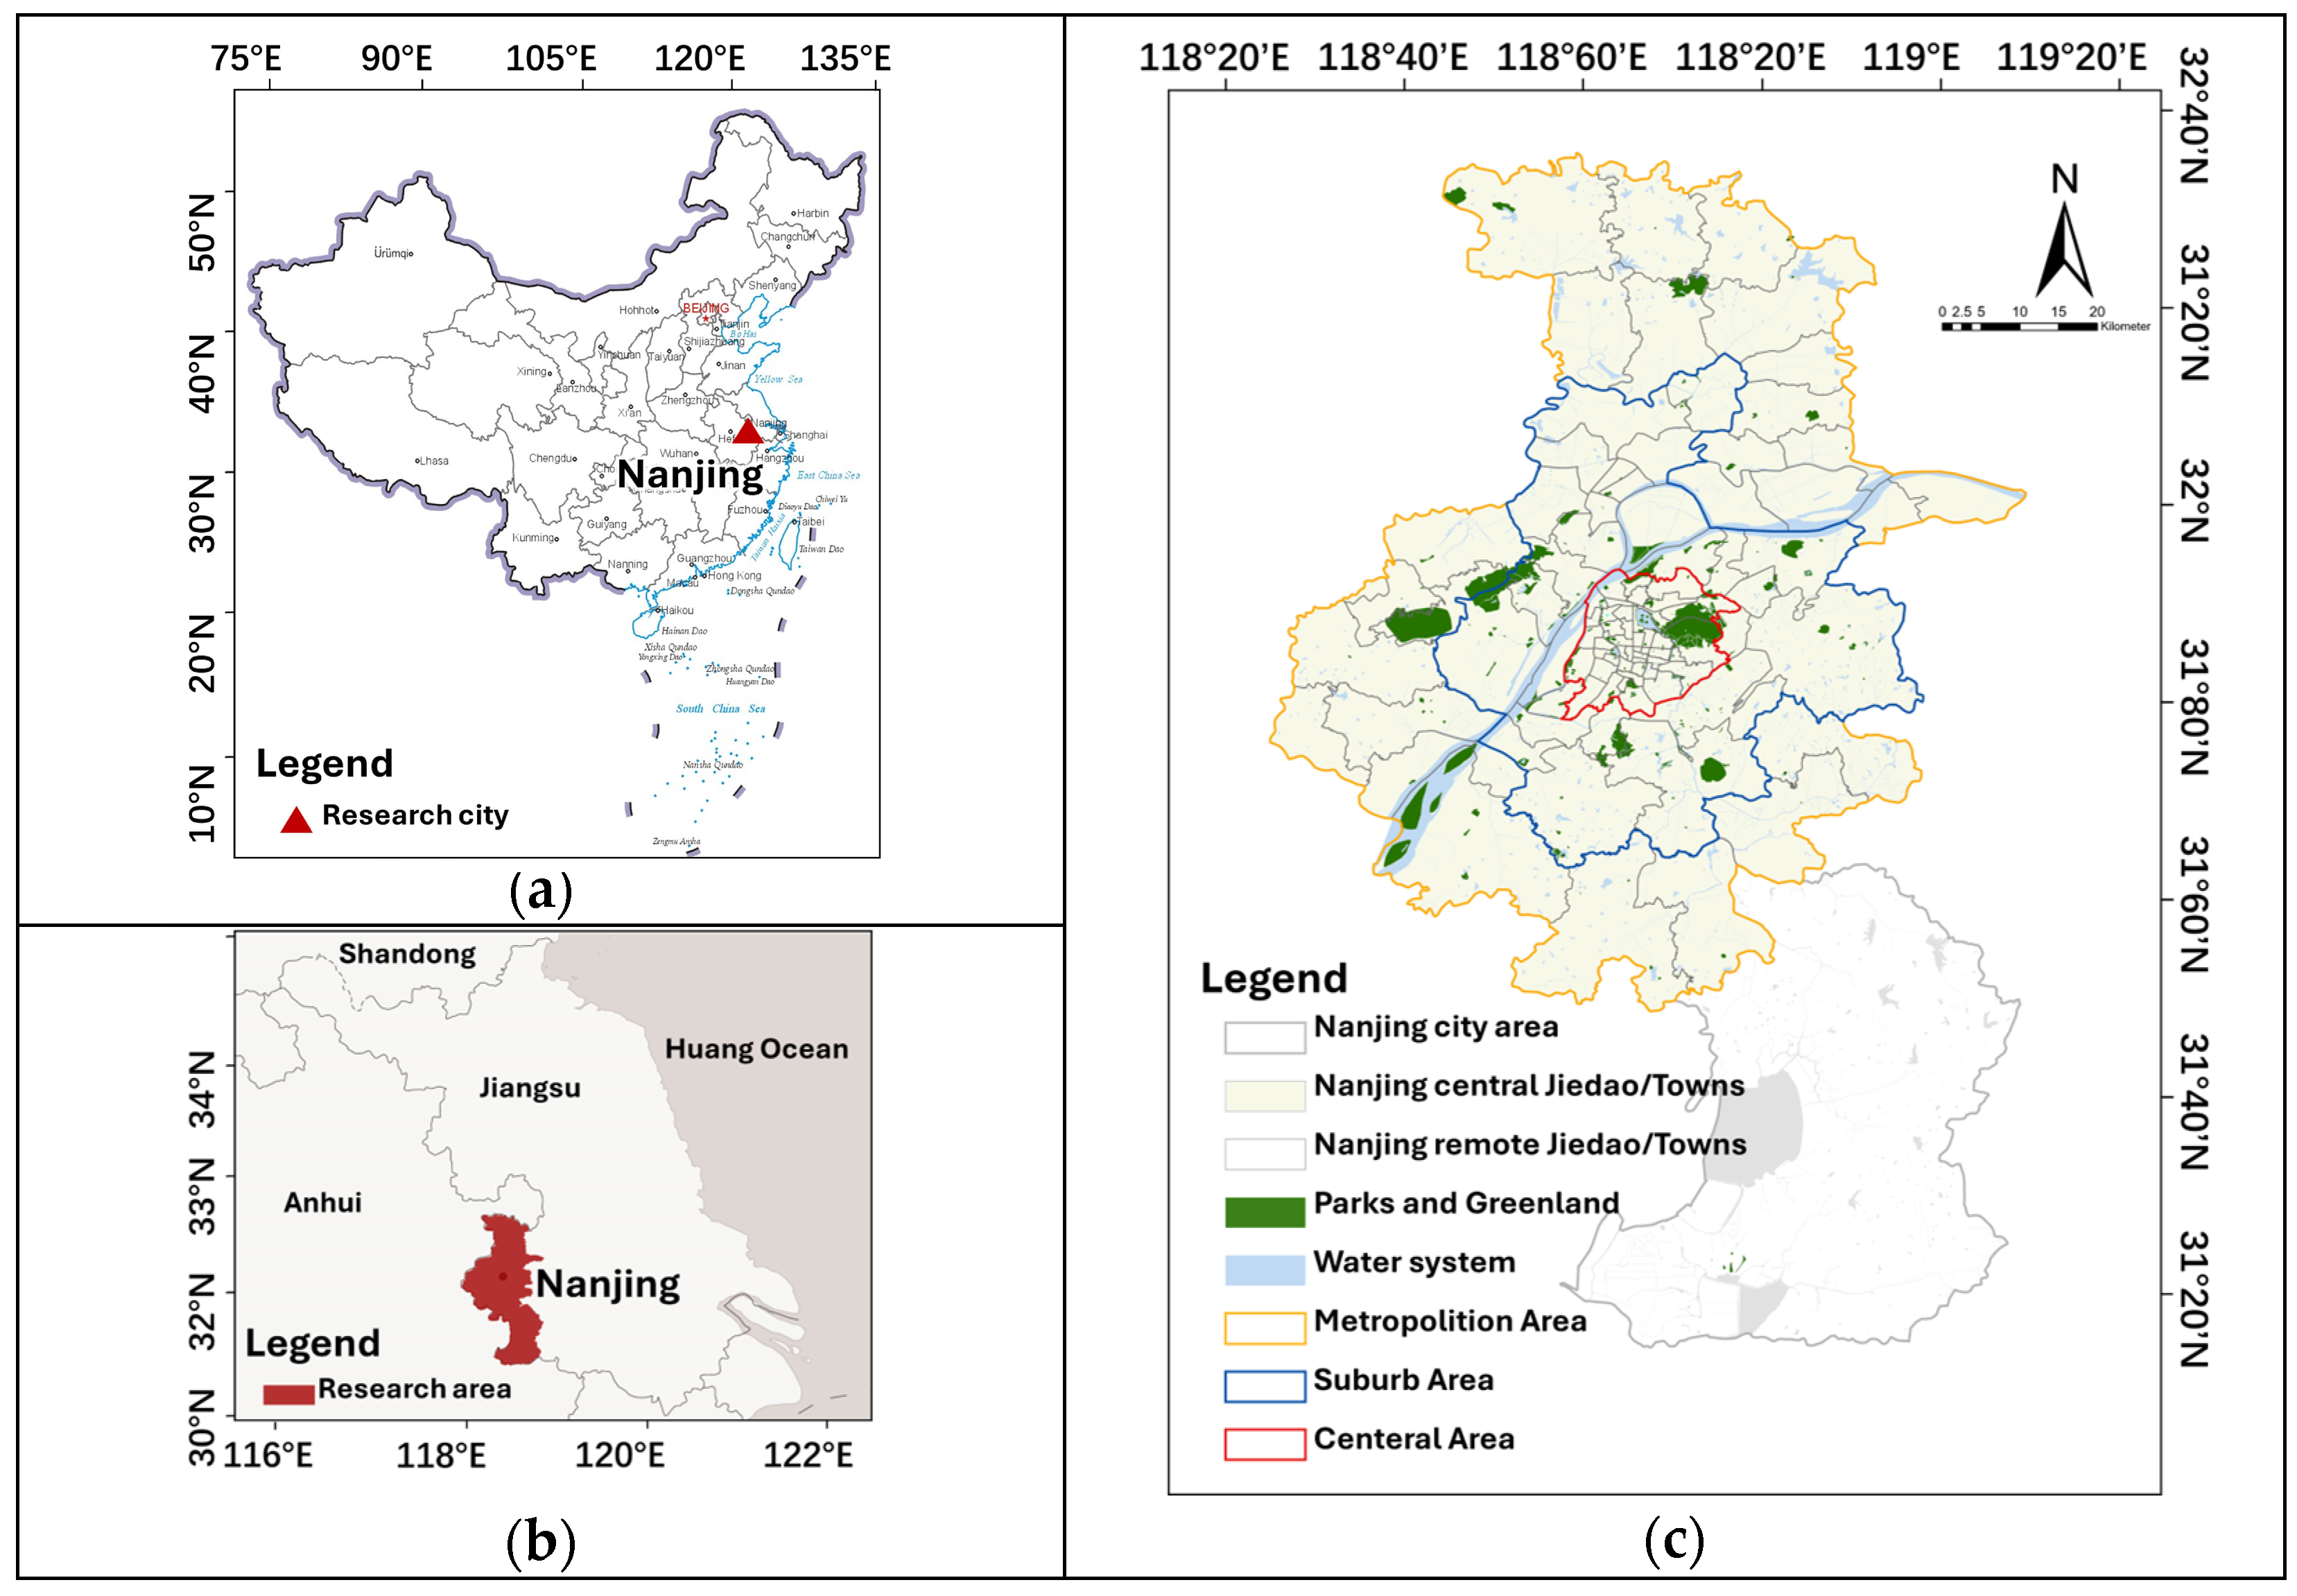
2.1. Study Area

Nanjing (31°14′ N–32°37′ N, 118°22′ E–119°14′ E) is the capital city of Jiangsu Province. According to the spatial continuity of the built-up area, Nanjing can be divided into two regions: the main urban area (including nine districts: Xuanwu, Gulou, Qinhuai, Jianye, Yuhuatai, Pukou, Jiangning, Qixia, and Liuhe) and the suburban area (two districts: Lishui and Gaochun).
The internal population activity connection in the main urban area is high, while there is a certain degree of isolation between the suburban area and the daily activities of residents in the main urban area. Therefore, this study selects only the main urban area as the case study. The main urban area covers an area of 4732.02 square kilometers with a population of 7.5606 million, containing one hundred street units (each approximately 1–12 square kilometers, according to street data provided by the Nanjing Planning Bureau). The internal differences are large, making it unsuitable to study as a whole. The population distribution of Nanjing follows a ring pattern, divided into three rings [26,27]. In Russwurm’s study, the area within 10 km from the city is the central area, while Friedman defines the area within 50 km from the city center as the marginal zone [28]. In addition, Nanjing has a ring-shaped bypass highway about 25 km from the city center. Therefore, this study takes Nanjing’s city center, Xinjiekou Square, as the starting point, measures its distance to the geometric center of the streets, and divides them into three categories: urban central area, suburban area, and metropolitan area, based on the standards of 10 km, 25 km, and 50 km. The study area is shown in Figure 1.

2.2. Data Source and Pre-Processing

The research data used in this study mainly include three categories: geospatial big data, validation data, and basic geographic data. Geospatial big data include area of interest vector data, urban green space vector data, and housing price point vector data. Validation data are point vector data based on mobile signaling LBS. Basic geographic data contain road line vector data and administrative boundary polygon vector data. All data sources and descriptions are shown in Table 1.
This study employs multi-source heterogeneous data, including urban green space data, user behavior data based on LBS data, housing price data, and basic geographic data. To ensure data spatial consistency and analysis accuracy, all data underwent systematic pre-processing. It is worth noting that to ensure spatial consistency and comparability of results, all spatial data in this study were uniformly converted to the WGS-1984-UTM-Zone-50N coordinate system.

2.2.1. Urban Green Space Datasets

The parks referred to in this study are public green spaces with basic recreational and service facilities, mainly for residents within a certain community range to carry out daily leisure activities. These green spaces are generally constructed and managed by government departments. Therefore, the acquisition of park data in this study is carried out in two steps: (1) extracting the green space vector data within the study area from Amap; (2) obtaining the list of park green spaces in the study area from the “Nanjing Green Space System Planning (2013–2020)” and Baidu Maps; and (3) screening and correcting the extracted green space vector data according to information such as name, spatial location, and area.
According to the data acquisition results, as of 2021, the total area of green space in the main urban area of Nanjing was 203,409,848 square meters, with a total of 351 park green spaces. Among them, the largest is Jiangxinzhou Ecological Park, with an area of 2,994,993 square meters; the smallest is a street corner park in Yijiangmen Street, Nanjing, with an area of only 721 square meters.

2.2.2. Location-Based Service Data

The LBS data used in this study are provided by mobile information push service providers through applications like “Dianping”. Dianping (v11.8.13) is China’s main life service application (APP), with about 120 million monthly active users. This means that the per capita holding rate of Dianping is very high, and its data can well represent the real activity situation of residents. Location-based service (LBS) data are obtained after the application obtains location service authorization. It records users’ spatial positions at different times through signal transmission between mobile phones and base stations, with a spatial accuracy of about 5 m. Therefore, LBS data are one of the most suitable data sources for studying population activities at the micro-scale. It can continuously obtain users’ mobile phone signals, accurately reflect activity locations, and then infer activity trajectories [29]. Compared with traditional small-sample surveys such as questionnaires and interviews, LBS data has the advantages of objectivity and massive scale and can quickly obtain a large amount of real resident activity data in a short time.
The data in this study have undergone a series of preprocessing steps, including user merging, deduplication, and cleaning [30,31]. The specific information is shown in Table 2. Users who appear for less than 10 days in a month or have fewer than 5 daily trajectory points have been excluded. This ensures, to a certain extent, the spatio-temporal continuity of the effective user data after preprocessing, with the characteristics of wide spatial coverage and full-time coverage, meeting the requirements for spatio-temporal measurement of population residential and park activity locations. Among them, basic attributes include three age groups (0–18 years old, 18–60 years old, and over 60 years old) and gender (male and female). Spatiotemporal attributes include time (hours, minutes, and seconds) and spatial coordinates (longitude and latitude, with an error of about 5 m).
Furthermore, to further validate the reasonableness of the data used in this study, we fully agree with the suggestion to “add a spatial correlation test to confirm that the users’ location records are not related to the commercial areas”. We have analyzed the representativeness of the residential locations obtained from the LBS data to ensure the effectiveness of the information reflected by the data. Based on the rules for identifying home locations, a total of 104,700 users with home locations were identified. To analyze the representativeness of mobile phone users, we compared the population statistics of each district based on users’ home locations with the population statistics of each street in the 2021 Nanjing Statistical Yearbook. The results showed a Pearson correlation coefficient of 0.708 between the two, indicating that the residential location information of residents obtained through LBS data can well reflect the residential location information of the permanent population in Nanjing and has good representativeness.
It should be noted that using LBS data from a single app as a representative of the recreational activity demand of the population may have certain biases. In areas with low app user retention, such as older neighborhoods where older generations reside, there may be important park recreational activities that mobile LBS data cannot capture. The representativeness of Dianping users and their spatial distribution may affect the measurement of park demand. Similarly, using only continuous multi-day LBS data to identify people’s stable patterns may not reflect the seasonal variations in people’s park recreational needs and the differences between weekdays and weekends.

2.2.3. Housing Price Data

Lianjia is China’s largest housing rental and transaction platform, with about 371,000 housing sources in Nanjing, accounting for 10% of the city’s total housing stock and covering most of the main urban area. In addition, the housing transaction prices on Lianjia must be filed with the government management department, so the housing price data are true and credible. This study used Python to call modules such as requests_html, requests_cache, bs4.BeautifulSoup, and re in turn, and obtained 20,527 Nanjing housing data on Lianjia’s website (https://nj.lianjia.com/ (accessed on 2 October 2023)). The data information is shown in Table 3. Each data point represents the average housing price of a residential community and includes the longitude and latitude coordinates of its location. The smallest research unit in this study is the block surrounded by roads, so the average price of all communities in the same block is taken, and finally, 5048 housing price data at the block level are obtained.

2.2.4. Basic Geographic Datasets

The spatial data (rivers, roads), administrative division data (districts, streets), and area of interest data (different land use types, including residential, green space, commercial land, etc.) in this study were all extracted from Amap in October 2023 (https://www.amap.com/ (accessed on 2 November 2023)). The block unit data in the study were generated from the areas surrounded by roads of various levels in the city. The area of interest data were also extracted from Amap in October 2023, and a total of 15,680 data items were obtained, containing 43 subcategories. For the convenience of research, three categories, including residential buildings, unit compounds, and staff dormitories, were merged into residential land, and five categories, including parks, zoos, botanical gardens, tourist attractions, and city squares, were merged into park green spaces, as shown in Table 4.
Compared with the point-of-interest (POI) data commonly used in previous studies, this study employs AOI area data. Compared with point data, AOI area data can more accurately reflect the scope of residential areas, urban park green spaces, and other regions, which is of great significance for this study to analyze the supply and demand relationship between residential areas, surrounding park green spaces, and residents.

3. Methodology

3.1. Research Framework

This study aims to assess the spatial equity of urban park green space (UPGS) layout and explore the influence of resident heterogeneity on it. The research framework (Figure 2) consists of four main parts described in Section 3.2, Section 3.3, Section 3.4 and Section 3.5, respectively:

3.2. Analysis of Residents’ Movement Tracking, Residential and Recreational Areas

This study employs the ST-DBSCAN method, a clustering approach based on activity density, to process LBS data. The idea is to identify stay points and stay durations based on the same user ID and determine the type of stay behavior by combining the land use attributes of the stay points. The ST-DBSCAN method calculates all stay points of the same user in chronological order, clusters multiple stay points with a spatial distance of less than 100 m and a time gap of less than 15 min into one activity point (represented by the geometric center of the multiple stay points), and adds up the total activity duration [32,33]. The type of activity and its duration at that location can be determined based on the land use type of the block where the stay point is located. According to the Athens Charter, the four basic activities of urban residents are living, working, recreation, and transportation. However, transportation behavior does not occur at a fixed location, and Chinese families mainly depart from their residence to visit park green spaces for recreation. Therefore, this study only identifies two types of activities, residence and recreation, through activity points.
According to the AOI attributes of the land parcel, the activity type of residents’ stay points can be inferred. If a resident stays in a park green space, it is determined to be a recreational activity. If staying on residential land, according to the work and life patterns of Chinese society, residential land stays between 20:00 and 8:00 the next day are determined as residential activities. To avoid the randomness of single-day activities, this study selects a week (17–24 October 2023) of residents’ activity trajectories, eliminating special situations such as extreme weather. If a resident has multiple residential stay points, their residence is determined based on the frequency and total duration of stays.

3.3. Resident Attribute Classification Based on Characteristic Indicators

In addition to overall measurement, this study focuses on in-depth research on the spatial heterogeneity of different groups in terms of park green space equity, discussing the potential spatial differences from the perspective of different group characteristics. People’s recreational needs are influenced by natural and social characteristics, mainly age, gender, income, etc. To explore the heterogeneity of different groups, this study uses multi-dimensional characteristic indicators to divide people into different types. Age, gender, and residence of survey resident are based on LBS data. The residential place is spatially matched with the average housing price of a residential community. First, according to age, residents are divided into three categories: youth (0–18 years old), middle-aged (18–59 years old), and elderly (60 years old and above). This mainly refers to the main social roles of different age stages in China, namely students, workers, and retirees; these three groups have differences in lifestyle and activity time. Second, according to gender, residents are divided into two categories: male and female, considering the potential differences between men and women in activity space and recreation methods. Furthermore, according to the housing price level of the residential block to represent the income level of residents, residents are divided into three categories: high income (housing price over 10 million yuan), middle income (housing price 2–10 million yuan), and low income (housing price below 2 million yuan). This mainly refers to the relevant research on the income level of residents in Nanjing, and combined with the per capita disposable income level of Nanjing (66,140 yuan in 2021), three income levels are set. Finally, by combining the above three types of attributes, 18 types of resident groups are generated for analyzing the potential differences between different groups in park green space equity and their spatial heterogeneity.

3.4. Measuring the Heterogeneity of Residents

For decades, researchers have been working on developing methods to measure the degree of differentiation among urban populations [34]. In this study, the improved Entropy Index (EI) is used to quantitatively measure the degree of heterogeneity of urban residents [35]. Specifically, EI is used to measure the degree of isolation of resident groups in each street unit, that is, the degree of heterogeneity of resident groups. The higher the value, the higher the diversity. The degree of resident heterogeneity (EI) is calculated using the following formula:
P x 1 = x 1 / ( x 1 + x 2 + + x n )
In Formula (1), x 1 , x 2 , …, x n are the number of a certain type of population, and P(x1) is the ratio of the number of x 1 population to the total population in the spatial unit.
H x = x P x log 2 P x
In Formula (2), x and P x have the same meaning as in Formula (1), and H(x) represents the diversity of population types in each street unit.

3.5. Measuring the Spatial Equity of UPGS Layout

The spatial equity of UPGS layout refers to the balanced distribution of park green spaces in space, that is, whether different locations and different groups can fairly enjoy UPGS resources and services [36,37]. Its fundamental connotation lies in the matching of UPGS spatial accessibility with residents’ usage needs, while both accessibility and needs are influenced by the socioeconomic attributes of the population [34]. Therefore, the essence of UPGS spatial equity is the spatial matching of UPGS supply and recreational demand against the background of resident heterogeneity.
To quantitatively evaluate the spatial equity of the UPGS layout, this study constructs a supply–demand matching model. The model includes two dimensions: UPGS supply and resident demand, which are represented by accessibility indicators and behavior density indicators, respectively, and then the supply–demand matching degree is calculated. On this basis, heterogeneity factors are introduced to modify the model and explore the impact of resident heterogeneity on UPGS equity. The measurement of UPGS spatial equity in this study is more comprehensive, considering not only the spatial layout of UPGS but also the usage needs and heterogeneity characteristics of residents, which can provide more refined decision-making references for urban park green space planning.

3.5.1. Analysis of Demand Level

In this study, demand is defined as residents’ behavioral intention to use urban park green spaces for recreation, reflecting residents’ potential usage intensity of park recreational services. In existing studies, population density is often used to represent urban residents’ demand for urban park green spaces; that is, the concentration of recreation demand is represented by the agglomeration of population in space, with the premise of assuming that all residents have the same recreation demand. However, there are objective differences in the recreational needs of different individuals. Therefore, this study uses population behavior density to represent the level of residents’ recreational needs, counting the number of stays of the same resident in urban park green spaces and calculating the density of residents’ recreational behavior. Compared with population density, behavior density considers the differences in residents’ recreational activity needs and can directly reflect the usage demand for urban park green spaces. The level of residents’ recreational needs demand level ( D l ) is calculated using Formula (3).
D l = Σ k = n j B k n F
where B k n represents the frequency of recreational activities of the nth individual in unit l in a week, F is the area of unit l , and j is the total number of residents in unit l .

3.5.2. Analysis of Park Supply Level

Supply refers to the recreational carrying capacity provided by urban park green spaces, reflecting the ability of urban park green spaces to meet the recreational needs of residents. Therefore, this study measures the accessibility of parks to represent their supply level. Accessibility is widely used to assess park service levels, and common methods include the cost method, container method, and spatial interaction model method. This study explores the supply capacity of urban park green spaces in an ideal state, without considering residents’ preferences for different parks. Therefore, the cost method is chosen, using the distance from residents to the nearest park to represent accessibility. GIS road network analysis is used to measure accessibility, which is more in line with actual travel than Euclidean distance. Specifically, the road distance from the street where residents live to the boundary of the nearest park is calculated as the accessibility indicator. The park supply level ( S l ) is calculated using Formula (4).
S l = Σ k = n j A k n j
where A k n represents the accessibility level of the nth individual resident in unit l to the nearest urban park green space (based on the network distance value obtained from road network analysis, and then taking its derivative to convert it into an accessibility level), and j is the total number of residents in unit l .

3.5.3. Analysis of Spatial Equity Level

Spatial equity refers to the balance between the supply of urban park green spaces and the recreational demand of residents within a spatial unit. This study focuses on the difference in the supply–demand ratio within the region. Taking the overall supply–demand ratio as the benchmark, the differences in the supply–demand ratios of each street are compared to identify areas of supply–demand imbalance. The supply–demand ratios of 100 streets are calculated, and the overall supply–demand value is obtained to compare the differences between individual values and the total value. The spatial equity level ( S E L ) is calculated using Formula (5).
S E L = S l D l S m D m
where S l and D l represent the supply of urban park green spaces and the recreational demand of residents in unit l, respectively, while S m and D m represent the supply of park green spaces and the recreational demand of residents in all units, respectively.

4. Results

4.1. The Resident Identification with Recreational Behavior Based on LBS Data

Through the LBS data from 17–24 October 2023, this study identified 104,740 residents with recreational behaviors distributed in ninety-three street units in the main urban area of Nanjing (note: there are a total of one hundred street units in the main urban area of Nanjing, of which seven street units including Guabu Town, Yeshan Town, Zhu Town, Longpao Town, Maji Town, Changlu Street, and Tangquan Farm did not identify residents with recreational behaviors due to the small amount of data, making it difficult to identify regular resident behaviors), accounting for 1.5% of the total population of Nanjing, which is basically consistent with Dianping’s market share in China (i.e., about 18.90 million daily active users in 2023, with a Chinese population of about 1409.67 million [38]). Figure 3 divides the output street units into five categories according to the Jenks Natural Breaks algorithm [39], which creates breaks by grouping similar values (i.e., the number of Nanjing residents here) together in the best way and maximizing the differences between categories. Figure 3 shows that the population density of residents with stable recreational behaviors in the main urban area of Nanjing decreases in rings from the central area (average 2.92 people/km2) to the suburban area (average 0.22 people/km2) to the metropolitan area (average 0.04 people/km2). It is not difficult to see that the residential areas of residents with stable recreational behaviors in the main urban area of Nanjing are spatially concentrated in the central area of Nanjing. Residents in the metropolitan area of Nanjing rarely have stable recreational behaviors. This distribution characteristic is consistent with the trend of population agglomeration towards the central urban area during the urbanization development process of Nanjing [40].
When investigating the overall equity of urban park green space layout in the main urban area of Nanjing, this study divides the identified 104,740 residents with recreational behaviors into 18 types of resident groups from three dimensions: age, gender, and income, according to the resident attribute identification method described in Section 3.2 (Figure 4). It is worth noting that the middle-aged (18–60 years old) male middle-income group accounts for the highest proportion of the total population, reaching 21.72%. The second is the middle-aged female middle-income group, accounting for 17.08%. This indicates that among the residents with stable recreational behaviors in the main urban area of Nanjing, the middle-aged and middle-income groups are the main ones, and males are slightly more than females. This is consistent with the characteristics of the population structure in Chinese cities, where the middle-aged population accounts for a high proportion and the middle-income group is the main force [41].

4.2. Spatial Pattern of UPGS Supply and Demand

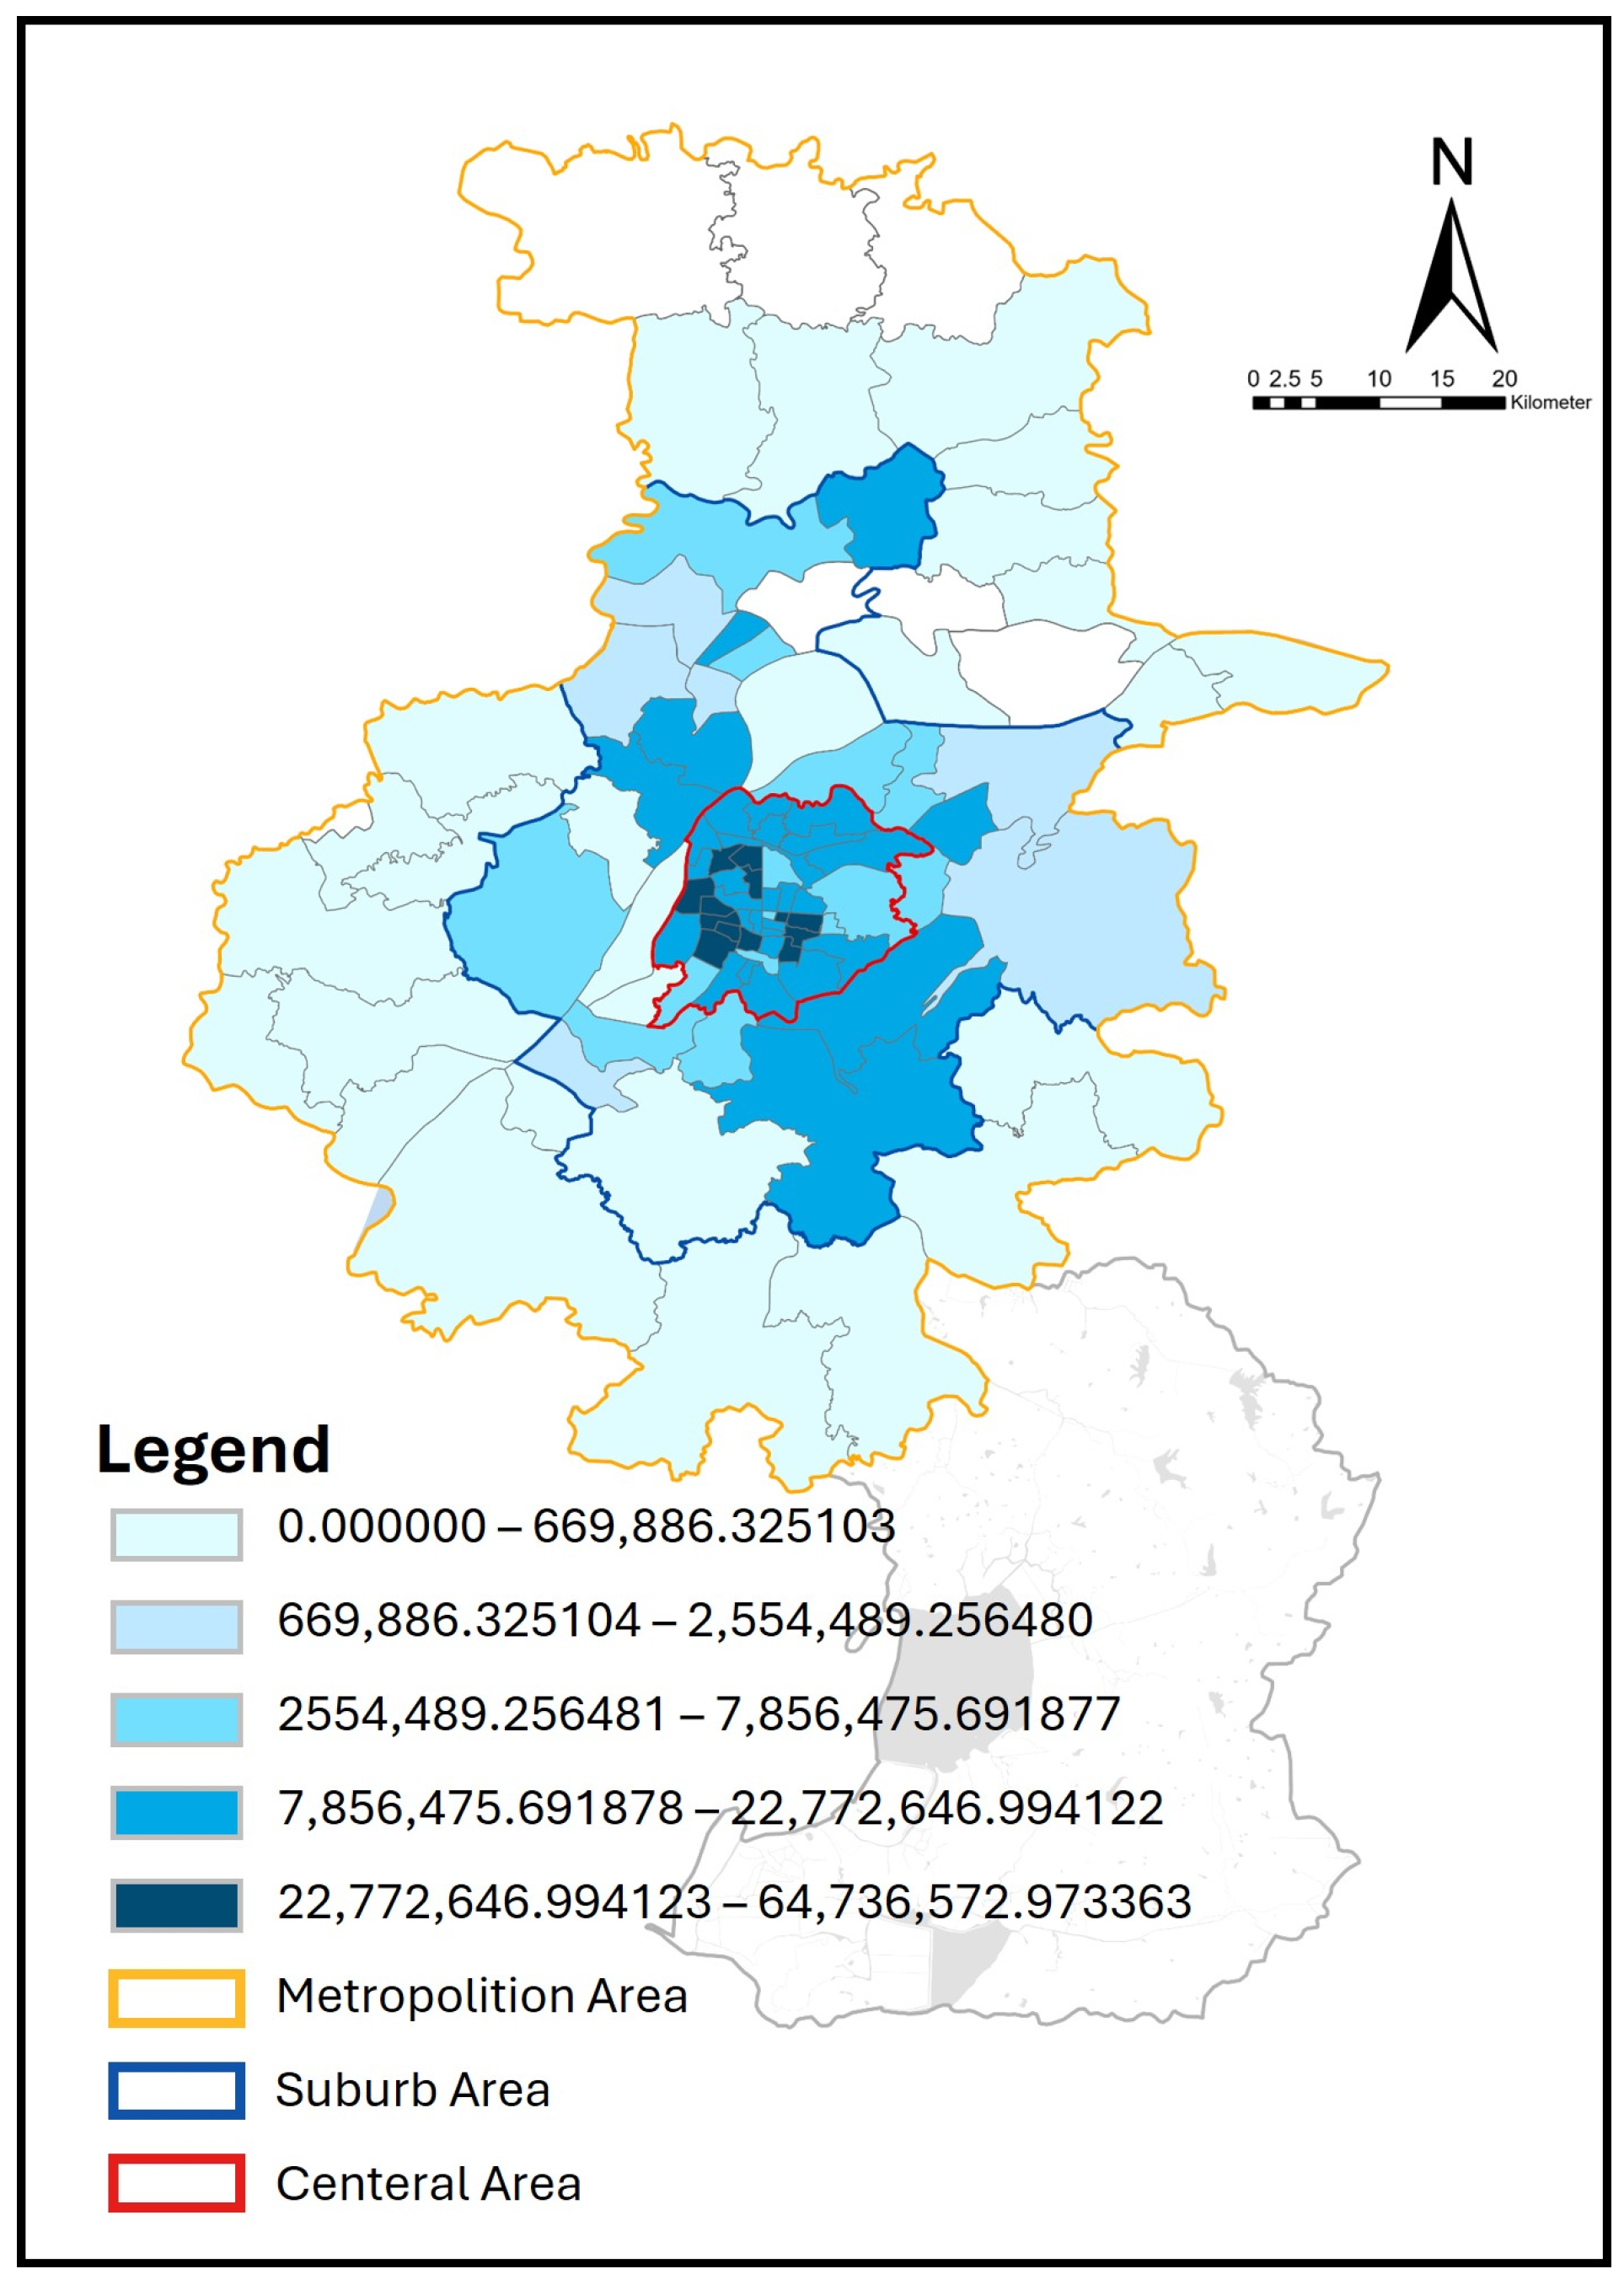
4.2.1. Spatial Pattern of UPGS Supply

This study involves a total of 177 urban park green spaces in Nanjing, including all municipal park green spaces within the main urban metropolitan area of Nanjing; park green spaces that have not undergone urban development and construction and are included in the Nanjing green space system planning are not within the scope of this study. The visualization analysis results show (as shown in Figure 5a) that, from a spatial distribution perspective, the average supply level of urban park green spaces in the metropolitan area of Nanjing is far higher than the average supply level of urban parks in the central and suburban areas of Nanjing. This situation is in stark contrast to the average area proportion of urban park green spaces within each street unit. The average area proportion of urban parks in each street unit in the suburban and central areas of Nanjing is significantly higher than that in the metropolitan area of Nanjing. This is also consistent with the results of the Nanjing Urban Landscaping Satisfaction Survey Report in 2021. The report shows that in daily life, 91.2% of residents pay attention to the situation of urban park landscaping, and 73% of residents visit park green spaces for recreation; however, residents still generally believe that the coverage of urban park green spaces is insufficient [42]. This reflects the spatial imbalance of urban park green space layout in the main urban area of Nanjing. The central urban area and near suburbs have advantages in terms of the number of parks, but their accessibility is not as good as the outer metropolitan area. In addition, this also reflects Bao et al.’s view on the urban landscape pattern. As urban construction land continues to expand, it fills most of the open spaces in the urban area, leading to a reduction in the artificial landscape edges with original diversity distribution and the loss of a large number of scattered natural patches [4].

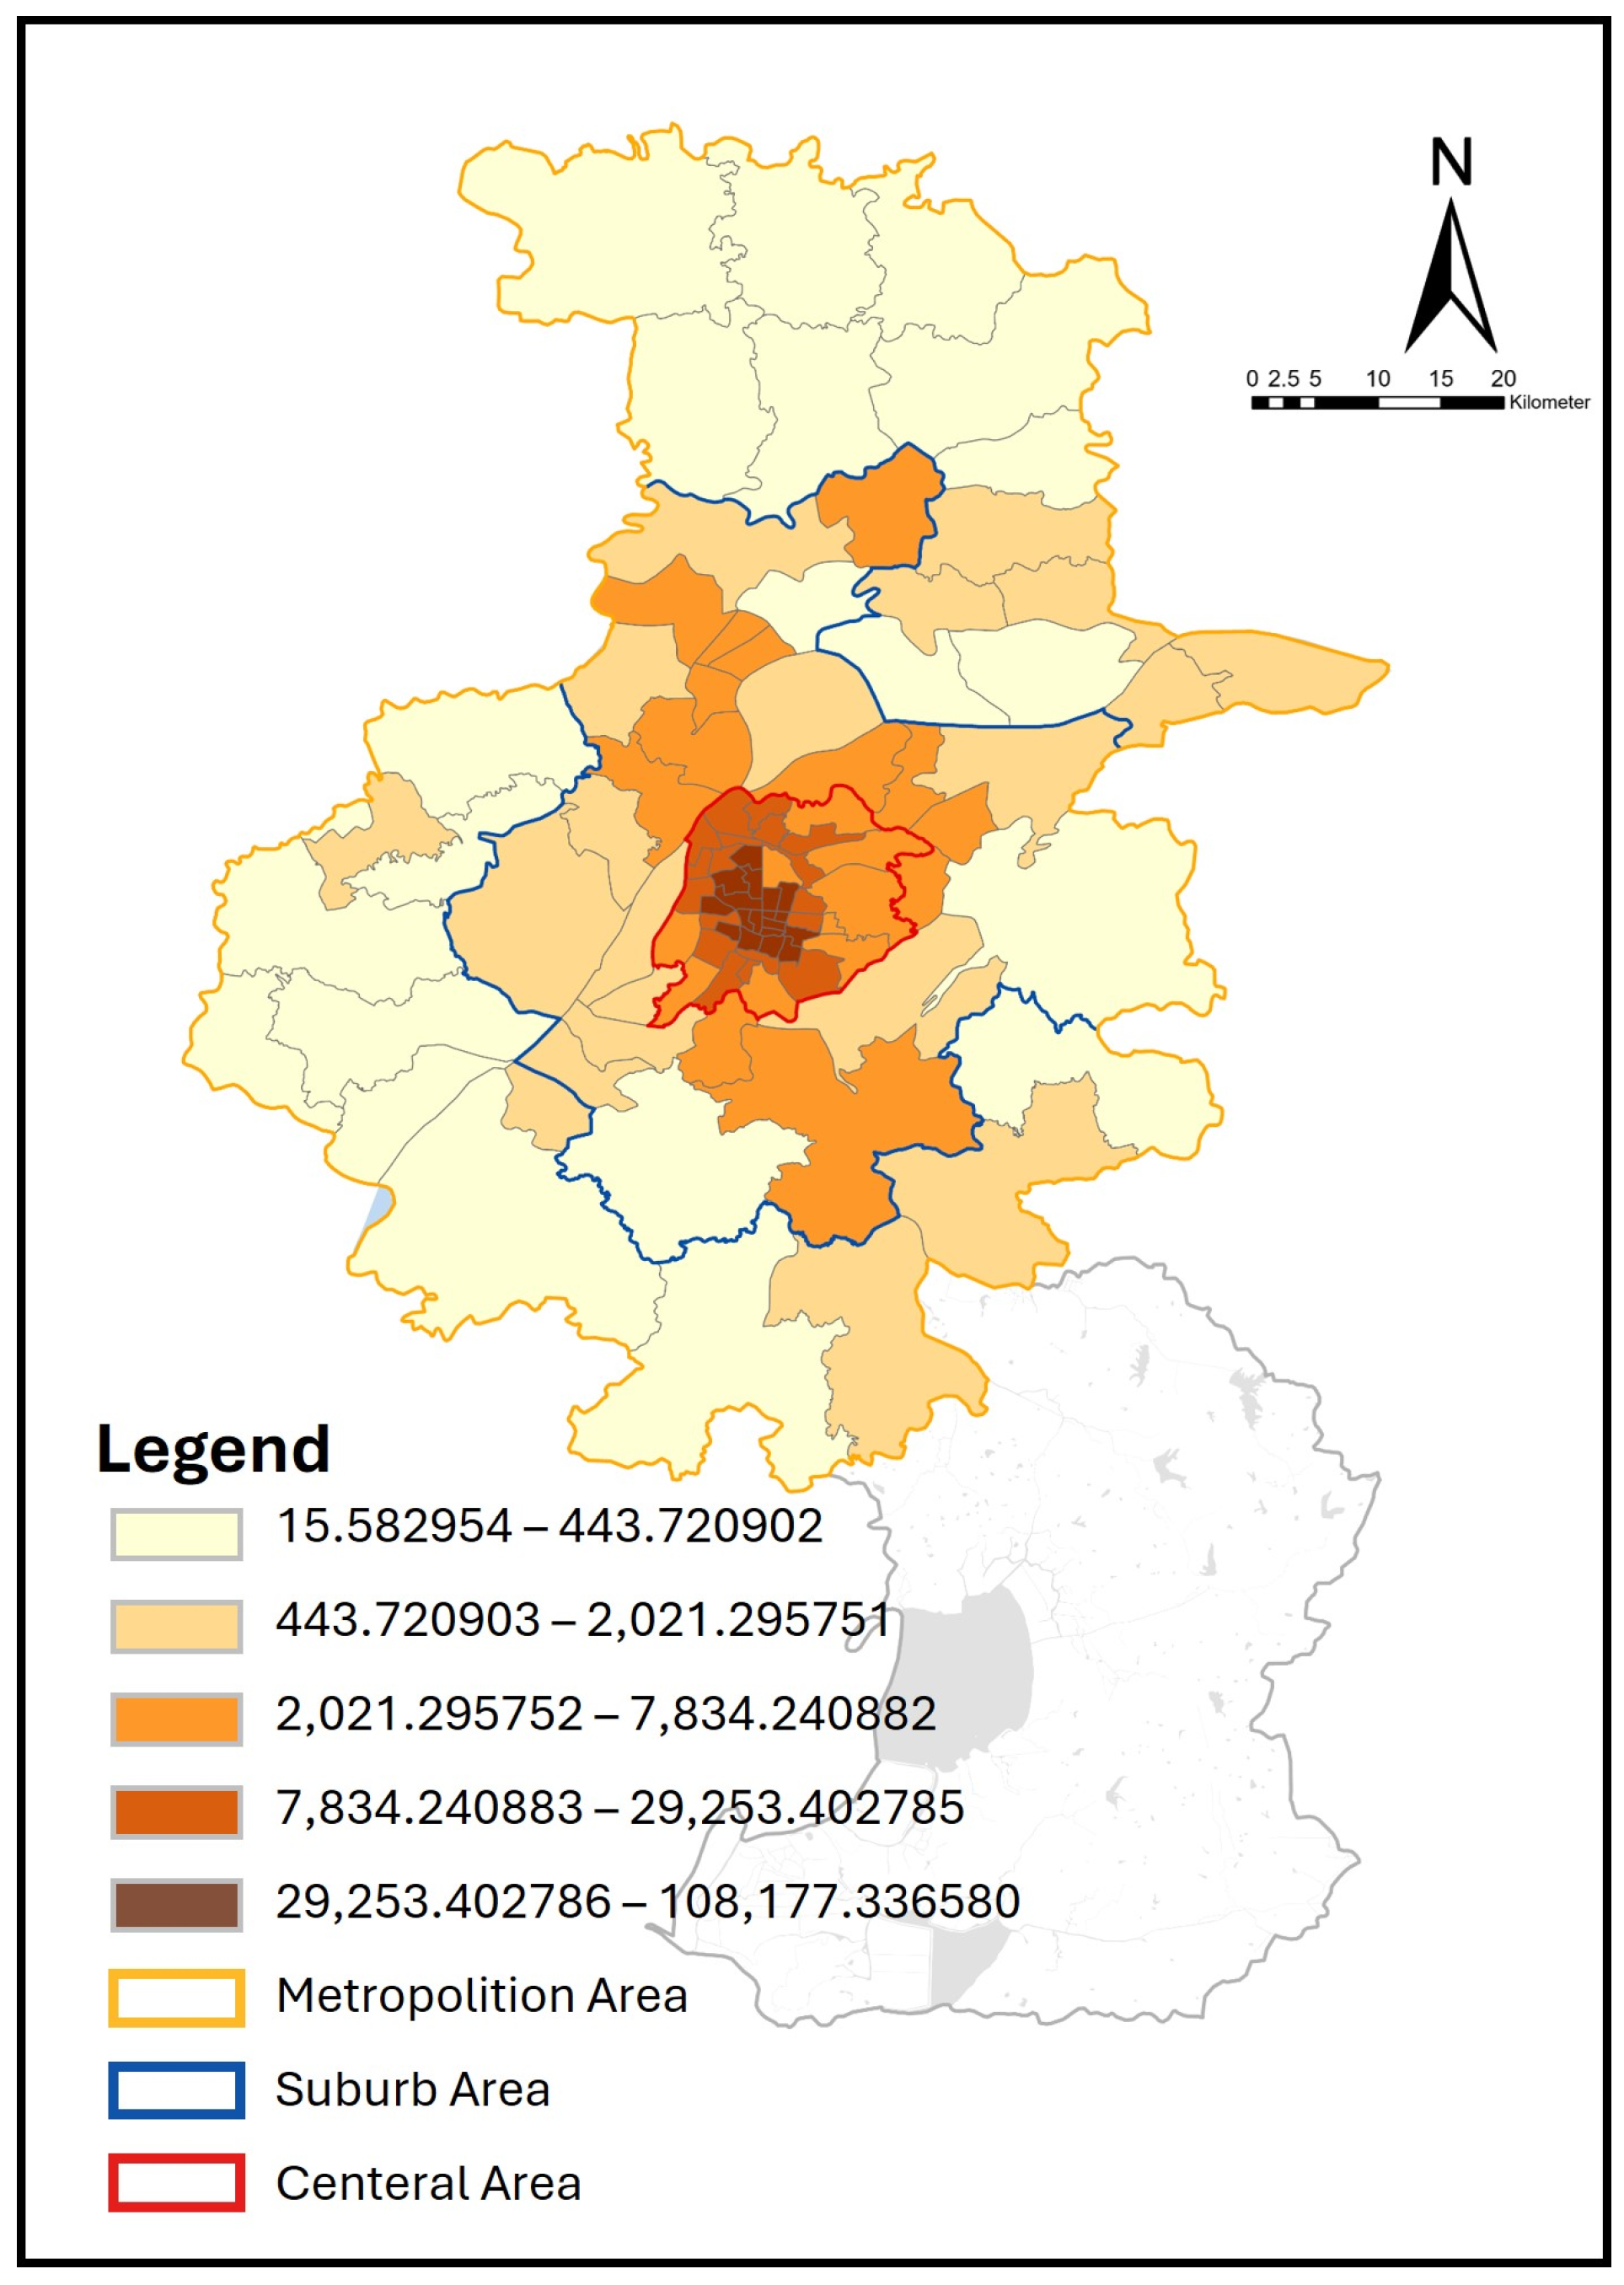
4.2.2. Spatial Pattern of UPGS Demand

According to Figure 5b, the distribution of residents in Nanjing is consistent with the overall trend of recreational demand in the area (as shown in Figure 3 and Figure 5b). The population density of residents in Nanjing decreases in rings from the central area (average 2.92 people/km2) to the suburban area (average 0.22 people/km2) to the metropolitan area (average 0.04 people/km2). The areas with high recreational demand levels in Nanjing are mainly concentrated in the central area of Nanjing (average demand level value of 56.35 times/km2) and some suburban areas (average demand level value of 12.76 times/km2), while in the metropolitan area of Nanjing, there is a cliff-like drop (average demand level value of 0.29 times/km2) (Figure 5b). This is in line with our empirical understanding that the demand of urban residents for related facilities increases with population density [43], that is, the intensity of recreational demand in densely populated areas is higher than that in sparsely populated areas. At the same time, this also reflects that the park green spaces in the central urban area of Nanjing are facing enormous recreational pressure.

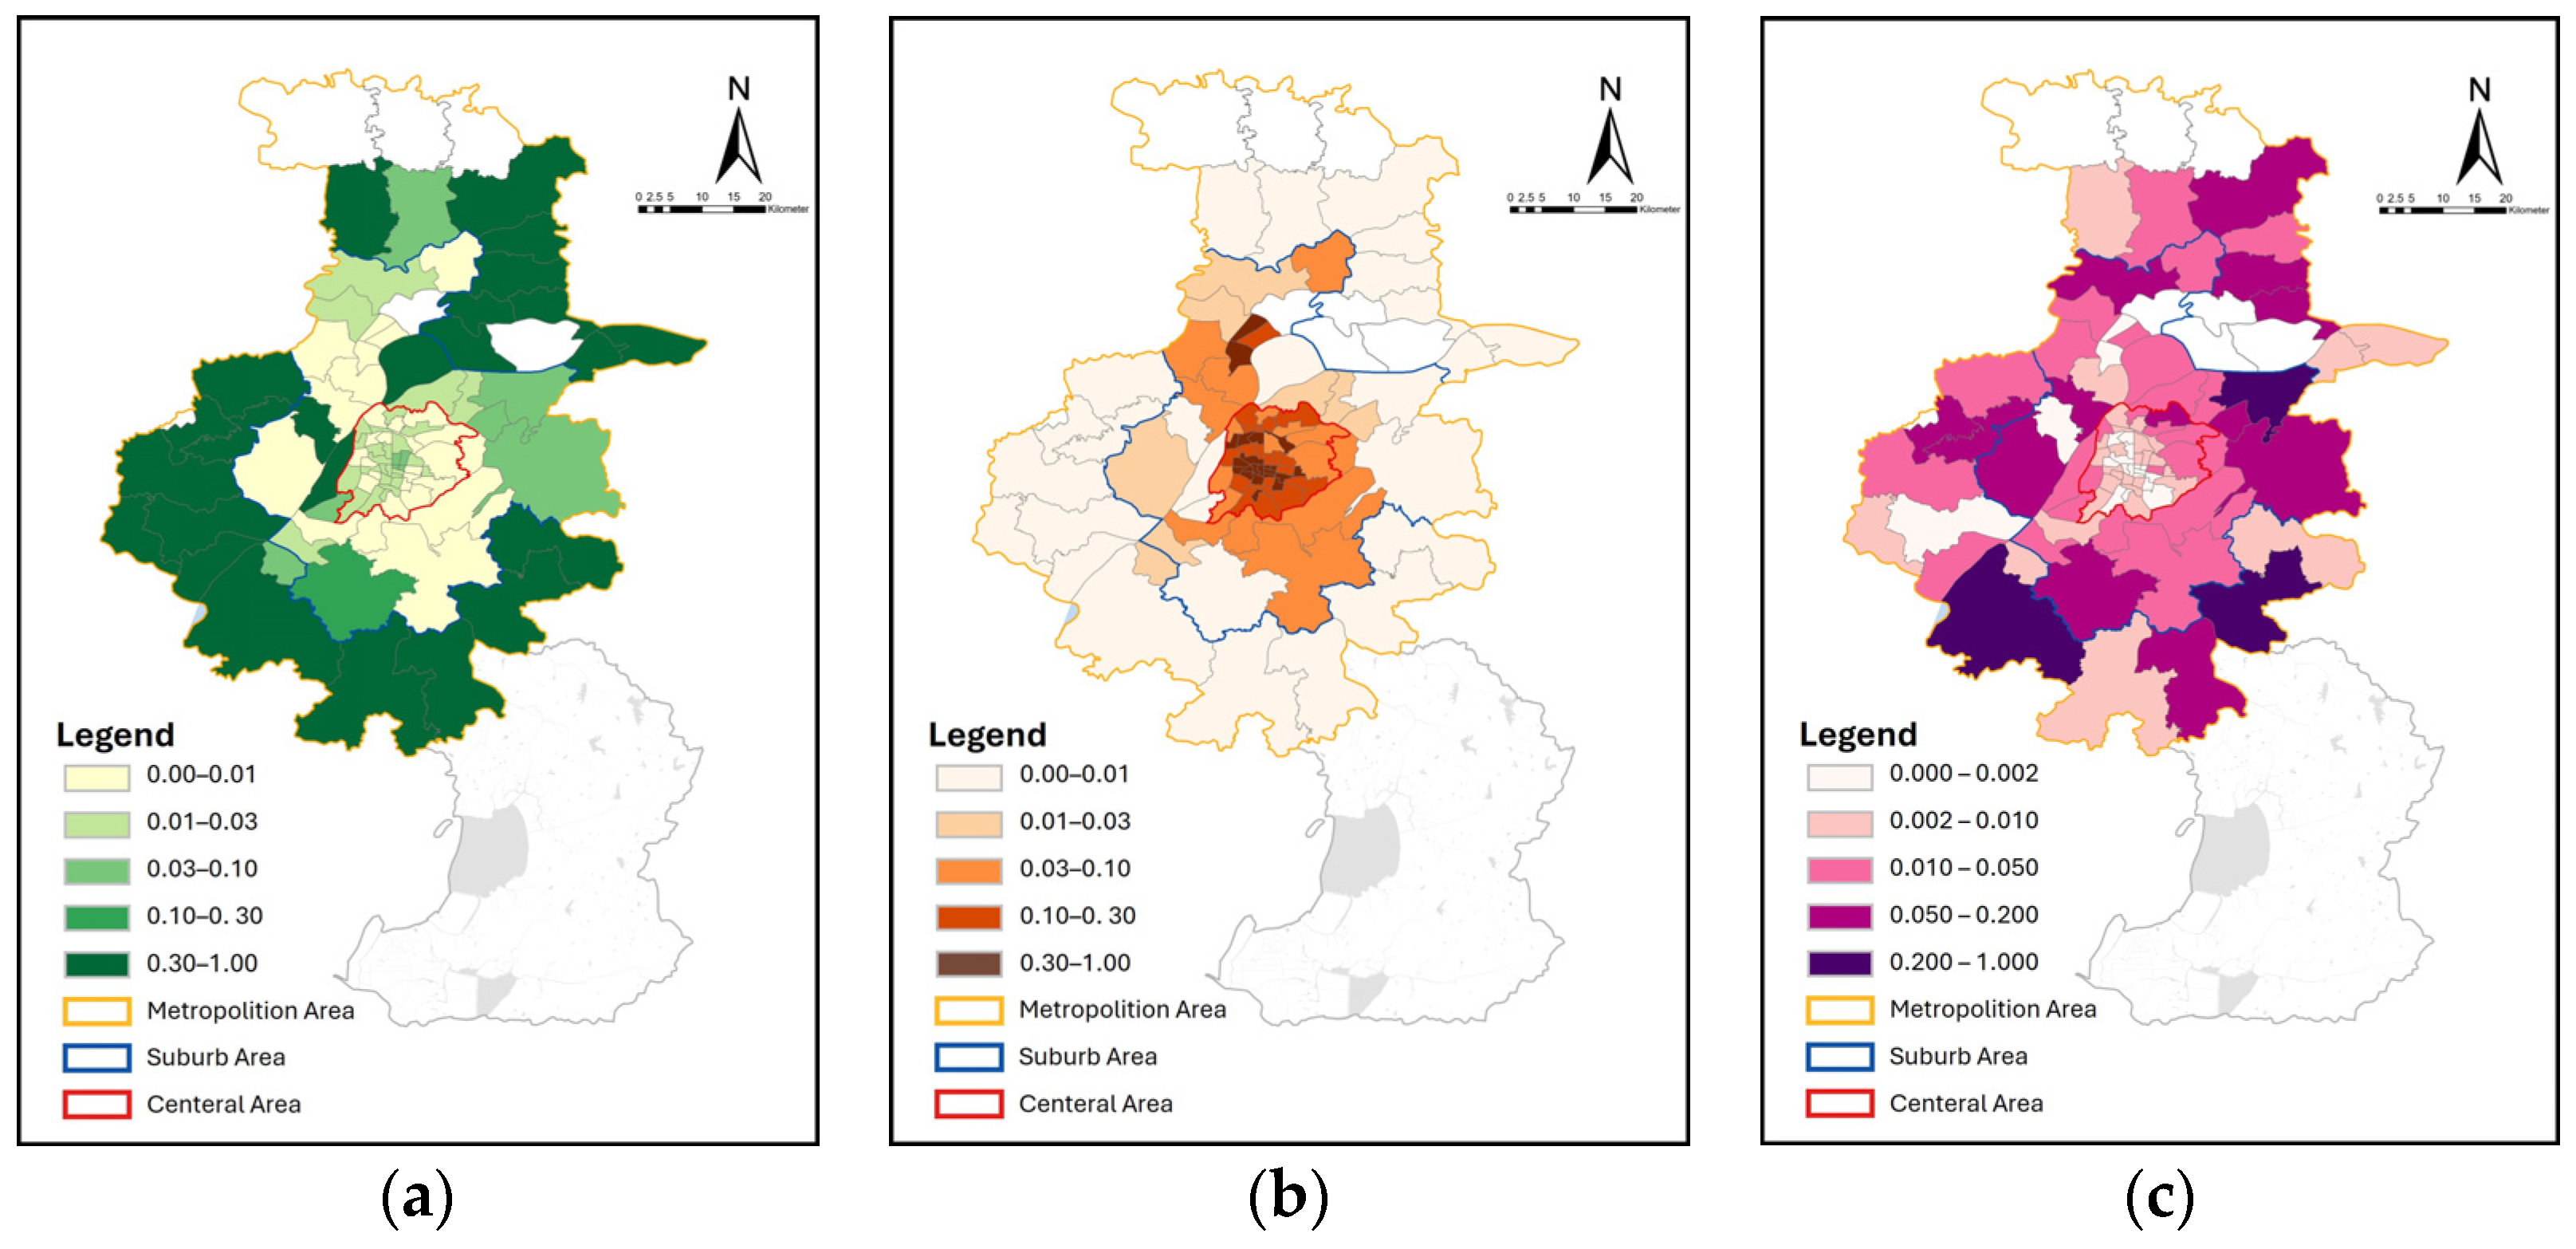
4.2.3. Spatial Pattern of Fairness in UPGS

Based on the above results of resident types with recreational behaviors in the main urban area of Nanjing divided by attributes and according to the method in Section 3.3, the overall spatial equity of urban park green space layout in the main urban area of Nanjing is calculated. The visualization analysis results show (as shown in Figure 5c) that the overall spatial equity index of urban park green space layout in the main urban area of Nanjing has huge variability with the population distribution of residents with recreational behaviors in the main urban area of Nanjing (Figure 3 and Figure 5c). In general, the lower the overall spatial equity of urban park green space layout in a street unit in the main urban area of Nanjing, the higher the population density of residents with recreational behaviors. The high-value areas of the overall spatial equity of urban park green space layout in the main urban area of Nanjing mainly appear in the metropolitan area of Nanjing, while the low-value areas are mainly concentrated in the main urban area of Nanjing. This reflects the serious imbalance between urban park supply and residents’ recreational demand in Nanjing. Especially in the densely populated central urban area, the supply of parks is seriously insufficient. Zhang and Yan’s research also found that urban park resources in densely populated downtown areas are often in short supply [44]. There may be two reasons for this phenomenon: first, the central urban area has a high development intensity, and the land resources available for the construction of park green spaces are very limited; second, with the rise of suburban new towns, high-quality public service resources such as large comprehensive parks are dispersed to the periphery.

4.3. The Overall Spaitl Equity of UPGS Layout Based on Resident Heterogeneity

According to the method in Section 3.4, this study calculates the degree of resident heterogeneity to better investigate the spatial equity of urban park green space layout in each street unit of the main urban area of Nanjing. The average resident heterogeneity of street units in the central area of Nanjing is 0.17 (standard deviation of 0.17), the average resident heterogeneity of street units in the suburban area of Nanjing is 0.03 (standard deviation of 0.04), and the average resident heterogeneity of street units in the metropolitan area of Nanjing is 0.00 (standard deviation of 0.00) (as shown in Figure 6). The resident diversity of street units in the suburban and metropolitan areas of Nanjing is infinitely close to 0, indicating that, in terms of resident heterogeneity, the resident structure of each street unit in the metropolitan area of Nanjing is relatively single. At the same time, the number of residents in each street unit in the metropolitan area of Nanjing is also the least (average population of 3 people, as shown in Figure 3), which means that a smaller population size will lead to smaller resident heterogeneity, resulting in higher spatial equity of urban park green space layout. This result is also consistent with the research results of Zhang and Xu: the more single the resident type of a street unit, the more prominent the spatial pattern of its recreational demand for urban parks [45], and therefore, in the process of urban renewal or reconstruction, government departments or relevant staff can more easily coordinate their opinions and provide them with better services [46].
To further verify the relationship between resident heterogeneity and park green space spatial equity, the study conducted a Spearman correlation analysis on the two. The results show that the resident heterogeneity index is significantly negatively correlated with the park green space spatial equity index at the 0.01 level (correlation coefficient = −0.866, p-value = 0.001); that is, the higher the resident heterogeneity, the lower the park green space spatial equity.

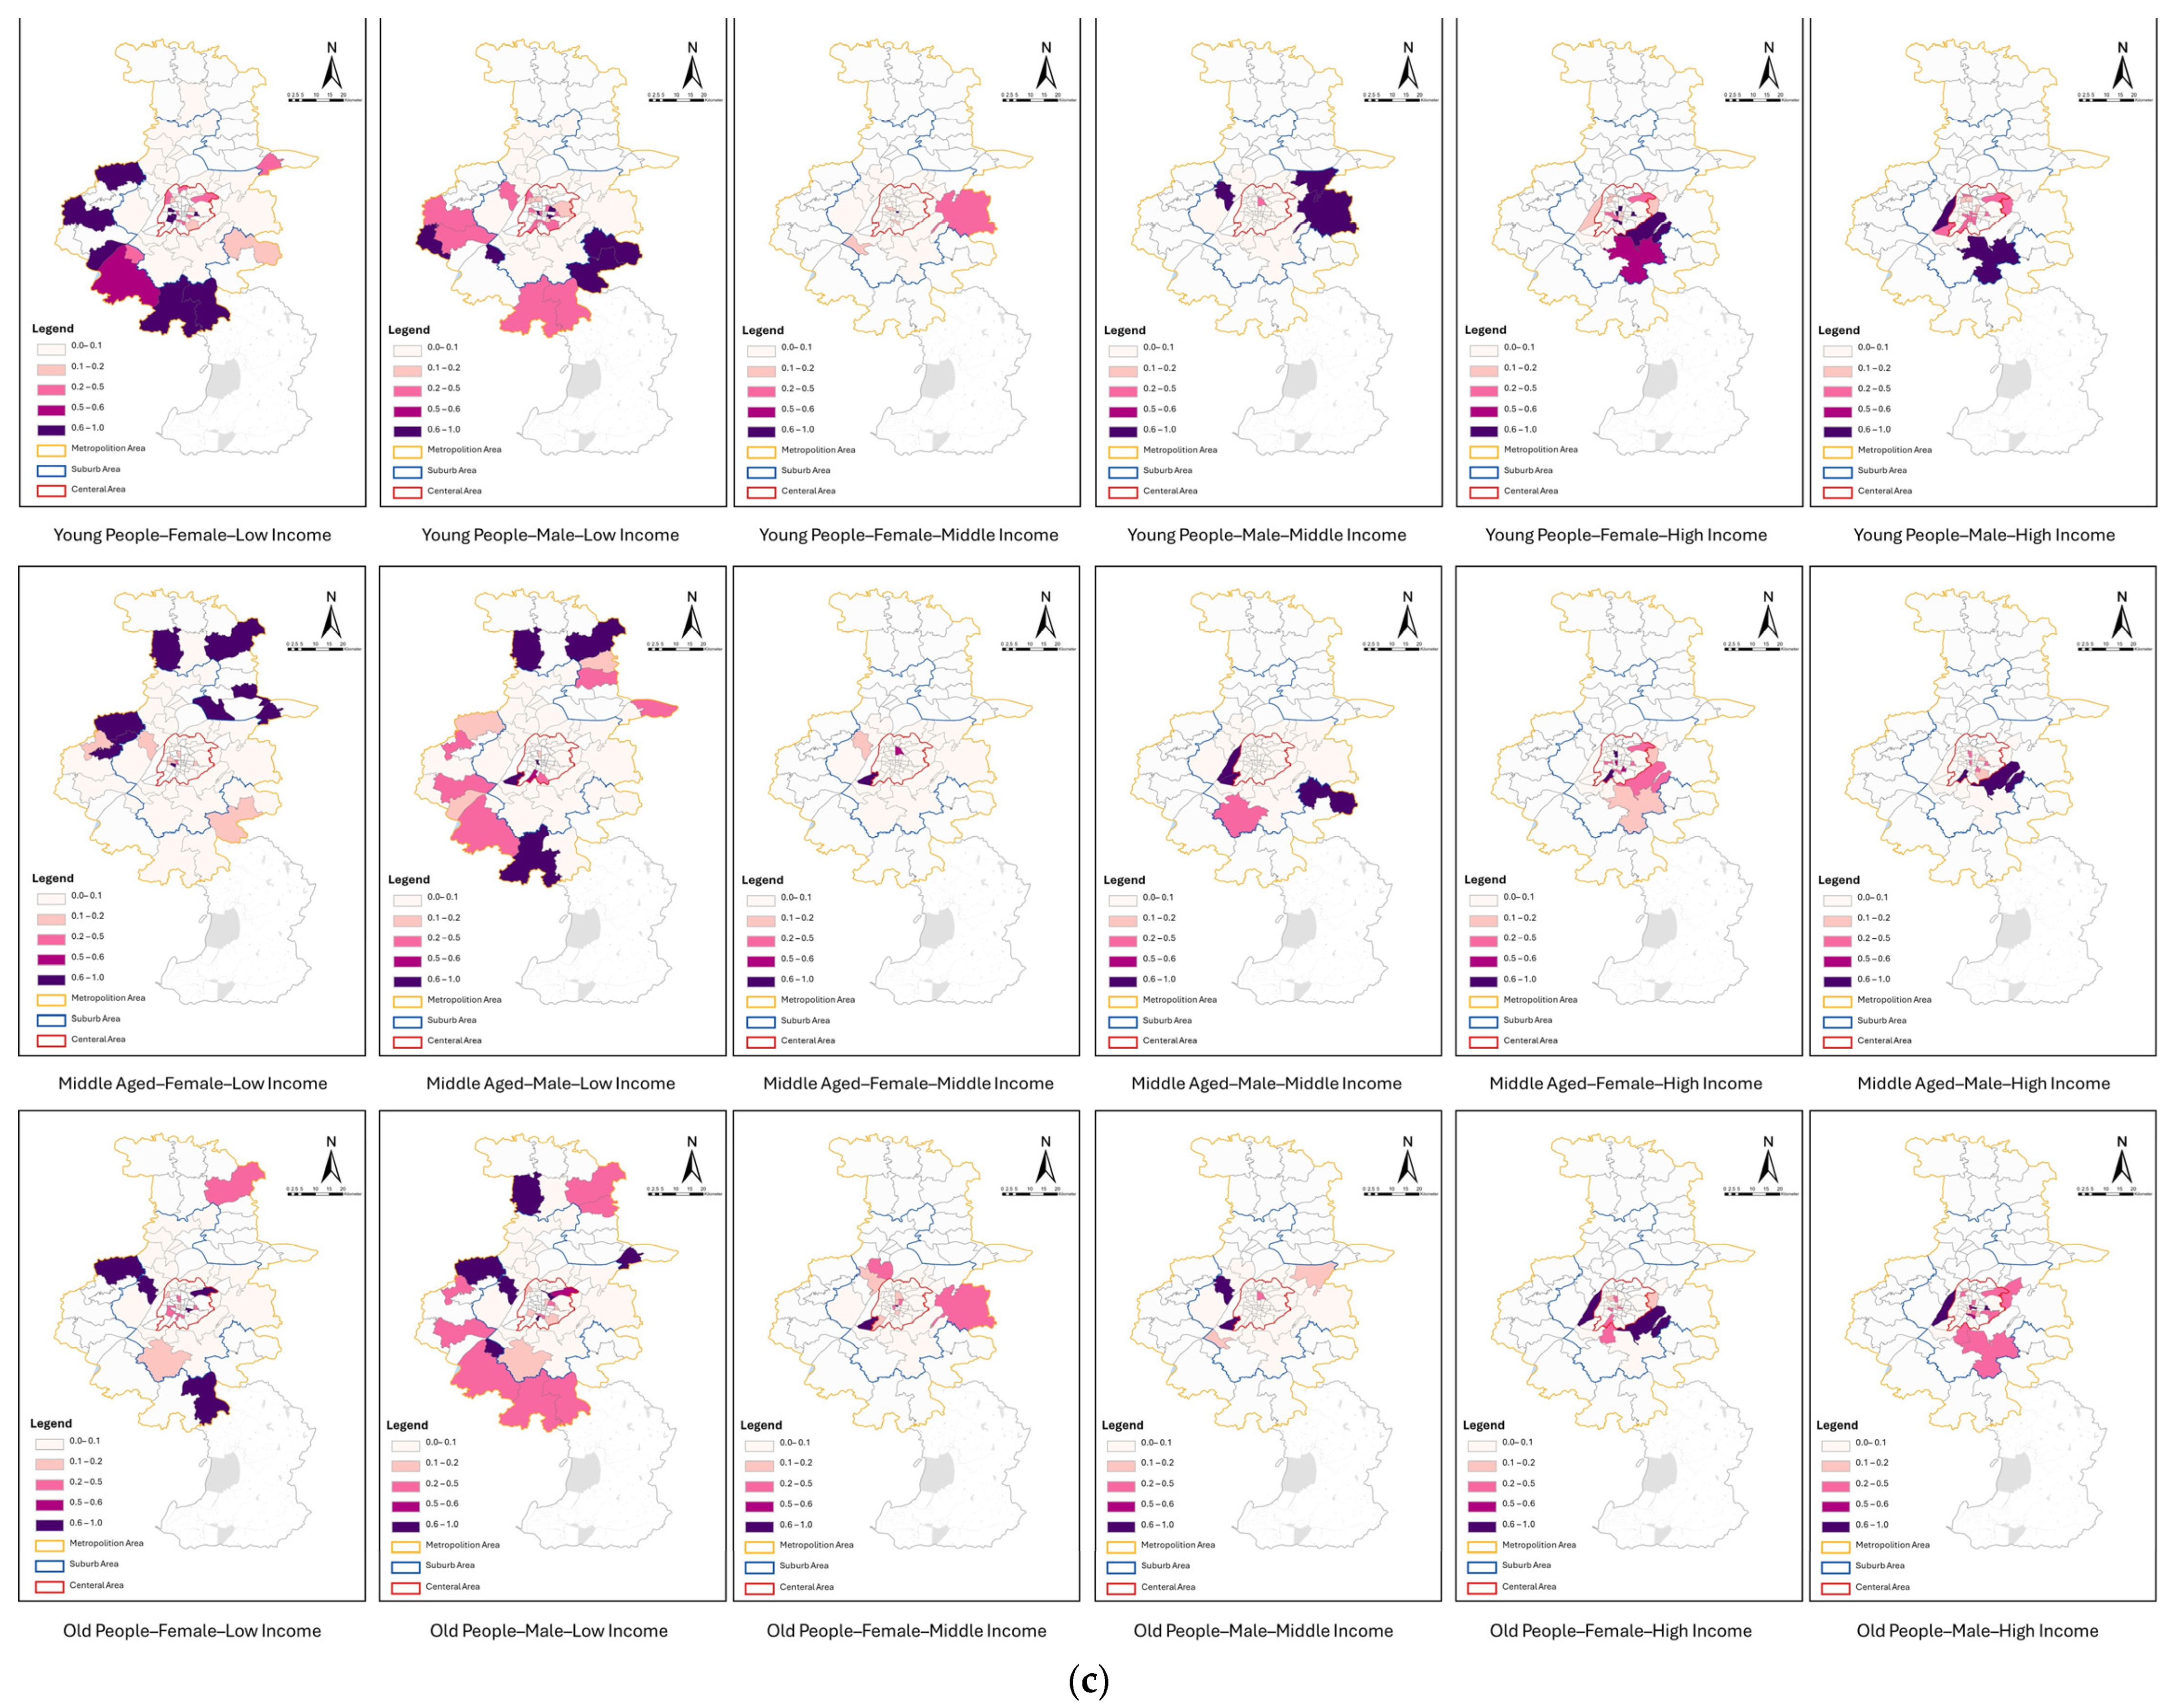
4.4. Comparison the Spatil Equity of UPGS Layout among Different Types of Residents

Focusing on the spatial equity of urban park green space layout for different types of residents, the study found that the attribute of residents’ income level plays a key role in the overall supply and demand levels of urban park green spaces for all 18 types of resident groups identified, as shown in Figure 7. Among them, the average values of the overall supply and demand levels of urban park green spaces for low-income resident groups are the highest, while the average spatial equity level values of low-income resident groups are seriously insufficient in many street units in the central and suburban areas of Nanjing with a high degree of resident heterogeneity. This indicates that the current layout of urban park green spaces in the center and suburbs of Nanjing is extremely inequitable for low-income resident groups. This is consistent with the view of existing research that low-income groups are at a disadvantage in enjoying urban public resources [47].
Figure 7 further shows the distribution of supply level values, demand level values, and spatial equity level values of various types of resident groups in each street unit of the main urban area of Nanjing. Taking the middle-aged male-low-income resident group with the largest number of people in the low-income resident group as an example, the average values of its supply level and demand level values in the central, suburban, and metropolitan areas of Nanjing are 0.6641, 0.6437, 0.6415, and 0.0010, 0.1336, and 0.1076, respectively, while the average values of its SEL values in the central, suburban, and metropolitan areas of Nanjing are 0.2518, 0.0339, and 0.0908, respectively. This means that increasing the supply level of urban park green spaces to meet the growing recreational needs of residents in the area may not necessarily improve the spatial equity of urban park green space layout in the area. This is possible because, compared with other types of resident groups, low-income resident groups are disadvantaged groups in cities. Although this type of resident group is not disadvantaged in terms of population size, they often suffer unfair treatment in the process of enjoying urban public resources due to their neglected needs [48]. On the other hand, this conclusion also confirms, to a certain extent, the conclusion we obtained in Section 4.3. When the degree of resident heterogeneity in the area is lower, the needs of different types of residents within the area will be paid attention to, which is why the spatial equity level values of low-income resident groups are extremely low in the central and suburban areas of Nanjing with a high degree of resident heterogeneity.

5. Discussion

This study explores the important research theme of spatial equity in urban park green space (UPGS) layout through a case study of residents with stable recreational behaviors in one hundred street units in the main urban area of Nanjing. This study utilizes LBS data to conduct a fine-grained exploration of the heterogeneity of residents with stable recreational behaviors, supplementing the deficiencies of existing research. LBS data contains users’ spatiotemporal trajectory information and social attributes such as gender and age, which helps to accurately identify the spatiotemporal behavior characteristics of different types of resident groups and conduct classified analysis.
The results show that the spatial equity of the UPGS layout in the main urban area of Nanjing is negatively correlated with resident heterogeneity. In other words, the higher the degree of resident heterogeneity in a street unit in the main urban area of Nanjing, the lower the spatial equity of the UPGS layout within it, especially in the central urban area of Nanjing’s main urban area. From the analysis of resident attributes, the income attribute of residents acts as a dominant factor influencing the spatial equity evaluation of UPGS layout by residents with recreational behaviors in the main urban area of Nanjing. This finding has been rarely discussed in early UPGS research but is closely related to promoting the spatial equity of UPGS layout [49]. This study can provide references for optimizing the UPGS layout in Nanjing and other Chinese cities with similar socioeconomic backgrounds and lay the foundation for formulating various UPGS strategic planning recommendations based on spatial equity and heterogeneity measurement results [22]. For example, in the process of urban renewal and planning, targeted interventions can be carried out according to the behavior patterns of vulnerable groups accessing UPGS and their preferred park types, maximizing the park usage experience of such groups and promoting the spatial equity of UPGS layout.
The innovations of this study are reflected in the following aspects. First, the research scale is refined, using the street unit as the basic spatial unit, which helps to finely depict the spatial differentiation characteristics of park green space layout. Most previous studies are limited to aggregated data on larger spatial scales, and the results are prone to aggregation errors [50]. Second, the research data is rich, comprehensively utilizing multi-source data such as LBS data, AOI data, and housing price data, and directly and effectively identifying the social attributes of residents with recreational behaviors by using the attribute information such as user gender and age contained in LBS data and then dividing resident types, making up for the deficiencies of previous UPGS equity research. Third, this study investigates the heterogeneity of residents with recreational behaviors in the main urban area of Nanjing, which can better understand the needs and usage of UPGS by different types of resident groups, as well as the relationship between these situations and the spatial equity of UPGS layout. This provides a new perspective for exploring the equity of different socioeconomic groups in enjoying urban public resources.
This study still has some limitations. Firstly, the use of LBS data may cause certain biases. For example, people whose workplaces are located within UPGS or who frequently pass by parks in their daily lives may be misidentified as residents with recreational behaviors. This is mainly due to the complexity of human activities [51]. In the future, LBS datasets with longer time spans can be considered to confirm users’ real situations by examining their long-term behavior patterns. Secondly, the impact of the dimensions and number of resident group-type divisions on the measurement of resident heterogeneity. More diversified division dimensions and more refined attribute depictions can certainly help capture resident heterogeneity more comprehensively, but it may also lead to many resident types with extremely small scales, losing the significance of discussing these groups. Therefore, how to achieve a balance between statistical significance and interpretive significance is worth further exploration. Thirdly, this study uses LBS data from a single app as an indicator of the recreational activity demand of the population, which may have limitations. The demographic bias of Dianping users and the uneven spatial distribution of users may affect the accuracy of measuring social vitality. Areas with low user density may be underrepresented in the analysis. Similarly, using only continuous multi-day LBS data to identify people’s stable patterns may not reflect the seasonal variations in people’s park recreational needs and the differences between weekdays and weekends. Future research can integrate LBS data from multiple mobile operators, covering various apps, to understand park usage demand more comprehensively and objectively. In addition, supplementary analysis using Weibo data and community survey data in areas with low mobile user density can help validate and supplement valuable information about people’s park recreational activities.
This study also provides some insights for future related work. Firstly, quantitative methods such as geographically weighted regression (GWR) [46,52] and gradient boosting decision tree (GBDT) [53] can be used to further test the impact of resident group attributes on UPGS demand. Secondly, the supply–demand relationship of resident groups for UPGS can be explored at different spatial scales. At smaller scales, such as street blocks, LBS data can be combined with interview data to further analyze other characteristic indicators such as resident visit duration, utilization efficiency, and satisfaction with UPGS, in order to compensate for the insufficient display of resident recreational trajectories by LBS data, and to provide a clearer depiction of the supply–demand structure of UPGS [22,54]. Thirdly, in addition to the population diversity index used in this study, testing more heterogeneity measurement indicators in existing research (such as location entropy [55], Duncan heterogeneity index [56], etc.) will also help to evaluate the spatial equity of UPGS layout more comprehensively from the perspective of resident heterogeneity.
In summary, this study utilizes multi-source big data to reveal the negative correlation between resident heterogeneity and the spatial equity of UPGS layout at a fine scale, confirming that the central urban area and low-income groups are the main areas of contradiction between UPGS supply and demand in the main urban area of Nanjing, which can provide decision-making references for urban green space planning. Future research should further expand the analysis dimensions, optimize resident profiles, and enlarge the sample size to provide more theoretical and empirical support for building a fair and shared UPGS system.

6. Conclusions

This study systematically identifies and analyzes the supply–demand matching characteristics of urban park green space (UPGS) equity among different groups and spatial units from the perspective of the differentiation of residents’ daily life needs. Through an empirical study of the main urban area of Nanjing, this paper draws the following conclusions:
(1)
The layout of UPGS in the main urban area of Nanjing exhibits significant spatial inequity. The study finds that the matching degree between residents’ recreational demand level and UPGS supply level is poor, indicating that the current allocation of park green space resources fails to effectively meet residents’ actual needs. This supply–demand imbalance varies across different locations, with the problem of insufficient supply being particularly prominent in the central urban area.
(2)
There are significant differences in the accessibility of UPGS resources among different social groups. Through the analysis of resident heterogeneity, this study reveals the unequal status of different types of resident groups in enjoying UPGS. Among them, the low-income group faces the most severe predicament of park green space accessibility, which is closely related to their residential location and socioeconomic status.
(3)
Resident heterogeneity is negatively correlated with the spatial equity of UPGS. In streets with more diverse socioeconomic attributes of residents, the equity index of park green space layout is generally lower. This may be due to the severe internal differentiation of highly heterogeneous communities, where the preferences and demands of different groups for park green spaces vary greatly, making it difficult to consider in planning and construction, thus leading to the intensification of interest conflicts.
(4)
Big data methods provide new ideas for evaluating the spatial equity of UPGS layouts. This study utilizes LBS data and multi-source geographic data to conduct in-depth characterization and correlation analysis of residents’ socioeconomic attributes, behavioral activities, and park green space layout at a fine scale, compensating for the deficiencies of existing research in terms of single data dimensions and limited sample sizes, which can provide references for empirical research in related fields.
(5)
UPGS planning should strengthen supply–demand orientation and improve the equity of spatial layout. Based on the analysis of the Nanjing case, this study suggests that future UPGS planning should pay more attention to the diversity of recreational needs, focus on improving the accessibility of park green spaces in central urban areas and low-income communities in spatial layout optimization, and balance the interests and demands of different stakeholders through the introduction of public participation mechanisms.
In summary, this study analyzes the spatial equity issues of UPGS layout from the perspective of resident heterogeneity, which is of great significance for balancing green space resource allocation and creating an inclusive and livable urban environment. Looking ahead, there are several promising avenues for future research. First, expanding the sample scope to include other cities with different socioeconomic and environmental contexts could help validate and generalize our findings. Second, incorporating additional factors that influence residents’ recreational behavior and needs, such as age, gender, and cultural background, could provide a more nuanced understanding of the determinants of UPGS spatial equity. Third, refining the assessment framework and developing more sophisticated optimization strategies for UPGS planning and management could contribute to the practical application of our research. By pursuing these directions, we aim to generate further theoretical and empirical insights that can inform sustainable urban development policies and practices.

Author Contributions

Conceptualization, G.X. and X.Z.; methodology, G.X. and G.H.; validation, G.X. and X.Z.; formal analysis, G.X. and G.H.; data curation, G.X. and G.H.; writing—original draft preparation, G.X. and G.H.; writing—review and editing, X.Z.; visualization, G.H.; supervision, G.X.; project administration, G.X.; funding acquisition, G.X. All authors have read and agreed to the published version of the manuscript.

Funding

This work was supported by the Postgraduate Research & Practice Innovation Program of Jiangsu Province, grant number KYCX21_0149.

Institutional Review Board Statement

Not applicable.

Informed Consent Statement

Not applicable.

Data Availability Statement

The raw data supporting the conclusions of this article will be made available by the authors on request.

Conflicts of Interest

The authors declare no conflicts of interest.

References

  1. Mukherjee, M.; Takara, K. Urban Green Space as a Countermeasure to Increasing Urban Risk and the UGS-3CC Resilience Framework. Int. J. Disaster Risk Reduct. 2018, 28, 854–861. [Google Scholar] [CrossRef]
  2. Luo, S.; Chen, W.; Sheng, Z.; Wang, P. The Impact of Urban Green Space Landscape on PM2.5 in the Central Urban Area of Nanchang City, China. Atmos. Pollut. Res. 2023, 14, 101903. [Google Scholar] [CrossRef]
  3. Yu, Z.; Guo, X.; Jørgensen, G.; Vejre, H. How Can Urban Green Spaces Be Planned for Climate Adaptation in Subtropical Cities? Ecol. Indic. 2017, 82, 152–162. [Google Scholar] [CrossRef]
  4. Bao, Z.; Shifaw, E.; Deng, C.; Sha, J.; Li, X.; Hanchiso, T.; Yang, W. Remote Sensing-Based Assessment of Ecosystem Health by Optimizing Vigor-Organization-Resilience Model: A Case Study in Fuzhou City, China. Ecol. Inform. 2022, 72, 101889. [Google Scholar] [CrossRef]
  5. Taczanowska, K.; Tansil, D.; Wilfer, J.; Jiricka-Pürrer, A. The Impact of Age on People’s Use and Perception of Urban Green Spaces and Their Effect on Personal Health and Wellbeing during the COVID-19 Pandemic—A Case Study of the Metropolitan Area of Vienna, Austria. Cities 2024, 147, 104798. [Google Scholar] [CrossRef]
  6. Gong, C.; Yang, R.; Li, S. The Role of Urban Green Space in Promoting Health and Well-Being Is Related to Nature Connectedness and Biodiversity: Evidence from a Two-Factor Mixed-Design Experiment. Landsc. Urban Plan. 2024, 245, 105020. [Google Scholar] [CrossRef]
  7. Bille, R.A.; Jensen, K.E.; Buitenwerf, R. Global Patterns in Urban Green Space Are Strongly Linked to Human Development and Population Density. Urban For. Urban Green. 2023, 86, 127980. [Google Scholar] [CrossRef]
  8. Li, Y.; Zhang, X.; Xia, C. Towards a Greening City: How Does Regional Cooperation Promote Urban Green Space in the Guangdong-Hong Kong-Macau Greater Bay Area? Urban For. Urban Green. 2023, 86, 128033. [Google Scholar] [CrossRef]
  9. Ruiz, M.A.; Colli, M.F.; Martinez, C.F.; Correa-Cantaloube, E.N. Park Cool Island and Built Environment. A Ten-Year Evaluation in Parque Central, Mendoza-Argentina. Sustain. Cities Soc. 2022, 79, 103681. [Google Scholar] [CrossRef]
  10. Phillips, A.; Plastara, D.; Khan, A.Z.; Canters, F. Integrating Public Perceptions of Proximity and Quality in the Modelling of Urban Green Space Access. Landsc. Urban Plan. 2023, 240, 104875. [Google Scholar] [CrossRef]
  11. Chen, J.; Kinoshita, T.; Li, H.; Luo, S.; Su, D. Which Green Is More Equitable? A Study of Urban Green Space Equity Based on Morphological Spatial Patterns. Urban For. Urban Green. 2024, 91, 128178. [Google Scholar] [CrossRef]
  12. Kim, H.; Woosnam, K.M.; Kim, H. Urban Gentrification, Social Vulnerability, and Environmental (in) Justice: Perspectives from Gentrifying Metropolitan Cities in Korea. Cities 2022, 122, 103514. [Google Scholar] [CrossRef]
  13. Zhang, J.; Tan, P.Y. Assessment of Spatial Equity of Urban Park Distribution from the Perspective of Supply-Demand Interactions. Urban For. Urban Green. 2023, 80, 127827. [Google Scholar] [CrossRef]
  14. Cao, Y.; Li, Y.; Shen, S.; Wang, W.; Peng, X.; Chen, J.; Liao, J.; Lv, X.; Liu, Y.; Ma, L. Mapping Urban Green Equity and Analysing Its Impacted Mechanisms: A Novel Approach. Sustain. Cities Soc. 2024, 101, 105071. [Google Scholar] [CrossRef]
  15. Chen, Z.; Li, P.; Jin, Y.; Bharule, S.; Jia, N.; Li, W.; Song, X.; Shibasaki, R.; Zhang, H. Using Mobile Phone Big Data to Identify Inequity of Aging Groups in Transit-Oriented Development Station Usage: A Case of Tokyo. Transp. Policy 2023, 132, 65–75. [Google Scholar] [CrossRef]
  16. Artmann, M.; Chen, X.; Iojă, C.; Hof, A.; Onose, D.; Poniży, L.; Lamovšek, A.Z.; Breuste, J. The Role of Urban Green Spaces in Care Facilities for Elderly People across European Cities. Urban For. Urban Green. 2017, 27, 203–213. [Google Scholar] [CrossRef]
  17. Yang, W.; Yang, R.; Zhou, S. The Spatial Heterogeneity of Urban Green Space Inequity from a Perspective of the Vulnerable: A Case Study of Guangzhou, China. Cities 2022, 130, 103855. [Google Scholar] [CrossRef]
  18. Sun, X.; Liu, H.; Liao, C.; Nong, H.; Yang, P. Understanding Recreational Ecosystem Service Supply-Demand Mismatch and Social Groups’ Preferences: Implications for Urban–Rural Planning. Landsc. Urban Plan. 2024, 241, 104903. [Google Scholar] [CrossRef]
  19. Lee, W.K.; Sohn, S.Y.; Heo, J. Utilizing Mobile Phone-Based Floating Population Data to Measure the Spatial Accessibility to Public Transit. Appl. Geogr. 2018, 92, 123–130. [Google Scholar] [CrossRef]
  20. Liu, B.; Tian, Y.; Guo, M.; Tran, D.; Alwah, A.A.Q.; Xu, D. Evaluating the Disparity between Supply and Demand of Park Green Space Using a Multi-Dimensional Spatial Equity Evaluation Framework. Cities 2022, 121, 103484. [Google Scholar] [CrossRef]
  21. Liu, J.; Meng, B.; Yang, M.; Peng, X.; Zhan, D.; Zhi, G. Quantifying Spatial Disparities and Influencing Factors of Home, Work, and Activity Space Separation in Beijing. Habitat Int. 2022, 126, 102621. [Google Scholar] [CrossRef]
  22. Zhou, Y.; Guan, C.; Wu, L.; Li, Y.; Nie, X.; Song, J.; Kim, S.K.; Akiyama, Y. Visitation-Based Classification of Urban Parks through Mobile Phone Big Data in Tokyo. Appl. Geogr. 2024, 167, 103300. [Google Scholar] [CrossRef]
  23. Chang, M.; Lee, G.; Lee, J.-H. Analysis of Urban Visitor Walkability Based on Mobile Data: The Case of Daejeon, Korea. Cities 2023, 143, 104564. [Google Scholar] [CrossRef]
  24. Wan, L.; Gao, S.; Wu, C.; Jin, Y.; Mao, M.; Yang, L. Big Data and Urban System Model-Substitutes or Complements? A Case Study of Modelling Commuting Patterns in Beijing. Comput. Environ. Urban Syst. 2018, 68, 64–77. [Google Scholar] [CrossRef]
  25. Yang, J.; Shi, Y.; Zheng, Y.; Zhang, Z. The spatiotemporal prediction method of urban population density distribution through behaviour environment interaction agent model. Sci. Rep. 2023, 13, 5821. [Google Scholar] [CrossRef]
  26. Luo, J.; Wei, Y.D. Population Distribution and Spatial Structure in Transitional Chinese Cities: A Study of Nanjing. Eurasian Geogr. Econ. 2006, 47, 585–603. [Google Scholar] [CrossRef]
  27. Hao, L.; Wang, X.; Qiao, W.; Zhang, L. The Characteristics of Urban Spatial Expansion in Nanjing since 1936. Geogr. Res. 2019, 4, 911925. [Google Scholar] [CrossRef]
  28. Friedmann, J.; Miller, J. The urban field. J. Am. Inst. Plann. 1965, 31, 312–320. [Google Scholar] [CrossRef]
  29. Xing, L.; Chen, Q.; Liu, Y.; He, H. Evaluating the Accessibility and Equity of Urban Health Resources Based on Multi-Source Big Data in High-Density City. Sustain. Cities Soc. 2024, 100, 105049. [Google Scholar] [CrossRef]
  30. Third Party Geolocation Services in LBS: Privacy Requirements and Research Issues. Available online: https://air.unimi.it/handle/2434/163019 (accessed on 12 May 2024).
  31. Yang, G.; Luo, S.; Zhu, H.; Xin, Y.; Xiao, K.; Chen, Y.; Li, M.; Wang, Y. A Mechanism to Improve Effectiveness and Privacy Preservation for Review Publication in LBS. IEEE Access 2019, 7, 156659–156674. [Google Scholar] [CrossRef]
  32. Birant, D.; Kut, A. ST-DBSCAN: An Algorithm for Clustering Spatial–Temporal Data. Data Knowl. Eng. 2007, 60, 208–221. [Google Scholar] [CrossRef]
  33. Atluri, G.; Karpatne, A.; Kumar, V. Spatio-Temporal Data Mining: A Survey of Problems and Methods. ACM Comput. Surv. 2019, 51, 1–41. [Google Scholar] [CrossRef]
  34. Boterman, W.R.; Musterd, S.; Manting, D. Multiple Dimensions of Residential Segregation. The Case of the Metropolitan Area of Amsterdam. Urban Geogr. 2021, 42, 481–506. [Google Scholar] [CrossRef]
  35. Wang, M.; Su, M.M.; Gan, C.; Yu, Z. A Coordination Analysis on Tourism Development and Resident Well-Being in the Yangtze River Delta Urban Agglomeration, China. J. Clean. Prod. 2023, 421, 138361. [Google Scholar] [CrossRef]
  36. Dai, D. Racial/Ethnic and Socioeconomic Disparities in Urban Green Space Accessibility: Where to Intervene? Landsc. Urban Plan. 2011, 102, 234–244. [Google Scholar] [CrossRef]
  37. Wang, C.; Wang, S.; Cao, Y.; Yan, H.; Li, Y. The Social Equity of Urban Parks in High-Density Urban Areas: A Case Study in the Core Area of Beijing. Sustainability 2023, 15, 13849. [Google Scholar] [CrossRef]
  38. The Underrated Dianping-36 Kr. Available online: https://www.36kr.com/p/2659724283847428 (accessed on 14 May 2024).
  39. Ma, C.-X.; Peng, F.-L. Evaluation of Spatial Performance and Supply-Demand Ratios of Urban Underground Space Based on POI Data: A Case Study of Shanghai. Tunn. Undergr. Space Technol. 2023, 131, 104775. [Google Scholar] [CrossRef]
  40. Xu, D.; Xu, Y. Spatio-Temporal Pattern of Registered Population in Nanjing from 1928 to 2017. Acta Geogr. Sin. 2022, 77, 2439–2456. [Google Scholar] [CrossRef]
  41. Tan, M.; Li, X.; Lu, C.; Luo, W.; Kong, X.; Ma, S. Urban Population Densities and Their Policy Implications in China. Habitat Int. 2008, 32, 471–484. [Google Scholar] [CrossRef]
  42. About the “Nanjing National Forest City Construction Public Satisfaction Questionnaire” Statistics. Available online: https://ylj.nanjing.gov.cn/hdjl/wsdc/202103/t20210322_2855590.html (accessed on 12 May 2024).
  43. Song, L.; Kong, X.; Cheng, P. Supply-Demand Matching Assessment of the Public Service Facilities in 15-Minute Community Life Circle Based on Residents’ Behaviors. Cities 2024, 144, 104637. [Google Scholar] [CrossRef]
  44. Zhang, K.; Yan, D. Enhancing the Community Environment in Populous Residential Districts: Neighborhood Amenities and Residents’ Daily Needs. Sustainability 2023, 15, 13255. [Google Scholar] [CrossRef]
  45. Zhang, J.; Xu, E. Investigating the Spatial Distribution of Urban Parks from the Perspective of Equity-Efficiency: Evidence from Chengdu, China. Urban For. Urban Green. 2023, 86, 128019. [Google Scholar] [CrossRef]
  46. Xia, H.; Yin, R.; Xia, T.; Zhao, B.; Qiu, B. People-Oriented: A Framework for Evaluating the Level of Green Space Provision in the Life Circle from a Supply and Demand Perspective: A Case Study of Gulou District, Nanjing, China. Sustainability 2024, 16, 955. [Google Scholar] [CrossRef]
  47. Tsai, Y.; Lindley, M.C.; Zhou, F.; Stokley, S. Urban-Rural Disparities in Vaccination Service Use among Low-Income Adolescents. J. Adolesc. Health 2021, 69, 114–120. [Google Scholar] [CrossRef] [PubMed]
  48. Abercrombie, L.C.; Sallis, J.F.; Conway, T.L.; Frank, L.D.; Saelens, B.E.; Chapman, J.E. Income and Racial Disparities in Access to Public Parks and Private Recreation Facilities. Am. J. Prev. Med. 2008, 34, 9–15. [Google Scholar] [CrossRef]
  49. Fan, P.; Xu, L.; Yue, W.; Chen, J. Accessibility of Public Urban Green Space in an Urban Periphery: The Case of Shanghai. Landsc. Urban Plan. 2017, 165, 177–192. Available online: https://www.sciencedirect.com/science/article/abs/pii/S0169204616302432 (accessed on 12 May 2024). [CrossRef]
  50. Tang, J.; Bi, W.; Liu, F.; Zhang, W. Exploring Urban Travel Patterns Using Density-Based Clustering with Multi-Attributes from Large-Scaled Vehicle Trajectories. Phys. Stat. Mech. Its Appl. 2021, 561, 125301. [Google Scholar] [CrossRef]
  51. Özbil Torun, A.; Göçer, K.; Yeşiltepe, D.; Argın, G. Understanding the Role of Urban Form in Explaining Transportation and Recreational Walking among Children in a Logistic GWR Model: A Spatial Analysis in Istanbul, Turkey. J. Transp. Geogr. 2020, 82, 102617. [Google Scholar] [CrossRef]
  52. Gao, C.; Li, S.; Sun, M.; Zhao, X.; Liu, D. Exploring the Relationship between Urban Vibrancy and Built Environment Using Multi-Source Data: Case Study in Munich. Remote Sens. 2024, 16, 1107. [Google Scholar] [CrossRef]
  53. Peng, T.; Chen, J.; Liu, K.; Qiu, Z.; Fu, Z.; Huang, Y. Examining the Relationship between Built Environment and Urban Parking Demand from the Perspective of Travelers. J. Clean. Prod. 2023, 385, 135766. [Google Scholar] [CrossRef]
  54. Yu, Q.; Scribner, R.A.; Leonardi, C.; Zhang, L.; Park, C.; Chen, L.; Simonsen, N.R. Exploring Racial Disparity in Obesity: A Mediation Analysis Considering Geo-Coded Environmental Factors. Spat. Spatio-Temporal Epidemiol. 2017, 21, 13–23. [Google Scholar] [CrossRef] [PubMed]
  55. Wang, R.; Liu, X.; Zhao, X.; Cheng, X.; Qiu, H. A Novel Entropy-Based Method for Quantifying Urban Energy Demand Aggregation: Implications for Urban Planning and Policy. Sustain. Cities Soc. 2024, 103, 105284. [Google Scholar] [CrossRef]
  56. Zhang, Y.; Song, Y.; Zhang, W.; Wang, X. Working and Residential Segregation of Migrants in Longgang City, China: A Mobile Phone Data-Based Analysis. Cities 2024, 144, 104625. [Google Scholar] [CrossRef]
Figure 1. Study area of Nanjing, China. (a) The location of Nanjing in China; (b) the location of Nanjing in Jangsu; (c) the research area.
Sustainability 16 05631 g001
Figure 2. Research framework. (a) Data collection; (b) data preprocessing; (c) connecting multi-source spatiotemporal data through “spatial join *”; (d) calculation of supply, demand, and spatial equity levels; (e) analysis of the relationship between resident heterogeneity and UPGS spatial equity. * Spatial join is a GIS operation that combines the attributes of two spatial datasets based on their spatial relationship, such as intersection or containment.
Sustainability 16 05631 g002
Figure 3. Distribution of residents with recreational behaviors in the main urban area of Nanjing based on LBS data identification.
Sustainability 16 05631 g003
Figure 4. Resident attribute classification.
Sustainability 16 05631 g004
Figure 5. Supply level, demand level, and spatial equity index of urban park green spaces in each street unit of the main urban area of Nanjing. (a) Supply level; (b) demand level; (c) spatial equity index.
Sustainability 16 05631 g005
Figure 6. Degree of resident heterogeneity of residents with recreational behaviors in each street unit of the main urban area of Nanjing.
Sustainability 16 05631 g006
Figure 7. (a) Supply level for various types of resident groups; (b) demand level for various types of resident groups; (c) spatial equity level for various types of resident groups.
Sustainability 16 05631 g007aSustainability 16 05631 g007bSustainability 16 05631 g007c
Table 1. Sources and description of datasets.
TypesDatasetsFormatSourcesTime
Geospatial big dataArea of InterestVector (Polygon)https://www.amap.com/ (accessed on 2 November 2023)2 November 2023
Urban Green SpaceVector (Polygon)6 October 2023
Housing PriceVector (Point)https://nj.lianjia.com/ (accessed on 2 October 2023)2 October 2023
Validation dataLocation-based ServiceVector (Point)https://dianping.com/ (accessed on 28 October 2023)17–24 October 2023
Basic geographic dataRoadsVector (Polyline)https://www.openstreetmap.org/ (accessed on 18 December 2023)18 December 2023
Administrative boundariesVector (Polygon)18 December 2023
Table 2. Samples of LBS data.
No.IDGenderAgeDateTimeLongitudeLatitude
11557132M18–6017 October 202308:34:23118.84021931.898774
21557132M18–6017 October 202308:35:29118.84078931.898716
31557132M18–6017 October 202311:45:11118.84021931.898774
234,6831999980F>6024 October 202318:07:30118.83820932.320206
234,6841999980F>6024 October 202322:33:16118.78152632.32281
Table 3. Sample of housing price data.
No.NamePrice
(CNY/m2)
Center Point
Longitude
Center Point
Latitude
1Muma Apartment37,00032.0536111118.7838889
2Vanke Golden Home67,00032.0408333118.7619444
3Mufu Villa21,00032.1244444118.8130556
5047Puzhou Garden14,00032.1680556118.7166667
5048Fangshan Xiyuan19,00031.9316667118.9008333
Table 4. Types and areas of AOI data.
CategoriesAOI TypesAOI Areas (km2)
Residential areaResidential buildings174.58
Unit compounds, staff dormitories2.01
Urban park green spaceCity squares1.94
Parks, zoos, botanical gardens86.10
Tourist attractions103.41
Disclaimer/Publisher’s Note: The statements, opinions and data contained in all publications are solely those of the individual author(s) and contributor(s) and not of MDPI and/or the editor(s). MDPI and/or the editor(s) disclaim responsibility for any injury to people or property resulting from any ideas, methods, instructions or products referred to in the content.

