Article

Mechanical Damage and Freeze–Thaw Damage of Concrete with Recycled Brick Coarse Aggregate

1
Department of Civil Engineering, School of Civil Engineering and Geomatics, Shandong University of Technology, Zibo 255000, China
2
Department of Architectural Engineering, School of Civil Engineering, Inner Mongolia University of Science and Technology, 7 Alding Street, Baotou 014010, China
3
China Railway 11 Bureau Group Co., Ltd., 277 Zhongshan Road, Wuhan 430061, China
4
International College, Krirk University, No.3 soi Ramintra 1, Ramintra Road, Anusaowaree, Bangkhen, Bangkok 10220, Thailand
*
Author to whom correspondence should be addressed.
These authors contributed equally to this work.
Sustainability 2024, 16(13), 5643; https://doi.org/10.3390/su16135643
Submission received: 6 May 2024 / Revised: 13 June 2024 / Accepted: 24 June 2024 / Published: 1 July 2024
(This article belongs to the Special Issue Advancements in Green Building Materials, Structures, and Techniques)

Abstract

:
The influence of different recycled brick coarse aggregate (RBA) substitution rates on the mechanical performance and frost resistance of concrete was observed. The test findings revealed that RBA deteriorated the compressive and flexural properties in concrete and improved the tensile properties and plasticity in concrete to some extent. The frost resistance of concrete can be effectively improved by adding RBA. The influence degree of the RBA concrete frost resistance factor was quantified by gray entropy correlation theory, and the gray entropy correlations between freezing and thawing cycles, natural coarse aggregate substitution rate, recycled brick aggregate substitution rate, and freezing and thawing damage value (DN) were 0.9979, 0.9914, and 0.9876, respectively. Moreover, the freezing and thawing damage model about GM(1, 1) theory was developed (R2 > 0.87), which can better predict the freezing and thawing damage of RBA concrete. The damage mechanism of RBA concrete during freezing and thawing was revealed.

1. Introduction

Concrete is the most commonly used as a building material, while the consumption of aggregates accounts for approximately 70–80% of this consumption [1,2]. The huge consumption of concrete has resulted in the increasing depletion of natural aggregates, thus creating an urgent need for new materials to replace natural aggregates. Moreover, with the development of urbanization, many brick or brick–concrete rural buildings have been demolished and rebuilt, thus generating considerable construction waste. Construction waste pollutes the local environment. Construction waste mainly includes slag, waste mortar, waste crushed clay bricks, waste concrete, plastics, waste metal materials, waste bamboo, and so on. Waste bricks make up 50–70% of construction waste in the renovation of old towns and 30–50% of construction waste in building construction [3,4]. Therefore, resource utilization of waste bricks can effectively protect the ecological environment and promote the construction industry’s sustainable development.
The coarse aggregate of recycled bricks has the disadvantages of high crushing index, high microcracks, and apparent density [5,6], leading to the deterioration of the concrete mechanical properties. The selection of an appropriate recycled aggregate replacement ratio can effectively reduce the negative effects of RBA in concrete mechanics [7,8]. Cachim et al. [9] reported that when a small amount of RBA replaces natural coarse aggregate (NCA), its presaturated state can provide water for cement hydration without affecting the initial water–cement ratio and can act as a self-consolidating agent for concrete, which in turn can have some positive effects in the concrete’s mechanical properties. Xu et al. [10] demonstrated that the compressive performance of RBA concrete was improved as the substitution ratio increased from 30% to 50%. Wang et al. [11] reported that the concrete compressive properties decreased by 7.72% and 22.04% at 50% RBA and 100% RBA substitution, respectively. These studies demonstrated that a high RBA substitution rate can greatly reduce mechanical strength, so it is important to choose a suitable range of substitution rates to control the negative impact of RBA [12].
Moreover, concrete undergoing frequent freezing and thawing cycles can produce significant degradation in its properties [13]. Therefore, strengthening the usage of RBA concrete should ensure not only good mechanical performance but also better frost resistance. However, RBA concrete has a higher porosity and water absorption, making it different from ordinary concrete in terms of frost resistance [14]. Some scholars believe that an excessive RBA substitution rate can accelerate the deterioration of concrete in the course of freezing and thawing. Ji et al. [15] showed that the flexural strength decreased by 26.43% and 38.43%, the relative dynamic elastic modulus (RDEM) decreased to 75.85% and 66.49%, and the mass loss rate was 0.713% and 1.2% for normal concrete and 100% RBA replacement concrete after all freeze and thaw cycles, respectively. Xia et al. [16] demonstrated that the compressive properties of ordinary concrete and 100% RBA replacement concrete decreased by 26.12% and 39.88% after all frost and melt, respectively. Other scholars have concluded that RBA has more closed pores, and RBA with an appropriate substitution rate can buffer the water pressure when it freezes inside the concrete [17,18], thus enhancing the anti-freeze properties of RBA concrete. Su et al. [19] found that the RDEM decreased to 52% and 60%, and the compressive strength loss was 83.2% and 76.4% after all frozen and thawed processes for 0% and 50% RBA replacement concrete, respectively. Cui et al. [20] showed that the compressive properties of 0%, 50%, and 100% RBA replacement concrete dropped by 83.2%, 68.9%, and 73.7% after 60 freezing and thawing cycles, respectively. The advantages of RBA can be effectively exploited by optimizing the configuration of the RBA substitution ratio in concrete [21].
The present work examines the mechanism of freezing and thawing damage. Depending on the freezing expansion of water solutions and the thermodynamic movements generated by this process in the pores of the concrete, concrete freezing, and thawing damage mechanisms have been proposed. From a microscopic perspective, hydrostatic pressure theory [22], osmotic pressure theory [23], and crystallization pressure theory [24] explain the moisture migration of porous materials in freeze–thaw processes. Macroscopically, the micro-ice crystal theory [25] explains the transport characteristics of pore water within concrete during freeze–thaw based on thermodynamic equilibrium conditions. All the above theories cannot fully reveal the mechanism of concrete freezing and thawing damage, but they provide a reference for understanding the freezing and thawing damage mechanism of RBA concrete. Moreover, the C-S-H gel, which accounts for about 60–70% of the fully hydrated cement paste, can effectively fill the connected pores of the RBA, thus improving the mechanical properties and frost resistance of the concrete [26,27].
There are relatively few studies on RBA concrete, especially in terms of durability. Therefore, this paper investigated the mechanical properties, and frost resistance of RBA concrete and quantitatively characterized the freezing and thawing damage of RBA concrete. Also, the mechanism of the freezing and thawing damage on RBA concrete was investigated by microstructural analysis.

2. Test Materials and Methods
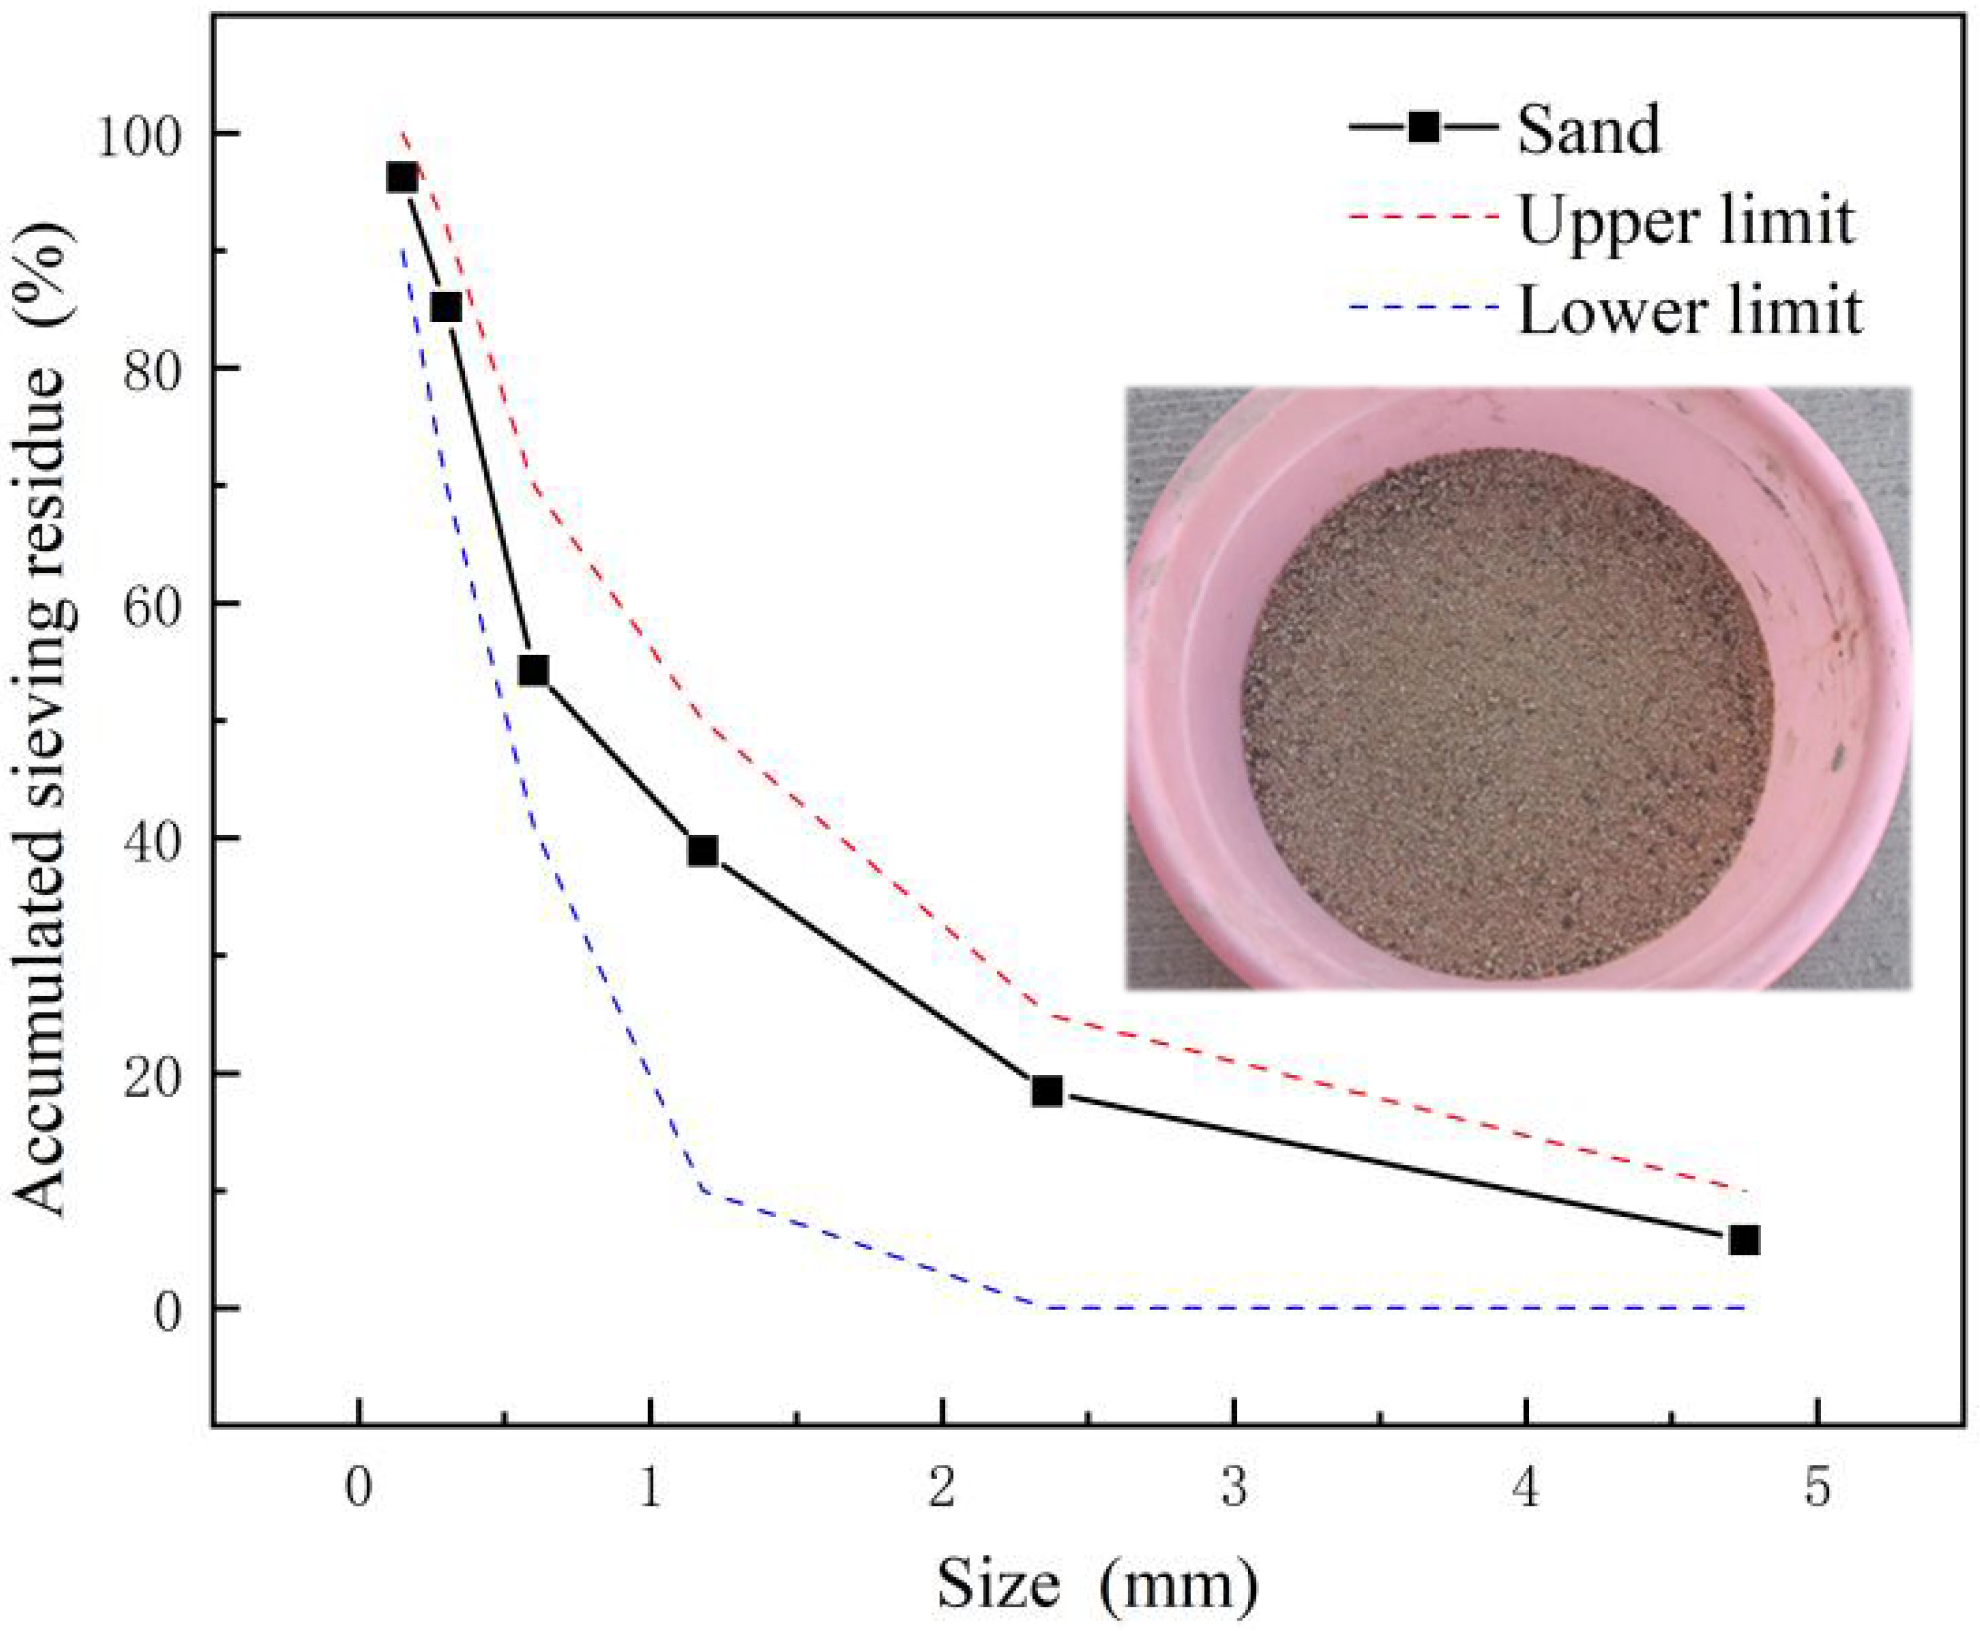
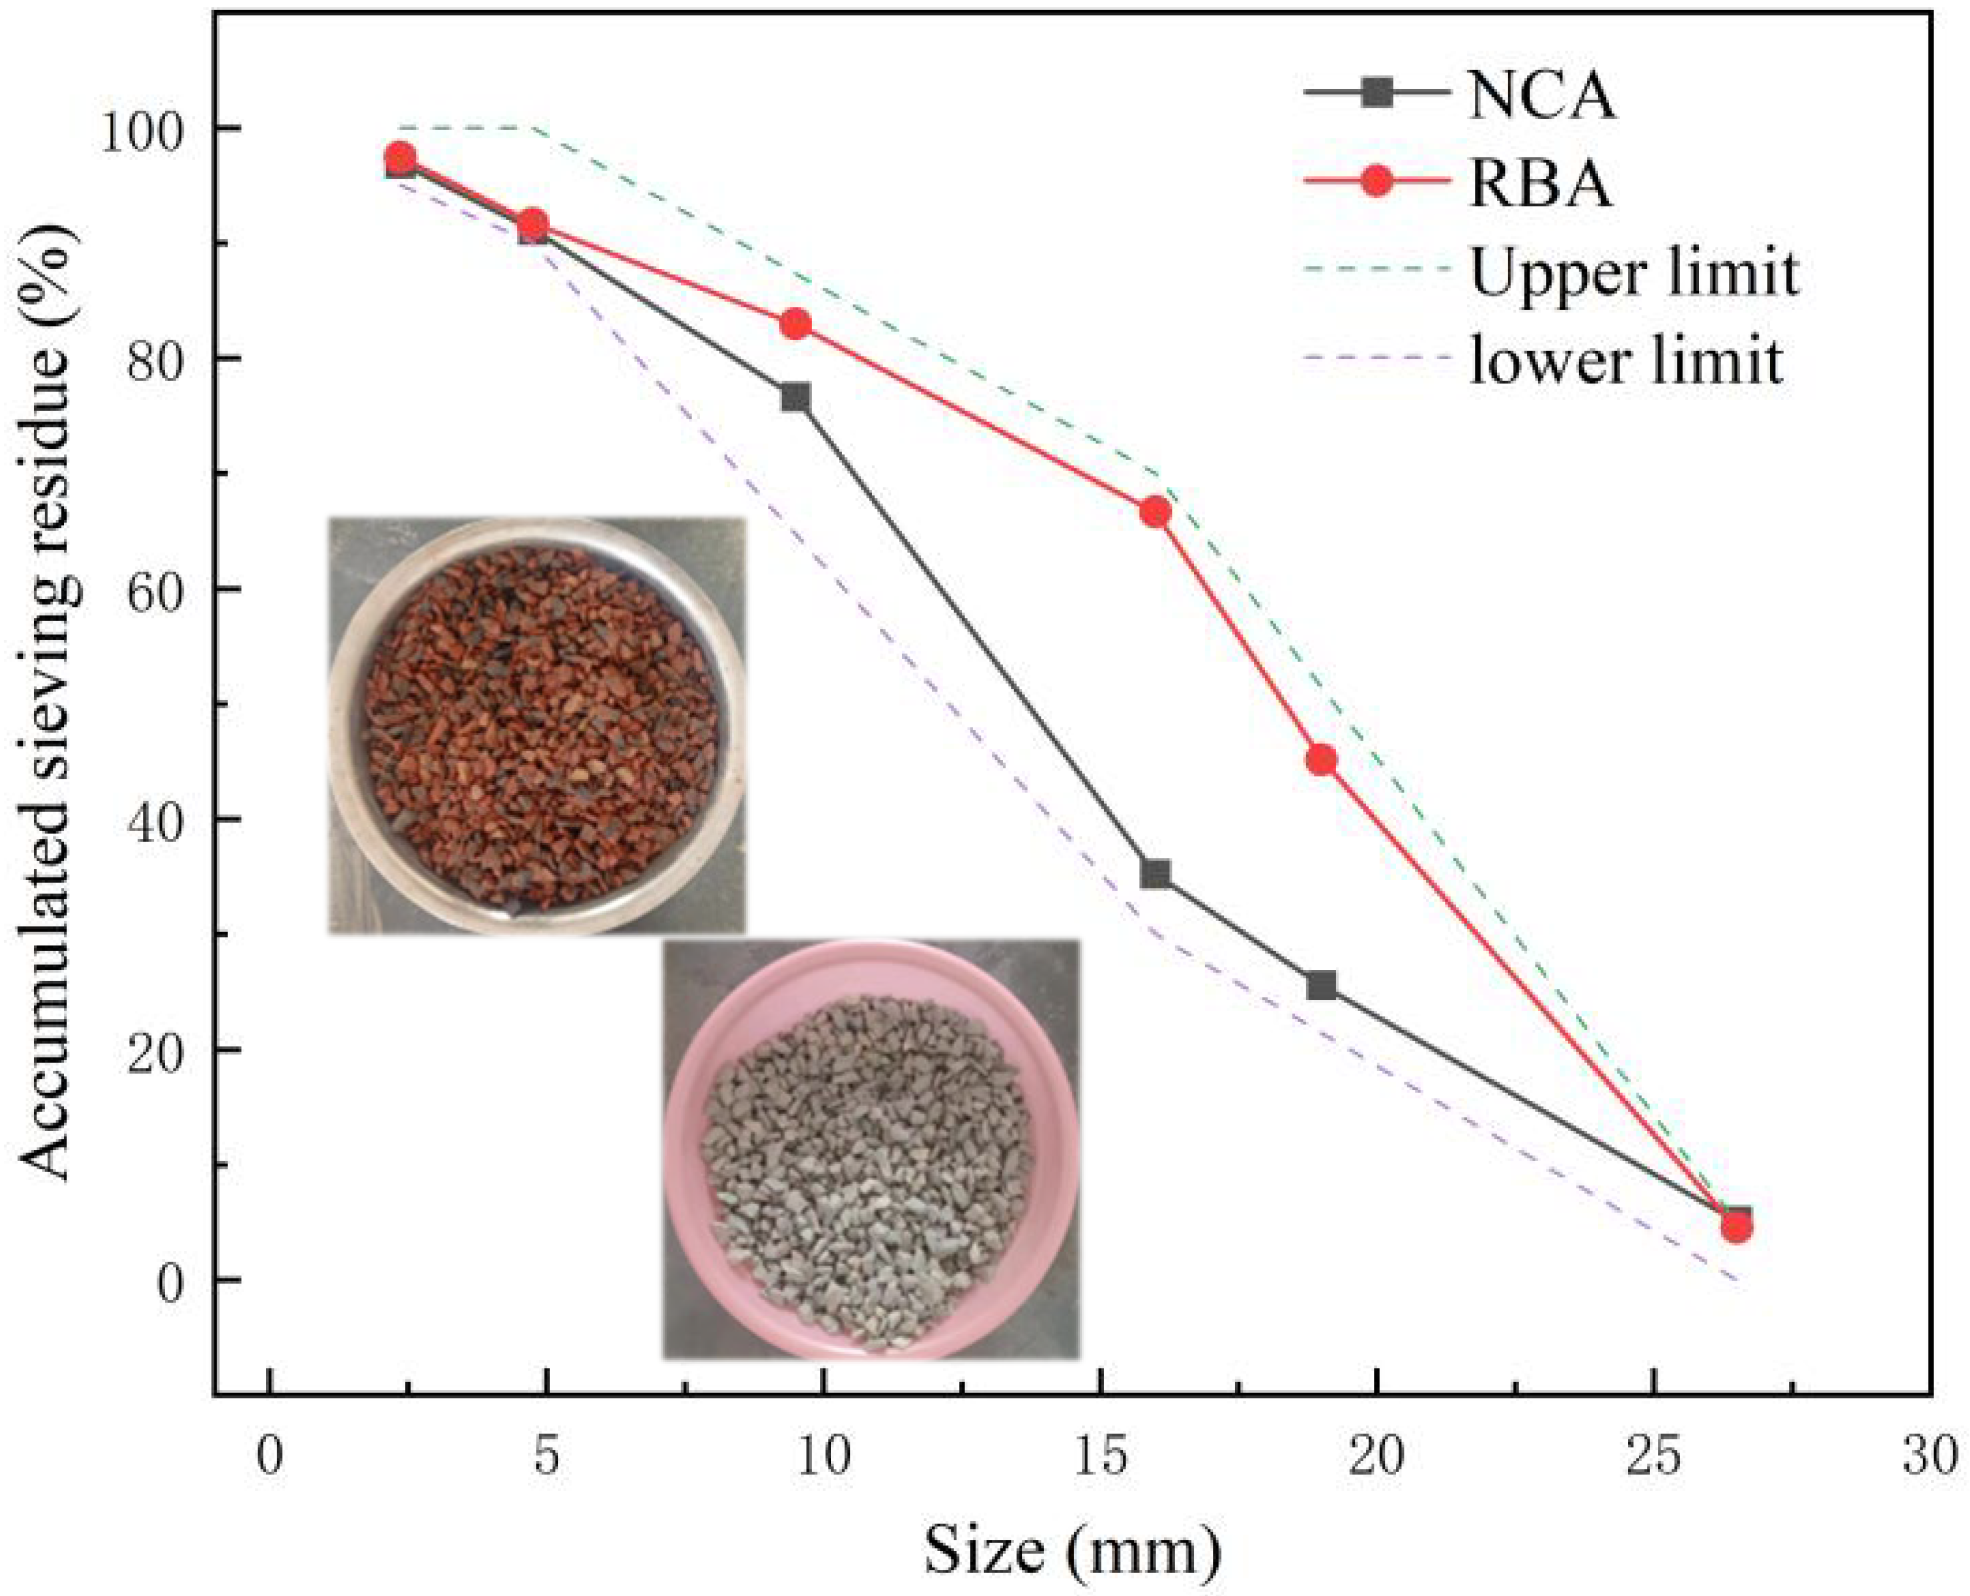
2.1. Materials

Ordinary Portland cement was selected for the test, and all properties were in line with the requirements of GB/T 39698-2020 [28]. The chemical composition and physical properties of the cement are shown in Table 1 and Table 2, respectively. According to JGJ 52-2006 [29], fine aggregates were selected from natural river sand, and the grading curve is shown in Figure 1. Natural coarse aggregate (NCA) was obtained from natural crushed stone and purchased from Zibo Xintiansheng Concrete Co., Ltd., Zibo, China. Recycled brick coarse aggregate (RBA) was processed from waste clay bricks through crushing, screening, cleaning, and other steps. The performance indexes were in line with the requirements of JGJ 52-2006 [29], the physical performance and grading curve were shown in Table 3 and Figure 2, respectively.

2.2. Mixing Proportions

The water–cement ratio of the concrete mix for this test was 0.45. NCA was displaced with an equal volume of RBA, as shown in Table 4. The RBA is needed for pre-absorption treatment. As a result of RBA’s high absorbency, water used to mix cement is easily absorbed by RBA, resulting in a low slump of fresh concrete, which cannot meet the requirements of GB/T 50081-2019 [30]. Before pouring the specimens, RBA was completely submerged in water for 1 day and then taken out to dry naturally until the surface became saturated and dry [14,31]. Procedure for making concrete specimens is as follows: (1) the cement, NCA, RBA, water, and sand were weighed; (2) the sand and cement were mixed and stirred in the mixer for 2 min, followed by coarse aggregate for 2 min, and finally water for 1 min; (3) the surface of the mold was scraped smooth, the hydrophilic release agent was spread evenly, and then the fresh concrete was loaded into the mold; (4) put the mold with freshly mixed concrete on the shaking table and shake it until the concrete surface is smooth and no big air bubbles appear; (5) concrete specimens were taken out of the mold after 2 days and maintained for 28 days.

2.3. Methods

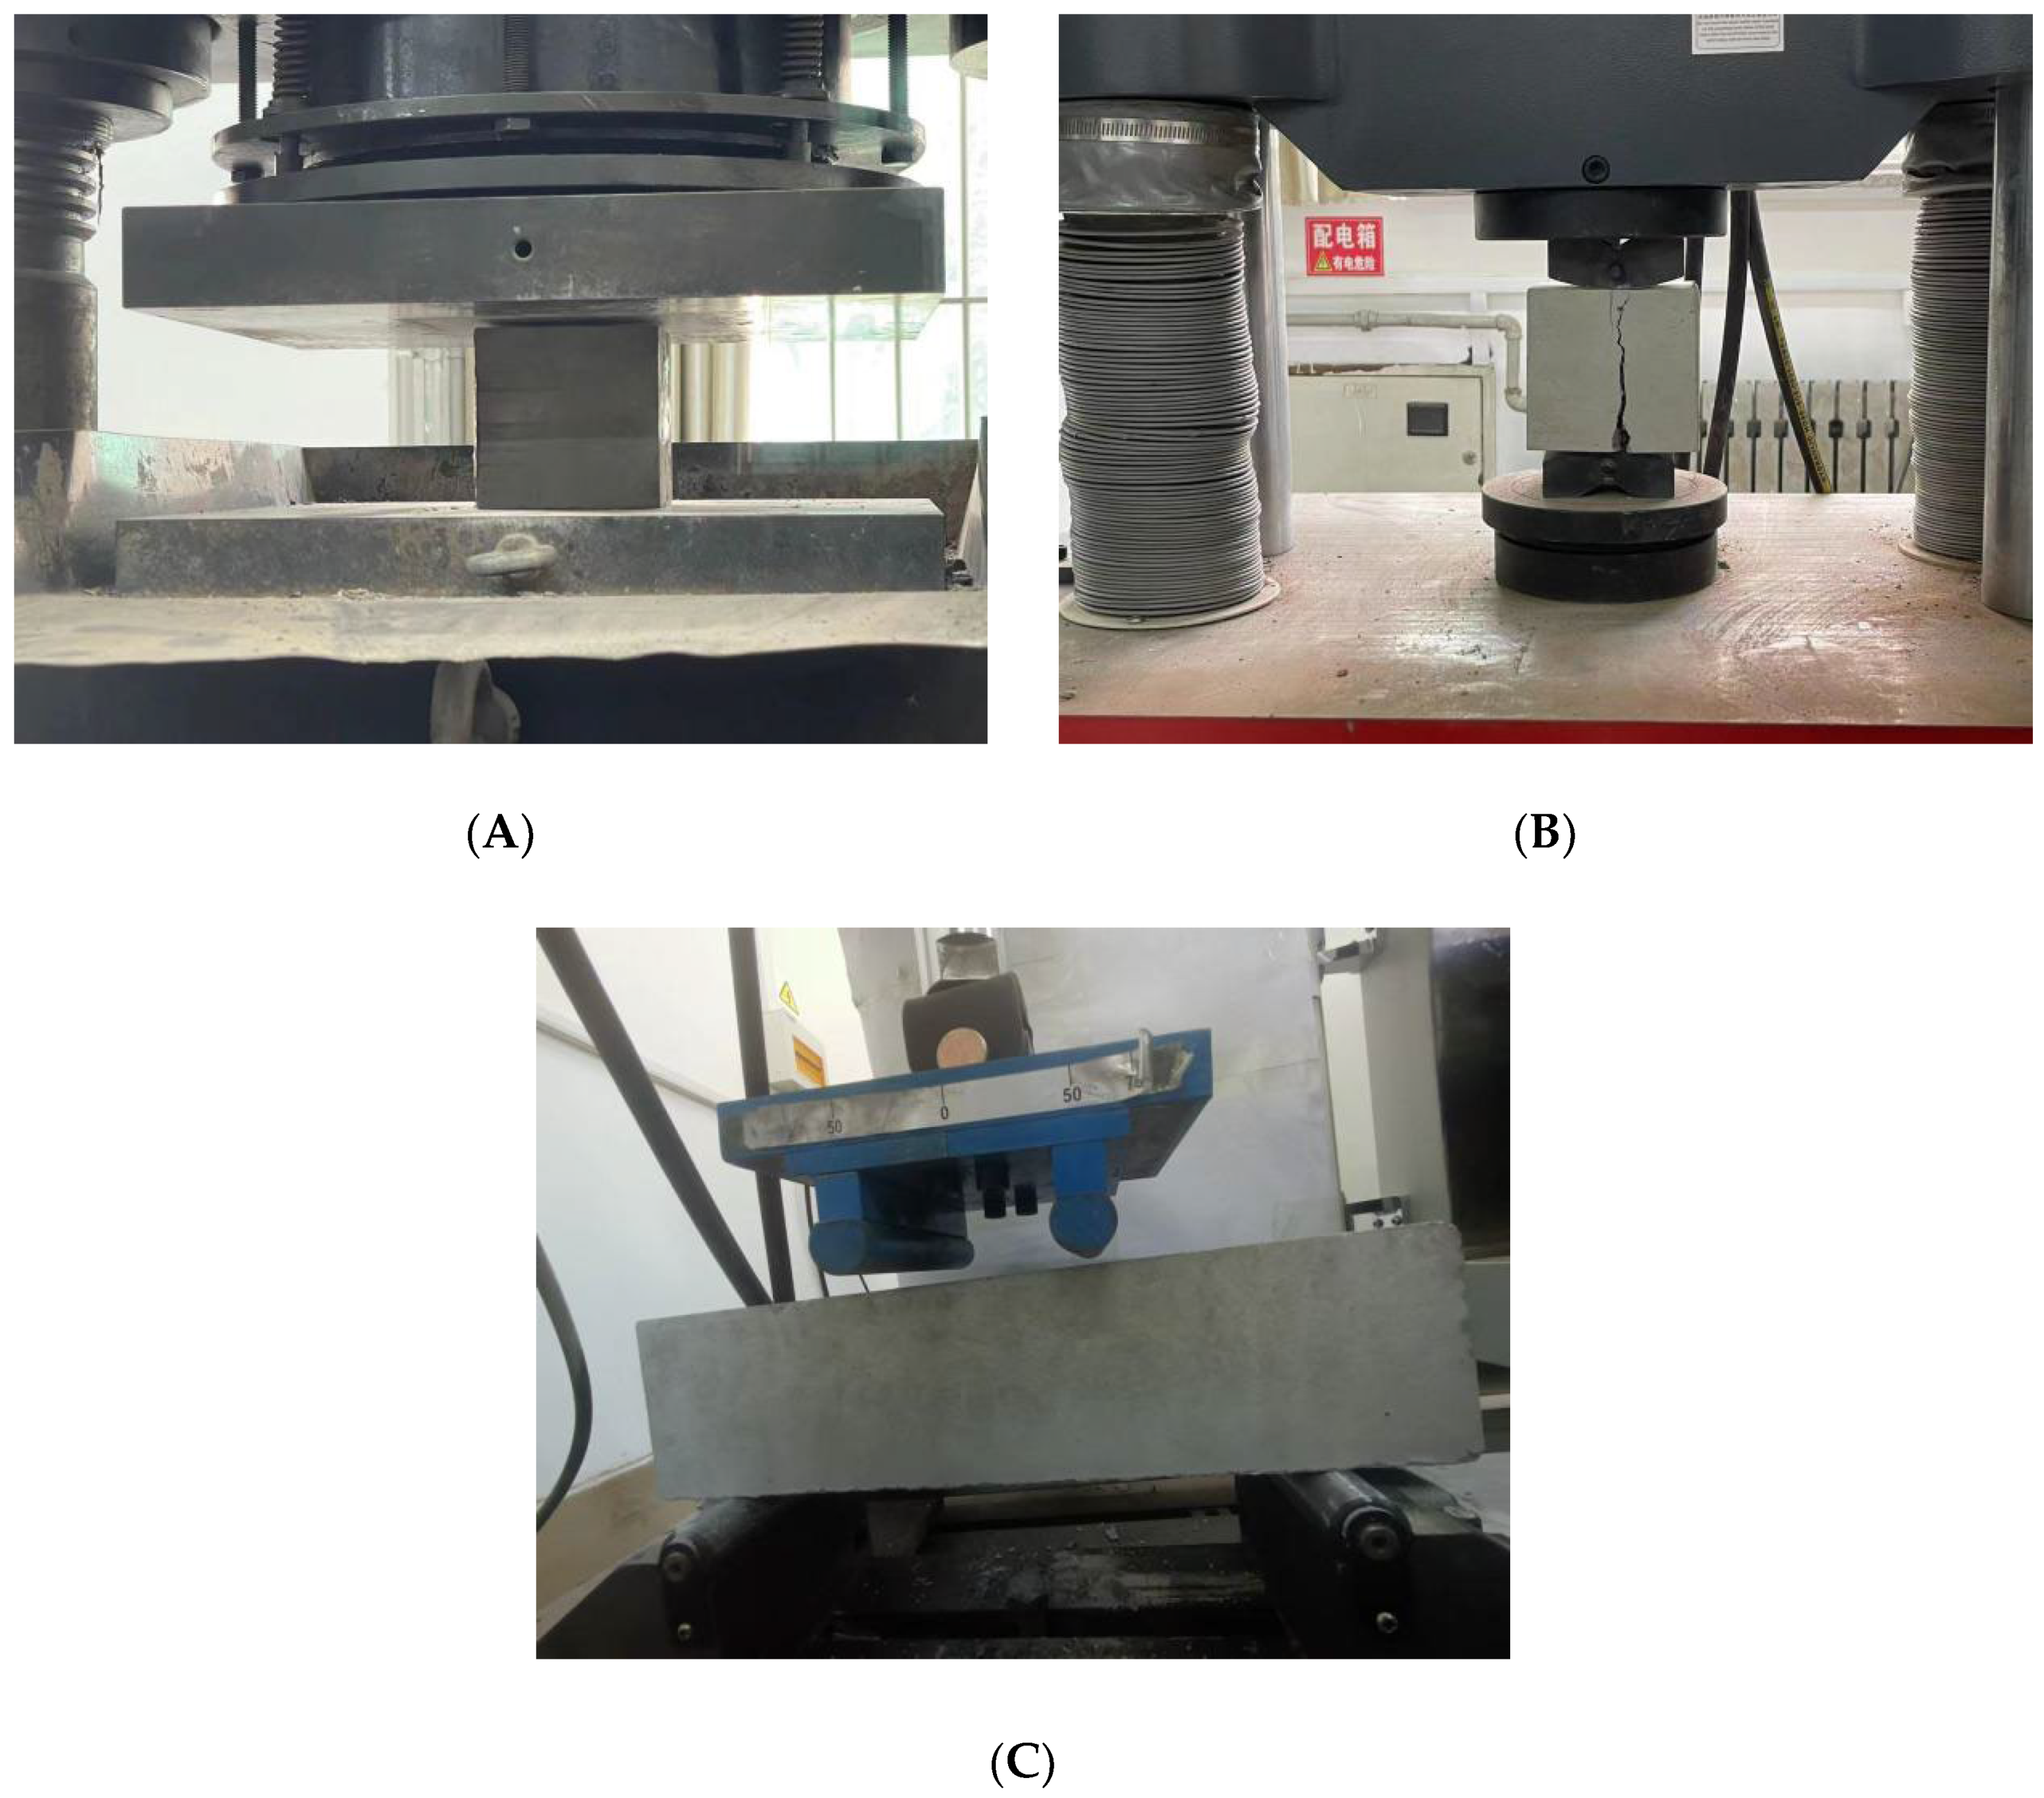
2.3.1. Mechanical Performance Test Sets

In accordance with the requirements of GB/T 50081-2019 [30], a universal servo-hydraulic testing machine was utilized to conduct mechanical properties tests, as shown in Figure 3. Square specimens (100 mm × 100 mm × 100 mm) were utilized for compressive and tensile tests, and prismatic specimens (100 mm × 100 mm × 400 mm) were utilized for flexural tests [31]. The loading mode was selected for uniform loading force.

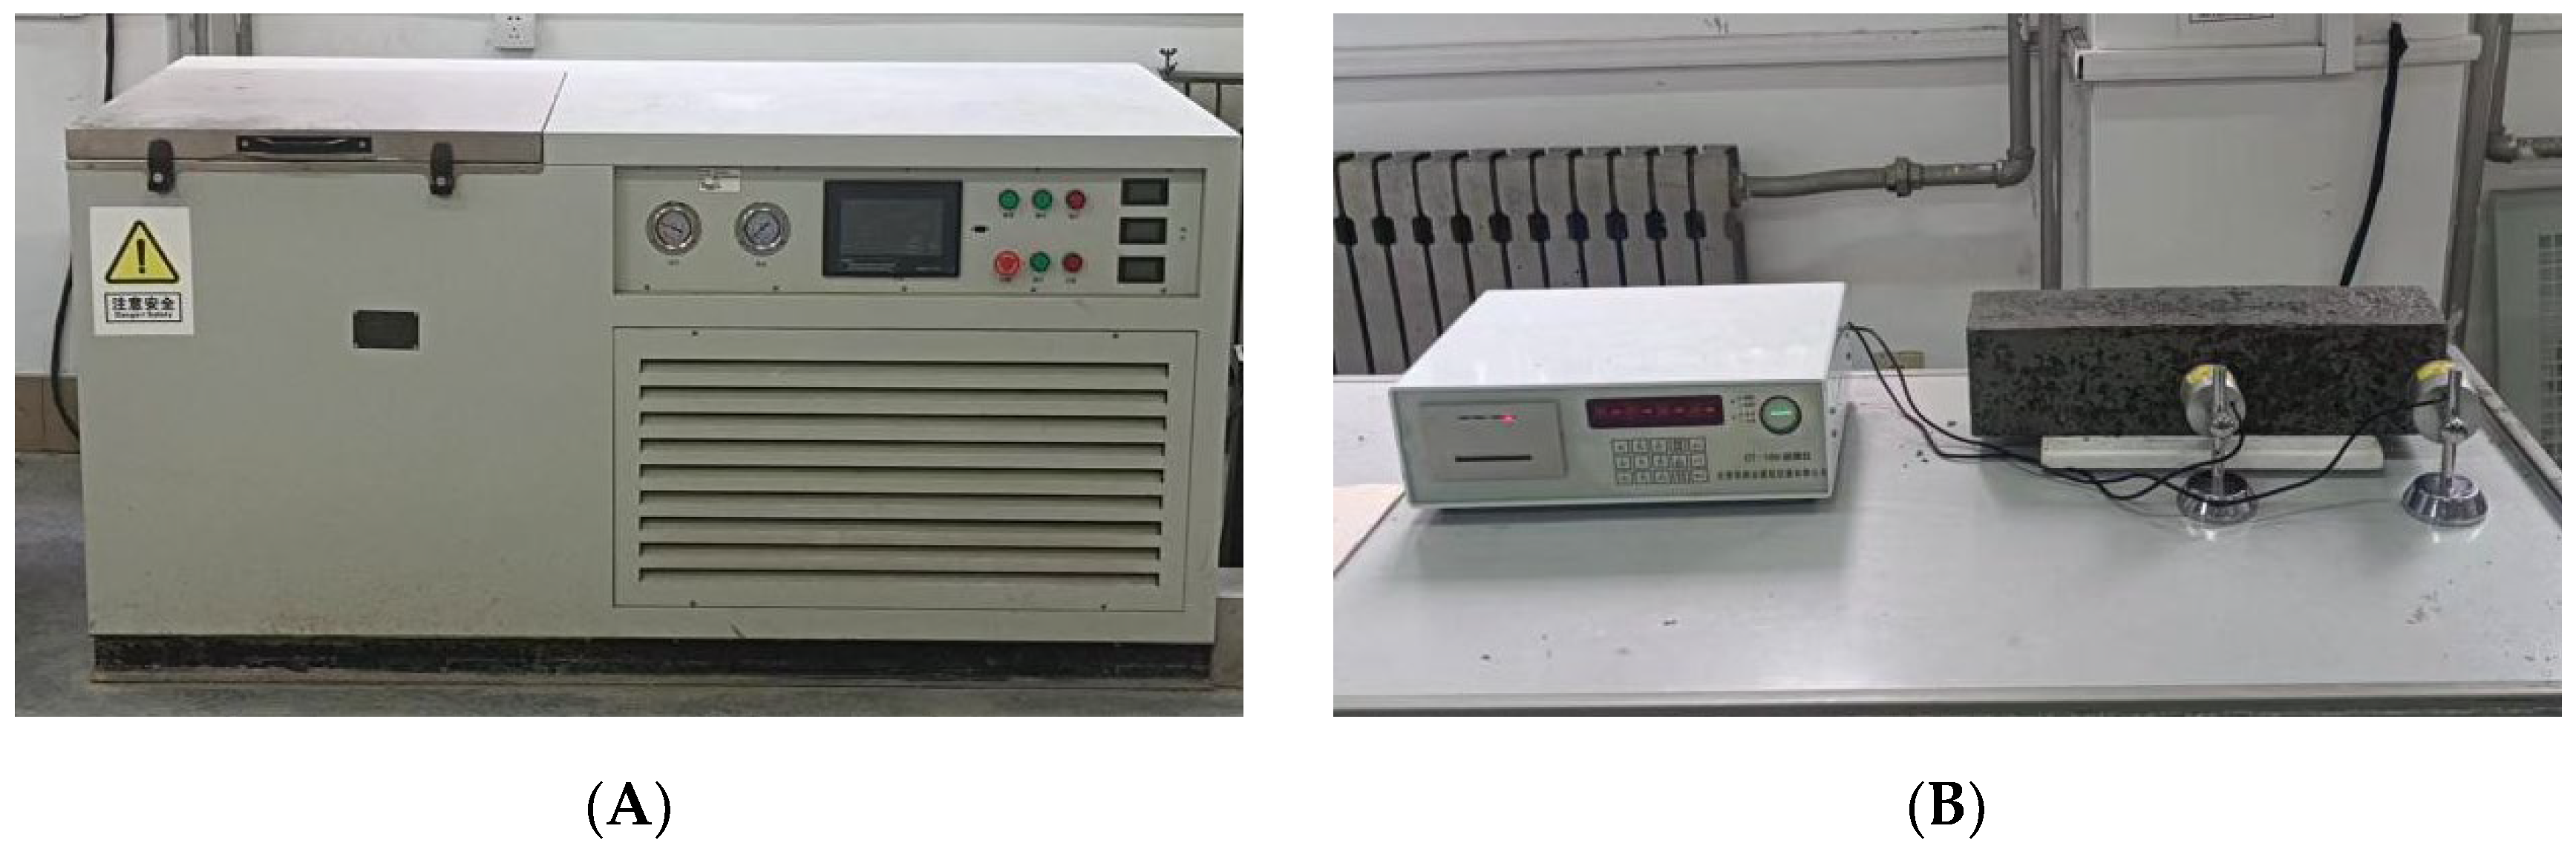
2.3.2. Frost Resistance Test Sets

Following the requirements of GB/T 50082-2009 [32], the main equipment used in the frost resistance test included a rapid freezing and thawing machine and an RDEM instrument as shown in Figure 4. Each freezing and thawing cycle may not exceed 4 h, and the thawing time may not exceed 1/4 of the whole process. The maximum and minimum temperatures of the freezing and thawing machine were set to 5 ± 2 °C and −18 ± 2 °C, respectively.

2.3.3. Scanning Electron Microscopy (SEM)

Morphological features of concrete specimens were observed at the microscopic level using FEI Quantum 250 SEM, as shown in Figure 5. The concrete specimens were not conductive and needed to be sprayed with metal before scanning electron microscopy analysis.

3. Results and Discussion

3.1. Analysis of the Mechanical Performance

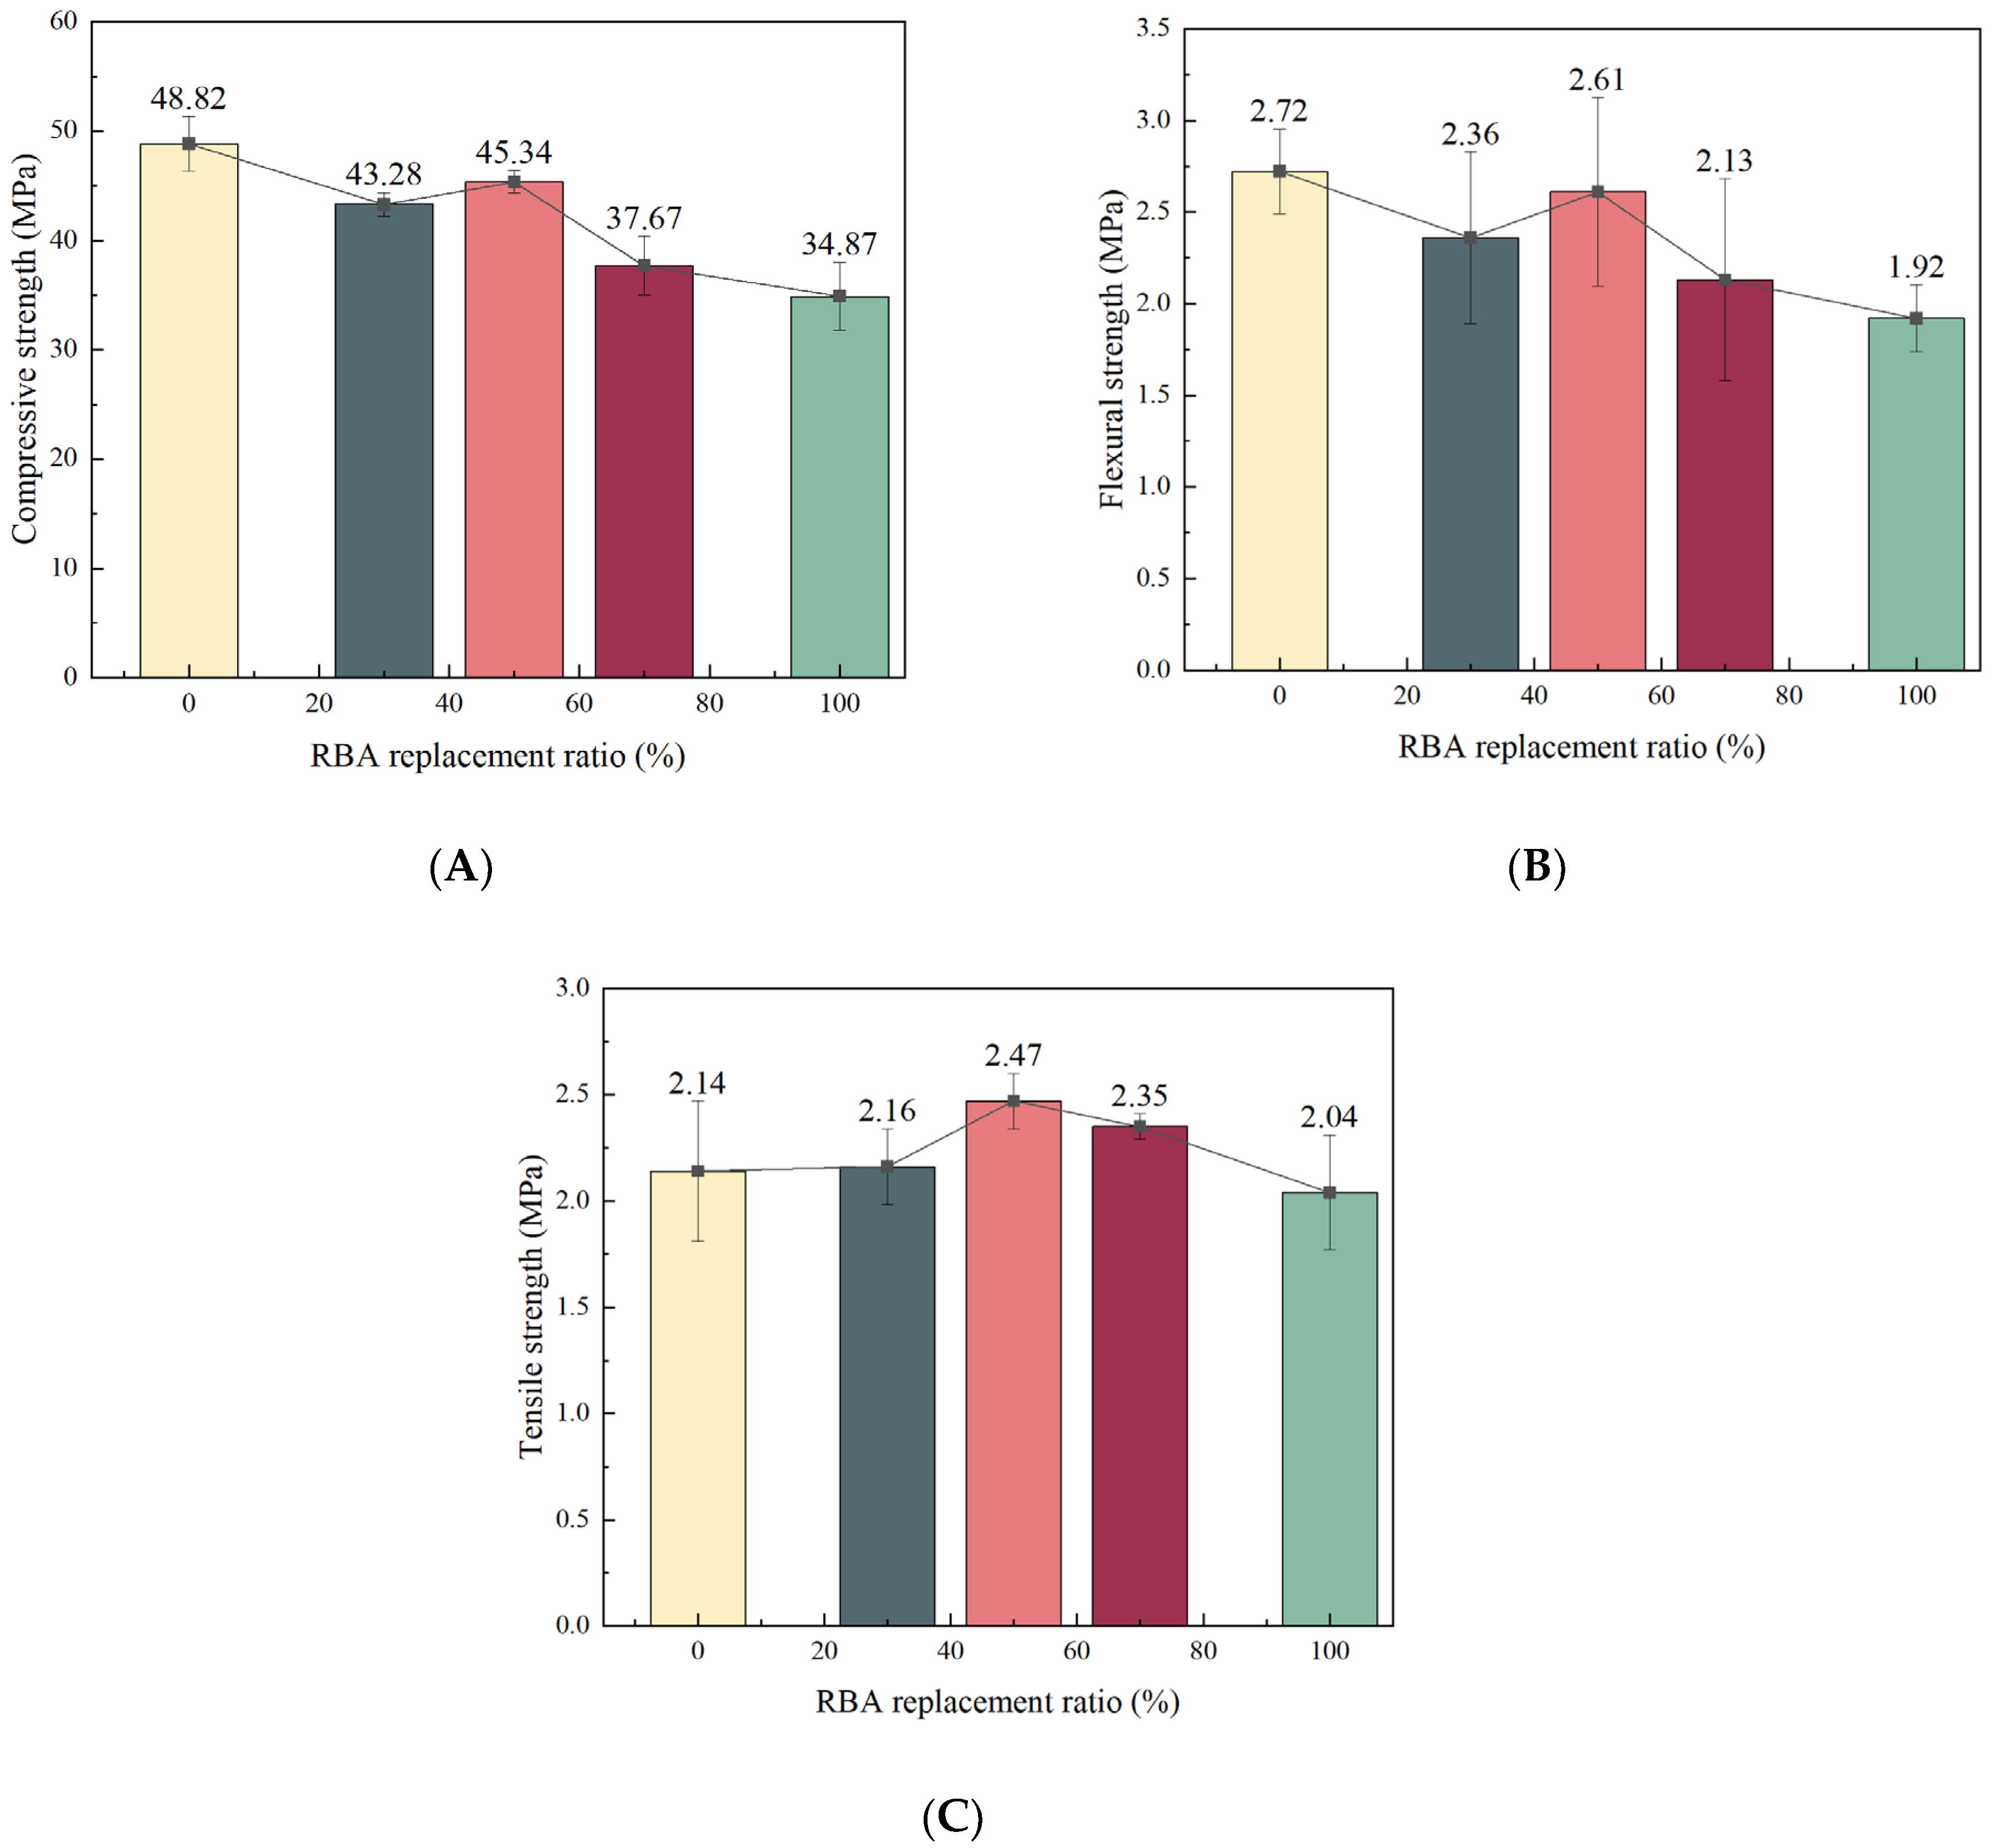
3.1.1. Mechanical Strength

The compressive and flexural properties of the RBA concrete are shown in Figure 6. As the RBA substitution rate increased, compressive and flexural properties both decreased, then increased and decreased again, but the compressive and flexural properties of the rising section (the substitution rate of RBA was 30–50%) were still lower than those of ordinary concrete. The compressive and flexural properties of 100% RBA concrete reached a minimum of 34.87 MPa and 1.92 MPa, which were 28.57% and 29.41% lower than 0%RBA concrete. The tensile property first increased and then decreased following the increase in the RBA substitution rate. The tensile property of the decreasing section (the replacement ratio of RBA was 50–70%) was higher than 0%RBA concrete. At a 50% RBA substitution rate, the tensile property of the RBA concrete reached 2.47 MPa, which was 15.42% higher than ordinary concrete.
Due to the rougher surface of the RBA, there is a larger force of mechanical nipping of the RBA to mortar [33,34]. The main components of RBA were SiO2, Al2O3, and Fe2O3, which led to a certain amount of volcanic ash from the powder on the surface layer of RBA, which could generate more C-S-H gels and other hydration products and enhance the performance of the interface transition zone [35,36]. On the other hand, since the waste clay bricks had suffered a certain degree of weathering and carbonization during use [37] and were damaged by the jaw crusher during processing, the prepared RBA showed more microcracks and a looser structure, which made the crushing indices of the RBA much greater than NCA [38,39] and thus greatly affected the role of the skeleton assumed by the aggregates within the concrete. When the substitution rate was 30–50%, NCA compensated for part of the strength deficiency for RBA, which made the RBA’s negative impact in the internal concrete skeleton less than the positive impact in the interfacial transition zone, at which time the compressive, flexural, and tensile strengths showed an increasing trend. At a 50–100% RBA substitution rate, excessive RBA increased the area of internal defective zones in the concrete, resulting in a much more negative influence on the concrete internal skeleton than the positive impact of the interfacial transition zones, at which time the compressive, flexural, and tensile strengths showed a decreasing trend.

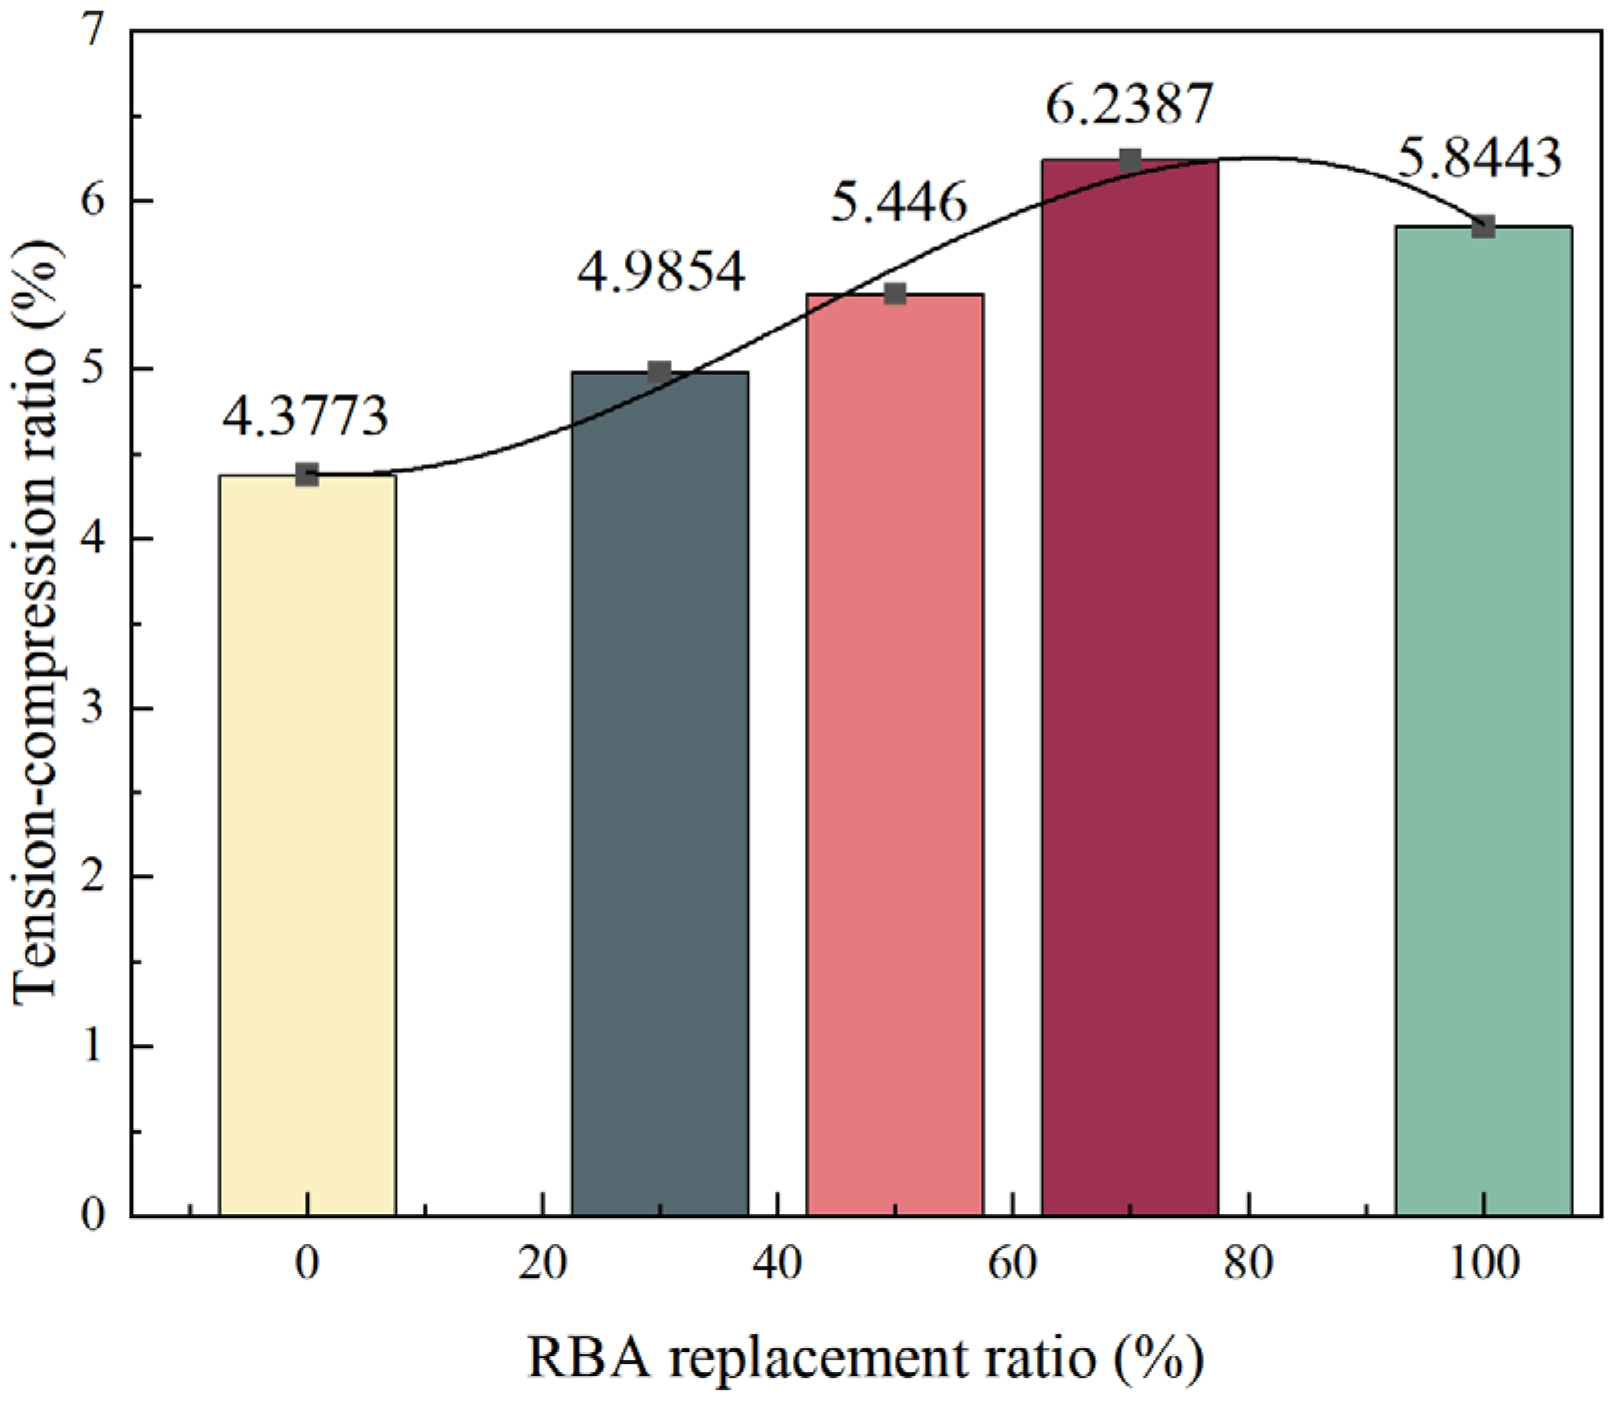
3.1.2. Tensile–Compression Ratio (TCR)

The TCR is an indicator for evaluating the plasticity of a material [40,41]. The TCR is calculated as the tensile strength divided by compressive strength. The TCR of the RBA concrete is shown in Figure 7. The TCR of recycled concrete first increased and subsequently decreased following the increase in RBA. At RBA of 30%, 50%, 70%, and 100%, the TCR raised by 13.8%, 24.41%, 42.52%, and 33.51%, respectively. RBA decreased the compressive property and increased the tensile property at a 0–70% substitution rate of RBA, resulting in an increase in the TCR; RBA enhanced the compressive property and reduced the tensile property at a 70–100% substitution rate of RBA, resulting in a drop of the TCR. This showed that RBA can improve the plasticity of concrete [42,43].
To further quantify the relationship between the RBA substitution rate and the TCR, a fitting model between the RBA substitution rate (r) and the tensile pressure ratio (TC = fts/fcu) was established by the least squares method in the experiment, as shown below:
T C = 4.39172 0.00611 r + 0.001 r 2 ( 7.93452 e 6 ) r 3       R 2 = 0.9813

3.2. Analysis of Frost Resistance

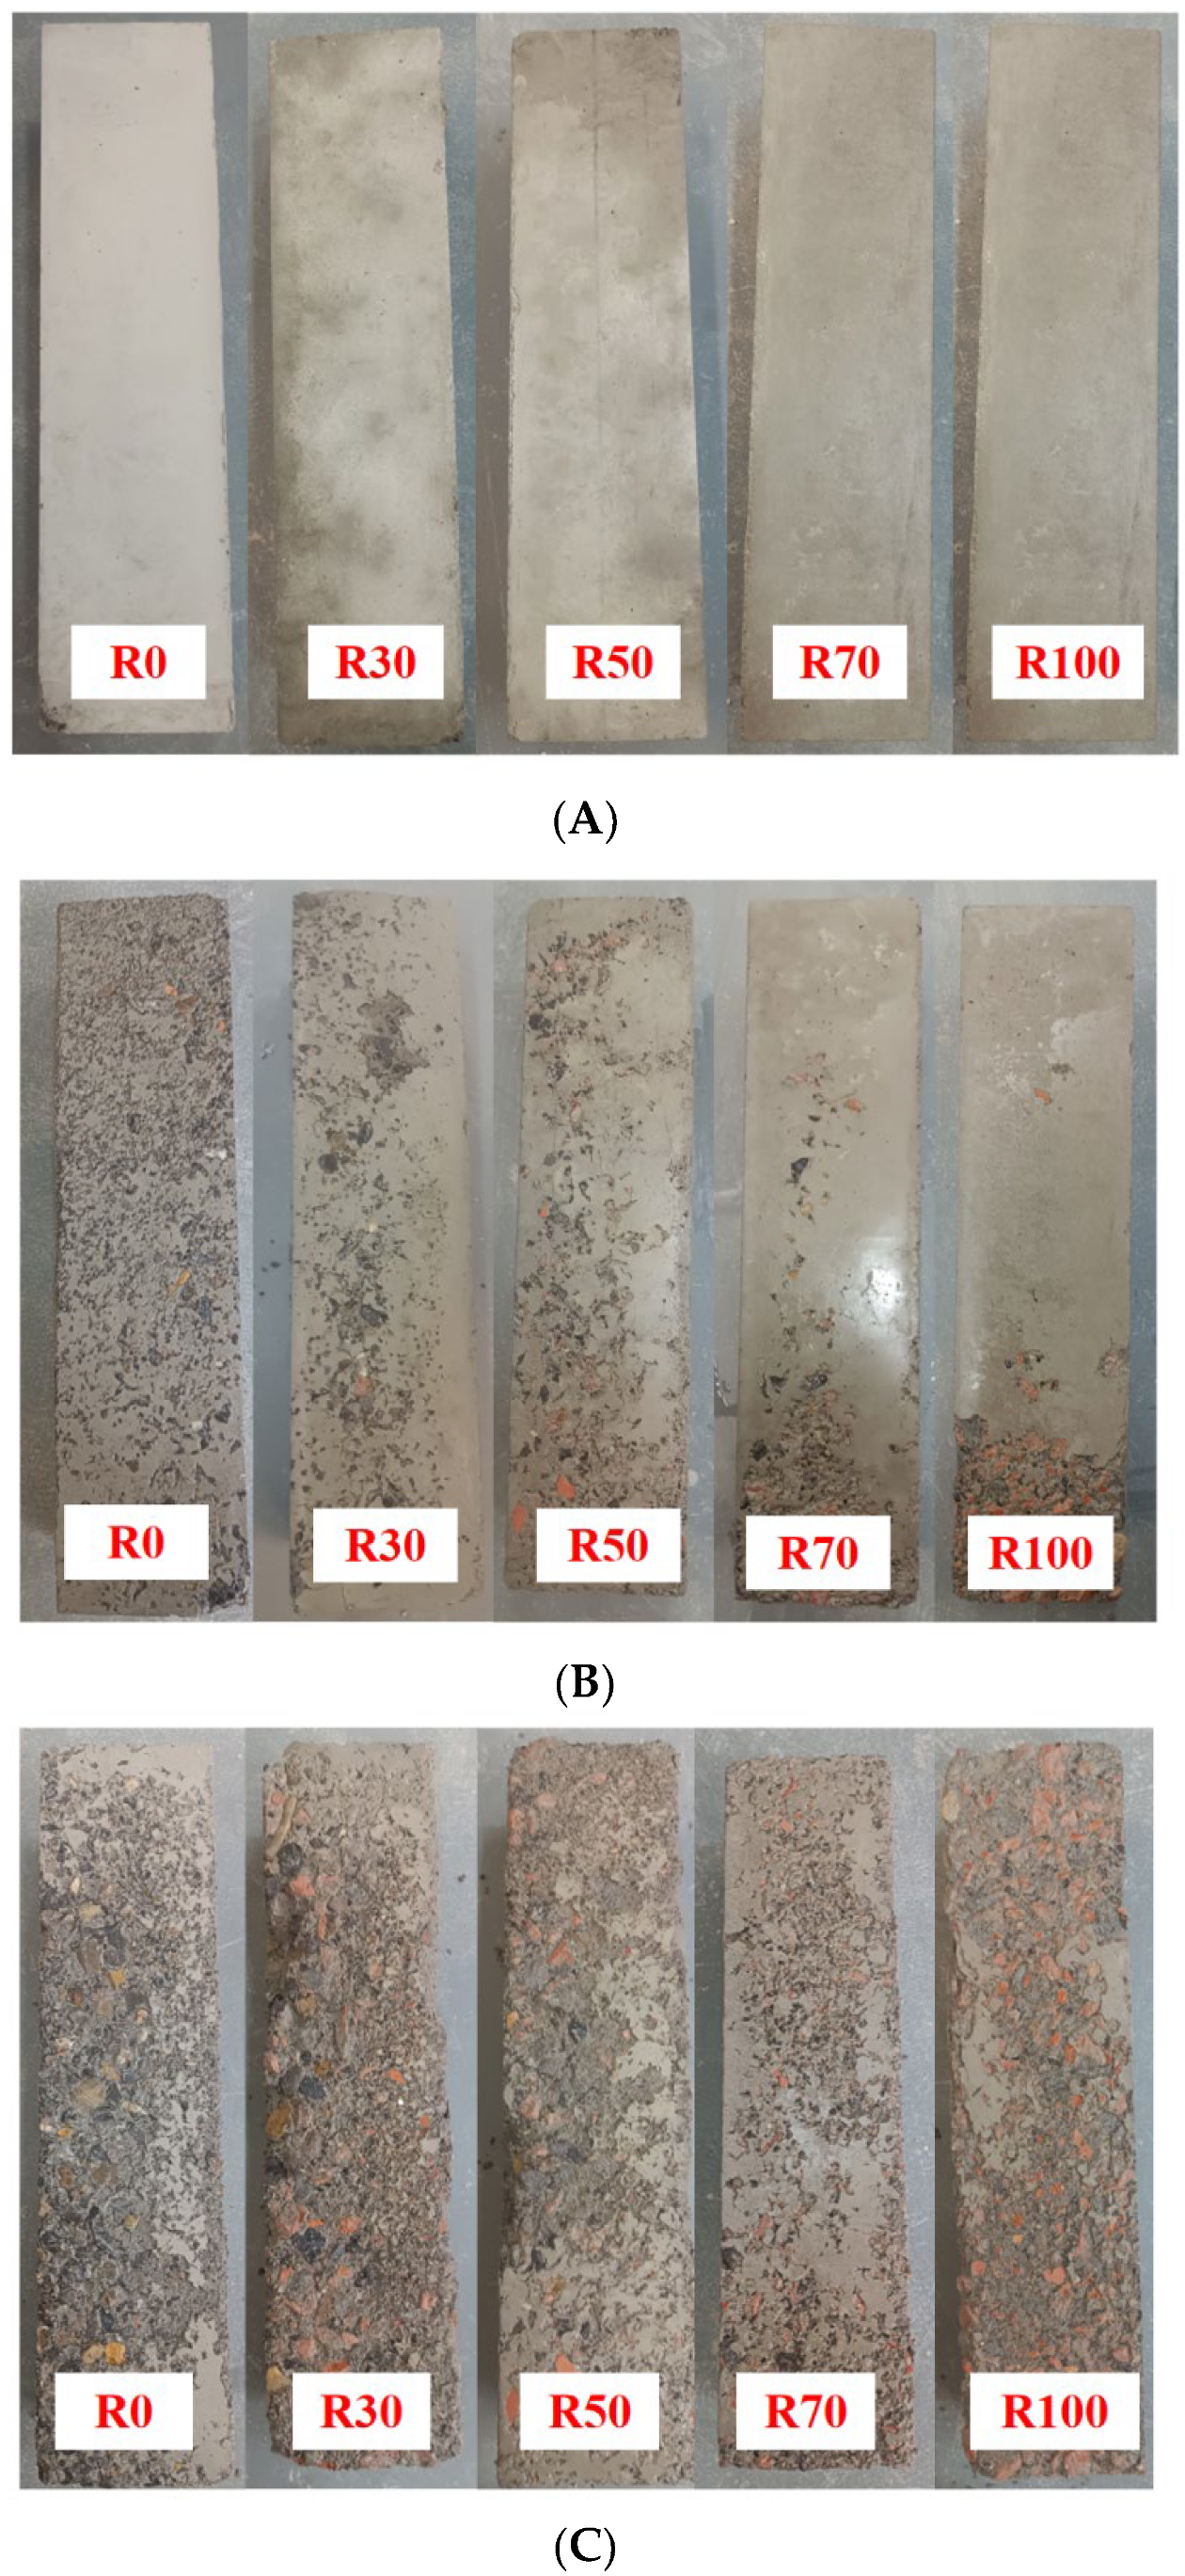
3.2.1. Apparent Characteristics
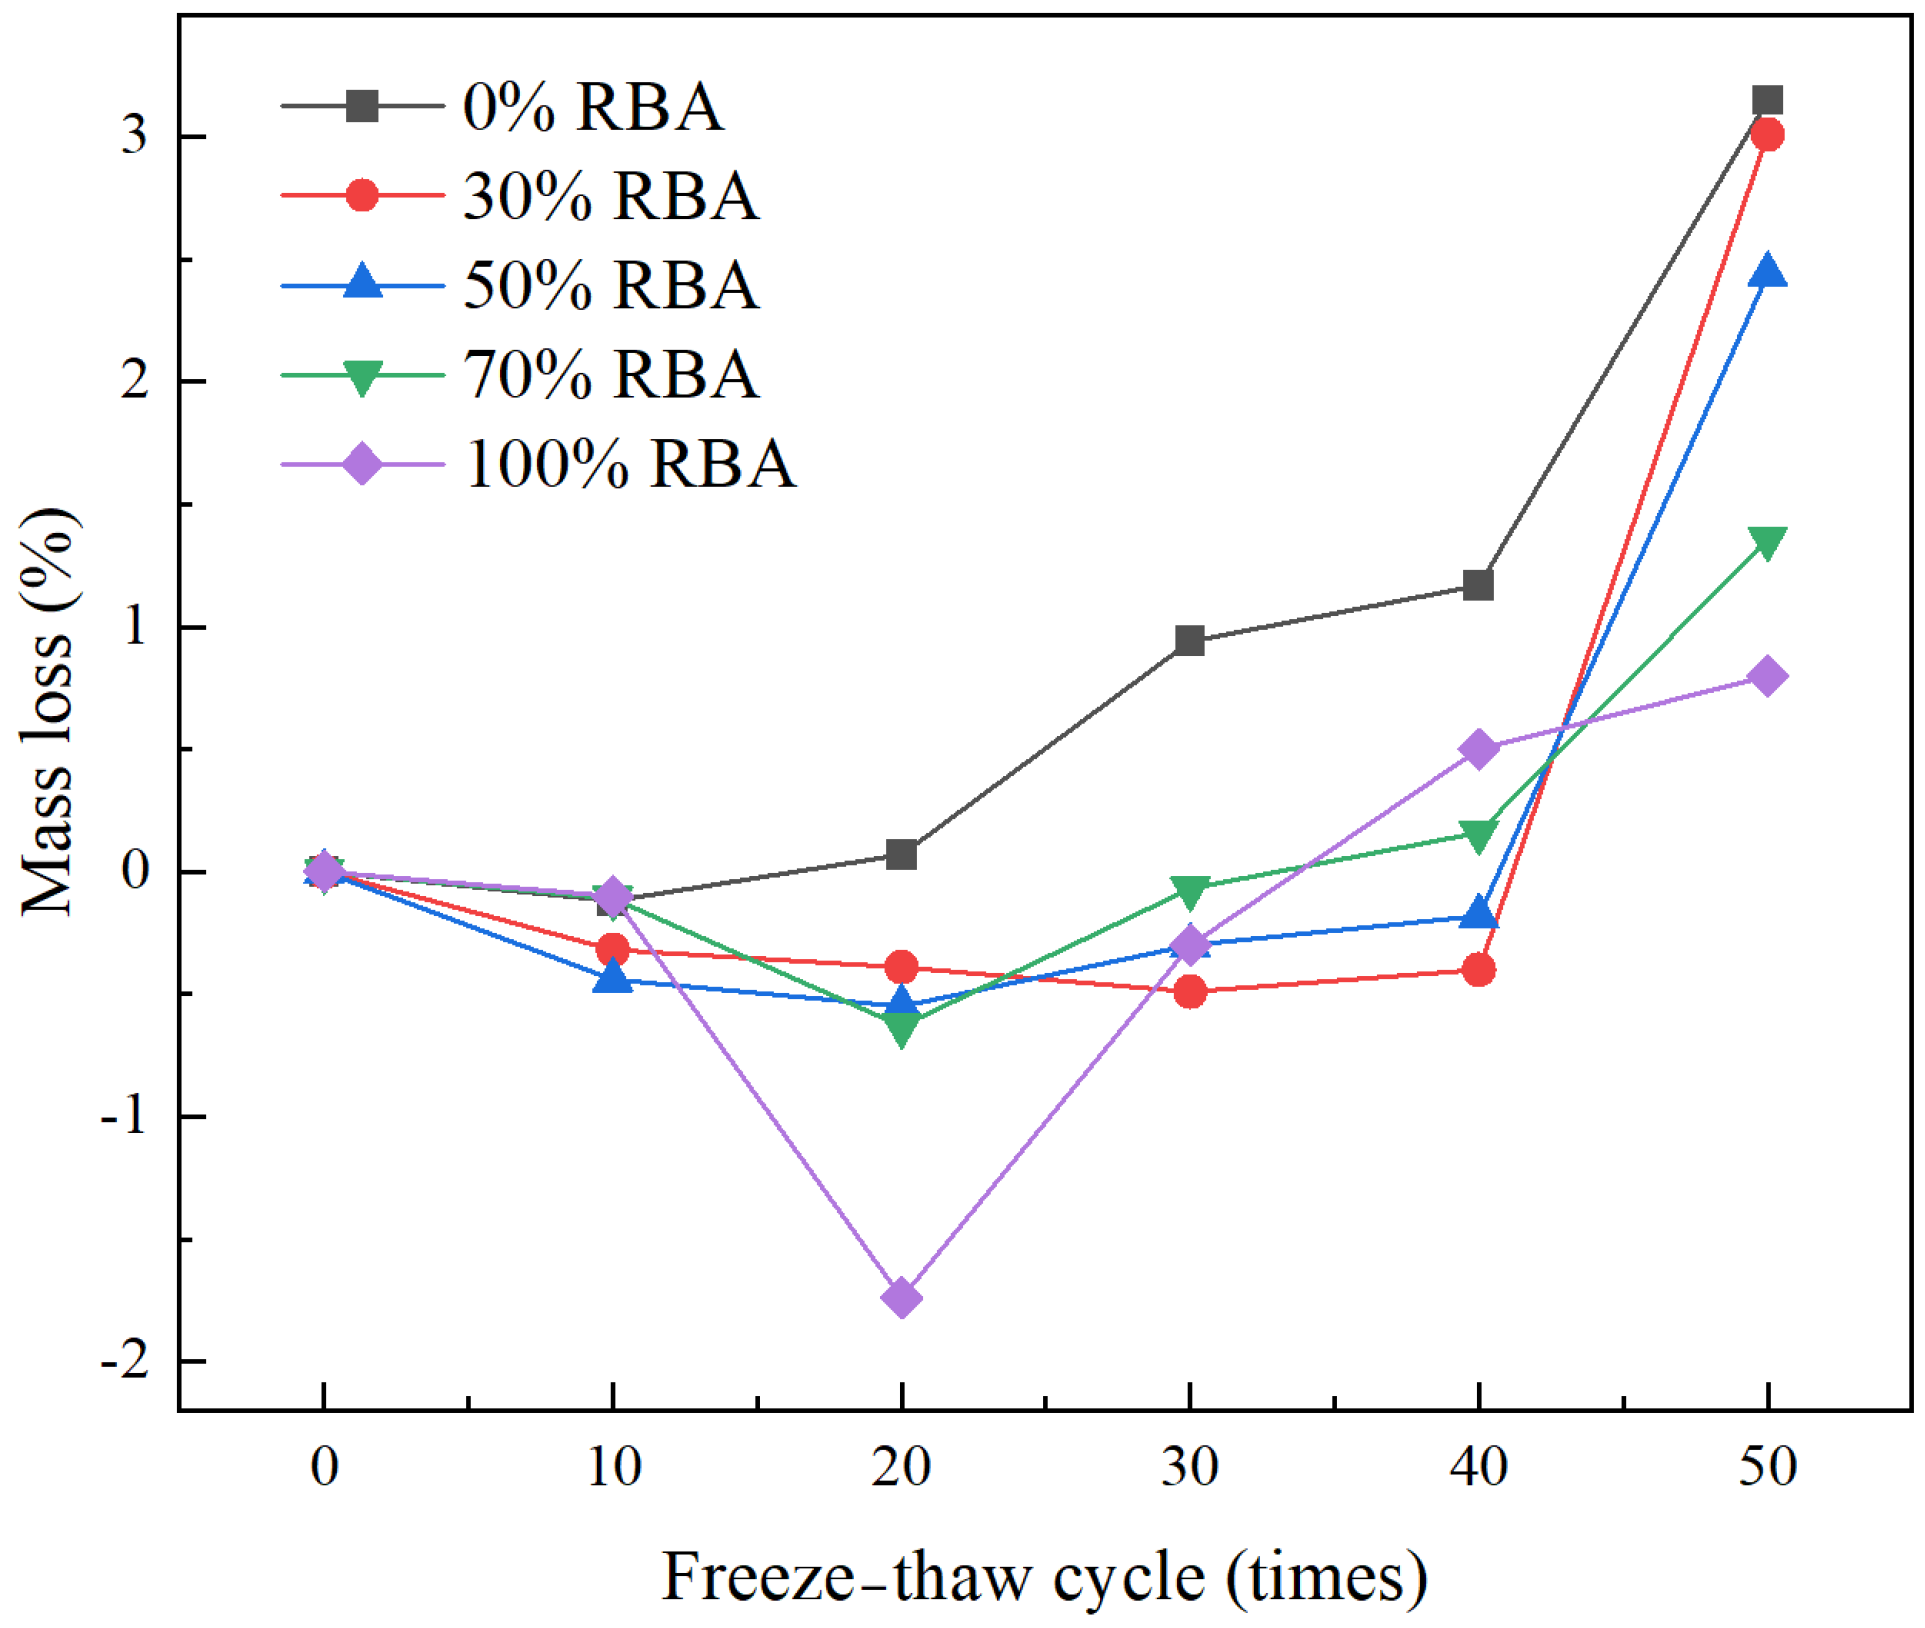
The appearance damage characteristics of concrete in the course of freezing and thawing cycles are shown in Figure 8. The face of the concrete was flat and smooth before freezing and thawing. At 0–30 cycles, the face of specimens became rough, a small amount of debris detached from the surface mortar, and a lot of microholes appeared. At 30–50 cycles, the mortar on the face of the concrete had almost entirely fallen off, the coarse aggregate was exposed or even spalled, some edges and corners fell off, and the holes gradually connected [44]. The face of the concrete produced a significant change in the course of freezing and thawing cycles as the RBA substitution rate increased. At 30 cycles, the area of micropores on the face of the concrete is reduced, and smoothness increases as the RBA substitution rate increases. At 50 cycles, coarse aggregate spalling decreased, and completeness increased as the RBA replacement rate increased. Liu et al. [45] and Li et al. [46] demonstrated that pores have an important role to play in the course of freezing and thawing cycles. The pores within the RBA were mostly filled with hydration products, forming many closed pores, which can greatly buffer the water pressure generated by the water freezing inside the concrete. Therefore, the space of closed pores inside concrete became larger as the RBA substitution rate increased. This also provided a greater buffer for the water pressure generated in the pores in the course of freezing and thawing cycles, thus reducing the apparent damage to concrete.

3.2.2. Mass Loss

The mass loss of the RBA concrete is shown in Figure 9. As the freezing and thawing cycles increase, the mass loss of concrete first reduces and then rises. The surface mortar of concrete specimens will gradually spall off in the process of freezing and thawing [47,48]. On the other hand, the concrete specimen will continuously absorb the water solution from the outside as the pores and cracks of concrete develop gradually [49]. In the preliminary stage, the cracking develops rapidly, which causes the mass of the absorbed external water solution to be greater than the spalled mortar, and the mass of the concrete being raised. In the later stage, the crack development reached the limit, and the specimen hardly absorbed the external water solution, while the accumulated damage of the specimen was large, causing the mortar and even aggregate spalling to accelerate continuously, resulting in the mass of the spalling being larger than absorbed water, and the mass of the specimens being decreased [50,51].
Upon 50 cycles, the mass loss of the specimens gradually decreased as the RBA substitution rate increased. At a 100% RBA substitution rate, the minimum mass loss of concrete was 0.8% upon 50 freezing and thawing cycles, which was 76.4% lower than ordinary concrete. The major reason for this is that lots of pores in the RBA concrete were closed by the C-S-H gels, resulting in the forming of closed pores [52]. These closed pores can accommodate the unfrozen water that migrates out of the mortar as the water freezes and expands, which largely relieves the frozen pressure, thus reducing the freezing and thawing damage of concrete [53,54].

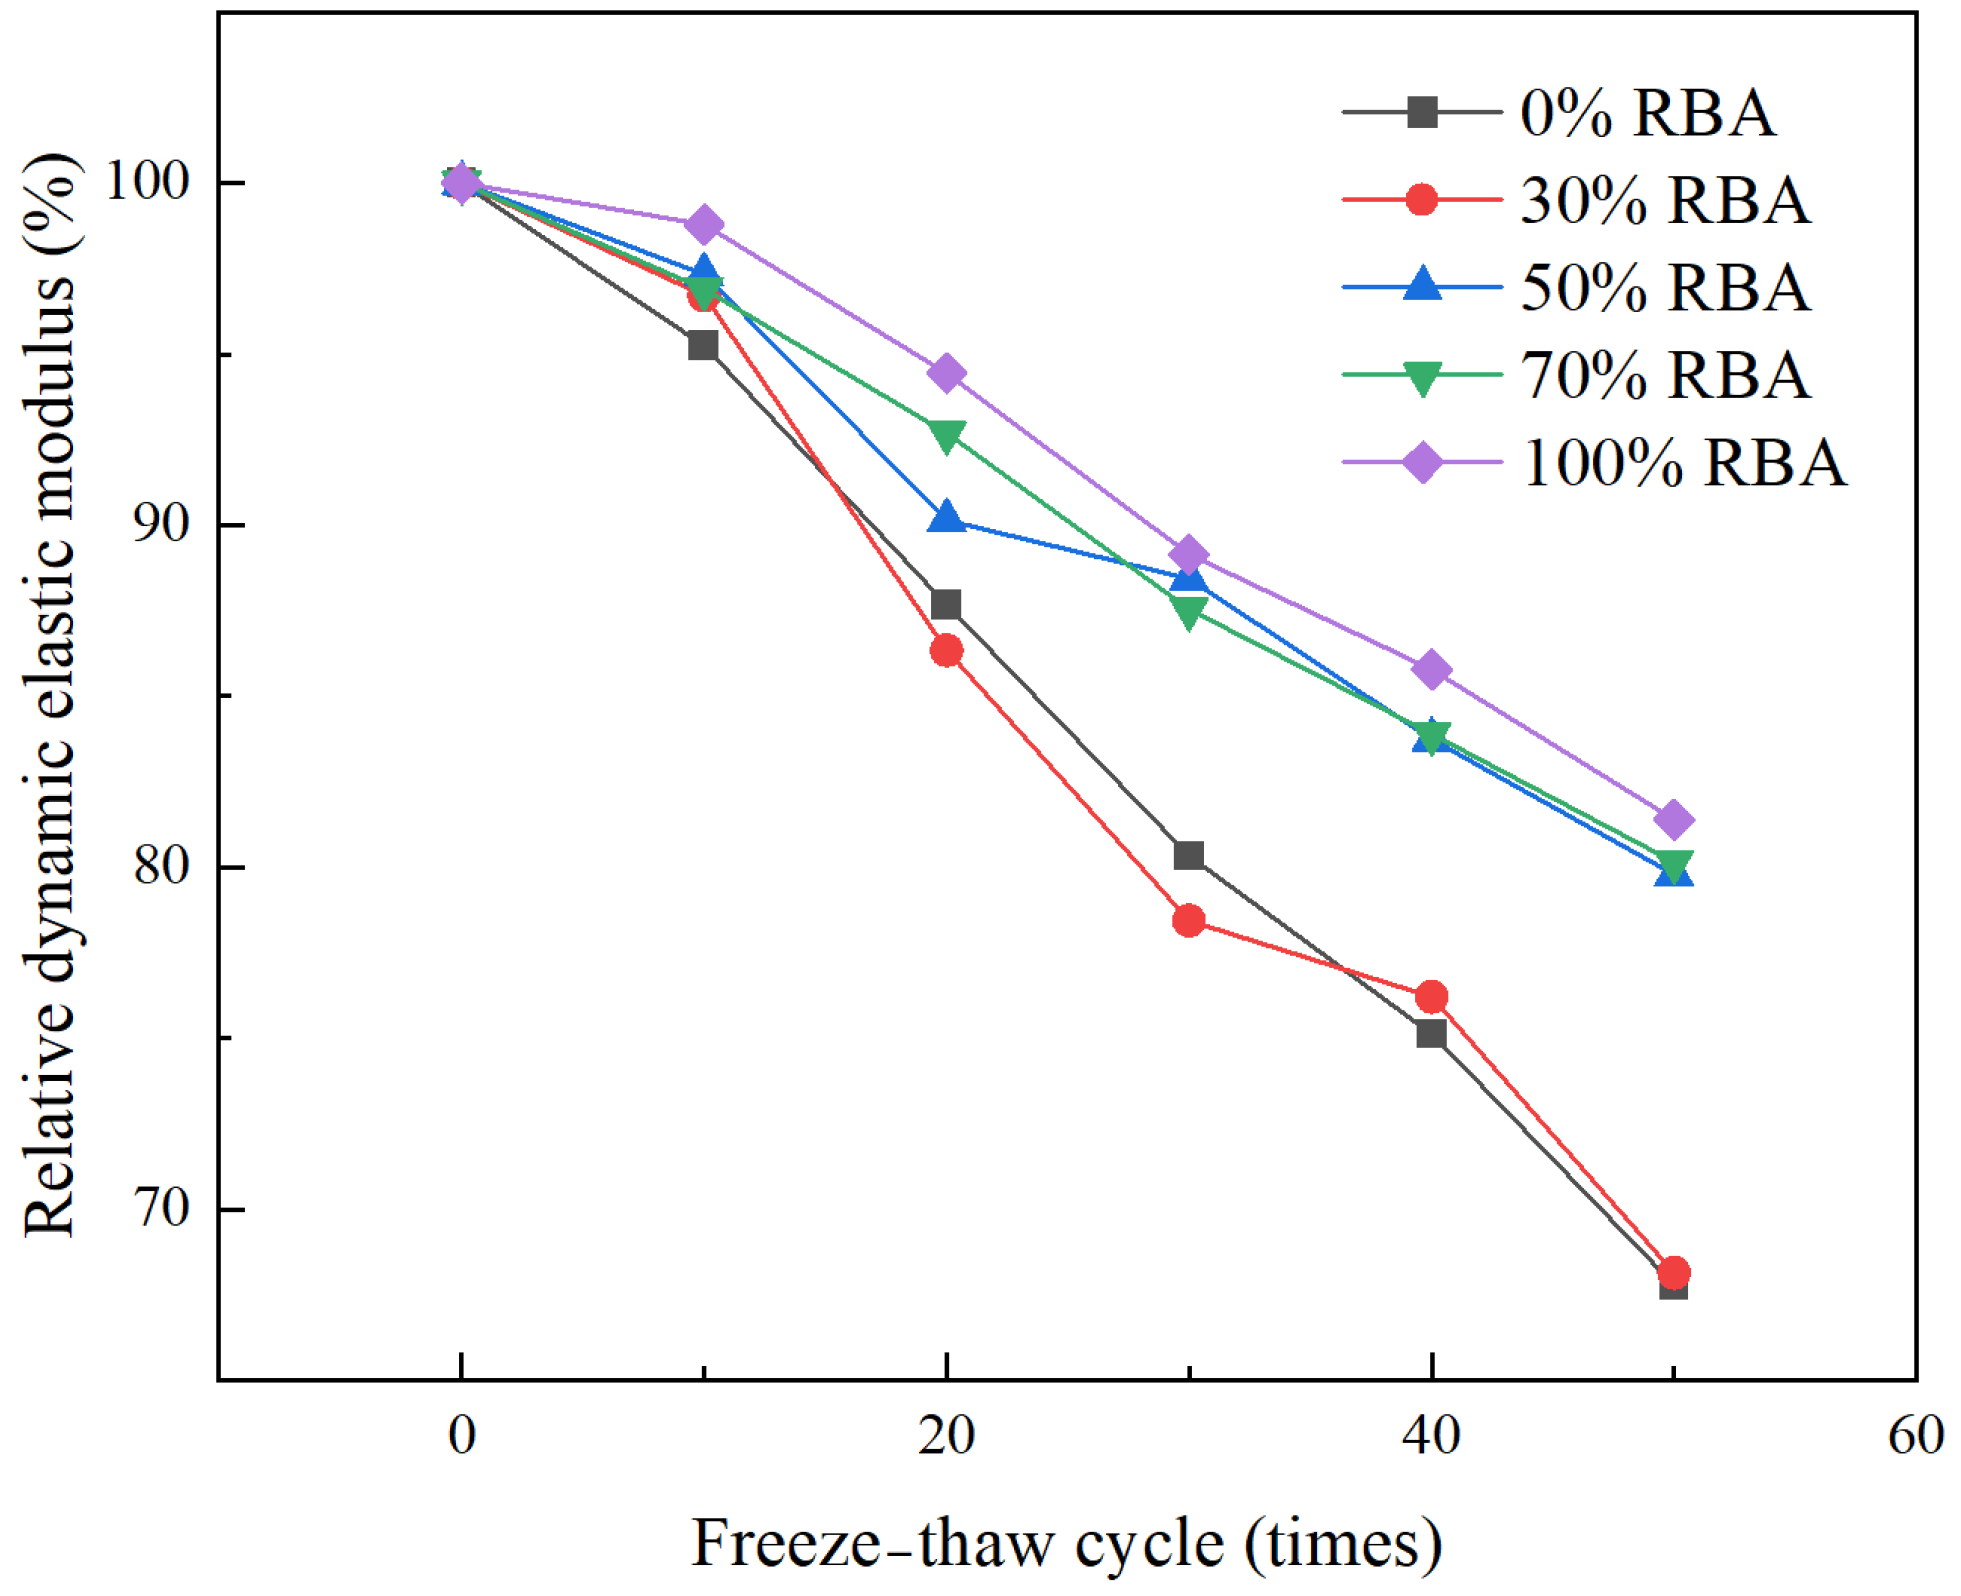
3.2.3. Relative Dynamic Elastic Modulus (RDEM)

The relative dynamic elasticity of RBA concrete is shown in Figure 10. The resonance frequency of RBA concrete in freezing and thawing is connected to the density [55], and the development of cracks can be identified by the DT-10 W model of the RDEM instrument [56]. The cracks in the specimens gradually formed and developed as the freezing and thawing cycling increased, leading to a decrease in RDEM. At 50 cycles, the RDEM in concrete went on to increase as the RBA increased. When the RBA substitution rate was 100%, the RDEM after 50 freezing and thawing reached 81.39%, an increase of 20.08% compared to ordinary concrete. The elastic modulus of the crushed stone aggregates in ordinary concrete was greater than the hardened cement paste surrounding it and differed by up to 30 GPa, resulting in concrete being an extremely heterogeneous material [57]. However, RBA has a lower modulus of elasticity, which is more similar to the mortar’s elastic modulus, and the two were able to form a relatively more coordinated and homogeneous material, thus reducing the stress concentration phenomenon within RBA concrete in freezing and thawing cycles [58,59]. Therefore, RBA can be helpful in enhancing the RDEM of concrete.

3.3. Freezing and Thawing Damage

In the course of freezing and thawing, the water solution causes repeated freezing expansion and pressure on the pore walls of concrete, resulting in an increase in the area of internal cracks. To better characterize the concrete damage state in the freezing and thawing, there is a need to describe it quantitatively. The concrete freezing and thawing damage model is mainly dependent on the variation of parameters such as mass loss rate and RDEM in the process of freezing and thawing cycles [60,61]. Among them, the cumulative damage model based on the RDEM can better represent the real status of internal damage in concrete [62,63]. The damage to concrete in the process of freezing and thawing is defined as the degree of damage (DN) based on the theory of damage mechanics and is given by the following equation:
D N = 1 P N
where DN indicates the freeze–thaw damage; PN indicates the RDEM (%). The raw DN data for RBA concrete are shown in Table 5.

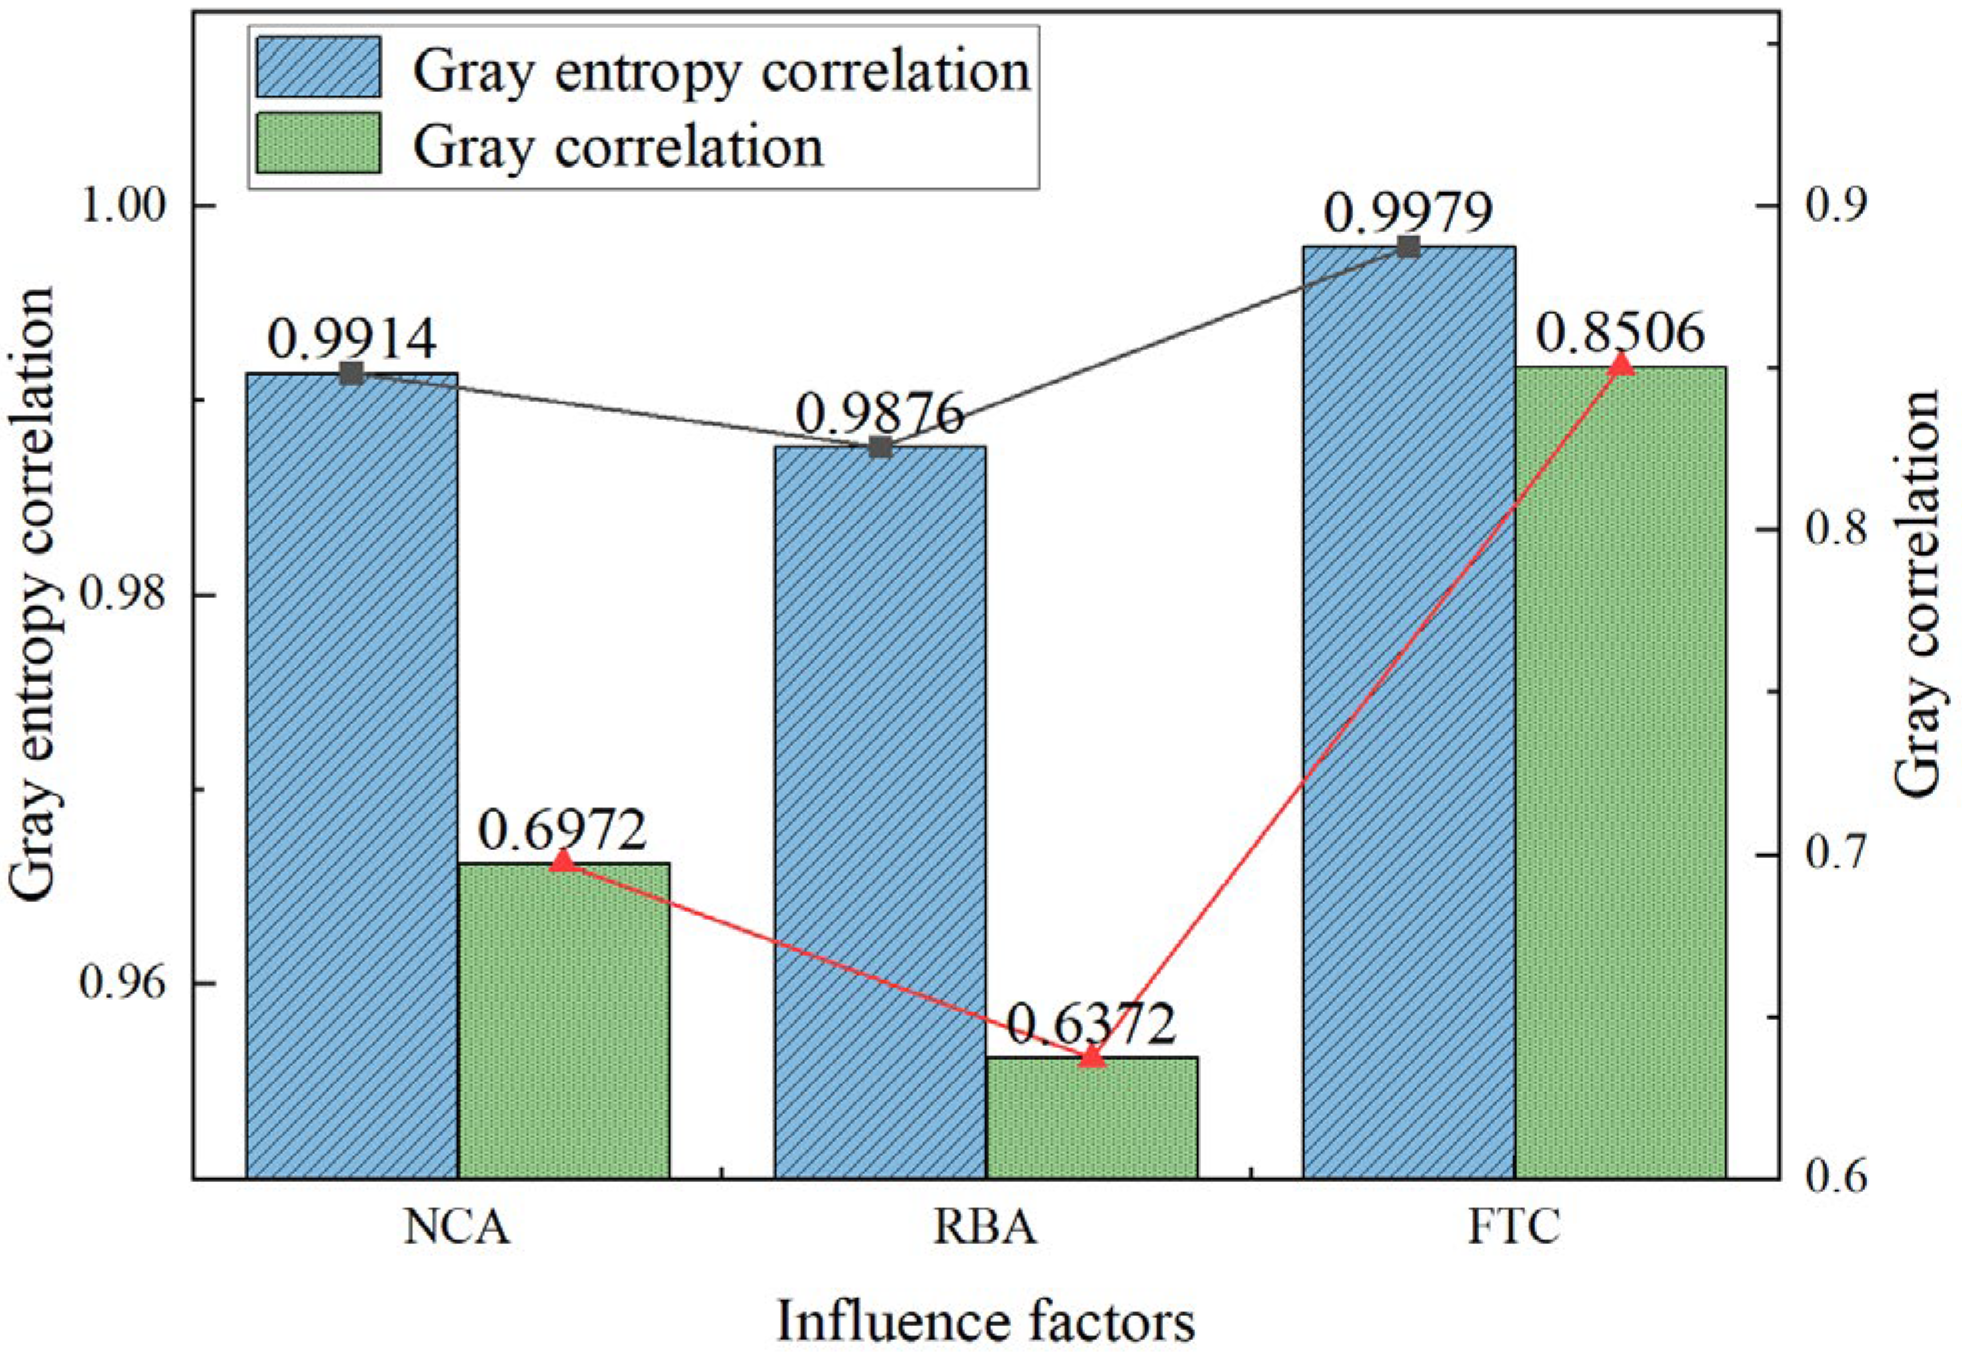
3.3.1. Quantitative Analysis of the Influence of Freeze–Thaw Damage Factors

The gray entropy correlation analysis method further refines the gray correlation model using the entropy weight method. Compared with the gray correlation analysis method, the gray entropy correlation analysis method can avoid the excessive influence of the correlation value at local points on the whole system and can effectively discriminate between major and minor factors [64,65]. To further investigate the influence of NCA, RBA, and freezing and thawing cycles on the DN, the gray entropy correlation model was used for quantitative analysis.
(1)
The original matrix D is divided into several sequences, where X represents the comparison sequence and Y represents the reference sequence.
(2)
D′ is the matrix of D after dimensionless processing.
D i ( k ) = D i ( k ) 1 n k = 1 n D i ( k )
(3)
The difference matrix Δ is calculated.
Δ = Y j ( k ) X i ( k )
(4)
The two-stage maximum value M and two-stage minimum value m of Δ are calculated.
M = max i   max k   Δ m ( k ) m = min i   min k   Δ m ( k )
(5)
The correlation coefficients are calculated, where ρ is 0.5.
ε i ( k ) = m + ρ M Δ m ( k ) + ρ M
(6)
The density value of the gray correlation distribution is calculated.
P h = ε i ( k ) h = 1 n ε i ( h )
(7)
The gray correlation entropy is calculated.
H ( P h ) = h = 1 n P h ln ( P h )
(8)
The gray entropy correlation is calculated, where Hmax = lnk, and k was 30.
E ( x i ) = H ( P h ) H max
The gray entropy correlations and gray correlations between DN and NCA, RBA, and freezing and thawing cycles (FTC) are shown in Figure 11. The gray correlations between DN and NCA, RBA, and FTC were 0.6972, 0.6372, and 0.8564, respectively. The analysis of the gray correlation theory applied by Gong et al. [8] and Ji et al. [14] in the experiment revealed that the accuracy of the model was greatly affected by the gray correlation due to its excessive sensitivity to localized data. Therefore, the weights of the gray correlations were processed using the entropy weighting method, thus reducing the excessive influence of local data on the overall results. The gray entropy correlations between DN and NCA, RBA, and FTC were 0.9914, 0.9876, and 0.9979, respectively. A similar result of this test was obtained by Lu et al. [65], where the gray entropy correlation was higher than 0.95 for the important influencing factors. The ranking of factors on DN of RBA concrete was FTC > NCA > RBA.

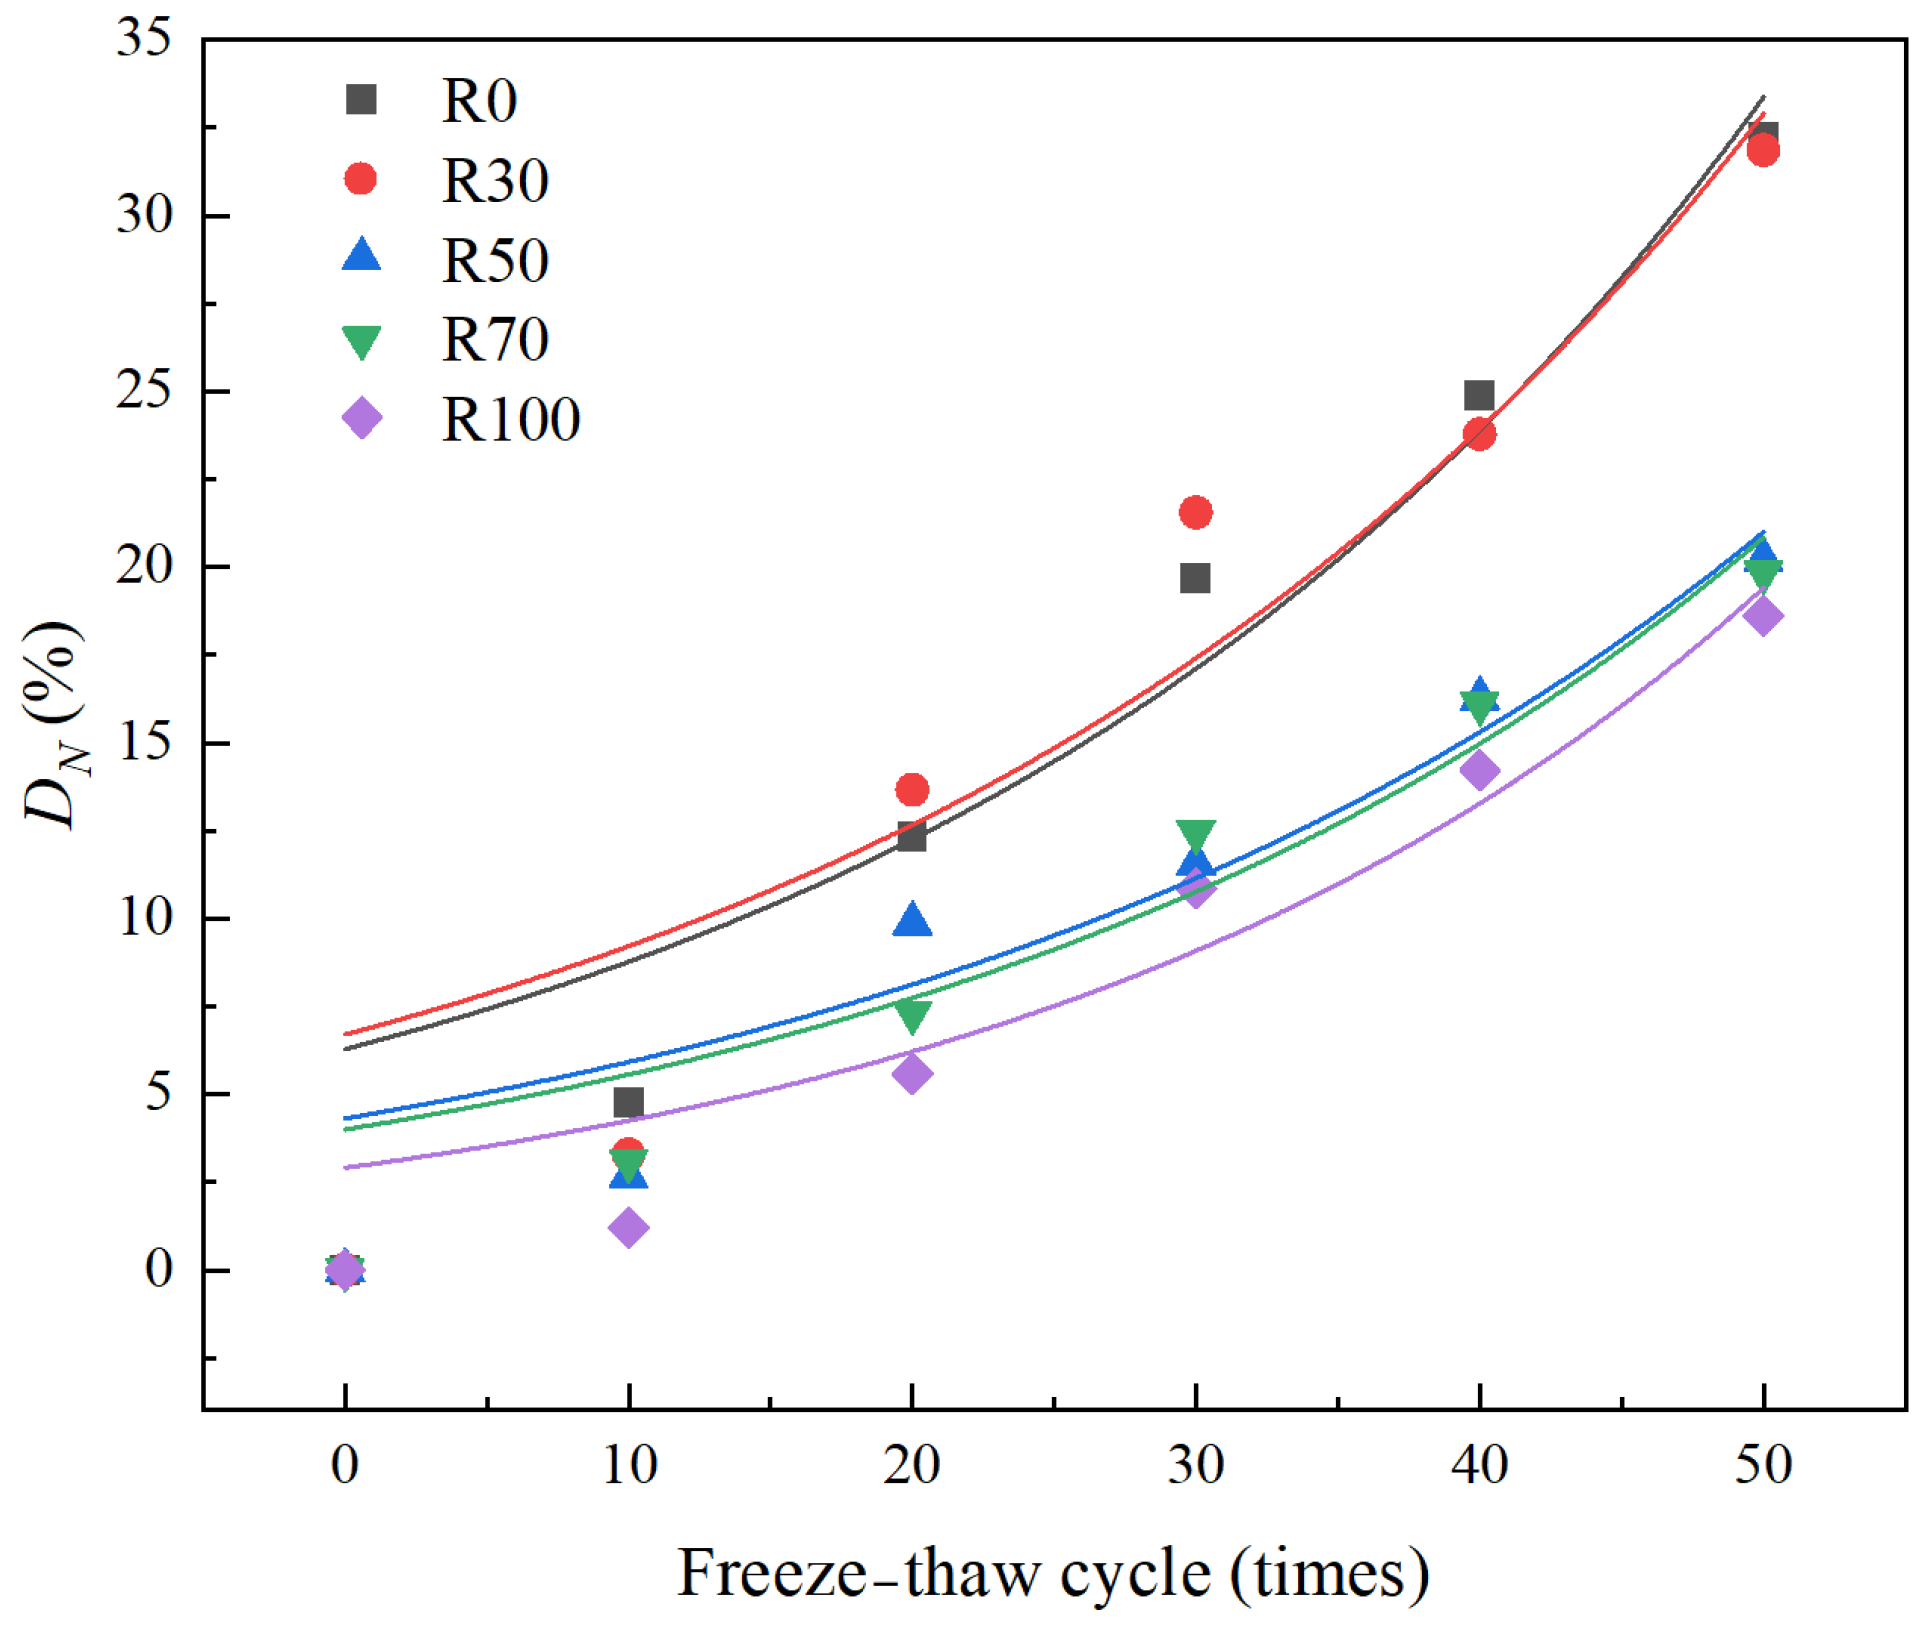
3.3.2. Freezing and Thawing Damage Model

The first-order linear gray theoretical model, referred to as GM(1, 1), is a mathematical tool for differential equation modeling using a small amount of data [66]. According to the original discrete nonnegative data columns, the GM(1, 1) model weakens the randomness of data using accumulation, thus obtaining regular discrete data [67]. There is a high accuracy of GM(1, 1) in modeling monotonicity data [68]. Therefore, an experiment is conducted to investigate the law of damage degree DN using the GM(1, 1) model.
(1)
The raw matrix X(0) is set as:
X ( 0 ) = X ( 0 ) ( 1 ) , X ( 0 ) ( 2 ) , X ( 0 ) ( 2 ) , X ( 0 ) ( k )
(2)
The raw matrix X(0) was accumulated once to obtain the accumulated sequence matrix X(1):
X ( 1 ) = X ( 1 ) ( 1 ) , X ( 1 ) ( 2 ) , X ( 1 ) ( 2 ) , X ( 1 ) ( k )
(3)
The first-order linear differential equation of GM(1, 1) is:
d x ( 1 ) d t + a x ( 1 ) = u
(4)
The known data were discrete, and Equation (12) can be transformed as:
X ( 0 ) ( t ) + a X ( 1 ) ( t ) = u
(5)
To eliminate the randomness of the data, the new matrix Z(1)(m) was defined:
Z ( 1 ) ( m ) = 0.5 [ X ( 1 ) ( m ) + X ( 1 ) ( m 1 ) ] , k = 1 , 2 , 3 n
(6)
Equation (7) was carried into Equation (6) as follows:
X ( 0 ) ( t ) = a Z ( 1 ) ( t ) + u
(7)
Equation (8) can be expressed in matrix form as:
Y = β X + ε
(8)
Using the least squares method, it is solved: Using the least squares method, it is solved:
β = ( X T X ) 1 ( X T Y )
(9)
Bring the parameters into Equation (5) and solve it:
X ( 1 ) ( m ) = X ( 0 ) ( 1 ) u a e a ( m 1 ) + u a , k = 1 , 2 , 3 n
(10)
By decreasing the cumulative series and solving it:
X ( 0 ) ( m ) = ( 1 e a ) X ( 0 ) ( 1 ) u a e a ( m 1 ) , k = 1 , 2 , 3 n
By substituting the actual values of freeze–thaw damage in Table 5 into the above GM(1, 1) model, the predictive models for the freezing and thawing damage at different RBA substitution rates of concrete were obtained as:
R 0 :   D N = 6.2811 e 0.0334 n       R 2 = 0.91417
R 30 :   D N = 6.7029 e 0.03182 n       R 2 = 0.87026
R 50 :   D N = 4.313 e 0.03166 n       R 2 = 0.88698
R 70 :   D N = 3.9969 e 0.03303 n       R 2 = 0.90745
R 100 :   D N = 2.9062 e 0.03798 n       R 2 = 0.91694
The predicted values calculated from the GM(1, 1) model are in better agreement with the actual values, as shown in Figure 12. The R2 of the GM(1, 1) model was higher than 0.87, meaning that GM(1, 1) can accurately predict the DN of RBA concrete [69,70]. The study of the GM(1, 1) model showed that DN generally decreased as the RBA substitution rate increased, but the maximum change in DN was mainly concentrated in the 30–50% stage. There was no significant enhancement in the frost resistance of concrete when the RBA substitution rate exceeded 50%. Therefore, the optimum replacement ratio for RBA concrete was 50%.

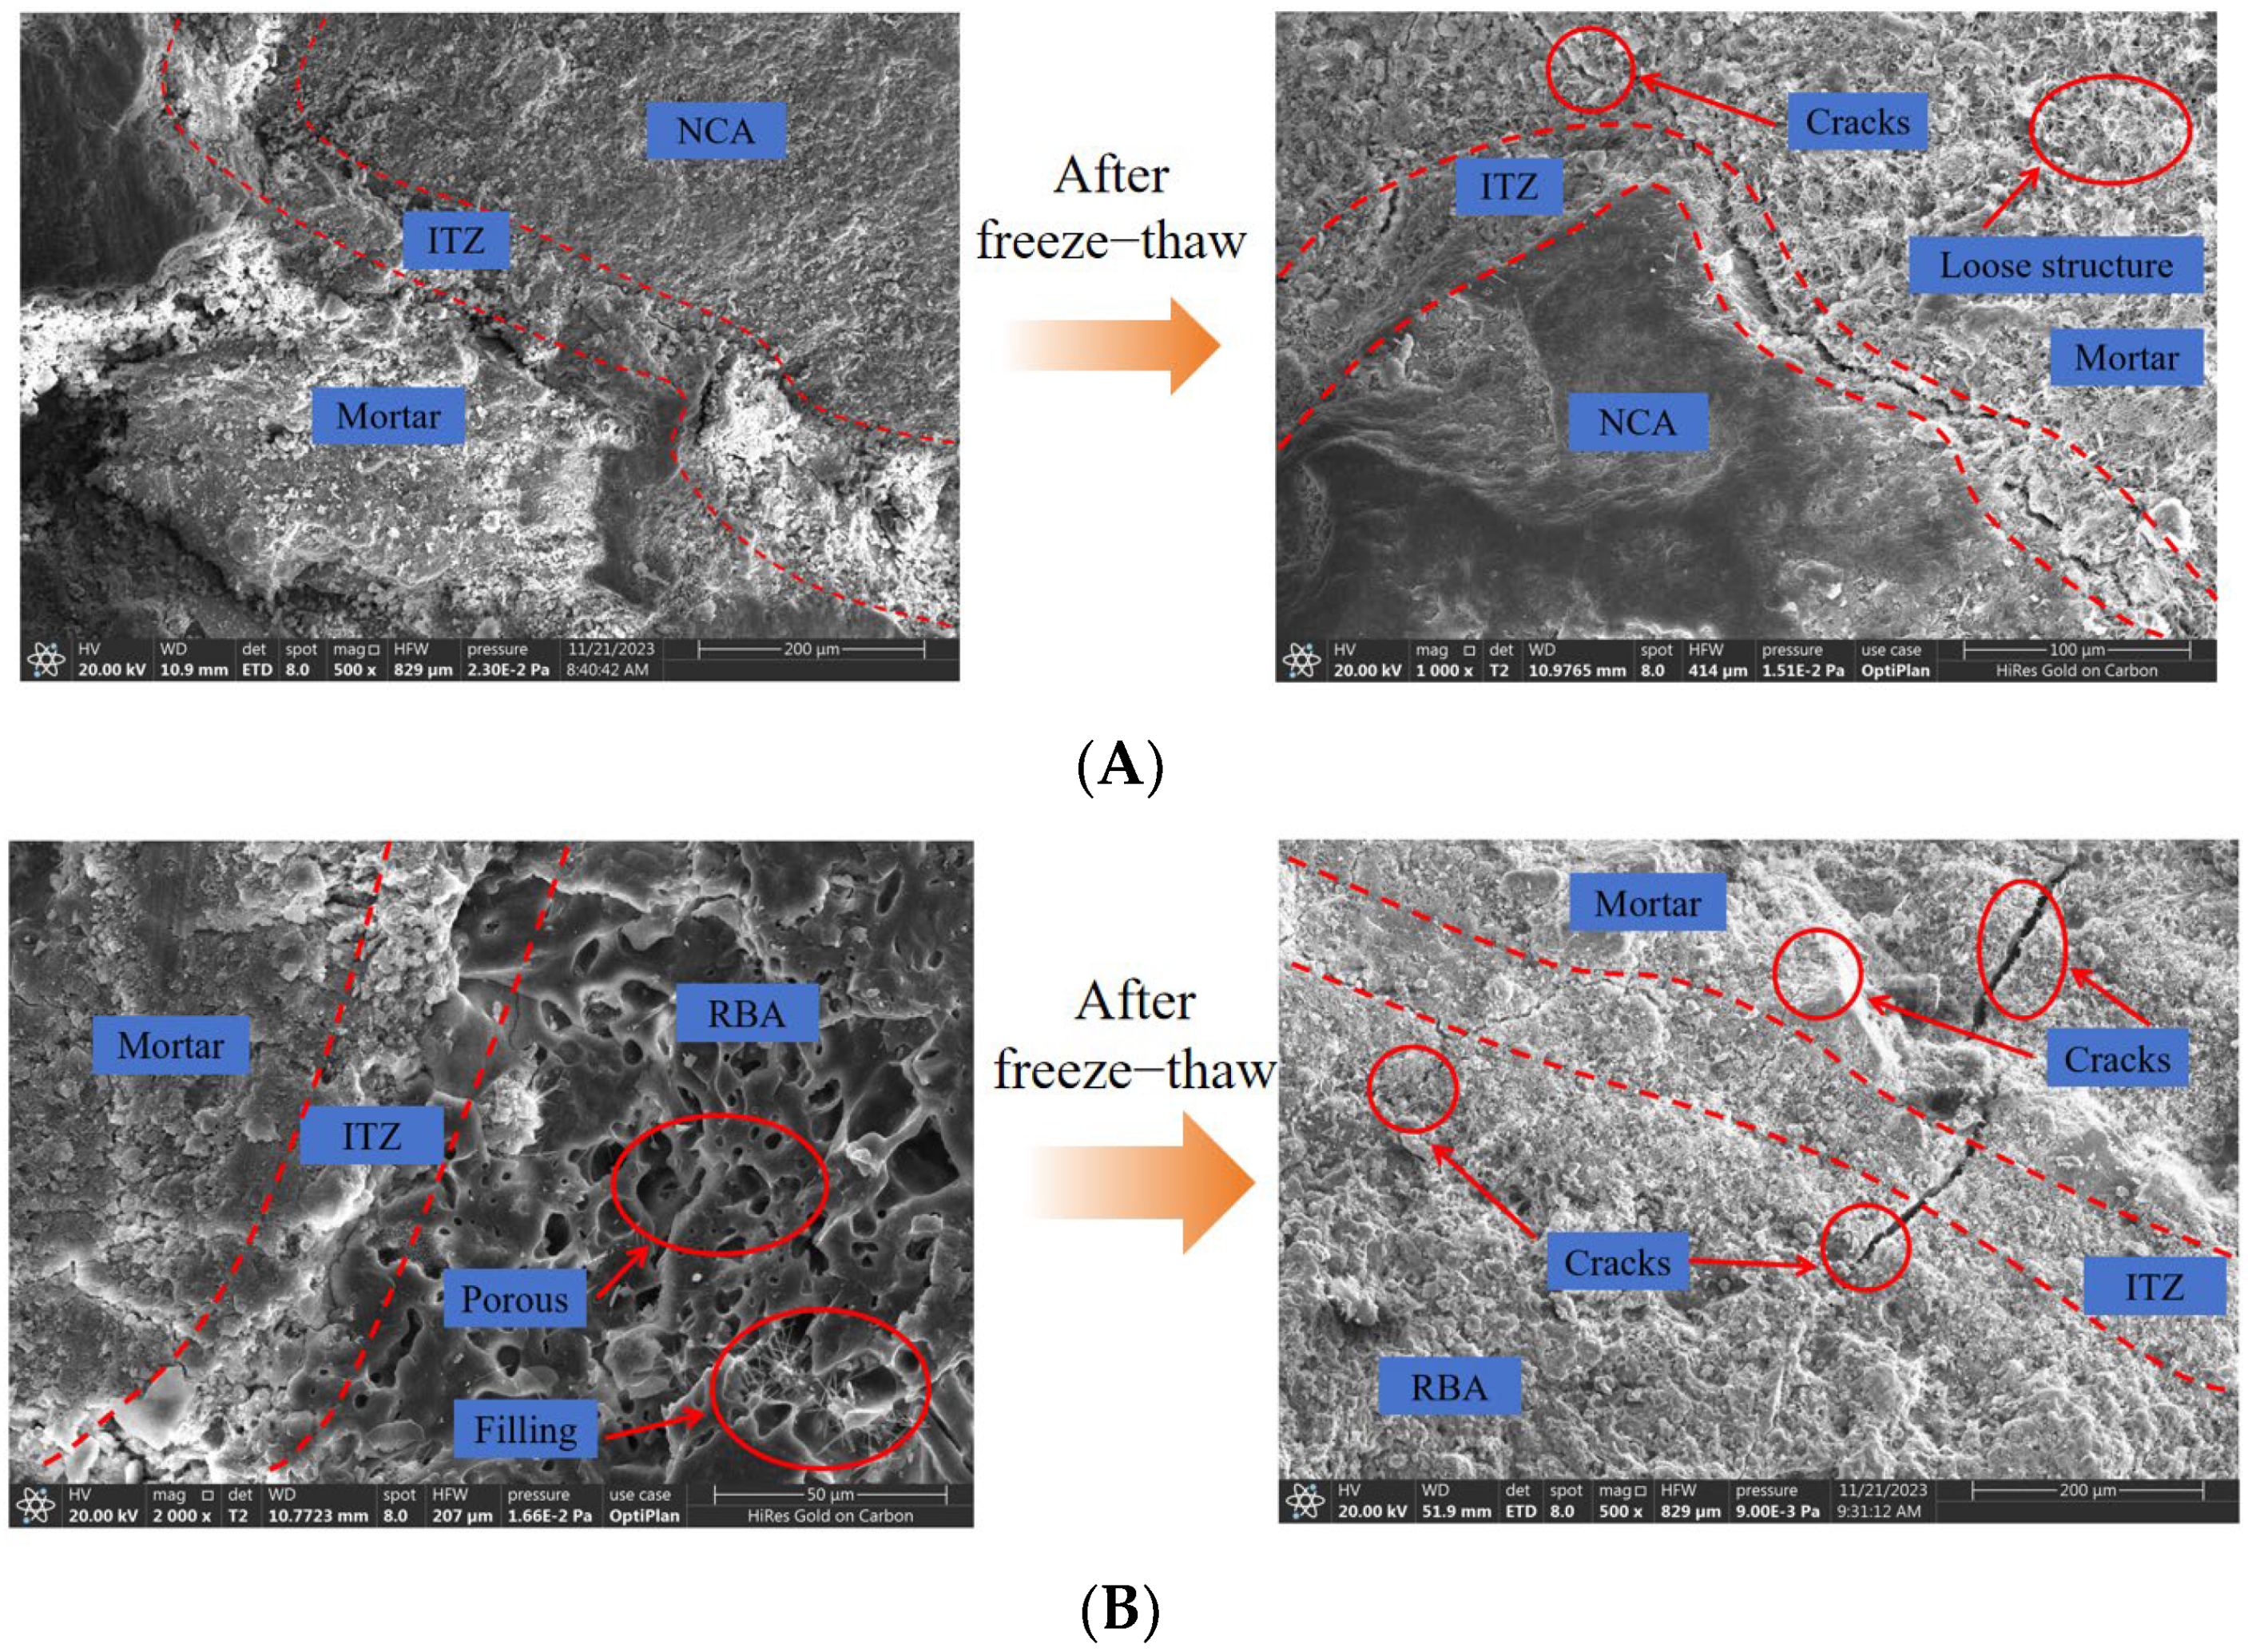
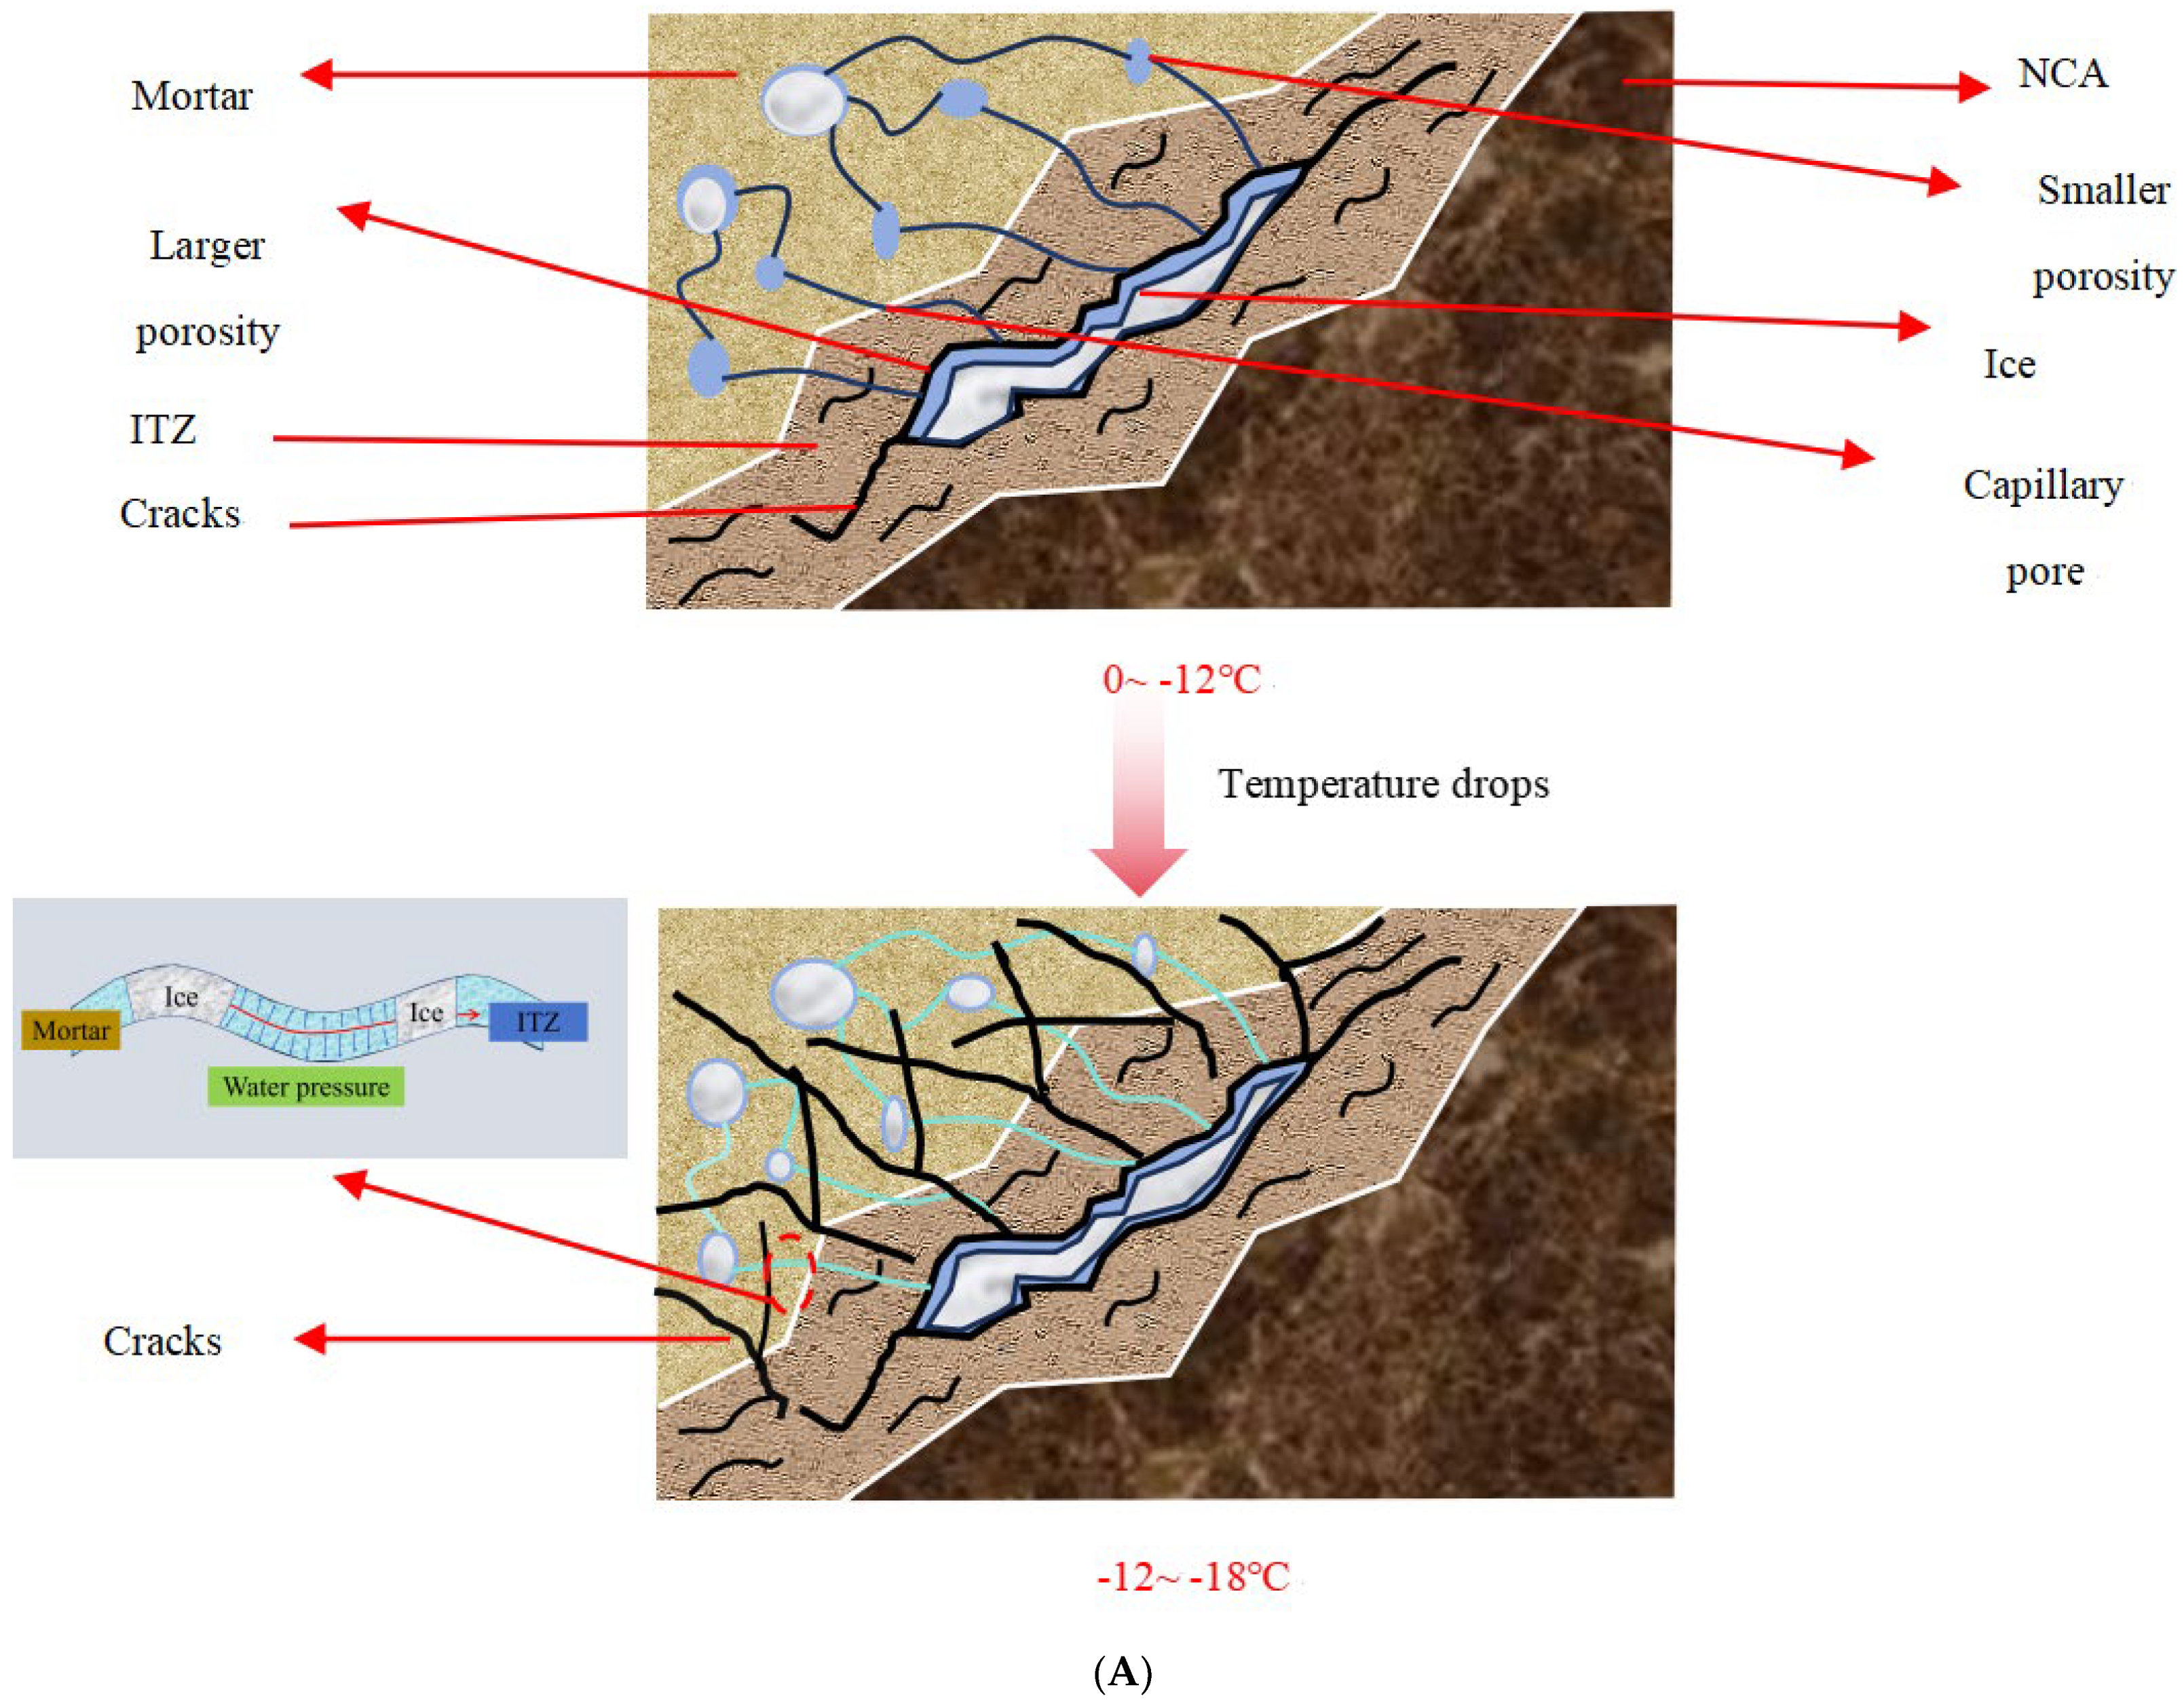
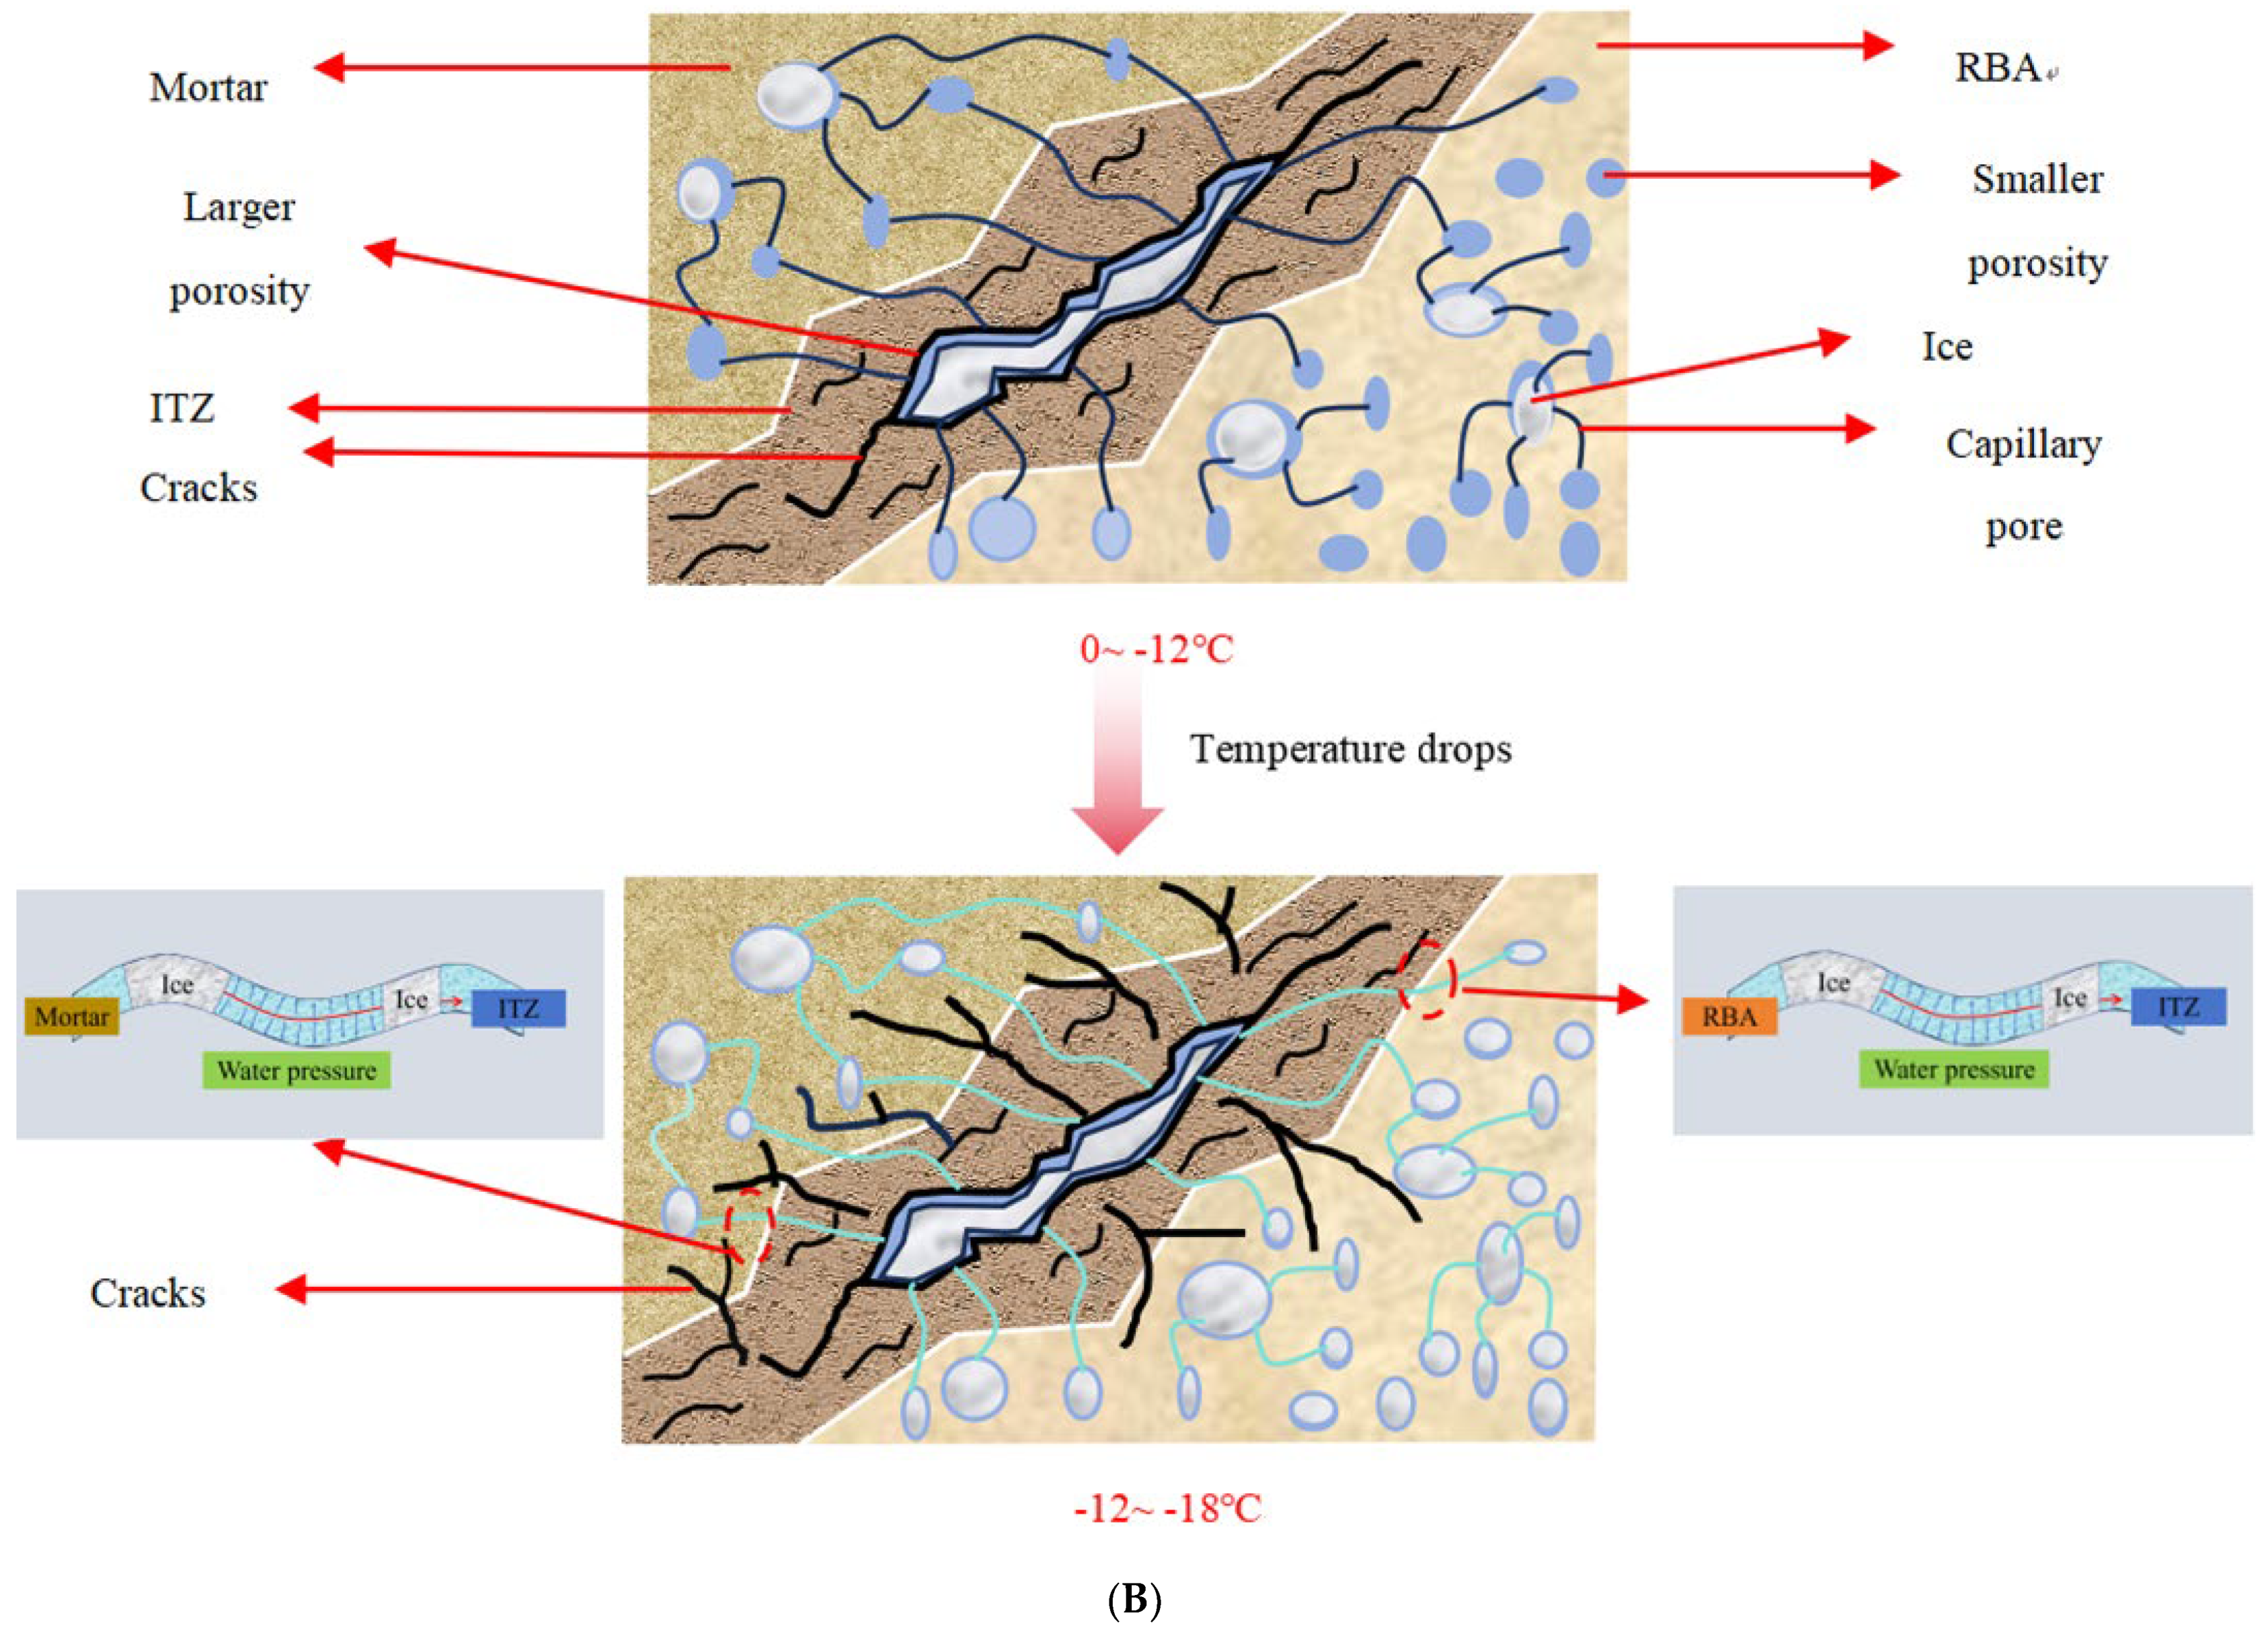
3.4. Freezing and Thawing Damage Mechanism

As freezing and thawing cycles develop, concrete specimens gradually exhibit crack development, mortar spalling, and aggregate exposure, accompanied by structural loosening and performance degradation [71,72]. The mechanism behind this phenomenon has been investigated by many scholars, and although the freezing–thawing damage mechanism remained somewhat controversial. It is generally agreed that freezing and thawing damage to concrete results from repeated phase changes in water within the pores [73]. To further explore the mechanism of damage to RBA concrete, the microstructures of ordinary concrete and RBA concrete were analyzed by SEM. Images of the ordinary concrete and RBA concrete before and after freezing and thawing cycling are shown in Figure 13. Lower strength in the ITZ, and it easily suffers from damage. Therefore, the concrete’s freezing–thawing durability can be evaluated through the change in ITZ before and after freezing and thawing cycling. Before the freezing and thawing, the ITZ had fewer cracks, and the structure was dense. As a result of 50 cycles, which generated a larger crack area of the ITZ in the ordinary concrete, and the cracks developed toward the mortar; the crack area of the ITZ in the RBA concrete was smaller, and the cracks developed toward the mortar and RBA in both directions. To further analyze the freezing and thawing damage mechanism of concrete, this research proposed the following theoretical model for the freezing and thawing damage mechanism of RBA concrete depending on micro-ice crystal theory, bond spalling theory, and pore mechanics theory.
The temperature of the water in the rubber drum was changed mainly by the antifreeze solution to achieve thermal transfer to the concrete specimen in the process of the test. When a concrete specimen begins to freeze, the temperature of the specimen gradually decreases from the inside out. When the temperature of water drops below 0 °C, it expands by about 9% in volume [74]. However, the freezing point changed when water was present in the porous medium. Xiao et al. [75] summarized the connections of pore size and freezing temperature by combining the Laplace formula with the Thomson formula. The specific formula is as follows:
P C P L = 2 γ c l r
P C P L = ( T f T ) Δ S m
T f T = 2 γ c l r Δ S m
where PC is the solid phase pressure; PL is the liquid phase pressure; r is the pore radius; γcl is the surface energy between the solid and the liquid; ∆Sm is the entropy of water turning into ice for a unit molar volume of water; T is the temperature; and Tf is the temperature at the freezing point. From the equation, it is well known that large pores are more prone to change phase than small ones in determining the apparent power. Pure water from the water solution in the larger pores was precipitated and frozen into ice, resulting in an increasing ion density of residual water solution and a decreasing freezing point. As the density of residual water solution ions in larger pores continued to increase, there was a position difference in the ion concentration between the surrounding pores. Under the influence of the position difference, large pores continuously absorb water from the surrounding small pores, increasing the water pressure on the pores. When the water pressure in the pore wall continued to increase and exceeded the tensile load limit inside the concrete, cracks developed in the pore walls [76,77].
The freezing and thawing damage of concrete is a dynamic process that changes with temperature [78]. The surface layer of the specimen was not completely frozen as the temperature dropped to 0~−5 °C. Under the influence of the ionic concentration difference, the larger pores in the surface layer may also absorb external water solutions during freezing to ice, resulting in larger pores in the surface layer being more prone to excessive saturation and damage. The different temperature coefficients between the aggregates and mortar made the ITZ more prone to cracking during freezing and thawing cycling. Currently, due to the larger pore size and higher freezing point in the ITZ, the ITZ is more likely to freeze, thus absorbing the external water solution, resulting in increasing damage to the pore walls. When the temperature was decreased to −5~−12 °C, water, hanging on the surface gaps of the concrete specimen, completely coagulated into ice, and the unfrozen water inside the specimen no longer exchanged with the water in the outer environment. Water in the pores of the concrete surface froze into ice and then expanded in volume, which in turn pressed unfrozen water into the less saturated internal pores via capillary pores. To overcome the resistance during transmission, the water solution can generate a certain amount of water pressure in the capillary pores. Due to the most frequent exchange of the fluids solution between the porosity located on the ITZ and the surrounding small pores, the ITZ had the largest distribution of capillary pores and suffered more damage. Along with the temperature decreasing to −12~−18 °C, the capillary pores began to freeze into ice, and the unfrozen water had difficulty migrating freely through the capillary porosity. When the water within the larger porosity was completely frozen, the residual unfrozen water accumulated within the capillary pores owing to their lower freezing point. As the water inside the capillary porosity continued to freeze, the remaining unfrozen water continued to press on the pore walls, and the water pressure increased with decreasing temperature. At this time, the capillary pores of the ITZ are subjected to the greatest water pressure and suffer the most serious damage.
The freezing and thawing damage mechanism of ordinary concrete is shown in Figure 14A. Along with the temperature decreasing to 0~−12 °C, the large porosity of the ITZ in the ordinary concrete started to freeze. Due to the dense structure of the NCA with fewer pores, there was almost no transfer of the water solution between the NCA and the ITZ. The pores in the ITZ absorbed more water from the mortar pores to achieve saturation, leading to more microcracks in the capillary pores of the mortar under greater water pressure. Along with the temperature decreasing to −12~−18 °C, the capillary porosity of the ordinary concrete began to freeze. Currently, unfrozen water is mainly concentrated in the capillary pores of mortar. With the continued freezing of the aqueous solution, the water pressure within the capillary pores can increase, resulting in increasing damage. The freezing and thawing damage mechanism of the RBA concrete has been shown in Figure 14B. When the temperature decreases to 0~−12 °C, the large holes in the ITZ of the RBA concrete begin to freeze. Due to the low strength of the RBA, cracks developed in both directions toward the RBA and the mortar during the freeze–thaw cycles. However, the RBA had more pores, which were also mostly filled by mortar, forming many closed pores, which enabled it to effectively relieve the water pressure in the pores of the ITZ, thus effectively reducing the extension of cracks. Along with the temperature decreasing to −12~−18 °C, these capillary pores of the RBA concrete began to freeze. Currently, the closed pores within the RBA also act as a “pressure relief” for unfrozen water that accumulates in the capillary pores, thus reducing the development of pore cracks. In summary, RBA in concrete shares the ITZ pore water pressure, enhancing the role of the “short plate”, thus effectively improving the frost resistance of concrete.

4. Conclusions

(1)
RBA had a deteriorating influence on the compressive and flexural properties of concrete, while it had an enhancing influence on the tensile property and plasticity to some extent, and the optimum substitution rate for the mechanical strength was 50%.
(2)
As the freeze–thaw cycle proceeds, gradually increasing the degree of apparent damage, as well as mass loss performed first to descend and then ascend, the RDEM gradually decreased, and the higher the RBA substitution rate was, the better the frost resistance of concrete.
(3)
The gray entropy correlations between FTC, NCA, RBA, and DN were 0.9979, 0.9914, and 0.9876, respectively. The R2 of the GM (1, 1) freezing and thawing damage model was higher than 0.87, which can accurately predict the freeze–thaw damage of RBA concrete.
(4)
The crack development area of the RBA concrete ITZ after freeze–thaw cycling was smaller compared with ordinary concrete. Based on this phenomenon, the freeze–thaw mechanism of action of RBA concrete was investigated.

Author Contributions

G.T.: investigation, conceptualization, project administration, writing—original draft. S.G.: data curation, formal analysis, methodology, writing—original draft. T.W., M.L. and J.L.: investigation, software. X.R., W.Z., C.W., LX. and F.C.: data curation, investigation, visualization. T.S.: conceptualization, funding acquisition, supervision, writing—review and editing. All authors have read and agreed to the published version of the manuscript.

Funding

The work described in this paper was supported by the China Postdoctoral Science Foundation (2022M723687), the Doctoral Science and Technology Startup Foundation of Shandong University of Technology (420048), the China Natural Science Foundation (52368024), and the Natural Science Foundation of Inner Mongolia Autonomous Region (2022LHMS05011).

Institutional Review Board Statement

Not applicable.

Informed Consent Statement

Not applicable.

Data Availability Statement

The data presented in this study are available on request from the corresponding author.

Conflicts of Interest

Tian Su was employed by the company China Railway 11 Bureau Group. The remaining authors declare that the research was conducted in the absence of any commercial or financial relationships that could be construed as a potential conflict of interest.

References

  1. Xia, P.; Khan, S.; Tahir, M.; Hassam, M.; Gong, F.; Zhao, Y. Characterizations and quantification of freeze-thaw behaviors of recycled brick aggregate concrete. J. Build. Eng. 2024, 86, 108821. [Google Scholar]
  2. Aslam, M.S.; Huang, B.; Cui, L. Review of construction and demolition waste management in China and USA. J. Environ. Manag. 2020, 264, 110445. [Google Scholar] [CrossRef] [PubMed]
  3. Linghu, K.J. Research on Meso-Scale Diffusion Behavior Numerical Simulation of Recycled Concrete by Chloride; Xi’an University of Technology: Xi’an, China, 2023. (In Chinese) [Google Scholar]
  4. Yang, X.T. Study on Activation and Properties of Waste Clay Brick Powder; Shenyang Jianzhu University: Shenyang, China, 2021. (In Chinese) [Google Scholar]
  5. Su, T.; Wu, J.; Yang, G.; Zou, Z. Bond behavior between recycled coarse aggregate concrete and steel bar after salt-frost cycles. Constr. Build. Mater. 2019, 226, 673–685. [Google Scholar] [CrossRef]
  6. Gong, S.; Wang, T.; Hasan, M.M.; Mei, X.; Tan, Z.; Su, T.; Cao, F. Effect of polypropylene fiber and nano-silica on the compressive strength and frost resistance of recycled brick aggregate concrete. Nanotechnol. Rev. 2023, 12, 20230174. [Google Scholar] [CrossRef]
  7. Wang, T.; Wang, Q.S.; Cui, S.A.; Yi, H.; Su, T.; Tan, Z. Effects of nanomaterials reinforced aggregate on mechanical properties and microstructure of recycled brick aggregate concrete. Mater. Sci. 2023, 29, 347–355. [Google Scholar] [CrossRef]
  8. Gong, S.; Bai, L.; Tan, Z.; Xu, L.; Bai, X.; Huang, Z. Mechanical properties of polypropylene fiber recycled brick aggregate concrete and its influencing factors by gray correlation analysis. Sustainability 2023, 15, 11135. [Google Scholar] [CrossRef]
  9. Cachim, P.B. Mechanical properties of brick aggregate concrete. Constr. Build. Mater. 2009, 23, 1292–1297. [Google Scholar] [CrossRef]
  10. Xu, L.; Su, W.; Su, T. Influence of recycled clay brick aggregate on the mechanical properties of concrete. Rev. Adv. Mater. Sci. 2022, 61, 372–380. [Google Scholar] [CrossRef]
  11. Wang, T.; Cui, S.; Ren, X.; Zhang, W.; Yang, X.; Gong, S.; Yang, D.; Li, B.; Zhang, W.; Su, T.; et al. Study on the mechanical properties and microstructure of recycled brick aggregate concrete with waste fiber. Rev. Adv. Mater. Sci. 2024, 63, 20230175. [Google Scholar] [CrossRef]
  12. Nepomuceno, M.C.; Isidoro, R.A.; Catarino, J.P. Mechanical performance evaluation of concrete made with recycled ceramic coarse aggregates from industrial brick waste. Constr. Build. Mater. 2018, 165, 284–294. [Google Scholar] [CrossRef]
  13. Ge, Z.; Feng, Y.; Yuan, H.; Zhang, H.; Sun, R.; Wang, Z. Durability and shrinkage performance of self-compacting concrete containing recycled fine clay brick aggregate. Constr. Build. Mater. 2021, 308, 125041. [Google Scholar] [CrossRef]
  14. Ji, Y.; Zhang, H. Frost resistance investigation of fiber reinforced recycled brick aggregate cementitious materials. Sci. Rep. 2022, 12, 15311. [Google Scholar] [CrossRef] [PubMed]
  15. Ji, Y.; Wang, D. Durability of recycled aggregate concrete in cold regions. Case Stud. Constr. Mater. 2022, 17, e01475. [Google Scholar] [CrossRef]
  16. Qiu, J.; Li, L.; Li, L.; Luan, X.; Guan, X.; Niu, G. Study on the deterioration characteristics and mechanisms of recycled brick-concrete aggregate concrete under load-freeze-thaw coupling. Constr. Build. Mater. 2024, 413, 134817. [Google Scholar] [CrossRef]
  17. Zheng, C.; Lou, C.; Du, G.; Li, X.; Liu, Z.; Li, L. Mechanical properties of recycled concrete with demolished waste concrete aggregate and clay brick aggregate. Results Phys. 2018, 9, 1317–1322. [Google Scholar] [CrossRef]
  18. Yang, J.; Du, Q.; Bao, Y. Concrete with recycled concrete aggregate and crushed clay bricks. Constr. Build. Mater. 2011, 25, 1935–1945. [Google Scholar] [CrossRef]
  19. Su, T.; Wang, T.; Zhang, Z.; Sun, X.; Gong, S.; Mei, X.; Tan, Z.; Cui, S. Mechanical properties and frost resistance of recycled brick aggregate concrete modified by nano-SiO2. Nanotechnol. Rev. 2023, 12, 20230576. [Google Scholar] [CrossRef]
  20. Cui, S.; Wang, T.; Zhang, Z.; Sun, X.; Li, J.; Li, B.; Zhang, W.; Su, T.; Cao, F. Frost resistance and life prediction of recycled brick aggregate concrete with waste polypropylene fiber. Rev. Adv. Mater. Sci. 2023, 62, 20230154. [Google Scholar] [CrossRef]
  21. Sun, D.; Shen, S.; Huang, W.; Liu, K.; Wang, A.; Chen, J. A review of quality of recycled aggregate and its effect on durability of recycled aggregate concrete. Mater. Express 2022, 12, 1415–1426. [Google Scholar] [CrossRef]
  22. Powers, T.C. A working hypothesis for further studies of frost resistance of concrete. J. Proc. 1945, 41, 245–272. [Google Scholar]
  23. Powers, T.C.; Helmuth, R.A. Theory of volume changes in hardened portland-cement paste during freezing. Highw. Res. Board Proc. 1953, 32, 285–297. [Google Scholar]
  24. Scherer, G.W. Crystallization in pores. Cem. Concr. Res. 1999, 29, 1347–1358. [Google Scholar] [CrossRef]
  25. Liu, L.; Ye, G.; Schlangen, E.; Chen, H.; Qian, Z.; Sun, W.; van Breugel, K. Modeling of the internal damage of saturated cement paste due to ice crystallization pressure during freezing. Cem. Concr. Compos. 2011, 33, 562–571. [Google Scholar] [CrossRef]
  26. Izadifar, M.; Dolado, J.S.; Thissen, P.; Ukrainczyk, N.; Koenders, E.; Ayuela, A. Theoretical elastic constants of tobermorite enhanced with reduced graphene oxide through hydroxyl vs. epoxy functionalization: A first-principles study. J. Phys. Chem. C 2023, 127, 18117–18126. [Google Scholar] [CrossRef]
  27. Izadifar, M.; Dolado, J.S.; Thissen, P.; Ayuela, A. Interactions between reduced graphene oxide with monomers of (calcium) silicate hydrates: A first-principles study. Nanomaterials 2021, 11, 2248. [Google Scholar] [CrossRef] [PubMed]
  28. GB/T 39698-2020; Confirmation Methods for Delivering Common Portland Cement. State Market Regulatory Administration: Beijing, China, 2020. (In Chinese)
  29. JGJ 52-2006; Standard for Technical Requirements and Test Method of Sand and Crushed Stone for Ordinary Concrete. China Academy of Building Research: Beijing, China, 2006. (In Chinese)
  30. GB/T 50081-2019; Standard for Test Method of Mechanical and Physical Performance Concrete. China Architecture and Building Press: Beijing, China, 2019. (In Chinese)
  31. Liu, L.J. Effect of Broken Brick and Polypropylene Fiber on Mechanics, Impermeability and Frost Resistance of Concrete; North China University of Water Resources and Electric Power: Zhengzhou, China, 2019. (In Chinese) [Google Scholar]
  32. GB/T 50082-2009; Standard for Test Methods of Long-Term Performance and Durability of Ordinary Concrete. Ministry of Housing and Urban-Rural Development of the People’s Republic of China: Beijing, China, 2009. (In Chinese)
  33. Zhu, M.Q. Experimental Study on Mix Proportion and Basic Mechanical Properties of Recycled Brick Aggregate Concrete; Xi’an University of Architecture and Technology: Xi’an, China, 2020. (In Chinese) [Google Scholar]
  34. Liang, L. Experimental Study on the Effect of Brick and Old Mortar Content on the Mechanical Properties of Recycled Concrete; Guilin University of Technology: Guilin, China, 2022. (In Chinese) [Google Scholar]
  35. Xiao, B. Experimental Study on the Basic Mechanical Properties of Recycled Aggregate Concrete; Wuhan University: Wuhan, China, 2019. (In Chinese) [Google Scholar]
  36. Liu, X.; Wu, J.; Zhao, X.; Yan, P.; Ji, W. Effect of brick waste content on mechanical properties of mixed recycled concrete. Constr. Build. Mater. 2021, 292, 123320. [Google Scholar] [CrossRef]
  37. Ge, P.; Huang, W.; Zhang, J.; Quan, W.; Guo, Y. Mix proportion design method of recycled brick aggregate concrete based on aggregate skeleton theory. Constr. Build. Mater. 2021, 304, 124584. [Google Scholar] [CrossRef]
  38. Xiao, J.Z.; Li, W.G.; Poon, C.S. Recent studies on mechanical properties of recycled aggregate concrete in China—A review. Sci. China Technol. Sci. 2012, 55, 1463–1480. [Google Scholar] [CrossRef]
  39. Poon, C.S.; Chan, D. Paving blocks made with recycled concrete aggregate and crushed clay brick. Constr. Build. Mater. 2006, 20, 569–577. [Google Scholar] [CrossRef]
  40. Shang, H.; Yang, S.; Niu, X. Mechanical behavior of different types of concrete under multiaxial tension–compression. Constr. Build. Mater. 2014, 73, 764–770. [Google Scholar] [CrossRef]
  41. Paredes, J.A.; Barbat, A.H.; Oller, S. A compression-tension concrete damage model, applied to a wind turbine reinforced concrete tower. Eng. Struct. 2011, 33, 3559–3569. [Google Scholar] [CrossRef]
  42. Jin, L.; Li, J.; Yu, W.; Du, X. Modelling dynamic failure of geometrical-similar concrete subjected to tension-compression loads: Effect of strain rate and lateral stress ratio. Eng. Fract. Mech. 2022, 271, 108661. [Google Scholar] [CrossRef]
  43. Fehling, E.; Leutbecher, T.; Roeder, F.K. Compression-tension strength of reinforced and fiber-reinforced concrete. ACI Struct. J. 2011, 108, 350–359. [Google Scholar]
  44. Wu, S.Y. Effect of PVA Modified Recycled Aggregate on Properties of Recycled Concrete; Anhui University of Science and Technology: Huainan, China, 2019. (In Chinese) [Google Scholar]
  45. Liu, W.H. Experimental Research on Durability of Recycled Concrete Porous Brick and Frost Resistance Index of Brick; Changsha University of Science and Technology: Changsha, China, 2012. (In Chinese) [Google Scholar]
  46. Li, P.F. The Experimental Research on Regeneration Aggregate and Proportioning of Recycled Concrete Brick; Changsha University of Science and Technology: Changsha, China, 2011. (In Chinese) [Google Scholar]
  47. Wu, J.; Jing, X.; Wang, Z. Uni-axial compressive stress-strain relation of recycled coarse aggregate concrete after freezing and thawing cycles. Constr. Build. Mater. 2017, 134, 210–219. [Google Scholar] [CrossRef]
  48. Yan, P.; Wu, J.; Lin, D.; Liu, X. Uniaxial compressive stress–strain relationship of mixed recycled aggregate concrete. Constr. Build. Mater. 2022, 350, 128663. [Google Scholar] [CrossRef]
  49. Xiao, Q.H.; Li, Q.; Cao, Z.Y.; Tian, W.Y. The deterioration law of recycled concrete under the combined effects of freeze-thaw and sulfate attack. Constr. Build. Mater. 2019, 200, 344–355. [Google Scholar] [CrossRef]
  50. Niu, H.C.; Fan, Y.H.; Zhang, X.G.; Yin, X. Experimental study on the freeze-thaw resistance of recycled concrete with different replacement ratios. J. Mater. Sci. Eng. 2018, 36, 615–620. (In Chinese) [Google Scholar]
  51. Wei, S.H. Research on Influence of Mineral Admixture on Chloride Corrosion Resistance and Frost Resistance of Recycled Concrete; China University of Mining and Technology: Beijing, China, 2020. (In Chinese) [Google Scholar]
  52. Wang, H.; Zhu, P.; Yan, X.; Liu, H.; Zhu, L.; Wang, X. Effect of silica fume on frost resistance and recyclability potential of recycled aggregate concrete under freeze-thaw environment. Constr. Build. Mater. 2023, 409, 134109. [Google Scholar] [CrossRef]
  53. Yang, C.; Zhang, J.; Wang, J.; Guo, M. Post-evaluation of frost resistance of cement concrete entities based on pore spacing factors of hardened concrete. Constr. Build. Mater. 2024, 411, 134342. [Google Scholar] [CrossRef]
  54. Lu, J.; Liu, J.; Yang, H.; Wan, X.; Gao, J.; Zhang, J.; Li, P. Experimental investigation on the mechanical properties and pore structure deterioration of fiber-reinforced concrete in different freeze-thaw media. Constr. Build. Mater. 2022, 350, 128887. [Google Scholar] [CrossRef]
  55. Lin, H.; Takasu, K.; Suyama, H.; Koyamada, H.; Liu, S. A study on properties, static and dynamic elastic modulus of recycled concrete under the influence of modified fly ash. Constr. Build. Mater. 2022, 347, 128585. [Google Scholar] [CrossRef]
  56. Lydon, F.D.; Iacovou, M. Some factors affecting the dynamic modulus of elasticity of high strength concrete. Cem. Concr. Res. 1995, 25, 1246–1256. [Google Scholar] [CrossRef]
  57. Wang, B.; Yan, L.; Fu, Q.; Kasal, B. A comprehensive review on recycled aggregate and recycled aggregate concrete. Resour. Conserv. Recycl. 2021, 171, 105565. [Google Scholar] [CrossRef]
  58. Tam, V.W.Y.; Soomro, M.; Evangelista, A.C.J. A review of recycled aggregate in concrete applications (2000–2017). Constr. Build. Mater. 2018, 172, 272–292. [Google Scholar] [CrossRef]
  59. Wong, C.L.; Mo, K.H.; Yap, S.P.; Alengaram, U.J.; Ling, T.C. Potential use of brick waste as alternate concrete-making materials: A review. J. Clean. Prod. 2018, 195, 226–239. [Google Scholar] [CrossRef]
  60. Chen, F.; Qiao, P. Probabilistic damage modeling and service-life prediction of concrete under freeze–thaw action. Mater. Struct. 2015, 48, 2697–2711. [Google Scholar] [CrossRef]
  61. Dong, W.; Shen, X.-D.; Xue, H.-J.; He, J.; Liu, Y. Research on the freeze-thaw cyclic test and damage model of Aeolian sand lightweight aggregate concrete. Constr. Build. Mater. 2016, 123, 792–799. [Google Scholar] [CrossRef]
  62. Yang, D.P. Studies on Durability and Service Life Prediction of Hydraulic Concrete in Northern China; Northeastern University: Liaoning, China, 2019. (In Chinese) [Google Scholar]
  63. Han, X.Y. Experimental Study on the Predictive Model of Hydraulic Rubberized Concrete Mechanical Properties and Freeze-thaw Damage; North China University of Water Resources and Electric Power: Zhengzhou, China, 2022. (In Chinese) [Google Scholar]
  64. Lan, S.L.; Tian, W.; Zhang, H.R.; Han, Z.; Li, H. Durability evaluation and life prediction of steel slag coarse aggregate concrete based on entropy weight method and grey theory. Bull. Chin. Ceram. Soc. 2023, 42, 3710–3721. (In Chinese) [Google Scholar]
  65. Lu, Z.; Feng, Z.-G.; Yao, D.; Li, X.; Ji, H. Freeze-thaw resistance of Ultra-High performance concrete: Dependence on concrete composition. Constr. Build. Mater. 2021, 293, 123523. [Google Scholar] [CrossRef]
  66. Sun, B.Q.; Liu, G.Z.; Liu, Y.L. Research on grey forecasting model for concrete carbonation. J. Build. Mater. 2012, 15, 42–47+115. (In Chinese) [Google Scholar]
  67. Gao, C.; Kong, X.Z.; Shen, X.D. Freeze-thaw Resistance Evaluation of Lightweight Aggregate Concrete with Stress Damage Based on GM(1,1). Adv. Eng. Sci. 2021, 53, 184–190. (In Chinese) [Google Scholar]
  68. Qin, Y.; Lyu, G.; Guan, K.; Zhou, H. Durability assessment and life prediction of concrete by entropy weight method. J. Chin. Ceram. Soc. 2023, 51, 1344–1354. (In Chinese) [Google Scholar]
  69. Cheng, X.; Tian, W.; Gao, J.; Gao, Y. Performance evaluation and lifetime prediction of steel slag coarse aggregate concrete under sulfate attack. Constr. Build. Mater. 2022, 344, 128203. [Google Scholar] [CrossRef]
  70. Gong, L.; Liang, Y.; Yu, X.; Du, Q. Damage prediction of hydraulic concrete in severe cold region based on FOTP-GM (1, 1) model. KSCE J. Civ. Eng. 2023, 27, 2993–3005. [Google Scholar] [CrossRef]
  71. Zhang, S.P.; Deng, M. Thermodynamic considerations on deterioration mechanism of concrete caused by freezing. Bull. Chin. Ceram. Soc. 2008, 4, 740–743. (In Chinese) [Google Scholar]
  72. Ren, J.; Lai, Y. Study on the durability and failure mechanism of concrete modified with nanoparticles and polypropylene fiber under freeze-thaw cycles and sulfate attack. Cold Reg. Sci. Technol. 2021, 188, 103301. [Google Scholar] [CrossRef]
  73. Algin, Z.; Gerginci, S. Freeze-thaw resistance and water permeability properties of roller compacted concrete produced with macro synthetic fibre. Constr. Build. Mater. 2020, 234, 117382. [Google Scholar] [CrossRef]
  74. Li, Y. The Durability and Deterioration Mechanism of Recycle Daggregate Concrete Subjected to Compound Erosion; Xi’an University of Technology: Xi’an, China, 2018. (In Chinese) [Google Scholar]
  75. Xiao, Z.; Lai, Y.; Zhang, M. Study on the freezing temperature of saline soil. Acta Geotech. 2018, 13, 195–205. [Google Scholar] [CrossRef]
  76. Cao, Z.Y. Study on Damage of Recycled Concrete under Freeze-Thaw and Sulfate; Xi’an University of Science and Technology: Xi’an, China, 2020. (In Chinese) [Google Scholar]
  77. Wei, Y.M.; Chai, J.R.; Qin, Y. Effect of pore distribution of recycled concrete on frost resistance under freeze-thaw cycling. Bull. Chin. Ceram. Soc. 2018, 37, 825–830. (In Chinese) [Google Scholar]
  78. Gao, X.F.; Lo, Y.T.; Tam, C.M. Investigation of micro-cracks and microstructure of high performance lightweight aggregate concrete. Build. Environ. 2002, 37, 485–489. [Google Scholar] [CrossRef]
Figure 1. Grading curve of sand.
Sustainability 16 05643 g001
Figure 2. Grading curve of NCA and RBA.
Sustainability 16 05643 g002
Figure 3. Mechanical performance test set. (A) Compressive; (B) tensile; and (C) flexural.
Sustainability 16 05643 g003
Figure 4. Frost resistance test set. (A) Rapid freezing and thawing testing machine; and (B) RDEM instrument.
Sustainability 16 05643 g004
Figure 5. FEI quanta 250 SEM.
Sustainability 16 05643 g005
Figure 6. Mechanical performance of RBA concrete. (A) Compressive; (B) flexural; and (C) tensile.
Sustainability 16 05643 g006
Figure 7. Tensile–compressive ratio of the RBA concrete.
Sustainability 16 05643 g007
Figure 8. Appearances of the RBA concrete after freezing and thawing cycles: (A) 0 times; (B) 30 times; and (C) 50 times.
Sustainability 16 05643 g008
Figure 9. Mass loss of RBA concrete.
Sustainability 16 05643 g009
Figure 10. RDEM of RBA concrete.
Sustainability 16 05643 g010
Figure 11. Gray entropy/gray correlation between influencing factors and DN.
Sustainability 16 05643 g011
Figure 12. Model for predicting DN after freeze–thaw cycles.
Sustainability 16 05643 g012
Figure 13. SEM images. (A) Ordinary concrete; and (B) RBA concrete.
Sustainability 16 05643 g013
Figure 14. Schematic diagram of freezing and thawing damage mechanism. (A) Ordinary concrete; and (B) RBA concrete.
Sustainability 16 05643 g014aSustainability 16 05643 g014b
Table 1. Chemical composition of the cement.
CompositionsCement
CaO60.24
SiO222.21
Al2O36.41
Fe2O33.04
SO32.95
MgO1.43
Table 2. Physical and mechanical properties of the cement.
Physical and Mechanical Performance Cement
Specific surface area (m2/kg) 325
Setting time (min)Initial187
Final253
Ignition loss (%) 1.7
Soundness Qualified
Compressive strength (MPa)3d6.3
28d8.2
Flexural strength (MPa)3d22.3
28d48.1
Table 3. Properties of the NCA and RBA.
PropertiesNCARBA
Water absorption (%)0.911.9
Apparent density (kg/m3)26352100
Crushing index (%)7.529.5
Mud content (%)0.61.1
Maximum particle size (mm)31.631.5
Table 4. Concrete mix proportions.
SpecimenNCA (%)RBA (%)Sand (kg/m3)Cement (kg/m3)Water (kg/m3)
R01000580.66455.56205
R307030580.66455.56205
R505050580.66455.56205
R703070580.66455.56205
R1000100580.66455.56205
Table 5. Raw data of the DN after freeze–thaw cycles (%).
FTC (Times)R0R30R50R70R100
104.763.292.673.11.21
2012.3413.669.867.325.57
3019.6721.5611.5712.4610.86
4024.8823.7916.2716.1114.23
5032.2231.8620.2219.8618.61
Disclaimer/Publisher’s Note: The statements, opinions and data contained in all publications are solely those of the individual author(s) and contributor(s) and not of MDPI and/or the editor(s). MDPI and/or the editor(s) disclaim responsibility for any injury to people or property resulting from any ideas, methods, instructions or products referred to in the content.

