Abstract
The integral role of wild fungi in ecosystems, including provisioning, regulating, cultural, and supporting services, is well recognized. However, quantifying and predicting wild mushroom yields is challenging due to spatial and temporal variability. In Mediterranean forests, climate-change-induced droughts further impact mushroom production. Fungal fruiting is influenced by factors such as climate, soil, topography, and forest structure. This study aims to quantify and predict the mycological potential of Lactarius deliciosus in sustainably managed Mediterranean pine forests using machine learning models. We utilize a long-term dataset of Lactarius deliciosus yields from 17 Pinus pinaster plots in Soria, Spain, integrating forest-derived structural data, NASA Landsat mission vegetation indices, and climatic data. The resulting multisource database facilitates the creation of a two-stage ‘mycological exploitability’ index, crucial for incorporating anticipated mycological production into sustainable forest management, in line with what is usually done for other uses such as timber or game. Various Machine Learning (ML) techniques, such as classification trees, random forest, linear and radial support vector machine, and neural networks, were employed to construct models for classification and prediction. The sample was always divided into training and validation sets (70-30%), while the differences were found in terms of Overall Accuracy (OA). Neural networks, incorporating critical variables like climatic data (precipitation in January and humidity in November), remote sensing indices (Enhanced Vegetation Index, Green Normalization Difference Vegetation Index), and structural forest variables (mean height, site index and basal area), produced the most accurate and unbiased models (OAtraining = 0.8398; OAvalidation = 0.7190). This research emphasizes the importance of considering a diverse array of ecosystem variables for quantifying wild mushroom yields and underscores the pivotal role of Artificial Intelligence (AI) tools and remotely sensed observations in modeling non-wood forest products. Integrating such models into sustainable forest management plans is crucial for recognizing the ecosystem services provided by them.
1. Introduction
Non-wood forest products (NWFPs) play a vital role in rural livelihoods and economies globally, contributing to human health and well-being as well as the achievement of the United Nations’ Sustainable Development Goals (SDGs), notably in social and cultural (SDG1—No Poverty, SDG2—Zero Hunger, SDG3—Good Health and Well-being), environmental (SDG13—Climate Action, SDG15—Life on Land), and economic dimensions (SDG8—Decent Work and Economic Growth, SDG9—Industry, Innovation and Infrastructure, SDG12—Responsible Consumption and Production) [1].
The economic significance of NWFPs is often underestimated due to their inclusion in the informal economy or misclassification as agricultural products, with a 2015 pan-European survey estimating their annual value at approximately $25 billion [2], highlighting their integral role in daily life for 90% of European households and the involvement of over 60 million foragers, thus representing an under-recognized source of nature-based solutions that align with the policy objectives outlined in the European Green Deal of 2019 to achieve a climate-neutral economy by 2050.
NWFPs hold significant potential, but they face various risks and challenges, including climate change, uncontrolled harvesting, and market competition from non-renewable alternatives. These challenges are exacerbated by a lack of systematic knowledge, inadequate regulations and management, and insufficient quality standards, impacting product transparency and safety [1].
Within NWFPs, wild mushrooms are of particular importance. Although mushrooms have been collected throughout history for food, they are nowadays a key product for the economy and tourism, among other sectors of interest in rural areas. Each season, the local population collects mushrooms for their own consumption or to generate complementary incomes, either by direct sale or for tourism [3].
Fungi are key organisms in the functioning of ecosystems. In addition to the pro-visioning and cultural ecosystem services provided directly by wild mushrooms, their interaction with fauna and flora is essential in soil mineralization and humification processes and they provide important regulatory and supporting ecosystem services [4]. The great social interest in these NWFPs is reflected in the development of numerous tools for modeling and predicting wild mushroom yields, both at the scientific level and for land management and direct information for pickers [5,6,7,8]. But the development of these has numerous inconveniences.
The use of wild edible mushrooms is limited by the great intra- and inter-annual variability of their harvests, to which is directly added the effect of global change, which causes the fruiting of mushrooms to become increasingly scarce, especially in Mediterranean environments [9,10]. Fungi in temperate latitudes generally fruit after warm and humid weather conditions. Indeed, when spring temperatures and late summer precipitation in the fruiting year are suitable, Mediterranean forests produce mushrooms in abundance [11,12]. In addition to abiotic climatic factors, mushroom production is directly affected by other biotic and abiotic ecosystem factors, such as physiography [13], soil physical and chemical properties [14], and forest structural variables [5,14], among others.
Forest models are increasingly recognized as essential tools in forest research, management, and policymaking. They are currently undergoing significant transformation. Current modeling efforts in forest research are primarily focused on four major topics: data acquisition, productivity estimation, ecological pattern predictions, and forest management related to ecosystem services [15]. While these topics may appear distinct, they are converging towards integrated modeling approaches, largely driven by the pressure of climate change. The combination of new methods facilitates the acquisition of massive amounts of data, new techniques to statistically process such data, and refinements in mechanistic modeling that are incorporating higher levels of ecological complexity and breaking traditional barriers in spatial and temporal scales [15].
The field of biodiversity interactions in forests is complex and expansive, yet it has only recently begun to be incorporated into models [16]. However, it remains largely overlooked in operational models used for forest management. One major barrier to integrating biodiversity into forest modeling is the lack of cohesion among modeling approaches across different spatiotemporal scales [17]. Tree species mapping, forest attribute estimation, health and disease determination, and fire monitoring are advancing with the use of deep learning and other Artificial Intelligence (AI) techniques, although this field remains relatively young, and it is expected to yield plentiful studies in the coming years [18].
Being able to forecast wild mushroom harvests in the medium to long term would allow their effective inclusion in forest management plans and conservation forestry. The income generated by mycological regulation is significant in terms of forest income, but it cannot be considered if there are no tools that allow at least an approximation to be made to calculate production or the number of harvesting licenses that can be issued. Just as the concept of ‘possibility’ is used for timber or game as the quantification of the direct products that a forest has or should produce, the generalization of this concept to other NWFPs will make their sustainable management a reality.
Recently, variables obtained from territorial information generated by remote sensing have allowed the refining of wild mushroom production models, improving them quantitatively and qualitatively. Examples of this integration are the use of information from active LiDAR (Light Detection and Ranging) sensors to identify mushroom fruiting areas [19,20,21], for the development of silvicultural models to optimize the production of this non-timber resource [22], and the use of TLS (Terrestrial Laser Scanning), SAR (Synthetic Aperture Radar), and multispectral information to establish wild mushroom yields in Mediterranean areas [23,24]. All this information provides data at a spatial scale that is more than adequate for forest management and with high temporal resolution, which allows the information to be truly up to date. The combination of climate data with sensor data significantly improves the prediction and, therefore, the estimation of wild mushroom yields [24], which opens the door to a new field of direct application of this technology for the quantification of the ecosystem services provided by fungi and wild mushrooms.
Against this background, we hypothesized that by combining meteoclimatic data with data obtained through multispectral imaging, and using machine learning (ML) techniques, it is possible to accurately quantify the yields of edible wild mushrooms, Lactarius deliciosus, that a forest can produce. This approach aims to provide an index of maximum utility for the sustainable management of this NWFP: the mycological possibility.
Thus, this study aims to assess the effectiveness of various ML techniques in predicting the ‘mycological possibility’ of Lactarius deliciosus in sustainably managed Mediterranean pine forests. We seek to characterize mycological production patterns influenced by climatic factors (such as precipitation and humidity) and forest structure variables. By integrating and analyzing data from multiple sources, including forest structure data, Landsat vegetation indices, and climatic data, we aim to develop and validate predictive models using different AI approaches. Our objectives include identifying critical factors influencing mushroom production and applying the findings to enhance sustainable forest management practices. Ultimately, we aim to assist forest managers in planning the sustainable exploitation of mycological resources by providing effective management tools to facilitate decision-making regarding harvesting permissions and biodiversity conservation.
2. Materials and Methods
2.1. Study Area and Experimental Device
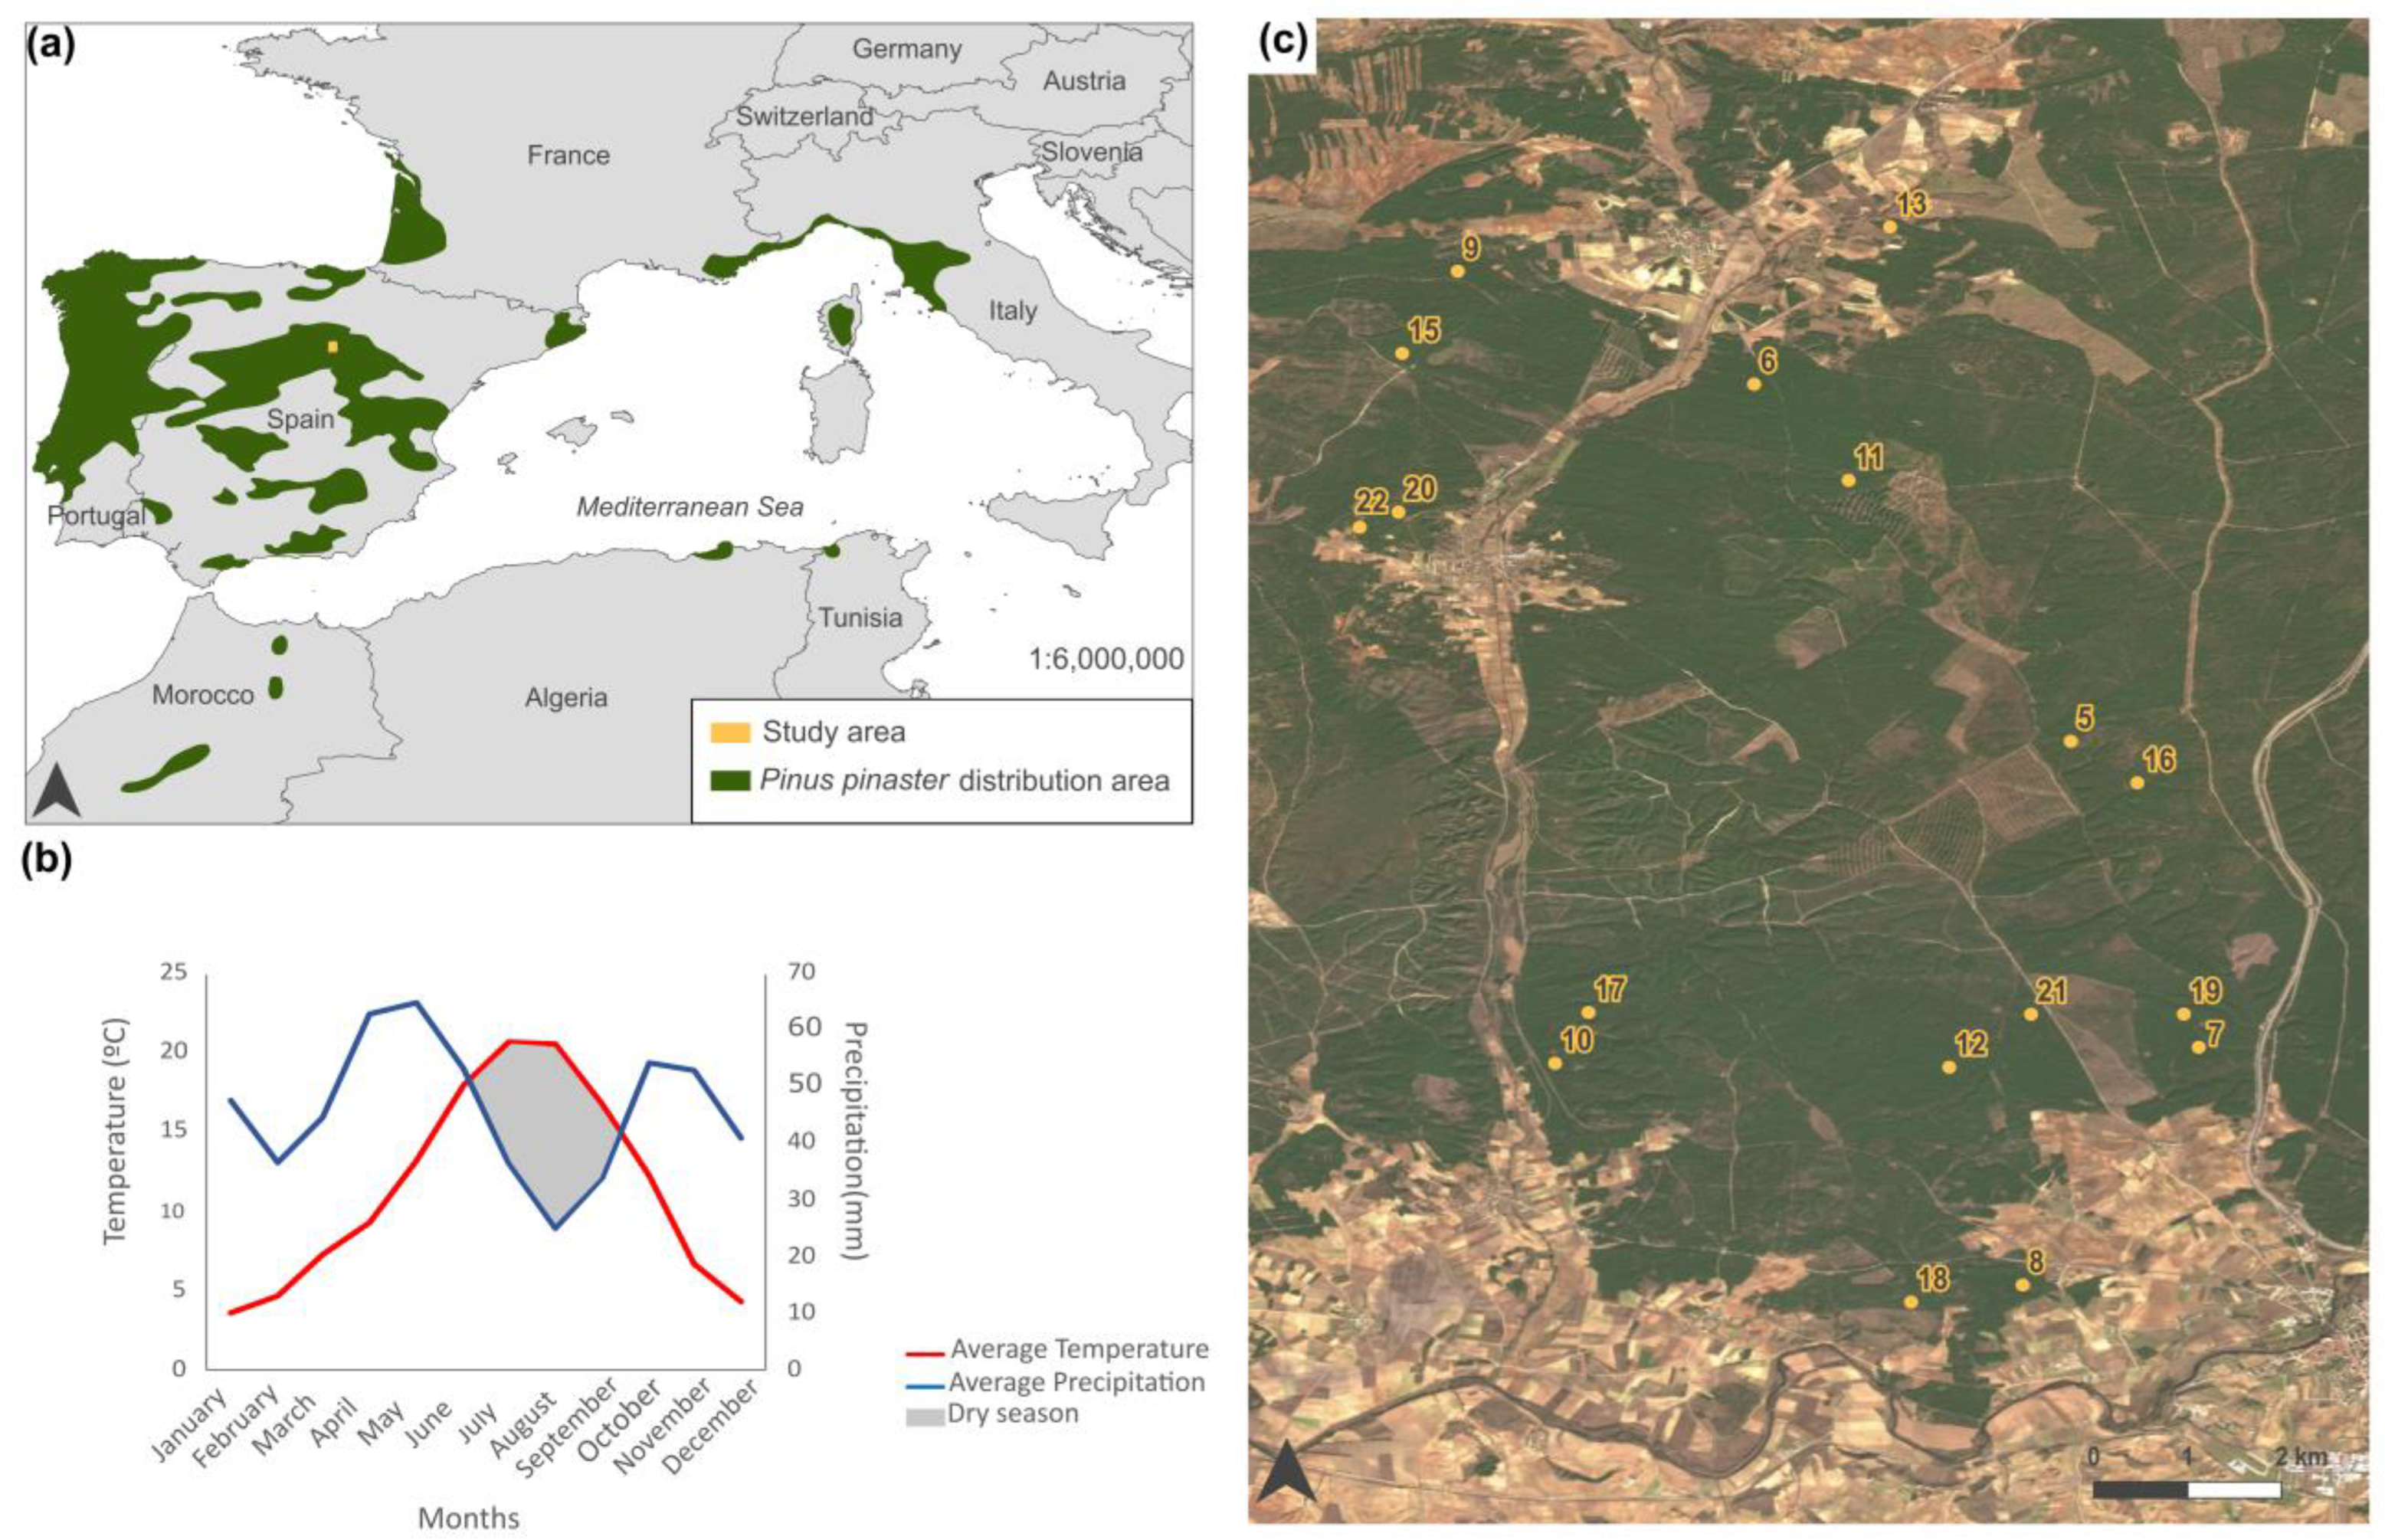
The study area is located in the center of the province of Soria, within the region of Castilla y León in central Spain (Figure 1a). The area ranges in elevation from 1000 to 1200 m.a.s.l. and comprises approximately 17,000 ha of natural forest (Figure 1c), where Pinus pinaster Ait. dominates. Characterized by a continental Mediterranean climate, the area experiences cold winters, dry summers between June and August, and an average annual rainfall of 544 mm (Figure 1b). The experimental device includes 17 plots located in Pinus pinaster pine forest, on sandy soil with high permeability, and low nutrient content. These permanent plots, each 150 m2 (30 m × 5 m), have been installed since 1997 with a fence to avoid harvesting and trampling of mushrooms by pickers who are not involved in their scientific monitoring. The plots have been established using a stratified design to represent all forest structures. We selected forest areas with consistently uniform structure and management practices for our experimental plots. Despite their relatively small size, these 30 m × 5 m plots are representative of the larger study area. This uniformity in forest structure and management ensures that the satellite pixels covering these plots accurately reflect the overall conditions and characteristics of the forest environment. Figure 1c shows the location of the plots used in this study.

Figure 1.
Characterization of the study area: (a) distribution of Pinus pinaster in Southern Europe and Northern Africa and location of our study area, (b) climatic characterization of the study area through mean temperature and precipitation, and (c) recent orthophotography of the area where the plots are located, with their corresponding enumeration.
During the main fruiting period, from September to December, sporocarps were collected weekly. All sporocarps or mushrooms were identified and weighed fresh (more details in [10]). Numerous mushroom species, either mycorrhizal or saprotrophs, were collected, such as Hygrophorus latitabundus Britz, Lactarius deliciosus, Macrolepiota excoriata (Schaeff.) M.M. Moser, Macrolepiota konradii (Huijsm.), Macrolepiota mastoidea (Fr.) Singer, Macrolepiota procera (Scop.) Sing, Suillus luteus (L.) Roussel, and Tricholoma portentosum (Fr.) Quél, but Lactarius deliciosus is the most interesting one in the area because of its economic and culinary importance [25].
2.2. Mushroom Yield Data
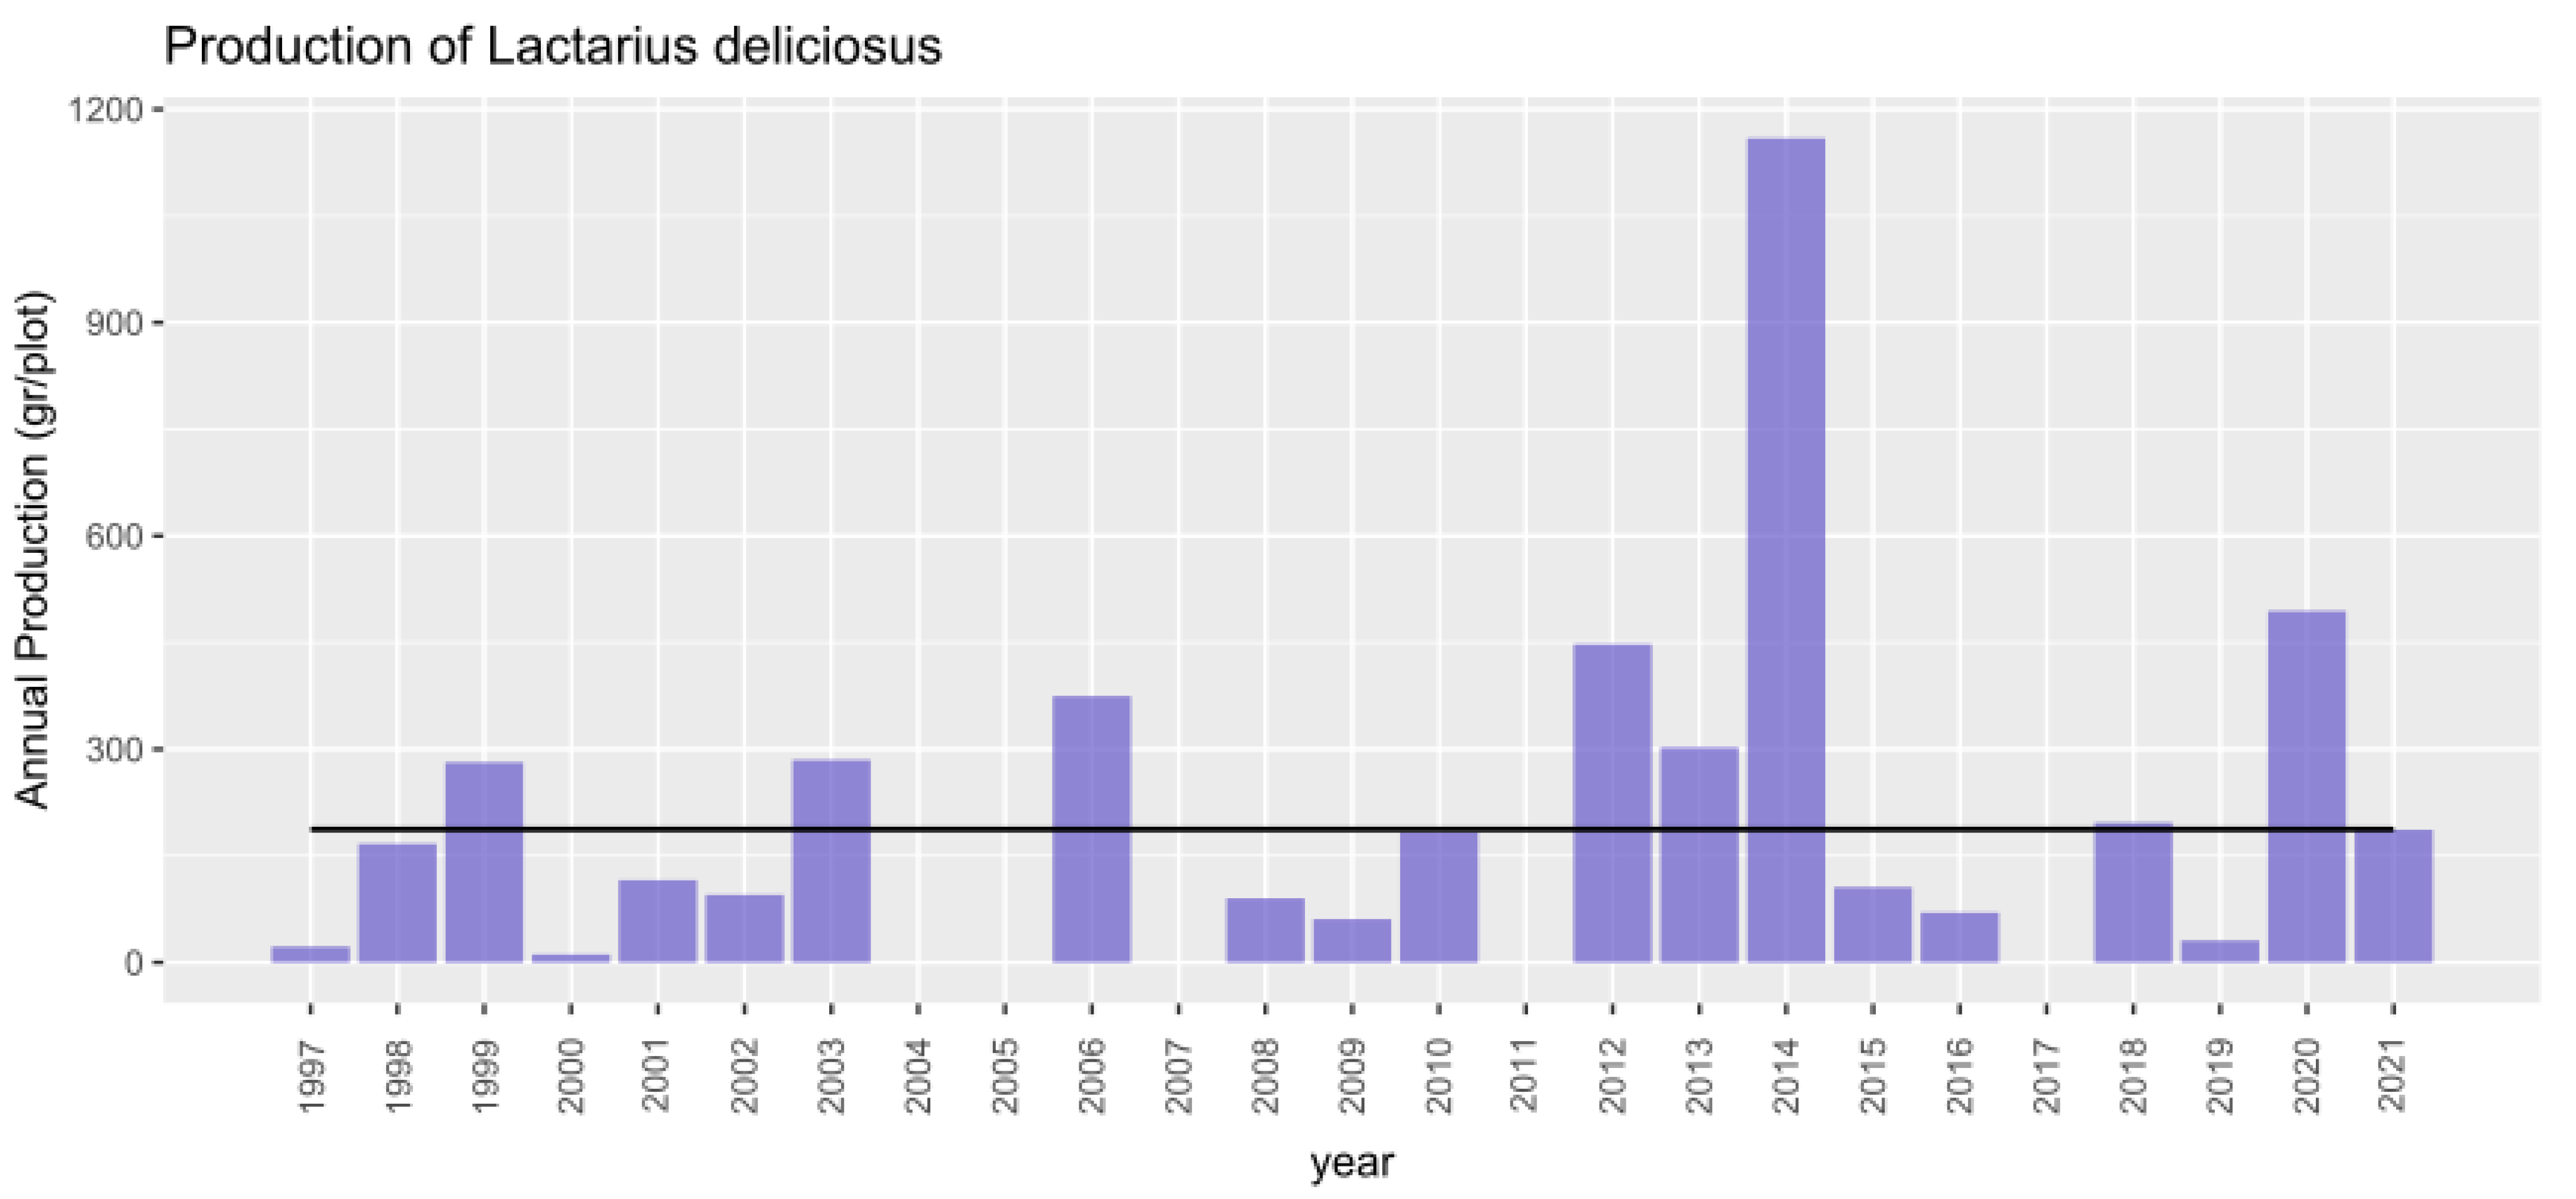
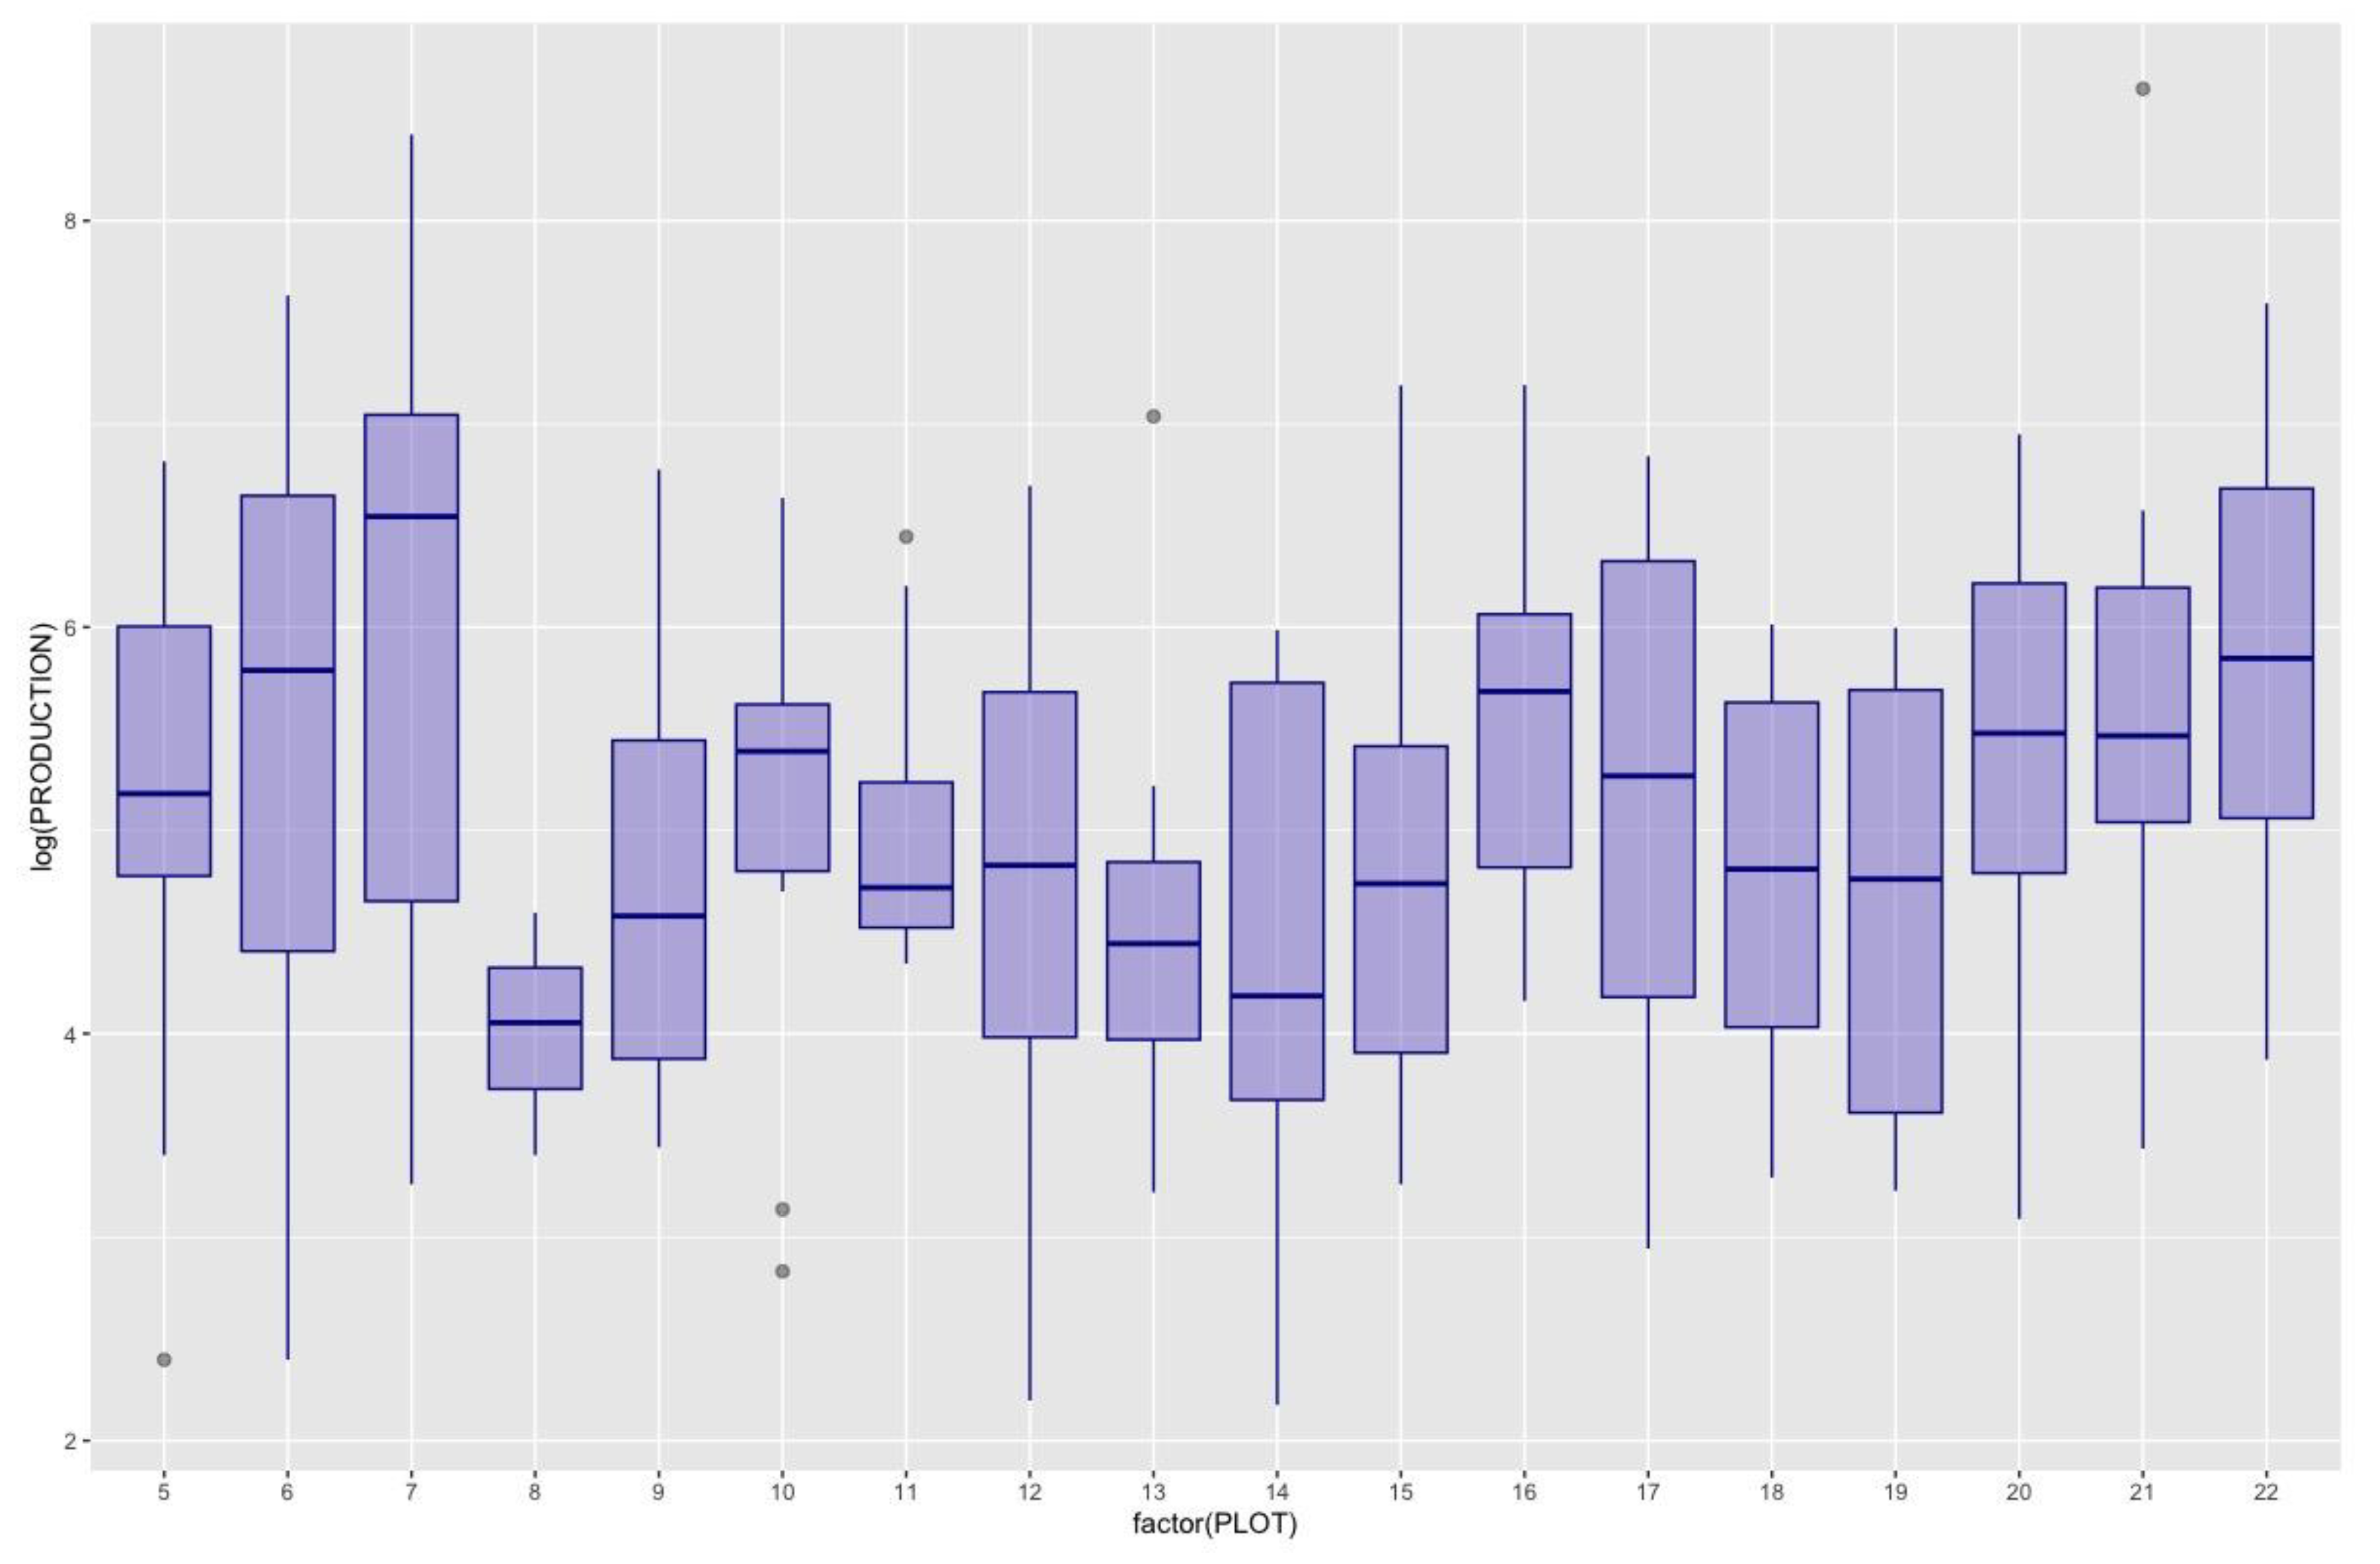
During the collection period (1997–2021) a total of 82,522 kg of Lactarius deliciosus were collected. A database of annual mushroom production values at the plot level recorded yields within the plot, indicating species, number of individuals and biomass per species, collected weekly. In 2014, the highest production was recorded, whereas in 2004, 2005, 2007, and 2017, there was no production detected (see Figure 2). During this period there was an average total production of Lactarius deliciosus of 187 g/year per plot. Although there were no production values in 4 of the 25 years analyzed, the annual variability of production (on a logarithmic scale to avoid the effect of these zeros) was quite similar in the different plots (Figure 3).
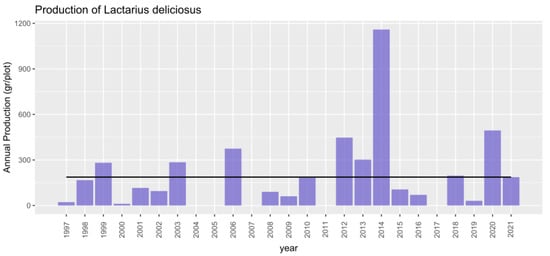
Figure 2.
Annual mushroom yield (g) in experimental network plots during the period 1997–2021. The bars represent the annual production across all analyzed plots, while the constant black line indicates the mean production over the entire period.

Figure 3.
Box Plot of Lactarius deliciosus production across plots over the time series. Each box plot encapsulates the annual production for a specific plot, with Plot 7 exhibiting the highest production and Plot 8 showing the lowest. To enhance visualization and mitigate the impact of years with no production or excessive yields, the total production values (originally in g) have been log-transformed.
2.3. Climatic Data
The climatic data were taken from the meteorological station of Soria (Spain) of the Agencia Estatal de Meteorología (AEMET, www.aemet.com (accessed on 31 March 2024)).
Data were acquired for mean maximum temperature, mean monthly temperature, mean monthly minimum temperature, monthly accumulated precipitation, and mean monthly relative humidity for all months of the mushroom harvesting year from 1997 to 2021. This makes a total of 60 meteoclimatic variables per year. The selection of these variables is based on previous studies on the influence of meteoclimatic variables triggering wild mycorrhizal mushroom production in Mediterranean environments [5,10,12,24].
2.4. Landsat Data
We used multispectral data from the Landsat program (U.S. Geological Survey) specifically from the Thematic Mapper (TM), Enhanced Thematic Mapper Plus (ETM+), and Operational Land Imager (OLI) sensors. From 1996 to 2021, four cloud-free images were obtained per year, one per meteorological season as close as possible to the following dates: February 14 (Winter), May 15 (Spring), August 15 (Summer), and October 15 (Fall). After obtaining the images, we calculated the spectral indices, according to USGS (https://www.usgs.gov (accessed on 31 March 2024)), shown in Table 1. These indices were derived by averaging the pixels within each mushroom production plot. In the statistical models, we included spectral indices obtained both in the year of mushroom collection and those from the preceding year, as previous years hold significance in mushroom production [24]. This makes a total of 40 Landsat variables per year.

Table 1.
Formulation of multispectral indices obtained from Landsat imagery. In the SAVI index, L is the damping factor for soil presence, with values from 0 (high plant density) to 1 (low plant density). For vegetation, a default value of 0.5 is commonly used. In the EVI index, G is a gain factor, L is a canopy background adjustment, and C1 and C2 are the coefficients of the aerosol resistance term, which uses the blue band to correct for aerosol influences in the red band. The specific values used are G = 2.5, C1 = 6, C2 = 7.5, and L = 1.
2.5. Forest Structural Measurements
To characterize the forest structure of each plot, we assessed the main dendrometric variables at four specific time points (1997, 2011, 2014, and 2020). In 1997 and 2020, a comprehensive inventory of the trees in each plot was conducted, involving identification, counting, and precise measurement of their diameter at breast height (dbh, cm) using calipers. The height (h, m) and age (t, years) of the largest trees were determined using a decimeter-precision hypsometer and a Pressler auger, respectively. These measurements facilitated the estimation of key dendrometric variables relevant to forest management, including basal area (G, m2·ha−1), quadratic mean diameter (Dg, cm), tree density per hectare (N, trees·ha−1), dominant height (Ho, m) and dominant age (T, years), site index, the average age of dominant and/or codominant trees of an even-aged area [31] (SI, m), and Reineke (SDI, trees·cm−1·ha−1) and Hart–Becking (S, %) competition indexes. However, the surveys conducted in 2011 and 2014 focused solely on tree counting to ascertain tree density per ha (N).
To monitor the annual forest status of each plot, we employed a growth model widely utilized in the region [32]. This model estimated annual forest variables by applying the four fundamental relationships outlined by Madrigal et al. (1999) [33]: (Equation (1)) the dominant height growth model, where Ho is a function of Age (T) and site index (SI), (Equation (2)) the density evolution model, where tree density (N) is a function of dominant height (Ho), (Equation (3)) the tree size evaluation model based on growth conditions, where quadratic mean diameter (Dg) is a function of tree density (N) and dominant height (Ho), and (Equation (4)) the plot yield evaluation model, where standing volume (V) is a function of basal area (G) and dominant height (Ho). It is worth noting that only the first three models were utilized, as the standing volume of the plot was not evaluated. This makes a total of four forest variables per year.
2.6. Statistical Analysis
The statistical analysis for predicting Lactarius deliciosus was conducted in two stages. Initially, classification models were applied to identify the presence or absence of mushrooms in each plot, and subsequently, the focus shifted to predicting mushroom yields in grams using regression models. To optimize efficiency, the rpart function from the rpart (Recursive Partitioning And Regression Trees) package in the R environment was utilized, incorporating random forests to identify pivotal variables and streamline the initial set [34]. The rpart algorithm operates through a recursive process of dataset splitting until a predefined termination condition is met. At each step, the split is determined by the independent variable that maximizes the potential reduction in the heterogeneity of the predicted variable.
The first step involved a classification model designating 1 for presences of mushrooms and 0 for absences. The dataset was randomly split 70%–30% for training and validation, respectively. A comparative assessment of four non-parametric classification algorithms was conducted using the caret package in R [35]. Random Forest (RF) comprised individual decision trees (maximum 500). A neural network classifier (ANN), suitable for complex structures albeit challenging in interpretability, was employed. Support Vector Machine classifiers, featuring linear (SVML) and radial kernel (SVMR) variants, were applied. Following the acquisition of classification models, cross-validation was executed using the trainControl function [36]. Confusion matrices and accuracy metrics were computed for each classifier model.
Upon selecting the optimal classification model, predictions were extended to the entire dataset, marking the initiation of the second step. In this subsequent phase, the goal was to predict mushroom production in grams using regression models configured from the initial step. After obtaining regression models, the Root Mean Squared Error (RMSE) was calculated to discern the most accurate model.
3. Results
3.1. Selected predictors
Table 2 presents the 40 out of 104 variables (60 meteoclimatic, 40 Landsat, and 4 forest) selected by the rpart method in descending order of importance. The function automatically scales the importance scores to be between 0 and 100. The first seven variables are associated with meteoclimatical conditions (temperature, precipitation, and humidity). Following these, the GNDVI spectral index is introduced, succeeded by an additional seven climate variables. The site index, a key variable for forest growth, holds the 17th position. Subsequently, a mix of climate variables, forest structural variables, and spectral indexes follow in the ranking.
Table 2.
Selected variables, arranged in order of importance, by rpart method.
3.2. First Step: Classifying Presence and Absence of Lactarius deliciosus Sporocarps
The study assessed the performance of four non-parametric classification algorithms, examining their accuracy in both the training sample (70%) and validation sample (30%) during the initial step of the methodology, which involved analyzing the presence and absence of mushrooms. The accuracy in the training sample was approximately 80%, while in the validation sample, it reached around 70%. The RF algorithm showed the lowest training result (0.7148) but the highest validation result (0.7521). The other techniques demonstrated comparable accuracy outcomes in both training and validation. SVML achieved 0.8477 in training and 0.7025 in validation, while SVMR obtained 0.8203 and 0.7190, and ANN attained 0.8398 and 0.719, respectively.
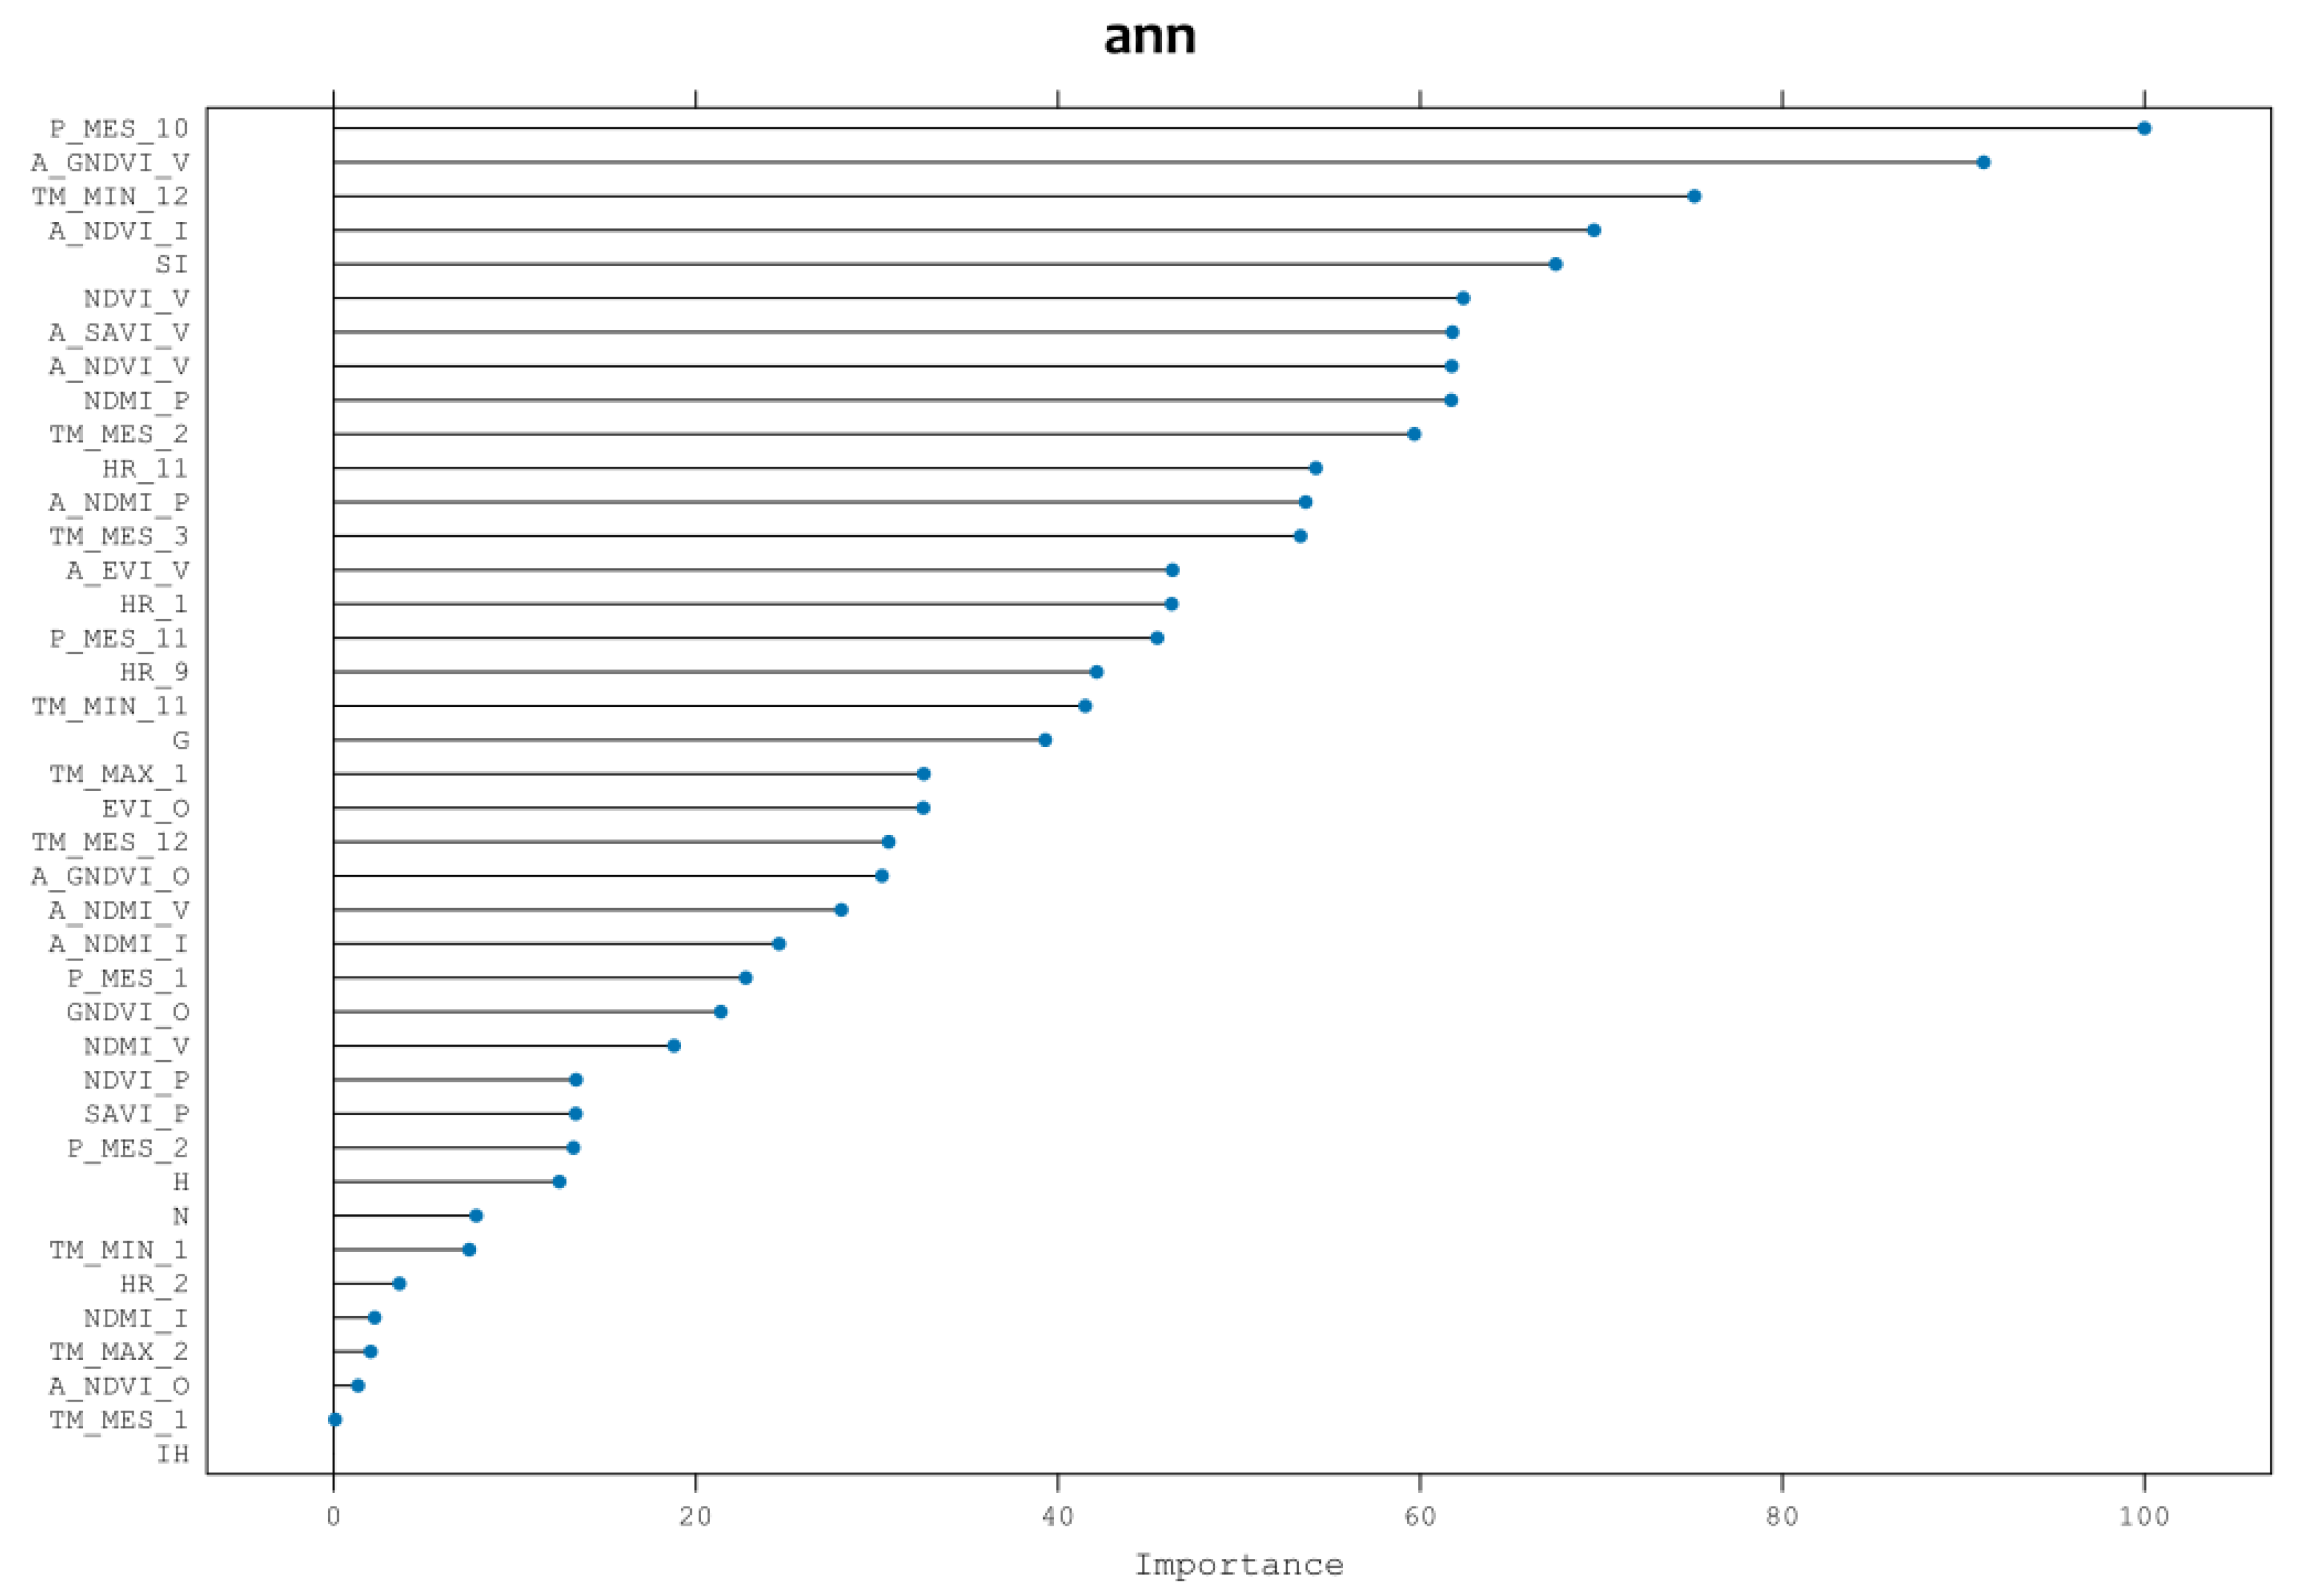
While rpart provided a sorted list of variables based on their relevance, this was primarily for computational efficiency and to exclude variables expected to be insignificantly important. Thus, after completing the analysis, and employing the chosen ANN algorithm, Figure 4 illustrates the prioritization of variables by their importance. The results significantly differ from those obtained through rpart variable selection. In this context, the most influential variables are climatic, particularly the average precipitation in October (P_MONTH_10), succeeded by spectral indices like summer GNDVI of the previous year, December minimum temperature, winter NDVI of the previous year, and site index (stand forest potential productivity).

Figure 4.
List of variables obtained in step 1, ranked in order of importance.
High autumn precipitation is essential to produce mushroom yields, whereas low temperatures in December, i.e., frosts, cause the yield of Lactarius deliciosus to stop [23]. The vigor of the stand is shown by the spectral indexes located in the second and fourth position of the importance of the variables; these indexes are from the year before fructification, and thus they imply that the availability of nutrients and carbon in the roots of the forest stand helps the production of mycorrhizal mushroom yields the following year [24]. In fifth position is the site index, which describes the growth potential of the trees; for a high production of Lactarius deliciosus, healthy and highly productive Pinus pinaster stands are needed.
3.3. Second Step: Quantifying Lactarius deliciosus Sporocarp Production by Weight
During the second phase of the methodology, Lactarius deliciosus production was quantified only in plots that yielded mushrooms, using nonparametric regression techniques. The analysis produced statistically significant results, although with a notable margin of error. The Root Mean Square Error (RMSE) varied significantly, ranging from 6991 g to 8498 g. The RF model had the lowest error rates, while the ANN had the highest error rates. The SVML and SVRM models had moderate RMSE values, recorded at 7174 g and 7090 g, respectively.
To calculate the RMSE, we divided the sample into 70% for model training and 30% for validation, and thus we applied the selected model to the validation data, in this case RF, and applied the following equation (Equation (5)):
where Σ symbol indicates “sum”, Pi is the predicted value for the ith observation in the dataset, and Oi is the observed value for the ith observation in the dataset.
RMSE = √[Σ(Pi − Oi)2]
Thus, the RMSE we obtained was the grams of difference in the predictions with the field measurements, in all the plots that entered the validation group. We calculated this RMSE to have a comparative value between the four models, choosing the one with the lowest value and therefore the lowest bias of difference with the field data taken.
4. Discussion
The most influential variables in triggering Lactarius deliciosus sporocarps are the meteoclimatic ones together with the site index, directly based on basal area and tree density. In climates like the Spanish Mediterranean, characterized by a pronounced dry season and limited water availability, the annual variation in fruiting body production is closely linked to the spatiotemporal patterns of precipitation and temperature within a specific year [32]. Globally, to date, it is recognized that the production of wild mycorrhizal fungi depends mainly on age, tree canopy cover, tree density or basal area and forest species composition [5]. In addition, spectral variables, such as GNDVI and NDVI, have a high specific weight, as they are related to the net primary productivity of the ecosystems and the physiological activity of the tree, essential for mycorrhizal fungi such as Lactarius deliciosus, in accordance with the results of Olano et al. (2020) [24].
The application of any mycological management action in a forest involves the identification of mycological resources, species and taxa and the estimation or prediction of the approximate periodic yields of carpophores of each species of interest [32]. From a biological standpoint, a model with 40 parameters may seem impractical. However, when integrated with AI techniques, it becomes highly practical and useful.
The two-step data analysis proposed here allows for a simple and highly accurate determination of the presence of Lactarius deliciosus in a Mediterranean forest. This result alone has the greatest interest because it allows the determination of the presence of an edible mushroom of high commercial value in a certain area of interest. With the second step, the quantity of mushrooms is determined. This second result has a higher error, but it is isolated from the previous one, and can be reduced by improving the in situ data source, by installing more mycological plots or with longer sampling series, for example. This proposed methodology allows forest managers the opportunity to easily set a value that will allow them to establish the number of licenses to be sold in a year or the amount of Lactarius deliciosus that each person can harvest, so that holistic and sustainable management of forest exploitation becomes effective.
Quantification of ecosystem services is an important step in operationalizing the concept for management and decision-making [37]. The fact that AI methods in remote sensing tend to exhibit higher repeatability and generalizability, while also making use of larger datasets compared with other methods, likely reflects the maturity of machine learning applications in this field [38]. However, it also suggests that AI may be underutilized in other areas of environmental science research not directly linked to remote sensing, or that these other areas of research have not accumulated as much data as in remote sensing. The superior performance of AI algorithms compared with statistical models can be explained by their higher flexibility and automatic data-dependent complexity optimization [39].
Emerging ecosystem services technologies have the potential to revolutionize our understanding and management of human–nature interactions [40]. By reducing costs, increasing data availability, improving tool applicability, and creating opportunities for learning and communication, these technologies are poised to transform the field. Despite the limitations posed by Earth Observation (EO) and remote sensing, including validation and calibration needs, spectral/spatial resolution mismatches with ecosystem services phenomena, data processing limitations, and the requirement for specialized training and software, they also offer numerous opportunities. EO and remote sensing provide consistent and coherent information over multiple spatial and temporal scales, making them particularly suitable for monitoring, evaluation, and learning about ecosystem services. They allow for cost-effective assessment over large areas and improve data availability in remote and heterogeneous regions. Additionally, the integration of EO with other spatial data sources facilitates meaningful ecosystem services assessments. As a result, the use of EO and remote sensing is becoming widespread in ecosystem monitoring [40].
Effective ecosystem management must be conducted in the manner of adaptive management. This means carrying out monitoring to intentionally gather information on the results of management, to identify and address early-warning signs of problems, and to learn more about the ecosystem and socio-economic environment and how to work with them [41]. In fact, final ecosystem services are often directly assessed, but such assessment does not provide information about contributing ecological processes or how management could be adapted to increase service provision. A mechanistic understanding of relationships between management and ecosystem services is required to transfer management recommendations outside the context where data were collected [42].
One way to address this challenge is to seek to identify and develop simple tools that allow ecosystem services to be included directly in sustainable forest management tools. Moreover, understanding long-term forest dynamics is necessary for sustainable planning and management. Therefore, establishing predictive models and refining them to suit different ecosystems and regions worldwide is essential for achieving sustainable and multifunctional forest management practices [32].
Despite the high inter- and intra-annual variability of their harvests, prior research indicates that climatic factors play a crucial role in regulating mushroom yields [10,11,12,43,44]. Specifically, wet and warm autumns appear to enhance ectomycorrhizal fungi yields in Spanish pine forests [8,45,46], but also spring’s rain has the utmost importance [10]. However, the emergence of fungal sporocarps is not solely explained by climatic factors. Topographical elements such as slope, aspect, and altitude [47], as well as soil characteristics (e.g., pH, texture) [8,48], and variables related to stand structure [22,49], also play influential roles in mushroom fructifications [5]. Among the latter variables, stand basal area has been identified as correlated with mushroom production. Studies suggest that forest stands with excessively low or high basal areas may exhibit lower mushroom yields compared with stands with intermediate values of stand basal area [8,13,49,50,51,52]. All these models, which make it possible to establish relationships between climatic and forestry variables and the production of edible mushrooms, allow the creation of indices for their effective inclusion in forestry management. The high availability of data on the evolution of forest ecosystems with high spatial and temporal resolution thanks to remote sensing makes it possible to have starting data to implement these models, although the low availability of in situ data on mushroom yields is a drawback.
Synergistic approaches in ecosystem services management are highly favorable. These strategies align management actions to yield positive effects across various goods and services, all the while safeguarding the sustainability and perpetuity of the ecosystem [53]. Mushroom production exhibits synergy with other uses of forests, like timber production and recreation. It also serves as a significant contributor to the economies of rural areas dependent on forest resources [54,55].
Fungal diversity can be conserved in managed forests if (i) low-impact logging operations are performed; (ii) stand structural complexity and late-successional forest characteristics are enhanced; (iii) tree species mixture is enhanced; (iv) deadwood amount and diversity is promoted; and (v) landscape heterogeneity and connectivity is improved or maintained [5]. All these measures should be included in silviculture applied to forests to ensure their maintenance and the maintenance of all services provided by fungi. A better understanding of the effects of silvicultural practices on fungal diversity and community dynamics can provide a foundation for forest management plans that may reduce trade-offs between timber harvesting and biodiversity conservation [5].
Remote sensing is a powerful means for analysis, synthesis, and reporting, providing insights and contributing to informing decisions made about forest ecosystems [56]. The vast amount of remotely sensed data together with new data processing techniques and improved computing capabilities are opening the way for the development of such tools. Regional mushroom production models based on LiDAR data have been developed [21,22], but there is a lack of specific tools to take forest management at the stand level into consideration on a day-to-day basis. Currently, in Spain, only wood and game are included in forest management plans using the concept of possibility. Establishing the possibility of other forest products and services will allow their exploitation without endangering their persistence and will enable a holistic approach to management to be realized, which will maximize the ecosystems services they provide.
5. Conclusions
Wild edible mushrooms are a direct product of the forest. Following classical principles of forest management, their persistence, stability, and sustained yield must be ensured. Not taking them into account in sustainable forest management tools can lead to compromising the ecosystem services they provide.
Mycological possibility joint spectral variables, together with meteoclimatic and stand variables, allow us to fill this gap using ML techniques, offering a useful tool to facilitate decision-making regarding wild edible mushroom harvesting permissions and biodiversity conservation, among other considerations. The accuracy of this index can be improved in the future with a longer in situ data set of mushrooms, but it will also improve with the inclusion of new remote sensing data, which allow information on the evolution of forests and their components to be available in near real time, creating an invaluable opportunity to increase our knowledge of wild fungi and their ecosystem services.
Author Contributions
Conceptualization, B.Á. and F.R.-P.; methodology, F.R.-P., B.Á. and R.M.-R.; formal analysis, F.R.-P. and R.M.-R.; data curation, R.M.-R., T.Á., J.M.A., L.M.F.-T. and F.R.-P.; writing—original draft preparation, F.R.-P., B.Á. and R.M.-R.; writing—review and editing, all authors; supervision, B.Á. and F.R.-P. All authors have read and agreed to the published version of the manuscript.
Funding
This work was supported by the Spanish Ministry of Science and Innovation, under grant DI-17-9626, and by Cátedra CeI of Caja Rural de Soria.
Institutional Review Board Statement
Not applicable.
Informed Consent Statement
Not applicable.
Data Availability Statement
Mycological data employed in this work belong to Castilla y León Regional Government (Consejería de Medio Ambiente). We were granted permission to use the data for scientific research but are not allowed to share them publicly. Authors can provide remote sensing data directly upon request.
Acknowledgments
Consejería de Medio Ambiente de la Junta de Castilla y León maintains the network of wild mushroom productive plots and provided the data. Valonsadero Forestry Centre and Cesefor Foundation staff are thanked for their work collecting mushroom data.
Conflicts of Interest
The authors declare no conflicts of interest.
References
- Martinez De Arano, I.; Maltoni, S.; Picardo, A.; Mutke, S. European Forest Institute. Non-Wood Forest Products for People, Nature and the Green Economy. Recommendations for Policy Priorities in Europe. A White Paper Based on Lessons Learned from around the Mediterranean; Knowledge to Action; European Forest Institute: Joensuu, Finland, 2021. [Google Scholar]
- Communication from the Commission to the European Parliament, the Council, the European Economic and Social Committee and the Committee of the Regions New EU Forest Strategy for 2030. 2021. Available online: https://eur-lex.europa.eu/legal-content/EN/TXT/?uri=CELEX%3A52021DC0572 (accessed on 28 June 2024).
- Wild Edible Fungi a Global Overview of Their Use and Importance to People. Available online: https://www.fao.org/3/y5489e/y5489e00.htm (accessed on 8 October 2023).
- Sánchez-González, M.; Calama, R.; Bonet, J.A. Los Productos Forestales no Madereros en España: Del Monte a la Industria; Monografías INIA: Serie Forestal Nº 31; INIA, Ministerio de Ciencia e Innovación, Gobierno de España: Madrid, Spain, 2020; ISBN 978-84-7498-584-9. [Google Scholar]
- Tomao, A.; Bonet, J.A.; Martínez de Aragón, J.; de-Miguel, S. Is Silviculture Able to Enhance Wild Forest Mushroom Resources? Current Knowledge and Future Perspectives. For. Ecol. Manag. 2017, 402, 102–114. [Google Scholar] [CrossRef]
- Kurttila, M.; Pukkala, T.; Miina, J. Synergies and Trade-Offs in the Production of NWFPs Predicted in Boreal Forests. Forests 2018, 9, 417. [Google Scholar] [CrossRef]
- Olah, B.; Kunca, V.; Gallay, I. Assessing the Potential of Forest Stands for Ectomycorrhizal Mushrooms as a Subsistence Ecosystem Service for Socially Disadvantaged People: A Case Study from Central Slovakia. Forests 2020, 11, 282. [Google Scholar] [CrossRef]
- Martínez-Peña, F.; de-Miguel, S.; Pukkala, T.; Bonet, J.A.; Ortega-Martínez, P.; Aldea, J.; Martínez de Aragón, J. Yield Models for Ectomycorrhizal Mushrooms in Pinus Sylvestris Forests with Special Focus on Boletus Edulis and Lactarius Group Deliciosus. For. Ecol. Manag. 2012, 282, 63–69. [Google Scholar] [CrossRef]
- Morera, A.; Martínez de Aragón, J.; De Cáceres, M.; Bonet, J.A.; de-Miguel, S. Historical and Future Spatially-Explicit Climate Change Impacts on Mycorrhizal and Saprotrophic Macrofungal Productivity in Mediterranean Pine Forests. Agric. For. Meteorol. 2022, 319, 108918. [Google Scholar] [CrossRef]
- Ágreda, T.; Águeda, B.; Olano, J.M.; Vicente-Serrano, S.M.; Fernández-Toirán, M. Increased Evapotranspiration Demand in a Mediterranean Climate Might Cause a Decline in Fungal Yields under Global Warming. Glob. Chang. Biol. 2015, 21, 3499–3510. [Google Scholar] [CrossRef]
- Alday, J.G.; Martínez de Aragón, J.; de-Miguel, S.; Bonet, J.A. Mushroom Biomass and Diversity Are Driven by Different Spatio-Temporal Scales along Mediterranean Elevation Gradients. Sci. Rep. 2017, 7, 45824. [Google Scholar] [CrossRef] [PubMed]
- Ágreda, T.; Águeda, B.; Fernández-Toirán, M.; Vicente-Serrano, S.M.; Òlano, J.M. Long-Term Monitoring Reveals a Highly Structured Interspecific Variability in Climatic Control of Sporocarp Production. Agric. For. Meteorol. 2016, 223, 39–47. [Google Scholar] [CrossRef]
- Bonet, J.A.; Pukkala, T.; Fischer, C.R.; Palahí, M.; de Aragón, J.M.; Colinas, C. Empirical Models for Predicting the Production of Wild Mushrooms in Scots Pine (Pinus sylvestris L.) Forests in the Central Pyrenees. Ann. For. Sci. 2008, 65, 1. [Google Scholar] [CrossRef]
- Hagenbo, A.; Alday, J.G.; Martínez de Aragón, J.; Castaño, C.; de-Miguel, S.; Bonet, J.A. Variations in Biomass of Fungal Guilds Are Primarily Driven by Factors Related to Soil Conditions in Mediterranean Pinus Pinaster Forests. Biol. Fertil. Soils 2022, 58, 487–501. [Google Scholar] [CrossRef]
- Blanco, J.A.; Lo, Y.-H. Latest Trends in Modelling Forest Ecosystems: New Approaches or Just New Methods? Curr. For. Rep. 2023, 9, 219–229. [Google Scholar] [CrossRef]
- Scoullar, K.; Seely, B.; Welham, C.; Kimmins, H.; Blanco, J.A. Forecasting Forest Futures: A Hybrid Modelling Approach to the Assessment of Sustainability of Forest Ecosystems and Their Values; Routledge: London, UK, 2010; ISBN 978-1-84977-643-1. [Google Scholar]
- Morán-Ordóñez, A.; Roces-Díaz, J.V.; Otsu, K.; Ameztegui, A.; Coll, L.; Lefevre, F.; Retana, J.; Brotons, L. The Use of Scenarios and Models to Evaluate the Future of Nature Values and Ecosystem Services in Mediterranean Forests. Reg. Environ. Chang. 2019, 19, 415–428. [Google Scholar] [CrossRef]
- Hamedianfar, A.; Mohamedou, C.; Kangas, A.; Vauhkonen, J. Deep Learning for Forest Inventory and Planning: A Critical Review on the Remote Sensing Approaches so Far and Prospects for Further Applications. For. Int. J. For. Res. 2022, 95, 451–465. [Google Scholar] [CrossRef]
- Valdez, J.W.; Brunbjerg, A.K.; Fløjgaard, C.; Dalby, L.; Clausen, K.K.; Pärtel, M.; Pfeifer, N.; Hollaus, M.; Wimmer, M.H.; Ejrnæs, R.; et al. Relationships between Macro-Fungal Dark Diversity and Habitat Parameters Using LiDAR. Fungal Ecol. 2021, 51, 101054. [Google Scholar] [CrossRef]
- Thers, H.; Brunbjerg, A.K.; Læssøe, T.; Ejrnæs, R.; Bøcher, P.K.; Svenning, J.-C. Lidar-Derived Variables as a Proxy for Fungal Species Richness and Composition in Temperate Northern Europe. Remote Sens. Environ. 2017, 200, 102–113. [Google Scholar] [CrossRef]
- Peura, M.; Silveyra Gonzalez, R.; Müller, J.; Heurich, M.; Vierling, L.A.; Mönkkönen, M.; Bässler, C. Mapping a ‘Cryptic Kingdom’: Performance of Lidar Derived Environmental Variables in Modelling the Occurrence of Forest Fungi. Remote Sens. Environ. 2016, 186, 428–438. [Google Scholar] [CrossRef]
- Pascual, A.; de-Miguel, S. Evaluation of Mushroom Production Potential by Combining Spatial Optimization and LiDAR-Based Forest Mapping Data. Sci. Total Environ. 2022, 850, 157980. [Google Scholar] [CrossRef]
- Martínez-Rodrigo, R.; Gómez, C.; Toraño-Caicoya, A.; Bohnhorst, L.; Uhl, E.; Águeda, B. Stand Structural Characteristics Derived from Combined TLS and Landsat Data Support Predictions of Mushroom Yields in Mediterranean Forest. Remote Sens. 2022, 14, 5025. [Google Scholar] [CrossRef]
- Olano, J.M.; Martínez-Rodrigo, R.; Altelarrea, J.M.; Ágreda, T.; Fernández-Toirán, M.; García-Cervigón, A.I.; Rodríguez-Puerta, F.; Águeda, B. Primary Productivity and Climate Control Mushroom Yields in Mediterranean Pine Forests. Agric. For. Meteorol. 2020, 288–289, 108015. [Google Scholar] [CrossRef]
- Voces, R.; Diaz-Balteiro, L.; Alfranca, Ó. Demand for Wild Edible Mushrooms. The Case of Lactarius deliciosus in Barcelona (Spain). J. For. Econ. 2012, 18, 47–60. [Google Scholar] [CrossRef]
- Rouse, J.; Haas, R.; Schell, J.; Deering, D. Monitoring Vegetation Systems in the Great Plains with ERTS; NASA: Washington, DC, USA, 1973; pp. 309–317. [Google Scholar]
- Gitelson, A.A.; Kaufman, Y.J.; Merzlyak, M.N. Use of a Green Channel in Remote Sensing of Global Vegetation from EOS-MODIS. Remote Sens. Environ. 1996, 58, 289–298. [Google Scholar] [CrossRef]
- Gao, B. NDWI—A Normalized Difference Water Index for Remote Sensing of Vegetation Liquid Water from Space. Remote Sens. Environ. 1996, 58, 257–266. [Google Scholar] [CrossRef]
- Huete, A.R. A Soil-Adjusted Vegetation Index (SAVI). Remote Sens. Environ. 1988, 25, 295–309. [Google Scholar] [CrossRef]
- Huete, A.; Didan, K.; Miura, T.; Rodriguez, E.P.; Gao, X.; Ferreira, L.G. Overview of the Radiometric and Biophysical Performance of the MODIS Vegetation Indices. Remote Sens. Environ. 2002, 83, 195–213. [Google Scholar] [CrossRef]
- Nyland, R.D. Silviculture: Concepts and Applications, 3rd ed.; Waveland Press: Long Grove, IL, USA, 2016; ISBN 978-1-4786-3376-1. [Google Scholar]
- Domínguez-Núñez, J.A.; Oliet, J.A. Management of Mushroom Resources in Spanish Forests: A Review. For. Int. J. For. Res. 2023, 96, 135–154. [Google Scholar] [CrossRef]
- Madrigal Collazo, A.; Álvarez González, J.; Rojo Alboreca, A.; Rodriguez Soallero, R. Tablas de Producción Para Los Montes Españoles; Fundacion Conde del Valle de Salazar: Madrid, Spain, 1999; ISBN 84-86793-48-3. [Google Scholar]
- Therneau, T.; Atkinson, B.; Port, B.R. Rpart: Recursive Partitioning and Regression Trees. 2023. Available online: https://cran.r-project.org/web/packages/rpart/rpart.pdf (accessed on 28 June 2024).
- A Short Introduction to the Caret Package. Available online: https://cran.r-project.org/web/packages/caret/vignettes/caret.html (accessed on 14 December 2023).
- trainControl Function—Rdocumentation. Available online: https://www.rdocumentation.org/packages/caret/versions/6.0-92/topics/trainControl (accessed on 15 December 2023).
- Boerema, A.; Rebelo, A.J.; Bodi, M.B.; Esler, K.J.; Meire, P. Are Ecosystem Services Adequately Quantified? J. Appl. Ecol. 2017, 54, 358–370. [Google Scholar] [CrossRef]
- Scowen, M.; Athanasiadis, I.N.; Bullock, J.M.; Eigenbrod, F.; Willcock, S. The Current and Future Uses of Machine Learning in Ecosystem Service Research. Sci. Total Environ. 2021, 799, 149263. [Google Scholar] [CrossRef]
- Pichler, M.; Hartig, F. Machine Learning and Deep Learning—A Review for Ecologists. Methods Ecol. Evol. 2023, 14, 994–1016. [Google Scholar] [CrossRef]
- Schirpke, U.; Ghermandi, A.; Sinclair, M.; Van Berkel, D.; Fox, N.; Vargas, L.; Willemen, L. Emerging Technologies for Assessing Ecosystem Services: A Synthesis of Opportunities and Challenges. Ecosyst. Serv. 2023, 63, 101558. [Google Scholar] [CrossRef]
- Bubb, P.; Soesbergen, A.V.; Bisht, N.; Singh, G.; Joshi, S.; Aryal, K.; Danks, F.S.; Rawat, G.S.; Wu, N.; Kotru, R. Planning Management for Ecosystem Services: An Operations Manual; International Centre for Integrated Mountain Development (ICIMOD): Kathmandu, Nepal, 2017. [Google Scholar]
- Birkhofer, K.; Diehl, E.; Andersson, J.; Ekroos, J.; Früh-Müller, A.; Machnikowski, F.; Mader, V.L.; Nilsson, L.; Sasaki, K.; Rundlöf, M.; et al. Ecosystem Services—Current Challenges and Opportunities for Ecological Research. Front. Ecol. Evol. 2015, 2, 87. [Google Scholar] [CrossRef]
- Kauserud, H.; Mathiesen, C.; Ohlson, M. High Diversity of Fungi Associated with Living Parts of Boreal Forest Bryophytes. Botany 2008, 86, 1326–1333. [Google Scholar] [CrossRef]
- Karavani, A.; De Cáceres, M.; Martínez de Aragón, J.; Bonet, J.A.; de-Miguel, S. Effect of Climatic and Soil Moisture Conditions on Mushroom Productivity and Related Ecosystem Services in Mediterranean Pine Stands Facing Climate Change. Agric. For. Meteorol. 2018, 248, 432–440. [Google Scholar] [CrossRef]
- Taye, Z.M.; Martínez-Peña, F.; Bonet, J.A.; Martínez de Aragón, J.; de-Miguel, S. Meteorological Conditions and Site Characteristics Driving Edible Mushroom Production in Pinus Pinaster Forests of Central Spain. Fungal Ecol. 2016, 23, 30–41. [Google Scholar] [CrossRef]
- Alday, J.G.; Bonet, J.A.; Oria-de-Rueda, J.A.; Martínez-de-Aragón, J.; Aldea, J.; Martín-Pinto, P.; de-Miguel, S.; Hernández-Rodríguez, M.; Martínez-Peña, F. Record Breaking Mushroom Yields in Spain. Fungal Ecol. 2017, 26, 144–146. [Google Scholar] [CrossRef]
- Egli, S. Mycorrhizal Mushroom Diversity and Productivity—An Indicator of Forest Health? Ann. For. Sci. 2011, 68, 81–88. [Google Scholar] [CrossRef]
- Alonso Ponce, R.; Águeda, B.; Ágreda, T.; Modrego, M.P.; Aldea, J.; Fernández-toirán, L.M.; MartÍnez-peña, F. Rockroses and Boletus Edulis Ectomycorrhizal Association: Realized Niche and Climatic Suitability in Spain. Fungal Ecol. 2011, 4, 224–232. [Google Scholar] [CrossRef]
- Tahvanainen, V.; Miina, J.; Kurttila, M.; Salo, K. Modelling the Yields of Marketed Mushrooms in Picea Abies Stands in Eastern Finland. For. Ecol. Manag. 2016, 362, 79–88. [Google Scholar] [CrossRef]
- Bonet, J.A.; Palahí, M.; Colinas, C.; Pukkala, T.; Fischer, C.R.; Miina, J.; Martínez de Aragón, J. Modelling the Production and Species Richness of Wild Mushrooms in Pine Forests of the Central Pyrenees in Northeastern Spain. Can. J. For. Res. 2010, 40, 347–356. [Google Scholar] [CrossRef]
- de-Miguel, S.; Bonet, J.A.; Pukkala, T.; Martínez de Aragón, J. Impact of Forest Management Intensity on Landscape-Level Mushroom Productivity: A Regional Model-Based Scenario Analysis. For. Ecol. Manag. 2014, 330, 218–227. [Google Scholar] [CrossRef]
- Sánchez-González, M.; de-Miguel, S.; Martin-Pinto, P.; Martínez-Peña, F.; Pasalodos-Tato, M.; Oria-de-Rueda, J.A.; Martínez de Aragón, J.; Cañellas, I.; Bonet, J.A. Yield Models for Predicting Aboveground Ectomycorrhizal Fungal Productivity in Pinus Sylvestris and Pinus Pinaster Stands of Northern Spain. For. Ecosyst. 2019, 6, 52. [Google Scholar] [CrossRef]
- Pascual, A.; Giardina, C.P.; Povak, N.A.; Hessburg, P.F.; Heider, C.; Salminen, E.; Asner, G.P. Optimizing Invasive Species Management Using Mathematical Programming to Support Stewardship of Water and Carbon-Based Ecosystem Services. J. Environ. Manag. 2022, 301, 113803. [Google Scholar] [CrossRef] [PubMed]
- Palahí, M.; Pukkala, T.; Bonet, J.A.; Colinas, C.; Fischer, C.R.; Martínez de Aragón, J.R. Effect of the Inclusion of Mushroom Values on the Optimal Management of Even-Aged Pine Stands of Catalonia. For. Sci. 2009, 55, 503–511. [Google Scholar] [CrossRef]
- Linkevičius, E.; Borges, J.G.; Doyle, M.; Pülzl, H.; Nordström, E.-M.; Vacik, H.; Brukas, V.; Biber, P.; Teder, M.; Kaimre, P.; et al. Linking Forest Policy Issues and Decision Support Tools in Europe. For. Policy Econ. 2019, 103, 4–16. [Google Scholar] [CrossRef]
- Gómez, C.; Alejandro, P.; Hermosilla, T.; Montes, F.; Pascual, C.; Ruiz, L.A.; Álvarez-Taboada, F.; Tanase, M.; Valbuena, R. Remote Sensing for the Spanish Forests in the 21st Century: A Review of Advances, Needs, and Opportunities. For. Syst. 2019, 28, eR001. [Google Scholar] [CrossRef]
Disclaimer/Publisher’s Note: The statements, opinions and data contained in all publications are solely those of the individual author(s) and contributor(s) and not of MDPI and/or the editor(s). MDPI and/or the editor(s) disclaim responsibility for any injury to people or property resulting from any ideas, methods, instructions or products referred to in the content. |
© 2024 by the authors. Licensee MDPI, Basel, Switzerland. This article is an open access article distributed under the terms and conditions of the Creative Commons Attribution (CC BY) license (https://creativecommons.org/licenses/by/4.0/).