
Wetland Distribution Prediction Based on CA–Markov Model under Current Land Use and Protection Policy in Sanjiang Plain

Abstract
1. Introduction
2. Methodology
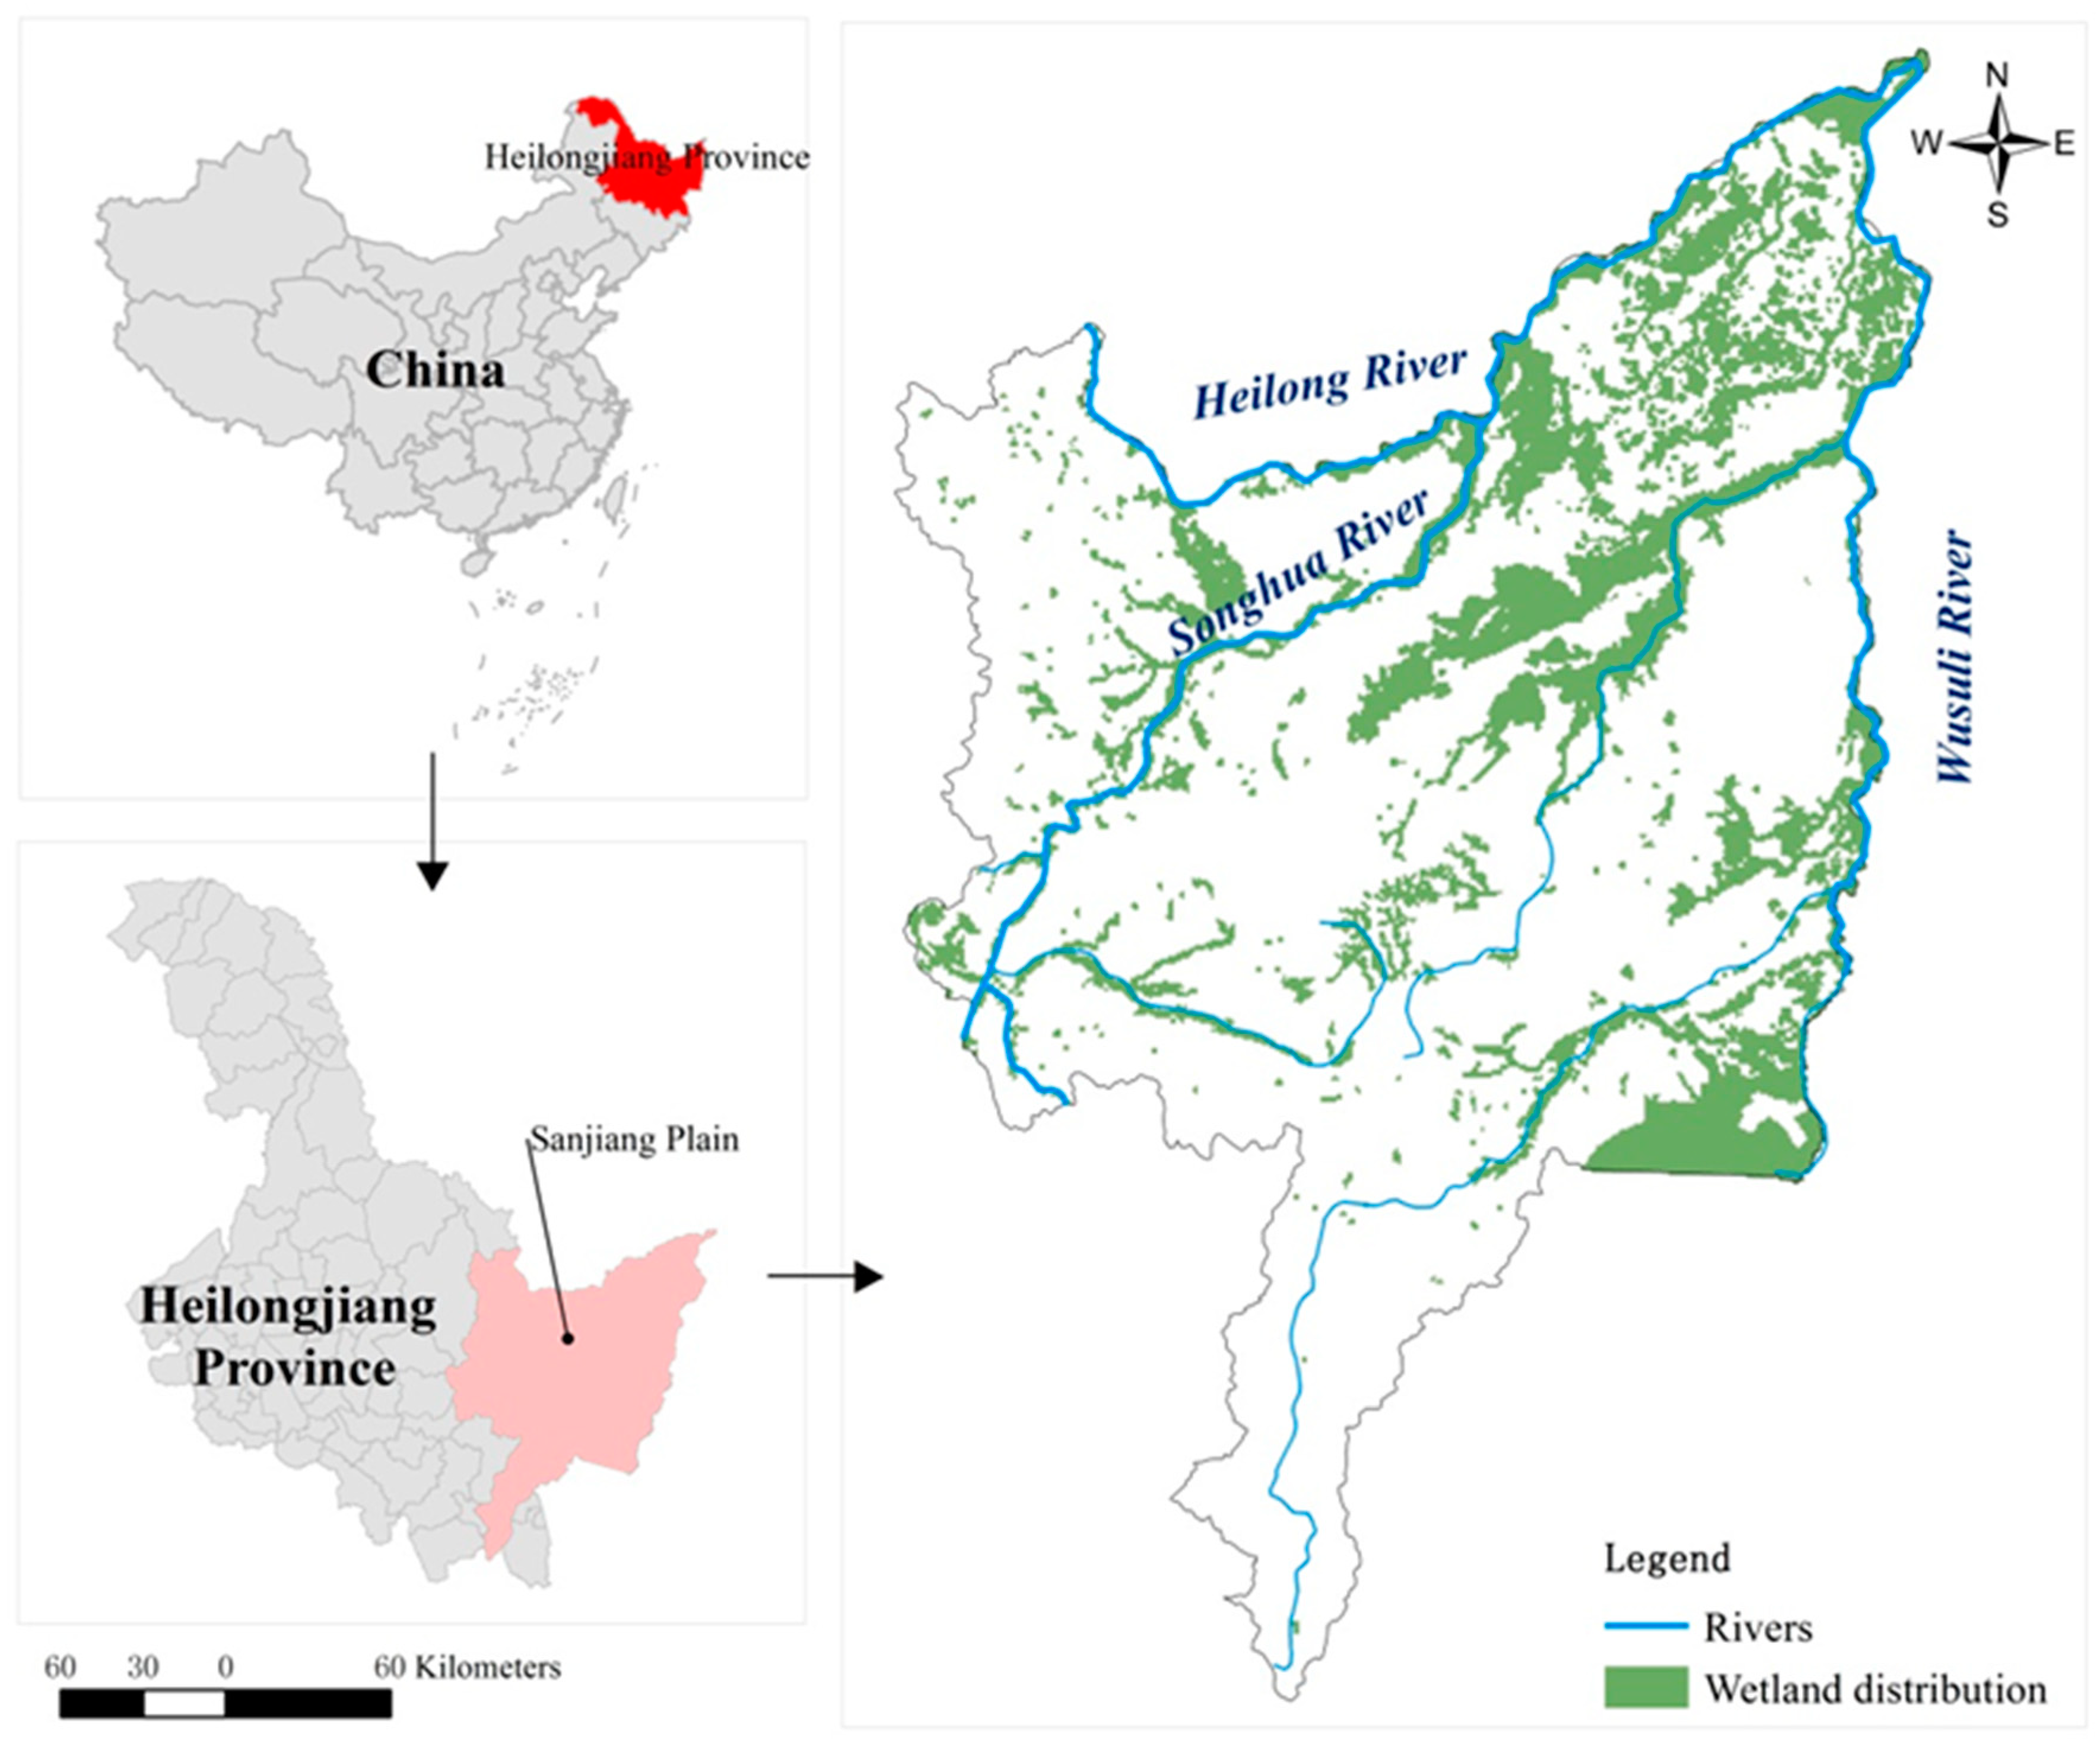
2.1. Study Site
2.2. Wetland Distribution Based on Remote Sensing Images
2.3. Spatio-Temporal Dynamics of Wetlands
2.4. Prediction of Wetland Changing Trend
2.5. Wetland Conservation Priority Analysis
2.6. Statistical Analysis and Software Used
3. Research Results
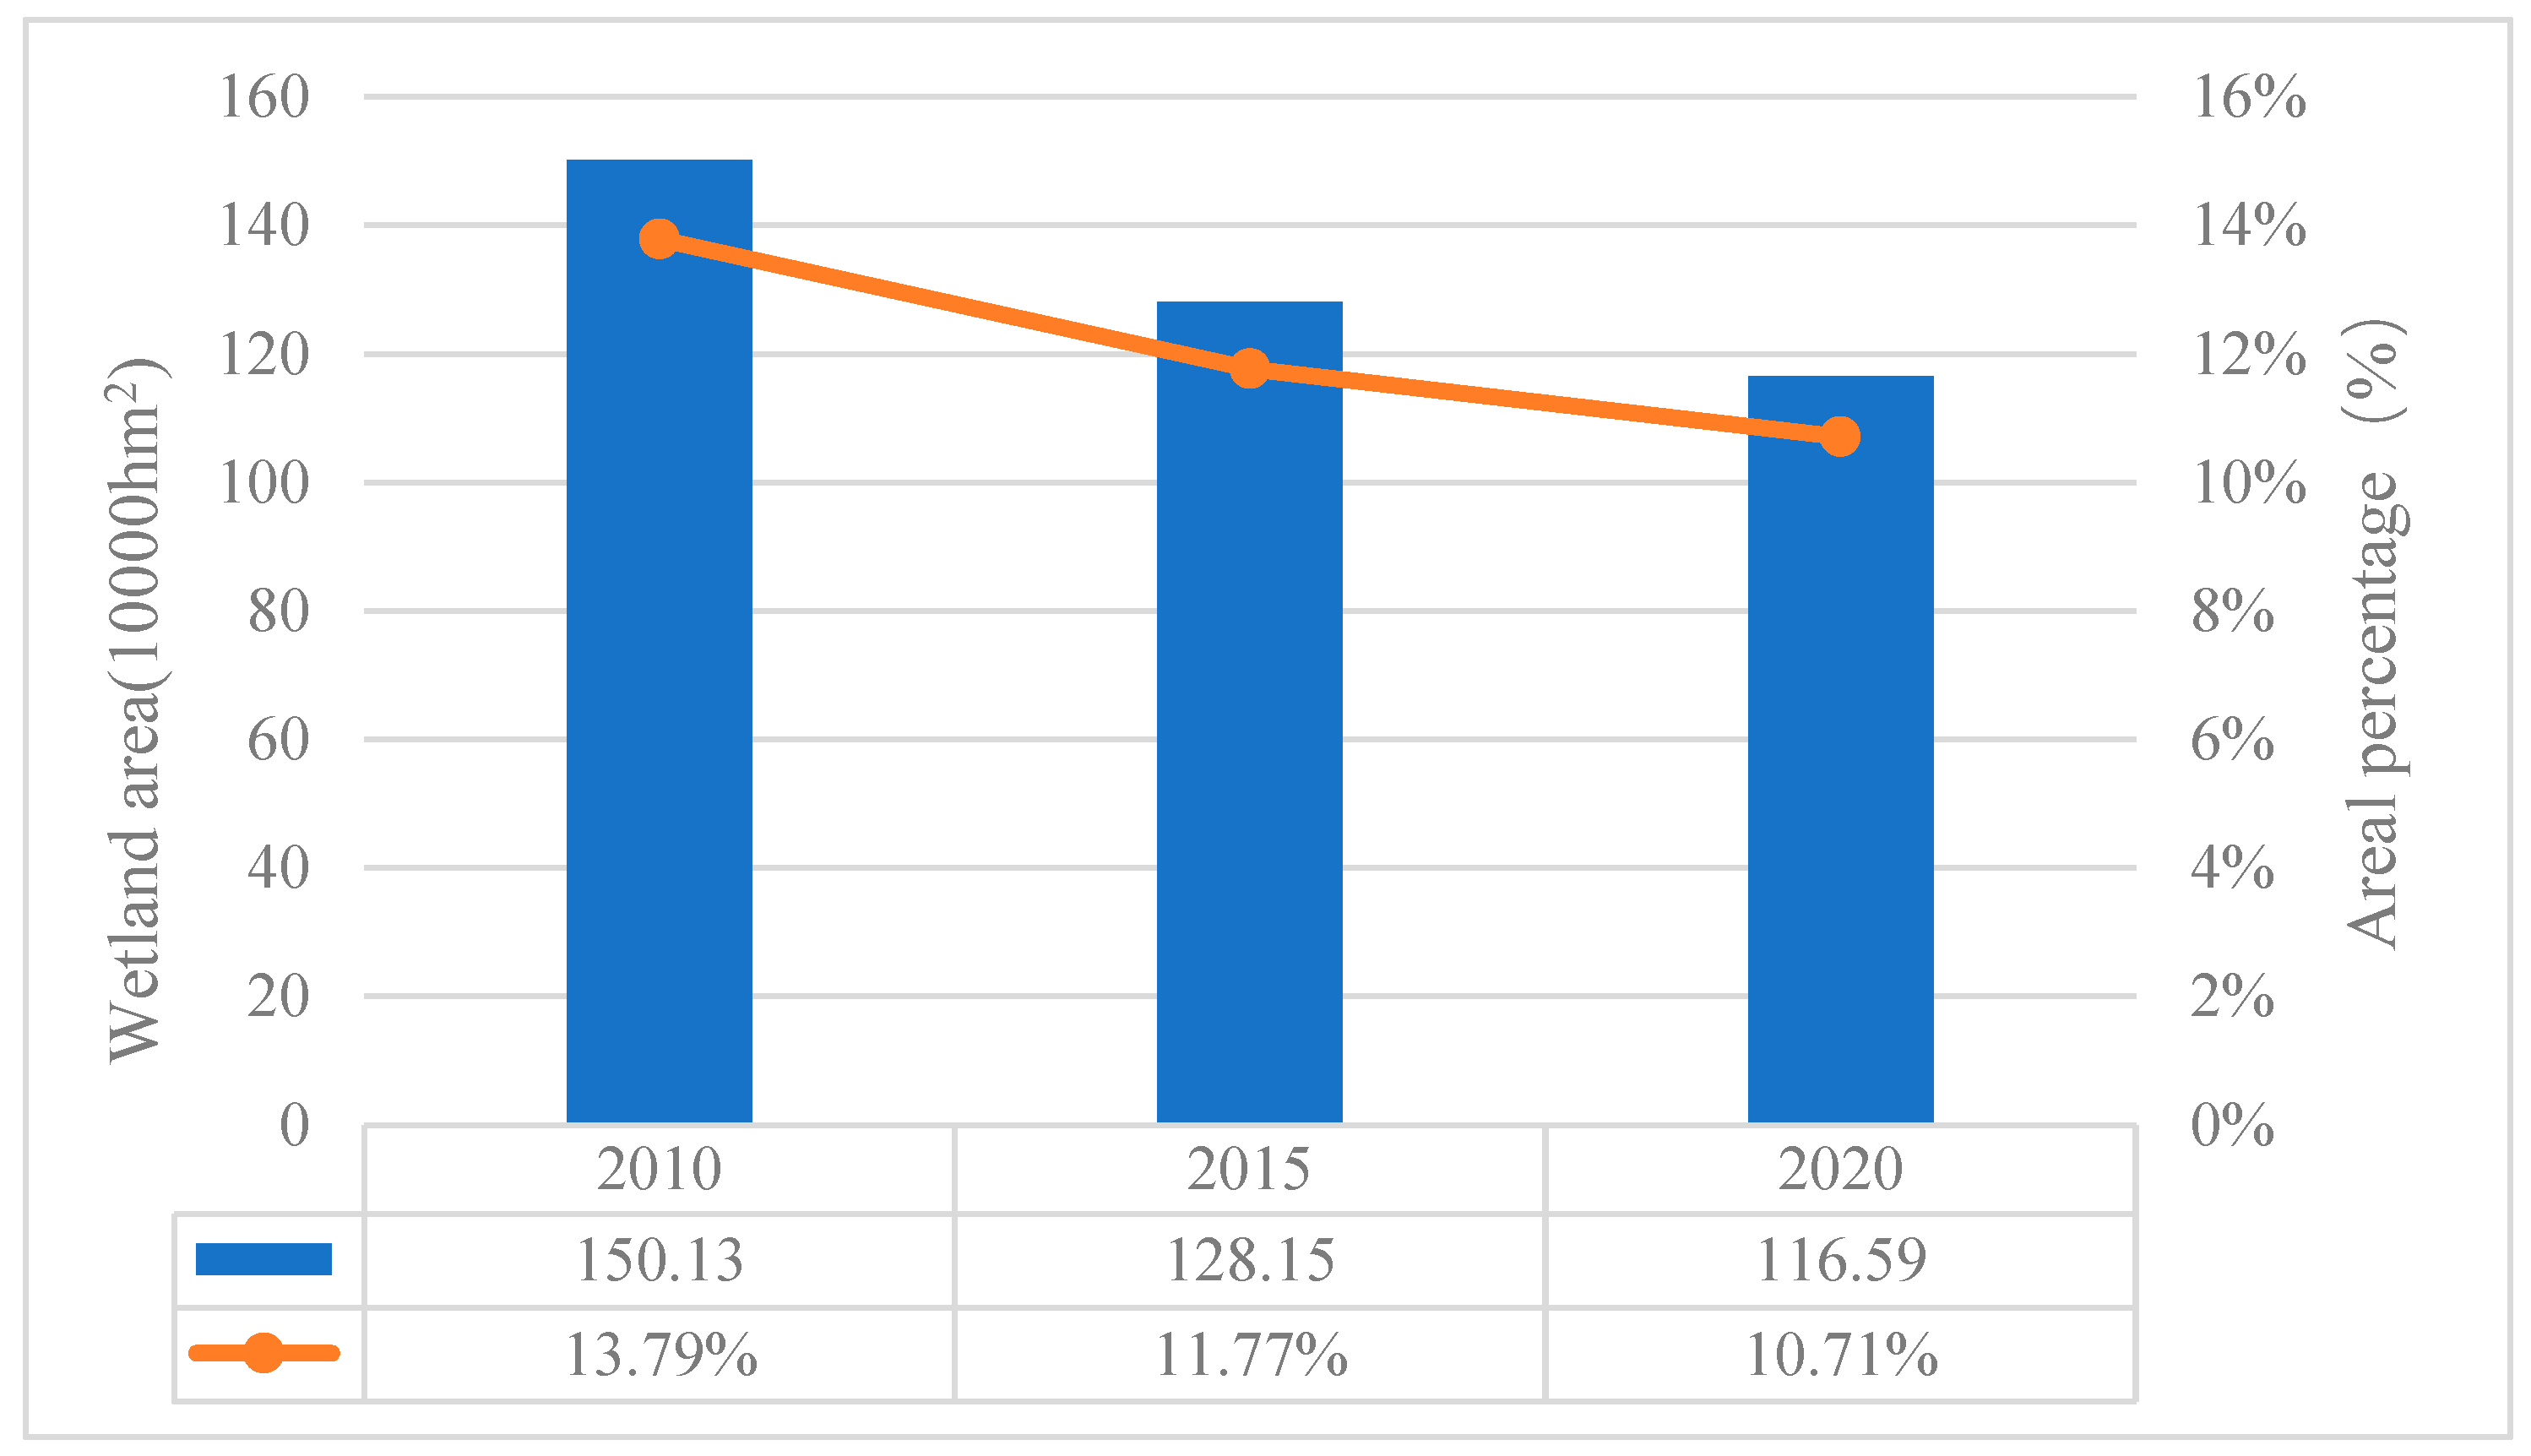
3.1. Wetland Distribution Based on Remote Sensing Images
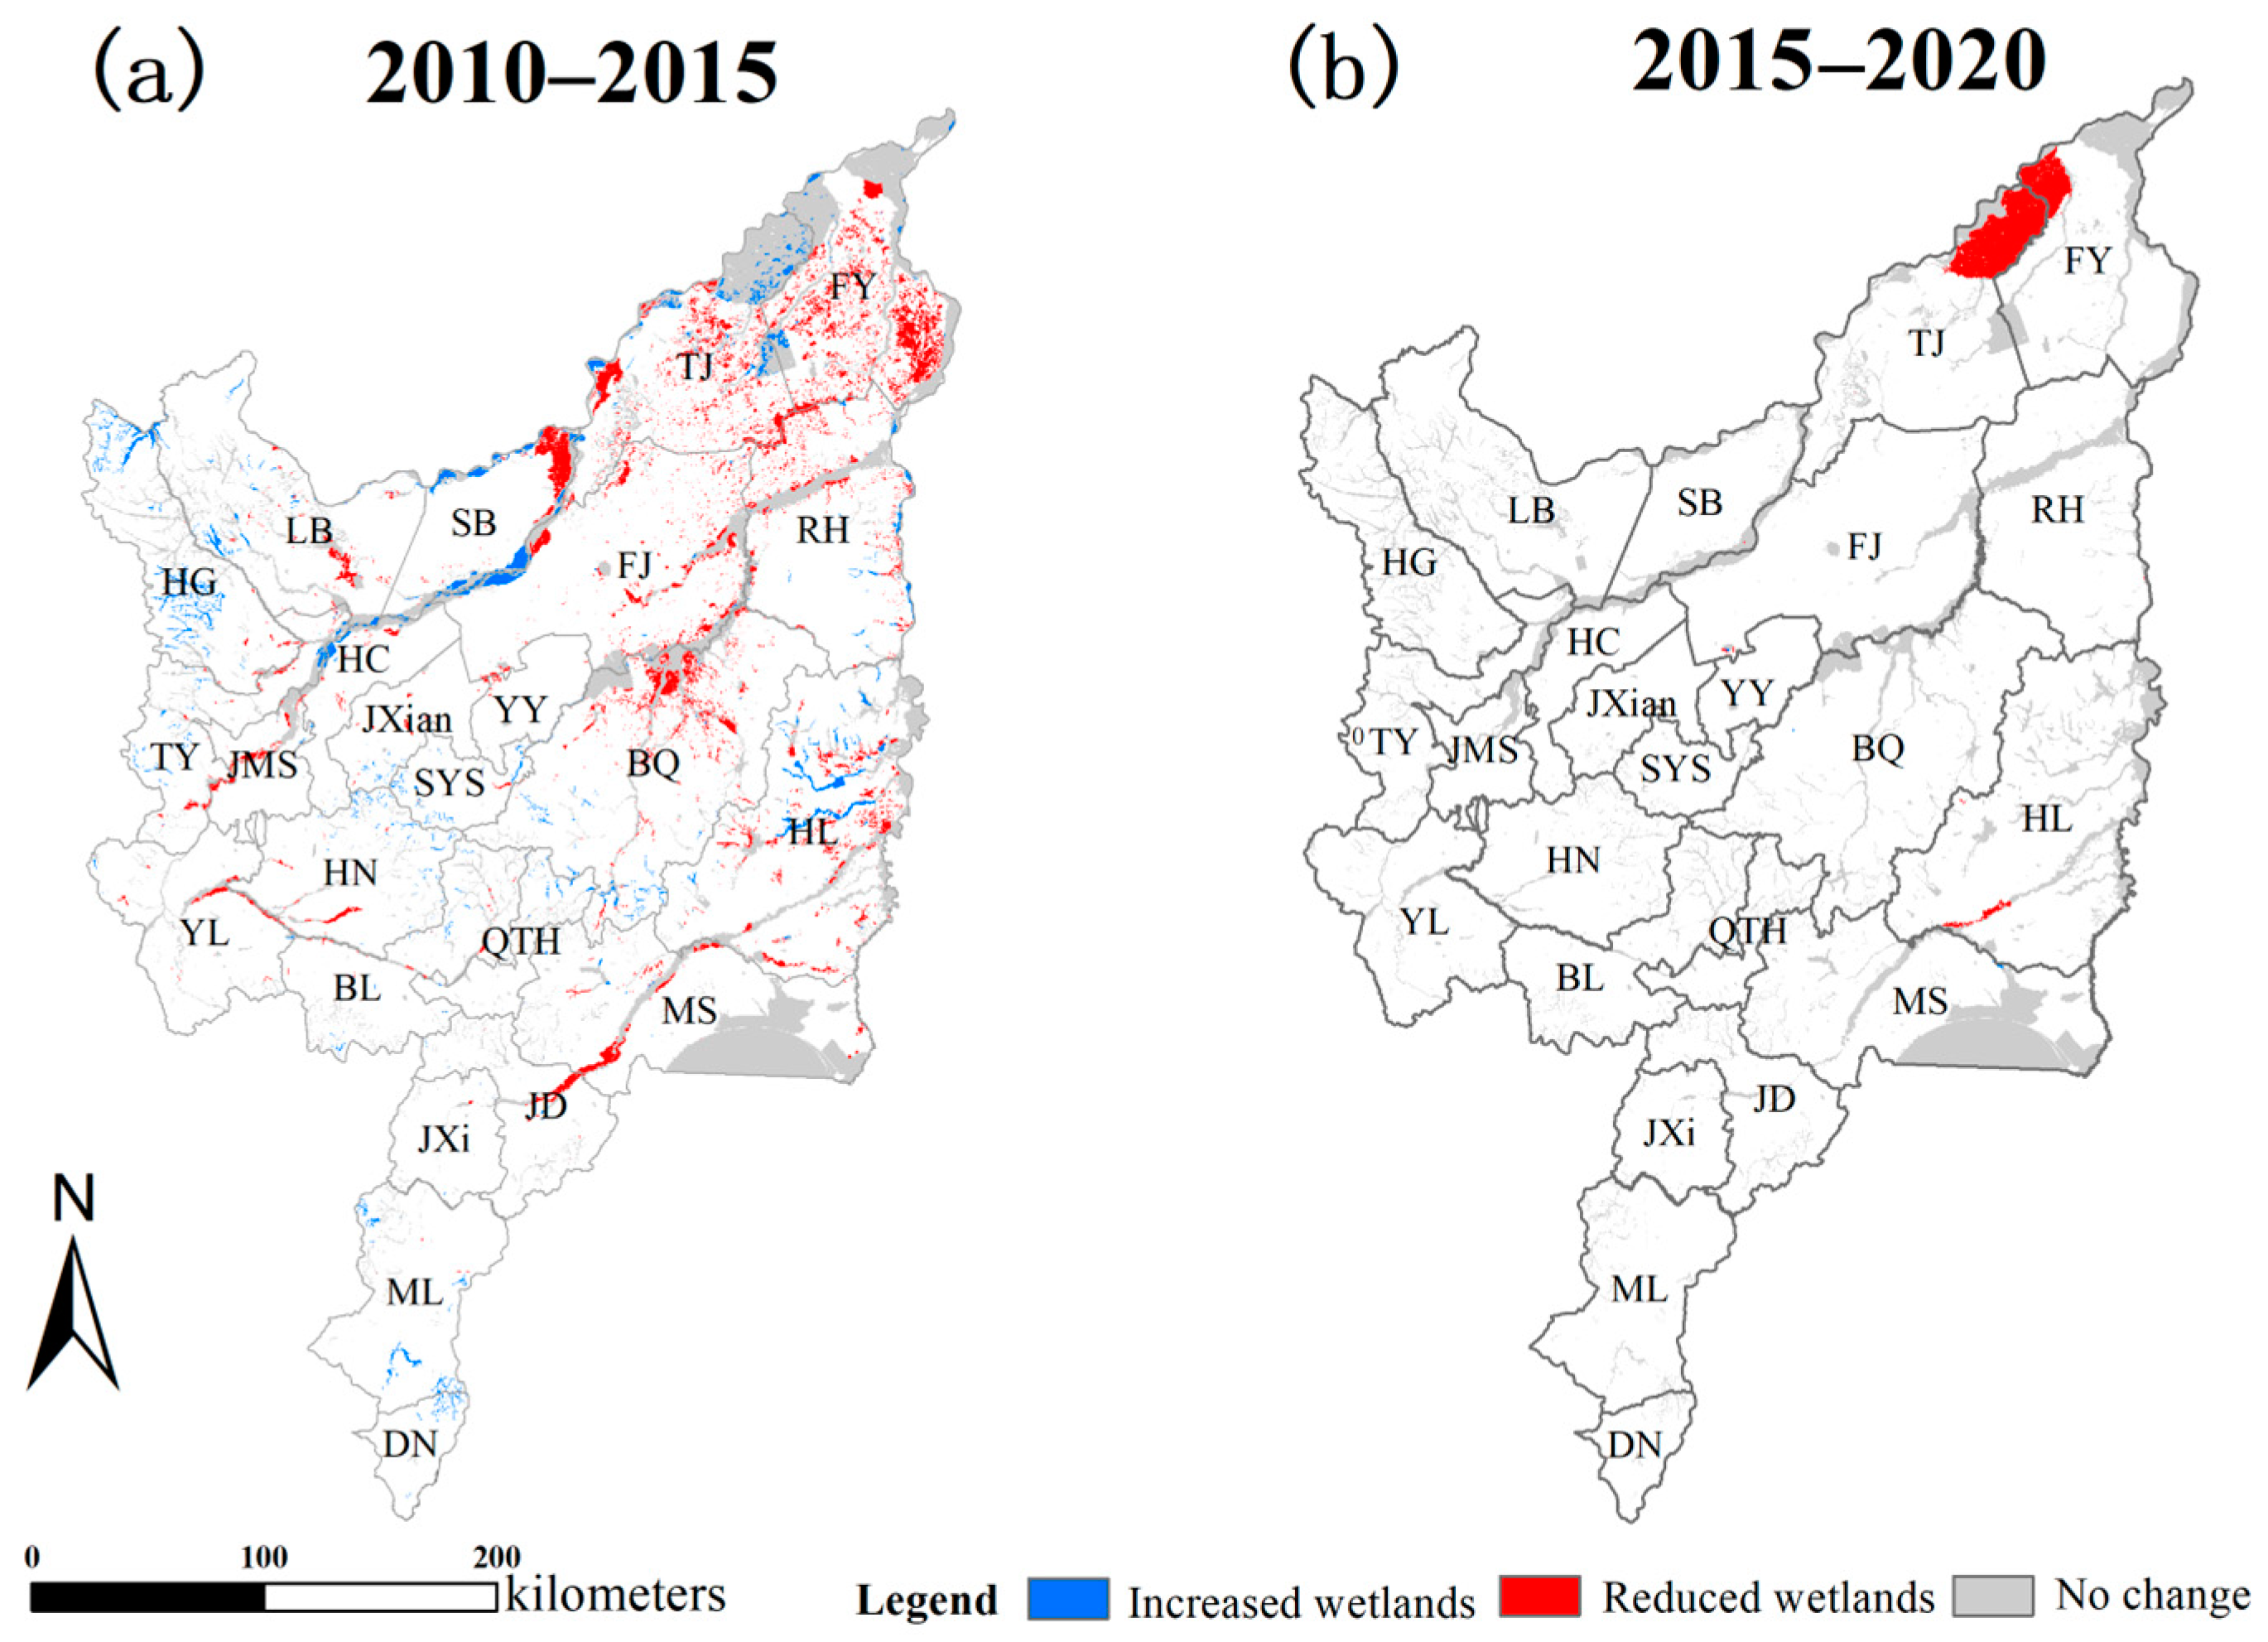
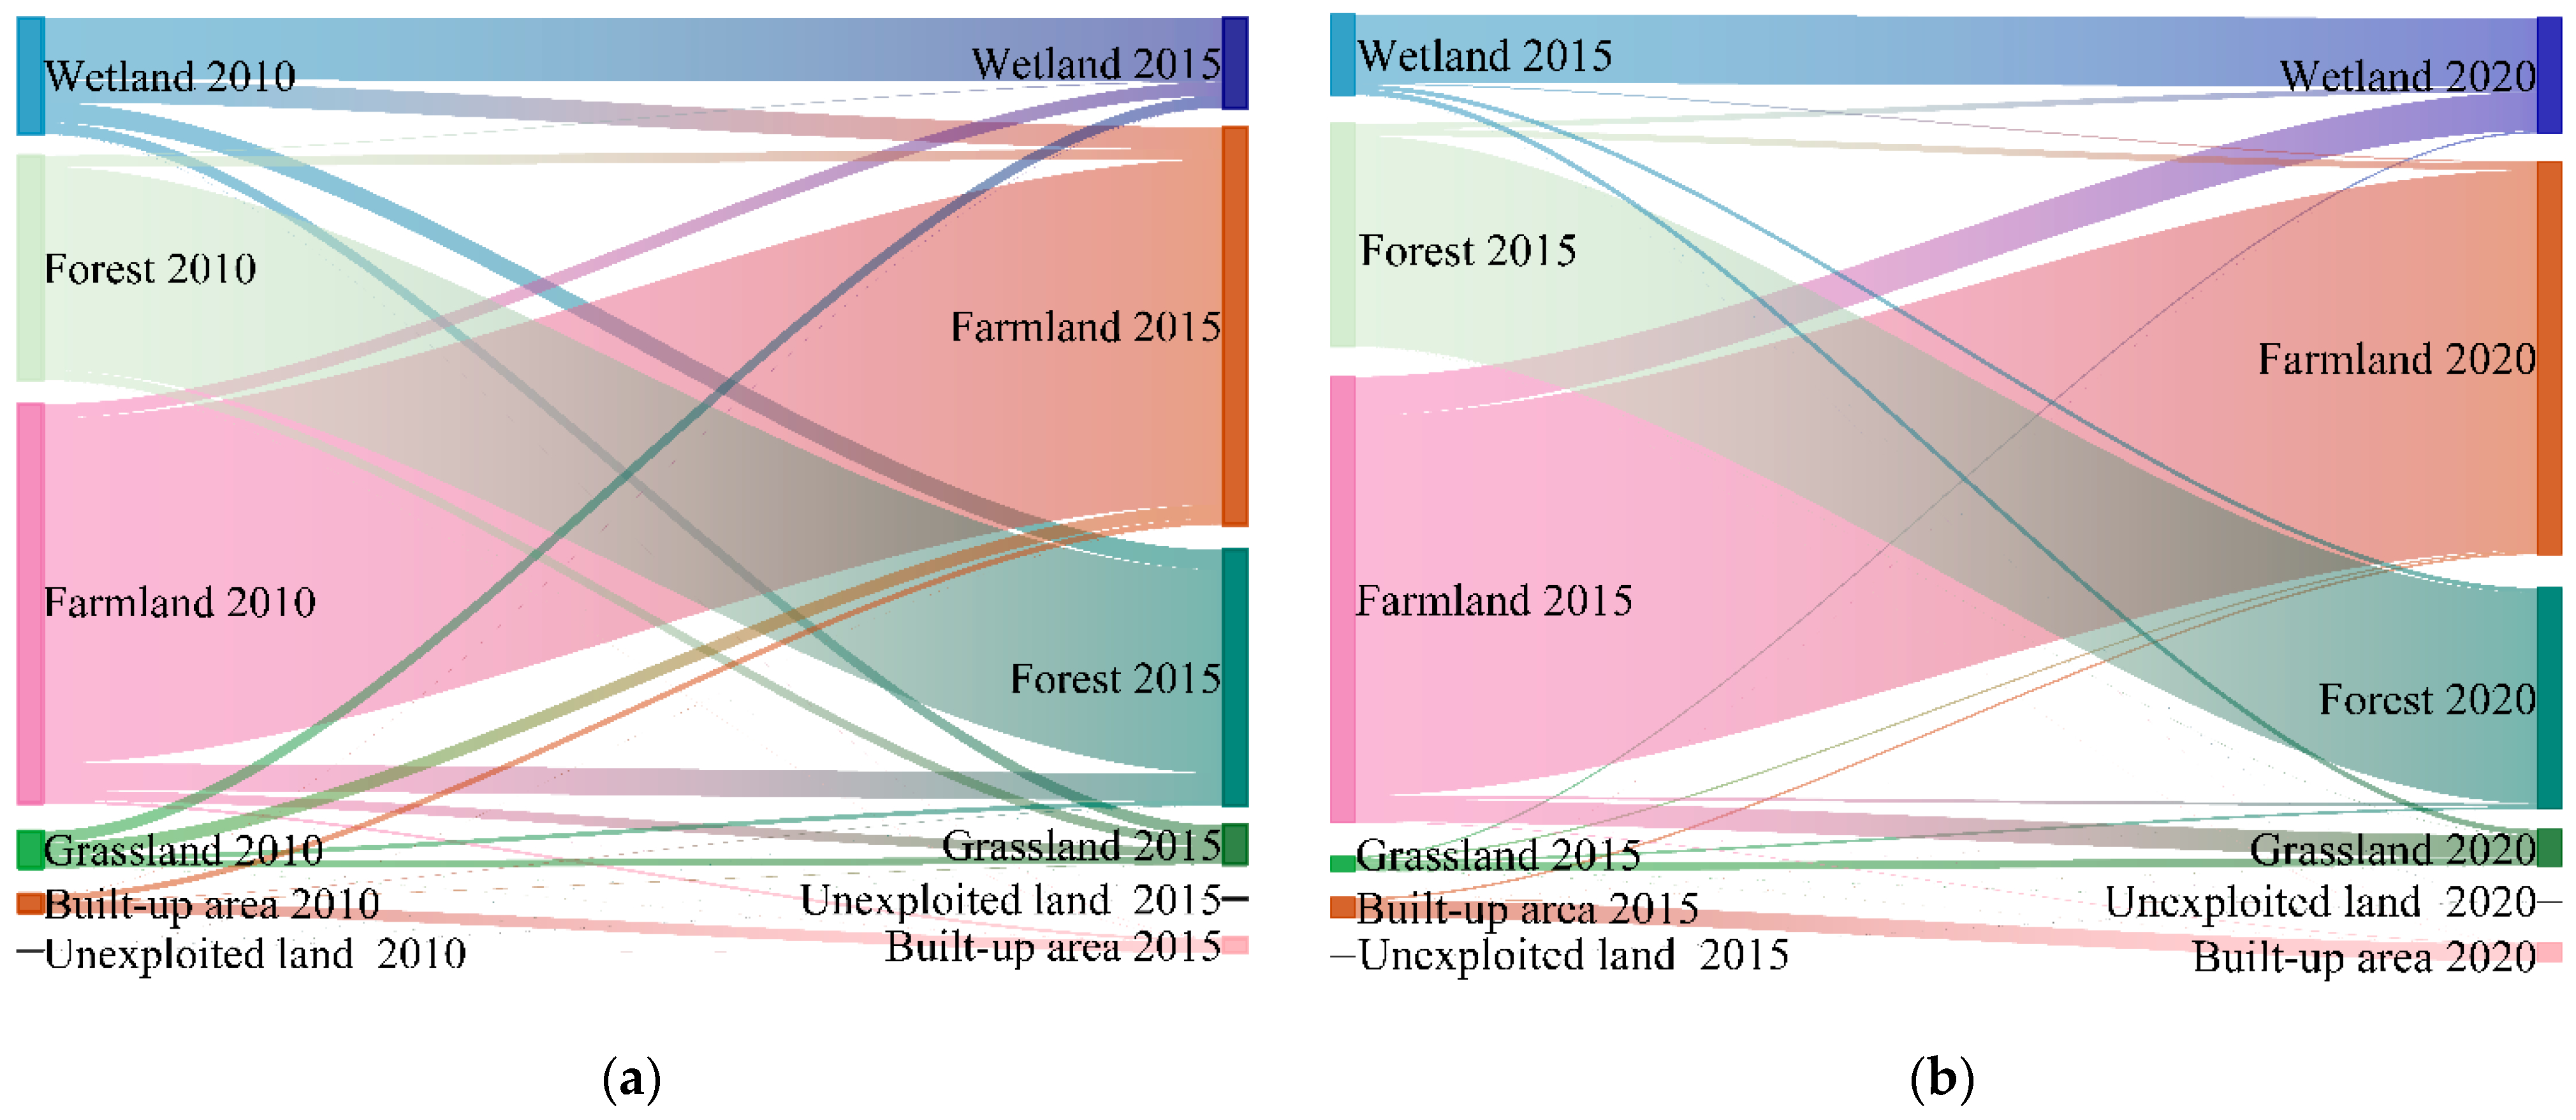
3.2. Spatio-Temporal Dynamics of Wetlands
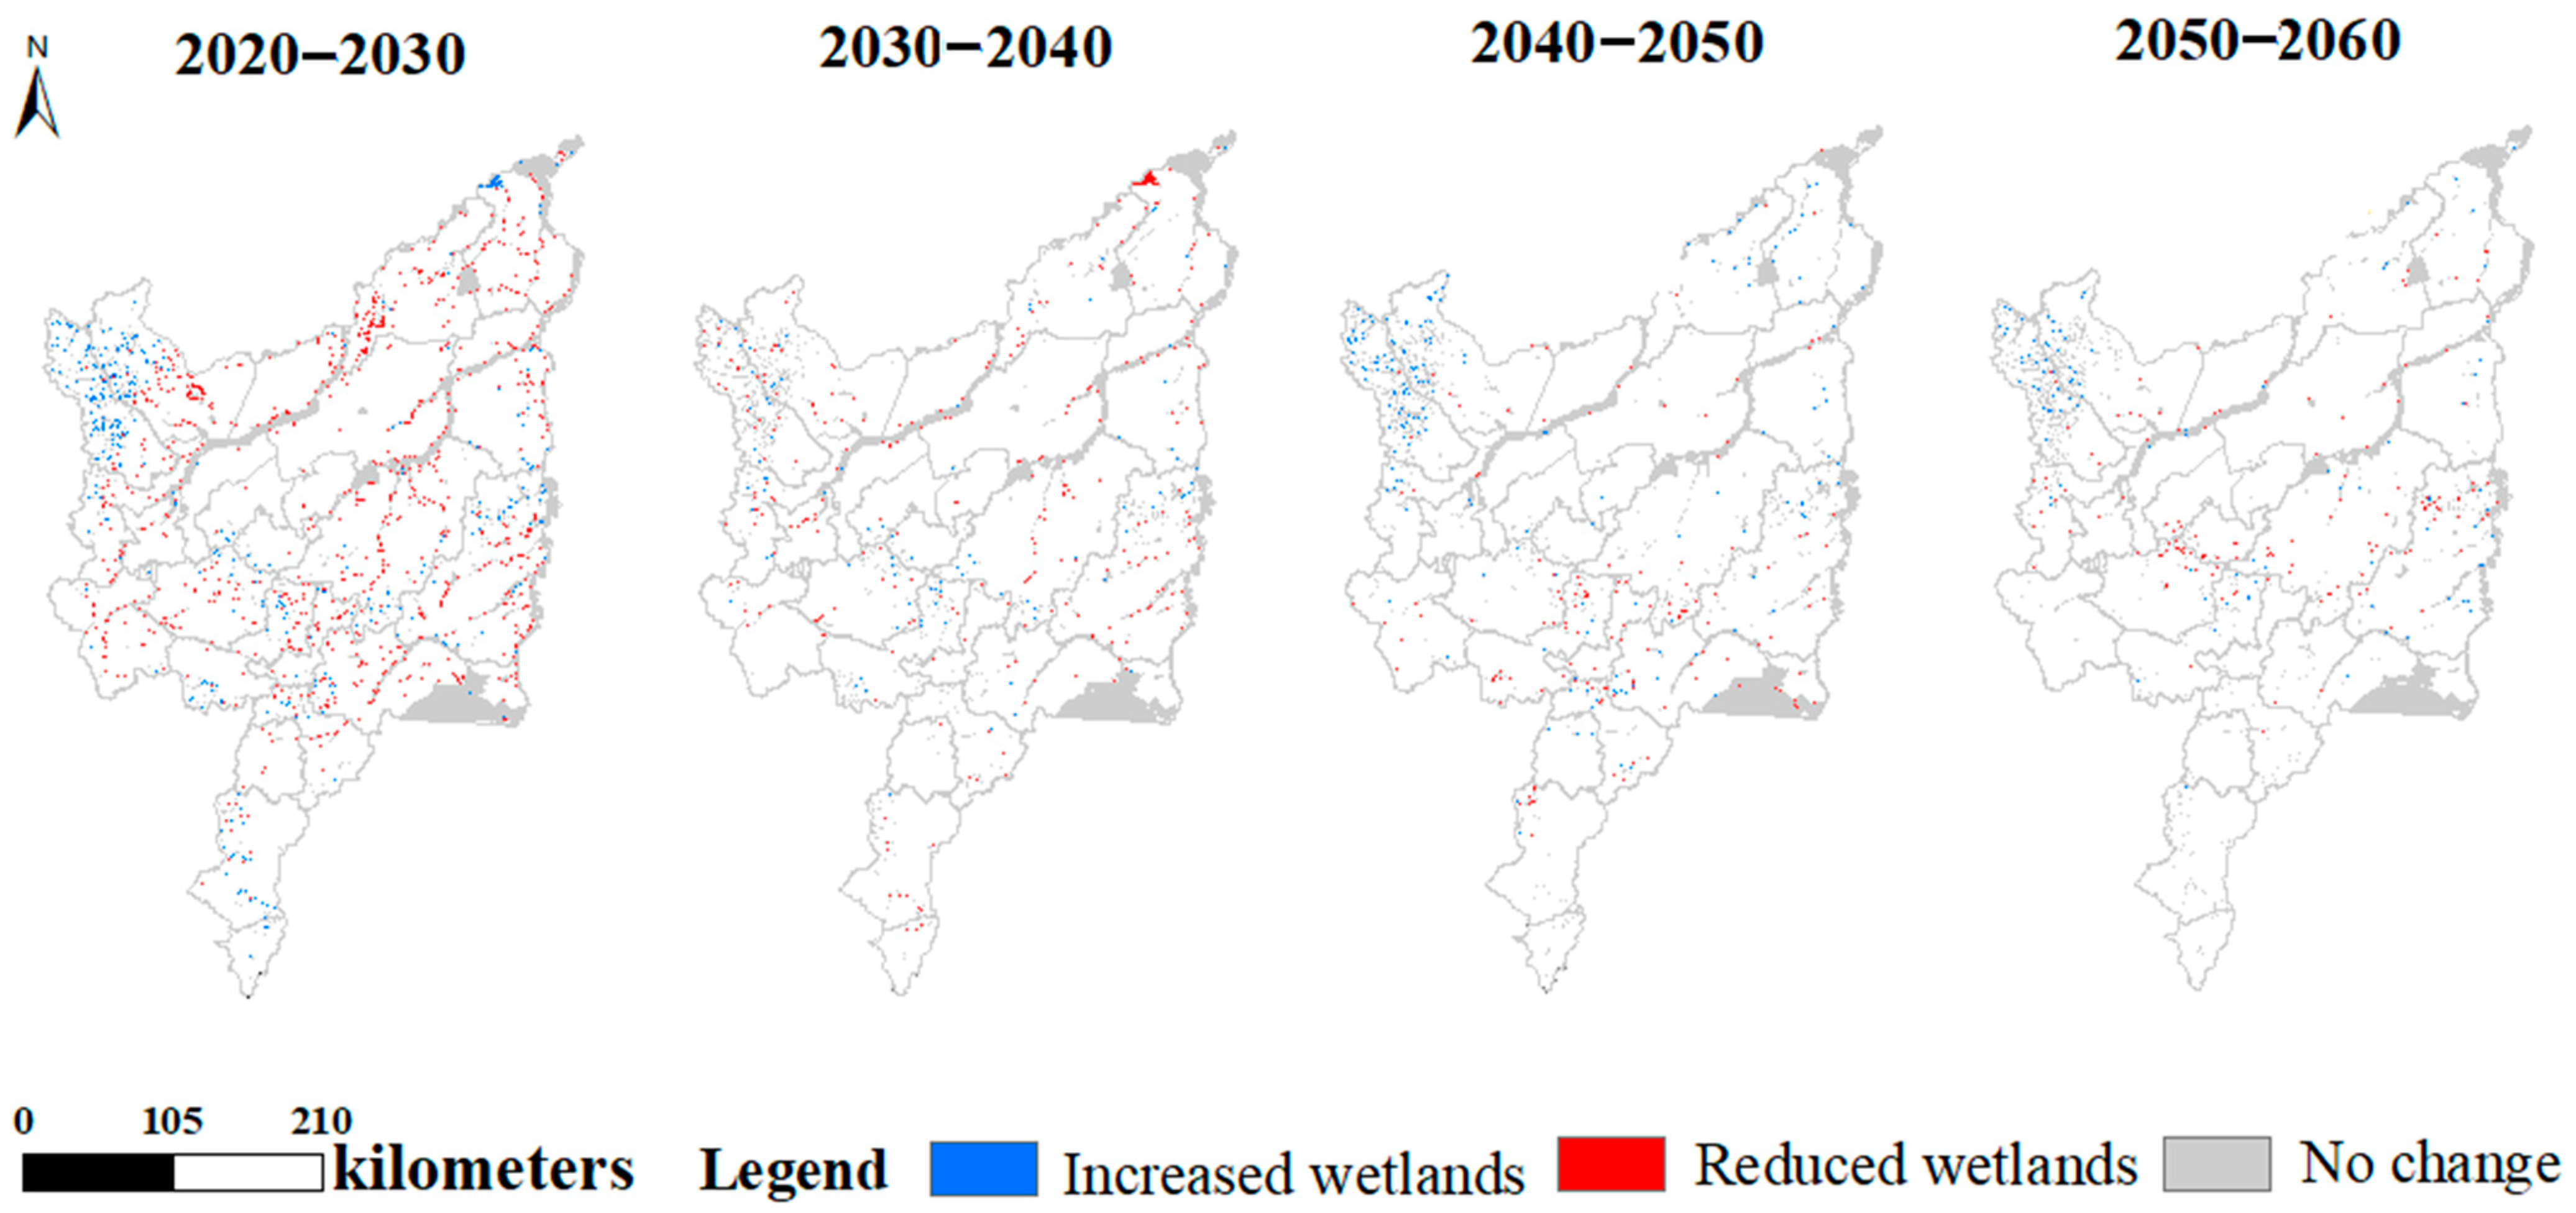
3.3. Prediction of Wetland Changing Trend
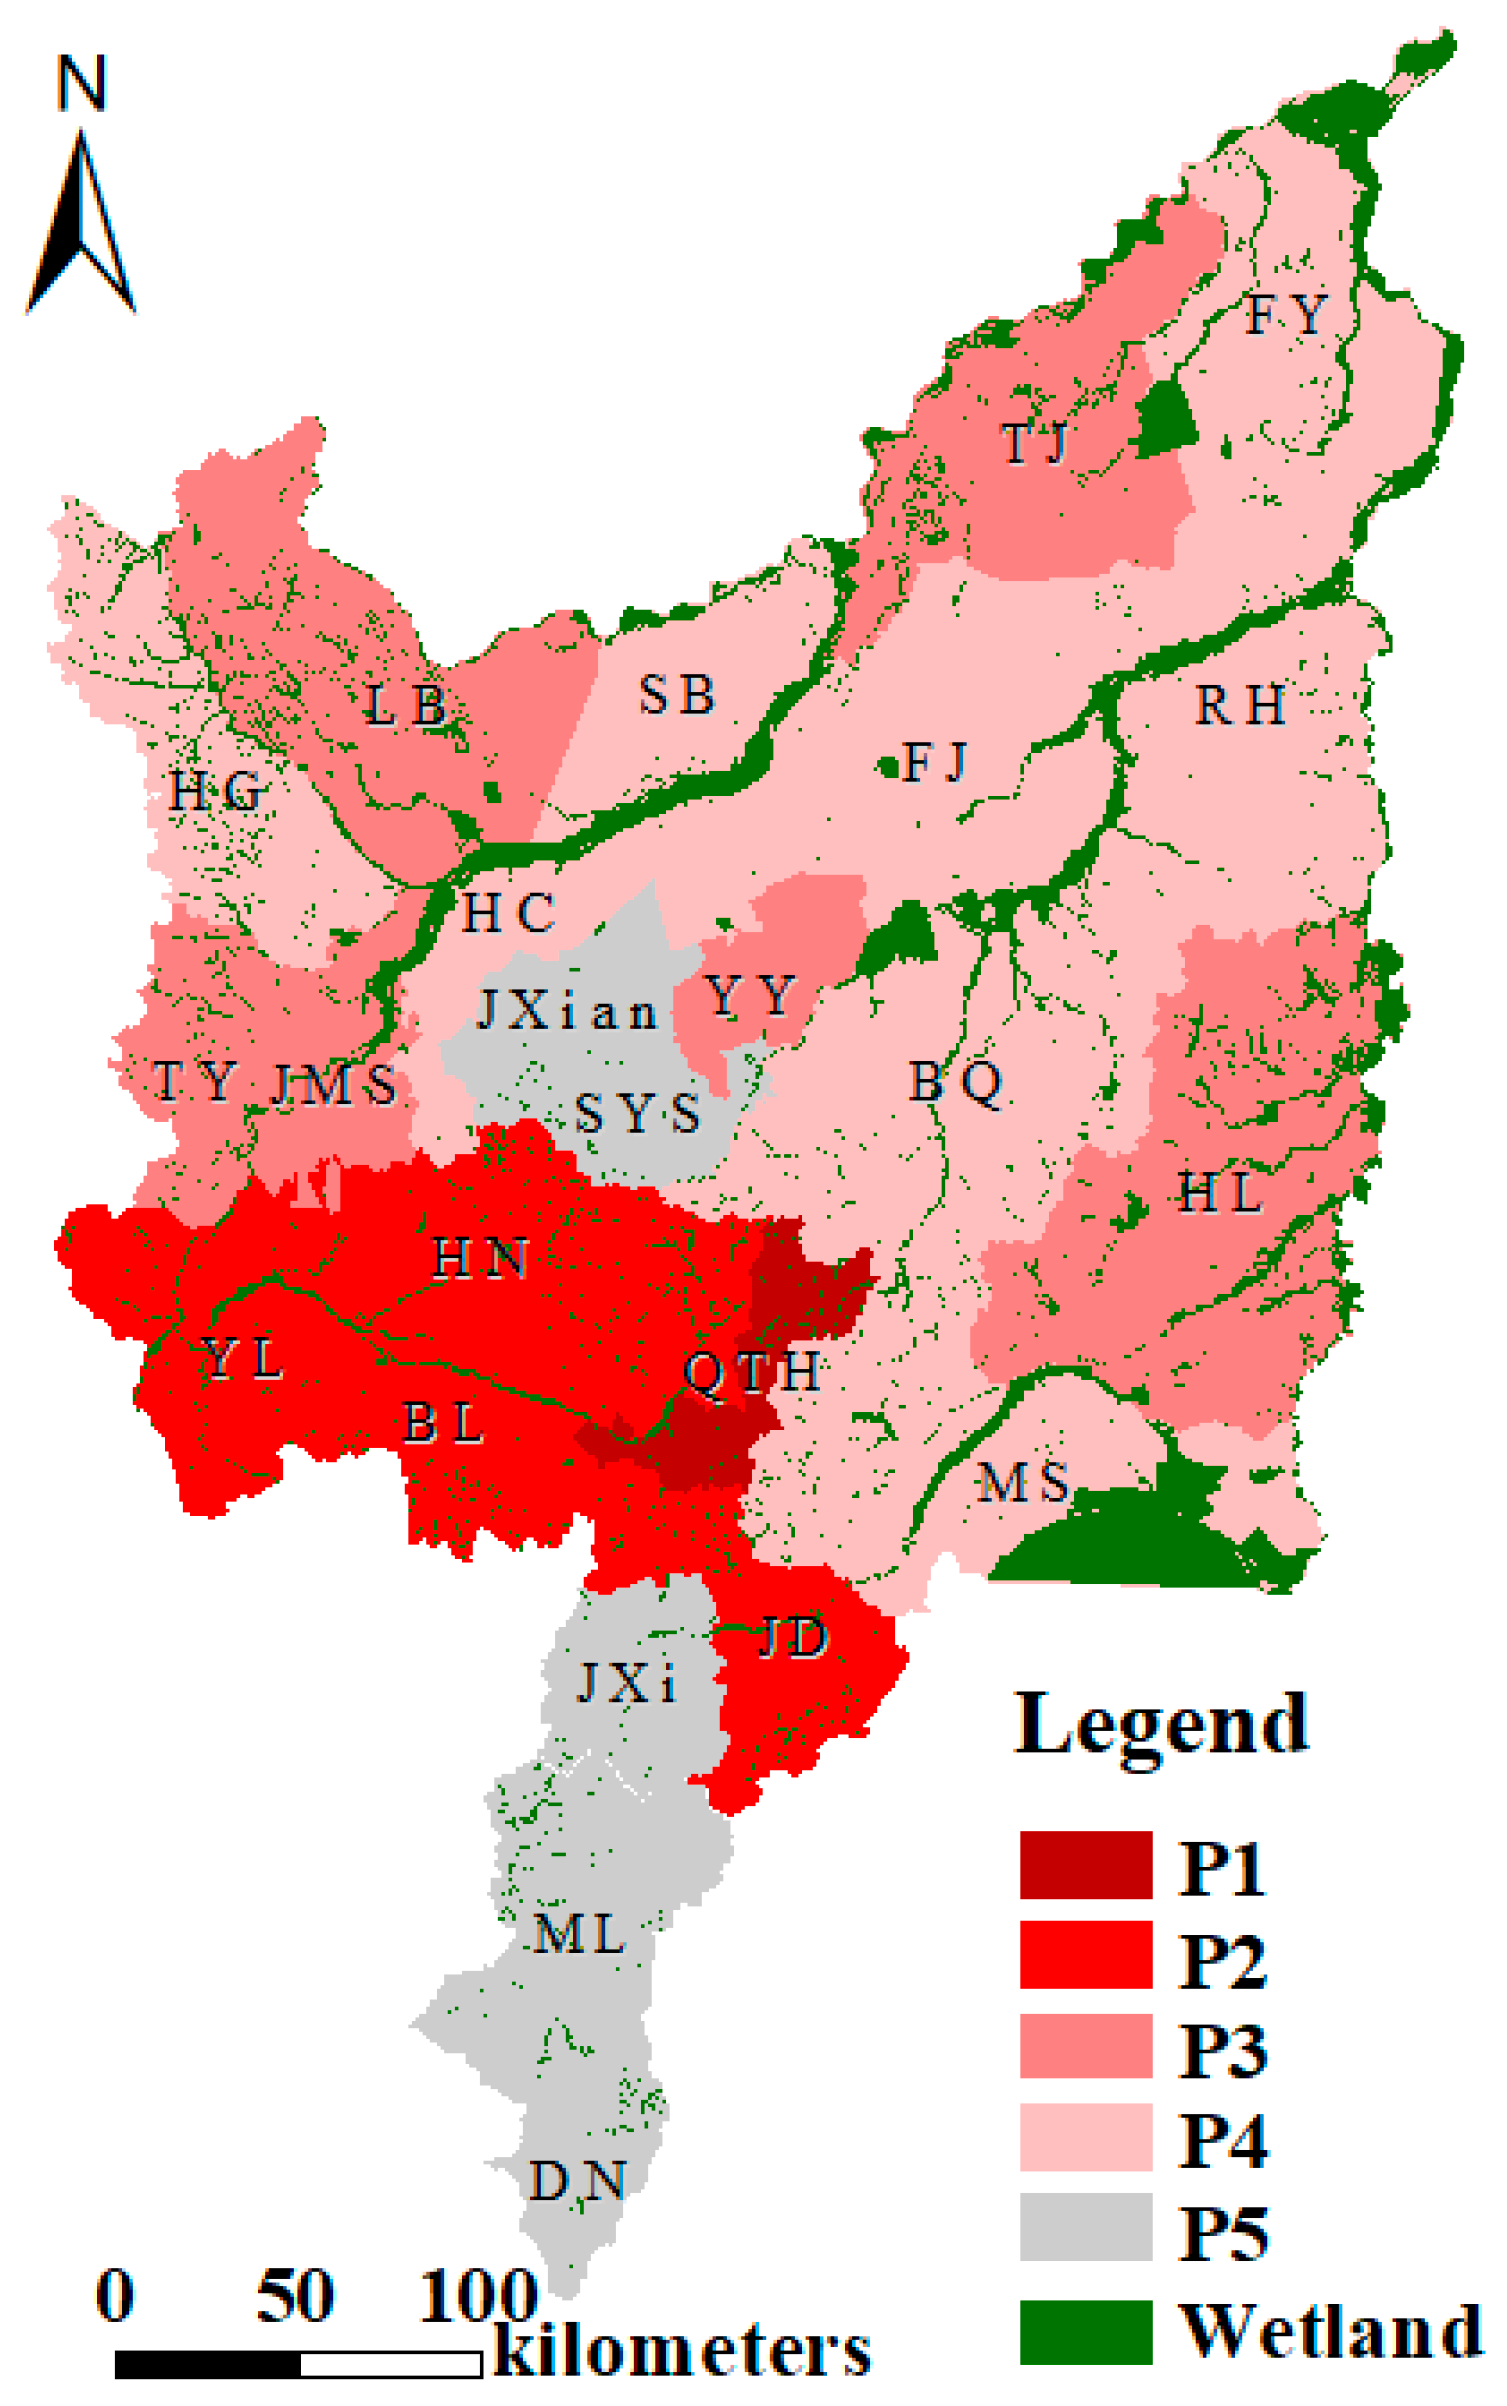
3.4. Wetland Conservation Priority Analysis
4. Discussion
Author Contributions
Funding
Institutional Review Board Statement
Informed Consent Statement
Data Availability Statement
Acknowledgments
Conflicts of Interest
References
- Yuan, J.; Shi, L.S.; Tang, X.P. A preliminary analysis of three mainstream wetland definitions in wetland conservation and management in China. Wetl. Sci. 2022, 20, 607–612. [Google Scholar]
- Wang, R.Q.; Zhang, M.X.; Wu, H.T.; Li, Y.H. Analysis on wetland definition and classification of the Wetland Conservation Law of the People’s Republic of China. Wetl. Sci. 2022, 20, 404–412. [Google Scholar]
- Laws, E.A.; Pei, L.X.; Ye, S.Y.; He, L.; Zhao, G.M.; Yuan, H.M. Wetland resources, development and protection in China and management recommendations. Geol. China 2023, 50, 459–478. [Google Scholar]
- Liang, F.Y.; Liang, C.; Li, X.W.; Bai, J.H.; Mu, Y.L. Simulated priority protection pattern for the wetlands in Songhua River basin based on systematic conservation planning. Wetl. Sci. 2022, 20, 56–64. [Google Scholar]
- Zhu, H.; Wu, H.T.; Xing, X.X.; Xie, T.; Song, C.C. Achievement of wetland protection and restoration and development strategies in China. Bull. Chin. Acad. Sci. 2023, 38, 365–375. [Google Scholar]
- Convention on Wetlands. Global Wetland Outlook: Special Edition 2021; Secretariat of the Convention on Wetlands: Gland, Switzerland, 2021. [Google Scholar]
- Ahmed, F. Cumulative Hydrologic Impact of Wetland Loss: Numerical Modeling Study of the Rideau River Watershed, Canada. J. Hydrol. Eng. 2014, 19, 593–606. [Google Scholar] [CrossRef]
- Quesnelle, P.E.; Fahrig, L.; Lindsay, K.E. Effects of habitat loss, habitat configuration and matrix composition on declining wetland species. Biol. Conserv. 2013, 160, 200–208. [Google Scholar] [CrossRef]
- Yang, W.; Liu, Y.; Ou, C.; Gabor, S. Examining water quality effects of riparian wetland loss and restoration scenarios in a southern ontario watershed. J. Environ. Manag. 2016, 174, 26–34. [Google Scholar] [CrossRef] [PubMed]
- Zhang, Z.; Hu, B.; Jiang, W.; Qiu, H. Identification and scenario prediction of degree of wetland damage in Guangxi based on the CA-Markov model. Ecol. Indic. 2021, 127, 107764. [Google Scholar] [CrossRef]
- Bansal, S.; Katyal, D.; Garg, J.K. A novel strategy for wetland area extraction using multispectral MODIS data. Remote Sens. Environ. 2017, 200, 183–205. [Google Scholar] [CrossRef]
- Behera, M.D.; Chitale, V.S.; Shaw, A.; Roy, P.S.; Murthy, M.S.R. Wetland monitoring, serving as an index of land use change—A study in Samaspur wetlands, Uttar Pradesh, India. J. Indian Soc. Remote Sens. 2012, 40, 287–297. [Google Scholar] [CrossRef]
- Maddheshiya, S.K.; Jha, M.; Tignath, S.; Singh, N. Hydrogeomorphic and spatio-temporal analysis of riverine wetlands in the interfluvial zone of Ganga and Sai Rivers, Uttar Pradesh, India. Wetlands 2023, 43, 2271–2452. [Google Scholar] [CrossRef]
- Mokarram, M.; Pham, T.M. Prediction of drought-driven land use/land cover changes in the Bakhtegan Lake watershed of Iran using Markov chain cellular automata model and remote sensing data. Nat. Hazards 2023, 116, 1291–1314. [Google Scholar] [CrossRef]
- Rahimi, L.; Malekmohammadi, B.; Yavari, A.R. Assessing and Modeling the Impacts of Wetland Land Cover Changes on Water Provision and Habitat Quality Ecosystem Services. Nat. Resour. Res. 2020, 29, 3701–3718. [Google Scholar] [CrossRef]
- Jing, Y.Q.; Zhang, F.; Zhang, Y. Change and prediction of the land use/cover in Ebinur Lake Wetland Nature Reserve based on CA-Markov model. Chin. J. Appl. Ecol. 2016, 27, 3649–3658. [Google Scholar]
- Zhu, C.J.; Tian, B.; Zhou, Y.X.; Fan, Z.Q. Wetland change analysis and forecasting in pudong new area using Markov and CLUE-S mode. J. Fudan Univ. Nat. Sci. 2015, 54, 431–438, 448. [Google Scholar]
- Tong, X.H.; Feng, Y.J. A review of assessment methods for cellular automata models of land-use changes and urban growth. Int. J. Geogr. Inf. Sci. 2019, 34, 866–898. [Google Scholar] [CrossRef]
- Beroho, M.; Briak, H.; Cherif, E.K.; Boulahfa, I.; Ouallali, A.; Mrabet, R.; Kebede, F.; Bernardino, A.; Aboumaria, K. Future scenarios of Land Use/Land Cover (LULC) based on a CA-Markov simulation model: Case of a mediterranean watershed in morocco. Remote Sens. 2023, 15, 1162. [Google Scholar] [CrossRef]
- Chen, R.T.; Li, B.Y.; Wang, Q.M.; Huang, X.L.; Zhan, S.C. Simulation and prediction of the use structure of Dalian coastal waters. Mar. Environ. Sci. 2022, 41, 676–682. [Google Scholar]
- Hao, L.; He, S.; Zhou, J.; Zhao, Q.; Lu, X. Prediction of the landscape pattern of the Yancheng Coastal Wetland, China, based on XGBoost and the MCE-CA-Markov model. Ecol. Indic. 2022, 145, 109735. [Google Scholar] [CrossRef]
- Yan, D.; Li, J.; Xie, S.; Liu, Y.; Sheng, Y.; Luan, Z. Examining the expansion of Spartina alterniflora in coastal wetlands using an MCE-CA-Markov model. Front. Mar. Sci. 2022, 9, 964172. [Google Scholar] [CrossRef]
- Zhang, C.H.; Wang, Z.M.; Song, K.S.; Zhang, B.; Liu, D.W. The Markov process for the forecast of land use dynamic changes in Sanjiang Plain. Remote Sens. Technol. Appl. 2009, 24, 210–216. [Google Scholar]
- Wan, H.L.; Wang, S.G.; Chen, B.; Xia, C.Y.; Su, R. Ecological risk assessment and spatial threshold analysis of wetlands in the Sanjiang Plain. Acta Ecol. Sin. 2022, 42, 6595–6606. [Google Scholar]
- Zhang, Y.L.; Wu, X.L. Urban green development level and spatio-temporal difference of cities in the National Key Ecological Function Zones and adjacent non-ecological function zones. Acta Ecol. Sin. 2022, 42, 5761–5777. [Google Scholar]
- Xu, X.; Liu, X.G.; Wang, Q.; Song, C.C.; Wang, H.T. Characteristics of important activity zones of young oriental white stork in Sanjiang Plain. Wetl. Sci. 2021, 19, 659–666. [Google Scholar]
- Li, Y.; Zhao, Y.Z.; Zhuo, Z.Q.; Cao, M.; Huang, Y.F. Analysis of ecological problems and its conservation-restoration strategy of mountains, rivers, forests, farmlands, lakes and grasslands in the Xiaoxing ‘an Mountains-Sanjiang Plain. Ecol. Sci. 2023, 42, 95–104. [Google Scholar]
- Qiao, T.H.; Song, C.C. Meteorological and radiant dataset observed by Sanjiang Plain experimental station of wetland ecology, Chinese academy of sciences during 2009–2018. China Sci. Data 2020, 5, 123–131. [Google Scholar]
- Qiao, Y.J.; Zhang, H.; Han, X.Y.; Liu, Q.B.; Liu, K. Exploring drivers of water conservation function variation in Heilongjiang Province from a geospatial perspective. Acta Ecol. Sin. 2023, 43, 2711–2721. [Google Scholar]
- Qu, Y.; Zeng, X.; Luo, C.; Zhang, H.; Ni, H. Prediction of wetland biodiversity pattern under the current land-use mode and wetland sustainable management in Sanjiang Plain, China. Ecol. Indic. 2023, 147, 109990. [Google Scholar] [CrossRef]
- Chen, Y.L.; Li, S.H.; Shi, B.; Shi, Y. The Definitive Guide to ArcGIS Development; Publishing House of Electronics Industry: Beijing, China, 2015. [Google Scholar]
- Liu, Y.; Yang, P.; Zhang, S.; Wang, W. Dynamic identification and health assessment of wetlands in the middle reaches of the Yangtze River basin under changing environment. J. Clean. Prod. 2022, 345, 131105. [Google Scholar] [CrossRef]
- Xing, L.; Niu, Z.; Jiao, C.; Zhang, J.; Han, S.; Cheng, G.; Wu, J. A novel workflow for seasonal wetland identification using bi-weekly multiple remote sensing data. Remote Sens. 2022, 14, 1037. [Google Scholar] [CrossRef]
- TD/T1016-2017; The People’s Republic of China Land and Resources Industry Standard. Land Use Database Standards. Standards Press of China: Beijing, China, 2017.
- Zhou, Y.; Zhang, R.; Wang, S.; Wang, F. Feature selection method based on high-resolution remote sensing images and the effect of sensitive features on classification accuracy. Sensors 2018, 18, 2013. [Google Scholar] [CrossRef] [PubMed]
- Zhu, H.Y.; Li, X.B. Discussion on regional land use change index model. Acta Geogr. Sin. 2003, 58, 643–650. [Google Scholar]
- Wai-Ki, C.; Huang, X.M.; Michael, K.; Siu, T.K. Markov Chains: Models, Algorithms and Applications; International Series in Operations Research & Management Science; Springer: Berlin/Heidelberg, Germany, 2013. [Google Scholar]
- dos Santos, W.P.; Acuña-Guzman, S.F.; de Oliveira, P.T.S.; Beniaich, A.; Cardoso, D.P.; Silva, M.L.N.; Curi, N.; Avanzi, J.C. CA-Markov prediction modeling for the assessment of land use/land cover change in two sub-basins of the Tocantins-Araguaia River Basin. Environ. Monit. Assess. 2024, 196, 499. [Google Scholar] [CrossRef] [PubMed]
- Amir Siddique, M.; Wang, Y.; Xu, N.; Ullah, N.; Zeng, P. The spatiotemporal implications of urbanization for urban heat islands in Beijing: A predictive approach based on CA–Markov modeling (2004–2050). Remote Sens. 2021, 13, 4697. [Google Scholar] [CrossRef]
- Hu, X.; Li, X.; Lu, L. Modeling the land use change in an arid oasis constrained by water resources and environmental policy change using cellular automata models. Sustainability 2018, 10, 2878. [Google Scholar] [CrossRef]
- Koko, A.F.; Yue, W.; Abubakar, G.A.; Hamed, R.; Alabsi, A.A.N. Monitoring and predicting spatio-temporal land Use/land cover changes in zaria city, Nigeria, through an integrated cellular automata and Markov chain model (CA-Markov). Sustainability 2020, 12, 10452. [Google Scholar] [CrossRef]
- Liu, Y. Study on Climatic and Hydrological Effects and Scenarios Simulation of Spatio-Temporal Change of Wetlands in Western Jilin Province. Ph.D. Thesis, Northeast Normal University, Changchun, China, 2015. [Google Scholar]
- Qu, Y.; Sun, G.; Luo, C.; Zeng, X.; Zhang, H.; Murray, N.J.; Xu, N. Identifying restoration priorities for wetlands based on historical distributions of biodiversity features and restoration suitability. J. Environ. Manag. 2019, 231, 1222–1231. [Google Scholar] [CrossRef] [PubMed]
- Delaney, T.A. Benefits to downstream flood attenuation and water quality as a result of constructed wetlands in agricultural landscapes. J. Soil Water Conserv. 1995, 50, 620–626. [Google Scholar]
- Liu, D.W. Spatio-Temporal Characteristics and Environmental Effects of Land Use/Cover Change in Sanjiang Plain in the Past 50 Years. Ph.D. Thesis, Jilin University, Changchun, China, 2006. (In Chinese). [Google Scholar]
- Liu, J.P.; Zhao, D.D.; Tian, X.Z. Dynamic change and driving force of land use landscape pattern in Sanjiang Plain from 1954 to 2010. Acta Ecol. Sin. 2014, 34, 3234–3244. [Google Scholar]
- Liu, Z.G.; Wang, Q.; Peng, A.J.; Yang, F. Conservation effect analysis of wetland nature reserve based on PSM and DID method: A case study of Sanjiang and Naolihe National Nature Reserve in Heilongjiang Province. J. Northwestern Univ. (Nat. Sci. Ed.) 2019, 49, 54–61. [Google Scholar]
- Cui, X.B.; Liu, M.H.; Ma, Y.K. Benefit analysis of the project of returning farmland to moisture in Naoli River National Nature Reserve of Heilongjiang Province. Heilongjiang Sci. 2016, 7, 153–155. [Google Scholar]
- Wang, J.; Tang, Y.Y. The deficiency and remedy of the Basic Farmland Protection Regulation under the food security goal. China Land Sci. 2019, 37, 43–50. [Google Scholar]
- Palmate, S.S.; Wagner, P.D.; Fohrer, N.; Pandey, A. Assessment of uncertainties in modelling land use change with an integrated cellular automata-Markov chain model. Environ. Model. Assess. 2022, 27, 275–293. [Google Scholar] [CrossRef]
- Qu, Y.; Zheng, Y.; Gong, P.; Shi, J.; Li, L.; Wang, S.; Luo, C.; Zhang, H.; Xu, L. Estimation of wetland biodiversity based on the hydrological patterns and connectivity and its potential application in change detection and monitoring: A case study of the Sanjiang Plain, China. Sci. Total Environ. 2022, 805, 150291. [Google Scholar] [CrossRef] [PubMed]
- Li, Y.A.; Duo, L.H.; Zhang, M. Evolution and prediction of land use pattern and habitat quality based on CA-Markov and INVEST model-a case study of Nanchang city in Jiangxi Province. Res. Soil Water Conserv. 2022, 29, 345–354. [Google Scholar]
- Xie, L.L.; Xu, J.L.; Zang, J.M.; Huang, T.N. Simulation and prediction of land use change in Guangxi based on Markov-FLUS model. Res. Soil Water Conserv. 2022, 29, 249–264. [Google Scholar]
- Jantke, K.; Schleupner, C.; Schneider, U.A. Benefits of earth observation data for conservation planning in the case of European wetland biodiversity. Environ. Conserv. 2013, 40, 37–47. [Google Scholar] [CrossRef]
- Jantke, K.; Schneider, U.A. Multiple-species conservation planning for European wetlands with different degrees of coordination. Biol. Conserv. 2010, 143, 1812–1821. [Google Scholar] [CrossRef]
- Schleupner, C. GIS-based estimatin of wetland conservation potentials in Europe. Appl. Ecol. Environ. Res. 2012, 10, 385–403. [Google Scholar] [CrossRef]

| 2010 | 2015 | ||||||
|---|---|---|---|---|---|---|---|
| Wetland | Farmland | Forestland | Grassland | Built-Land | Unused | Transerred-Land | |
| Wetland | 85.45 | 30.59 | 27.06 | 16.08 | 0.28 | 0 | 74.01 |
| Farmland | 18.88 | 470.56 | 37.06 | 13.57 | 4.03 | 0.02 | 73.56 |
| Forestland | 1.53 | 13.55 | 277.15 | 13.69 | 0.27 | 0.02 | 29.06 |
| Grassland | 16.32 | 18.55 | 6.5 | 9.42 | 0.12 | 0.02 | 41.51 |
| Built-land | 0.26 | 8.47 | 0.8 | 0.66 | 15.23 | 0 | 10.19 |
| Unused | 0.00 | 0.11 | 0.06 | 0.05 | 0.04 | 0.08 | 0.26 |
| Transerred-land | 36.99 | 71.27 | 71.48 | 44.05 | 4.74 | 0.06 | —— |
| 2015 | 2020 | ||||||
|---|---|---|---|---|---|---|---|
| Wetland | Farmland | Forestland | Grassland | Built-Land | Unused | Transerred-Land | |
| Wetland | 95.11 | 2.22 | 6.75 | 8.06 | 0.11 | 0.05 | 17.19 |
| Farmland | 53.62 | 526.52 | 4.21 | 31.36 | 1.06 | 0.02 | 90.27 |
| Forestland | 7.88 | 9.42 | 291.52 | 0.29 | 0.17 | 0 | 17.76 |
| Grassland | 2.77 | 2.65 | 3.70 | 11.17 | 0.12 | 0.10 | 9.34 |
| Built-land | 0.09 | 3.30 | 0.04 | 0.04 | 23.95 | 0.08 | 3.55 |
| Unused | 0.00 | 0.00 | 0.00 | 0.00 | 0.00 | 0.09 | 0.00 |
| Transerred-land | 64.36 | 17.59 | 14.7 | 39.75 | 1.46 | 0.25 | —— |
| Years | Wetland Area (10,000 hm2) | Percentage (%) |
|---|---|---|
| 2030 | 100.72 | 9.25 |
| 2040 | 94.49 | 8.68 |
| 2050 | 94.49 | 8.68 |
| 2060 | 94.49 | 8.68 |
| Priority Level | Counties and Cities (Abbreviation) | Including Counties and Cities | Existing Wetland Scale (%) | Urgency Level | Projected Proportion of Reduced Wetlands (%) | Potential Threat Level |
|---|---|---|---|---|---|---|
| P1 | QTH | Qitaihe | 4.27 | high | 3.65 | middle |
| P2 | HN | Huanan | 5.69 | middle | 3.30 | middle |
| YL | Yi an | 5.99 | middle | 3.13 | middle | |
| BL | Boli | 5.73 | middle | 2.87 | middle | |
| JD | Jidong | 6.21 | middle | 2.19 | middle | |
| P3 | YY | Youyi | 1.54 | high | 1.17 | less |
| TJ | Tongjiang | 32.31 | less | 5.23 | high | |
| LB | Luobei | 10.82 | less | 4.01 | high | |
| TY | Tangyuan | 10.24 | less | 4.28 | high | |
| HL | Hulin | 15.89 | less | 4.20 | high | |
| JM | Jiamusi | 13.03 | less | 4.00 | high | |
| P4 | HC | Huachuan | 8.5 | middle | 1.77 | less |
| HG | Hegang | 6.3 | middle | 1.76 | less | |
| FJ | Fujin | 12.46 | less | 2.12 | middle | |
| MS | Mishan | 28.34 | less | 3.18 | middle | |
| SB | Suibin | 18.61 | less | 3.43 | middle | |
| FY | Fuyuan | 40.27 | less | 3.44 | middle | |
| RH | Raohe | 12.75 | less | 2.79 | middle | |
| BQ | Baoqing | 11.37 | less | 3.44 | middle |
Disclaimer/Publisher’s Note: The statements, opinions and data contained in all publications are solely those of the individual author(s) and contributor(s) and not of MDPI and/or the editor(s). MDPI and/or the editor(s) disclaim responsibility for any injury to people or property resulting from any ideas, methods, instructions or products referred to in the content. |
© 2024 by the authors. Licensee MDPI, Basel, Switzerland. This article is an open access article distributed under the terms and conditions of the Creative Commons Attribution (CC BY) license (https://creativecommons.org/licenses/by/4.0/).
Share and Cite
Xu, N.; Cui, L.; Qu, Y.; Sun, G.; Zeng, X.; Zhang, H.; Li, H.; Zhou, B.; Luo, C.; Wu, R. Wetland Distribution Prediction Based on CA–Markov Model under Current Land Use and Protection Policy in Sanjiang Plain. Sustainability 2024, 16, 5750. https://doi.org/10.3390/su16135750
Xu N, Cui L, Qu Y, Sun G, Zeng X, Zhang H, Li H, Zhou B, Luo C, Wu R. Wetland Distribution Prediction Based on CA–Markov Model under Current Land Use and Protection Policy in Sanjiang Plain. Sustainability. 2024; 16(13):5750. https://doi.org/10.3390/su16135750
Chicago/Turabian StyleXu, Nan, Ling Cui, Yi Qu, Gongqi Sun, Xingyu Zeng, Hongqiang Zhang, Haiyan Li, Boqi Zhou, Chunyu Luo, and Ruoyuan Wu. 2024. "Wetland Distribution Prediction Based on CA–Markov Model under Current Land Use and Protection Policy in Sanjiang Plain" Sustainability 16, no. 13: 5750. https://doi.org/10.3390/su16135750
APA StyleXu, N., Cui, L., Qu, Y., Sun, G., Zeng, X., Zhang, H., Li, H., Zhou, B., Luo, C., & Wu, R. (2024). Wetland Distribution Prediction Based on CA–Markov Model under Current Land Use and Protection Policy in Sanjiang Plain. Sustainability, 16(13), 5750. https://doi.org/10.3390/su16135750