Article

On Caprock Seal Integrity of Tuscaloosa Mudstone at Cranfield, MS (USA), CO2 Injection Site

by
Vyacheslav Romanov
1,*,
Igor Haljasmaa
1,2 and
Yee Soong
1
1
U.S. Department of Energy, National Energy Technology Laboratory, 626 Cochran Mill Road, Pittsburgh, PA 15236, USA
2
NETL Support Contractor, 626 Cochran Mill Road, Pittsburgh, PA 15236, USA
*
Author to whom correspondence should be addressed.
Sustainability 2024, 16(13), 5758; https://doi.org/10.3390/su16135758
Submission received: 9 May 2024 / Revised: 20 June 2024 / Accepted: 2 July 2024 / Published: 5 July 2024
(This article belongs to the Section Environmental Sustainability and Applications)

Abstract

:
Saline formations deep underground are among the most promising targets for large-scale geologic carbon storage. The caprock seal integrity evaluation is an important component of commercial-scale CO2 sequestration projects. Measurements of the porosity and permeability of mudstone samples from the NETL-supported Cranfield Project were performed using a helium porosimeter and a core flow apparatus, before and after exposure in a CO2-saturated brine environment. The permeability of the core samples rapidly decreased with the increase in confining pressure and did not fully recover after decompression. On the other hand, exposure to CO2 led to an increase in the permeability by at least an order of magnitude. The porosity changes after the exposure were not substantial. The post-exposure increase in permeability was subsequently offset by its rapid decrease during the higher-pressure confinement. Extrapolation of the observed permeability trends to in situ reservoir conditions suggests that Tuscaloosa mudstone can effectively serve as a natural seal.

1. Introduction

As low-carbon power generation alternatives to the continued use of fossil fuels have yet to be implemented on a larger scale, carbon dioxide (CO2) capture and storage (CCS) is generally viewed as a key bridge technology. CCS involves the capture of CO2 from industrial emission sources and its storage in geological formations [1,2,3]. For CCS to have an impact, very large volumes of CO2 must be efficiently and cost-effectively injected and stored in subsurface reservoirs such as saline formations (porous formations filled with brine). The planning phase of the large-scale CO2 storage projects requires rigorous site assessment and reservoir modeling based on its property characterization data. Permeability and porosity are regarded as key reservoir properties that control the flow and residence of the fluids below the surface [4]. Saline formations deep underground are among the most promising targets for large-scale geologic carbon storage [5]. However, modeling such storage reservoirs is challenging as the key hydraulic properties of the system are affected by the water evaporation during the reservoir development and then CO2 sequestration. When the solubility limit is reached, salt precipitates in the pore space, thus affecting the porosity and permeability. One experimental study showed that sandstone porosity can decrease by 14.6% and permeability can decrease by as much as 83.3% due to the subflorescence (salt precipitation) that occurs under certain conditions [6]. In another experimental study, microscale alterations only resulted in a subtle increase in the porosity and permeability of dolostone under the reactive conditions [7].
The permeabilities from recent modeling studies of CO2 sequestration in deep saline formations range from sub-millidarcy (10−17 m2) to sub-nano-darcy (10−22 m2) [8]. Use of natural analogs provides realistic inputs to dynamic models of the subsurface systems. Lessons learned from the natural analogs such as petroleum systems can ultimately be transferred to the long-term storage of carbon dioxide. In this work, measurements of the porosity and permeability of the mudstone samples from the NETL-supported Cranfield Project [5] field site were performed to facilitate the modeling efforts. The field work was conducted at the idle Cranfield oilfield in southwestern Mississippi (Figure 1) to “stress the system” by injecting one million metric tons (MMT) of CO2 into Lower Tuscaloosa Formation sandstones, the saline part of the field at depths greater than 3000 m (10,000 ft). The Tuscaloosa Formation is a series of beds primarily composed of chert gravel, sand, and clay lithologies [9].
The samples obtained for this study were taken from one of the monitoring wells, from a gas-tight mudstone seal layer at about 65 m above the target saline reservoir. The caprock seal integrity evaluation is an important component of the commercial-scale CCS deployment assuring confinement of the injected CO2 at a potential storage site. In other studies, mercury intrusion capillary pressure (MICP) measurements of samples from the same well were used to quantify the sealing capacity of various microfacies [11] but there were no permeability measurements under representative pressure and temperature. The objective of this work was to assess the effectiveness of the seal under the sequestration conditions. The permeability trends observed in this study suggest that Tuscaloosa mudstone can effectively serve as a natural seal even though a prolonged exposure to CO2-saturated brine at the reservoir conditions can lead to a significant increase in the permeability of the exposed rock. Notably, this is quite different from the earlier results obtained based on the samples from an underlying storage reservoir [12]. In that work, permeability measurements of the sandstone core sample before and after exposure to the same brine indicated a permeability reduction.

2. Materials and Methods

The impact of injected CO2 on mudstone from the middle Tuscaloosa Formation was studied through exposure of a core sample to CO2-saturated brine at the sequestration temperature and pressure for a period of six months. The powder samples were studied by using optical microscopy and X-ray diffraction (XRD) to observe the mineralogical, textural, and geochemical changes that resulted from the CO2 exposure. The porosity and permeability of the mudstone were also measured before and after the exposure.
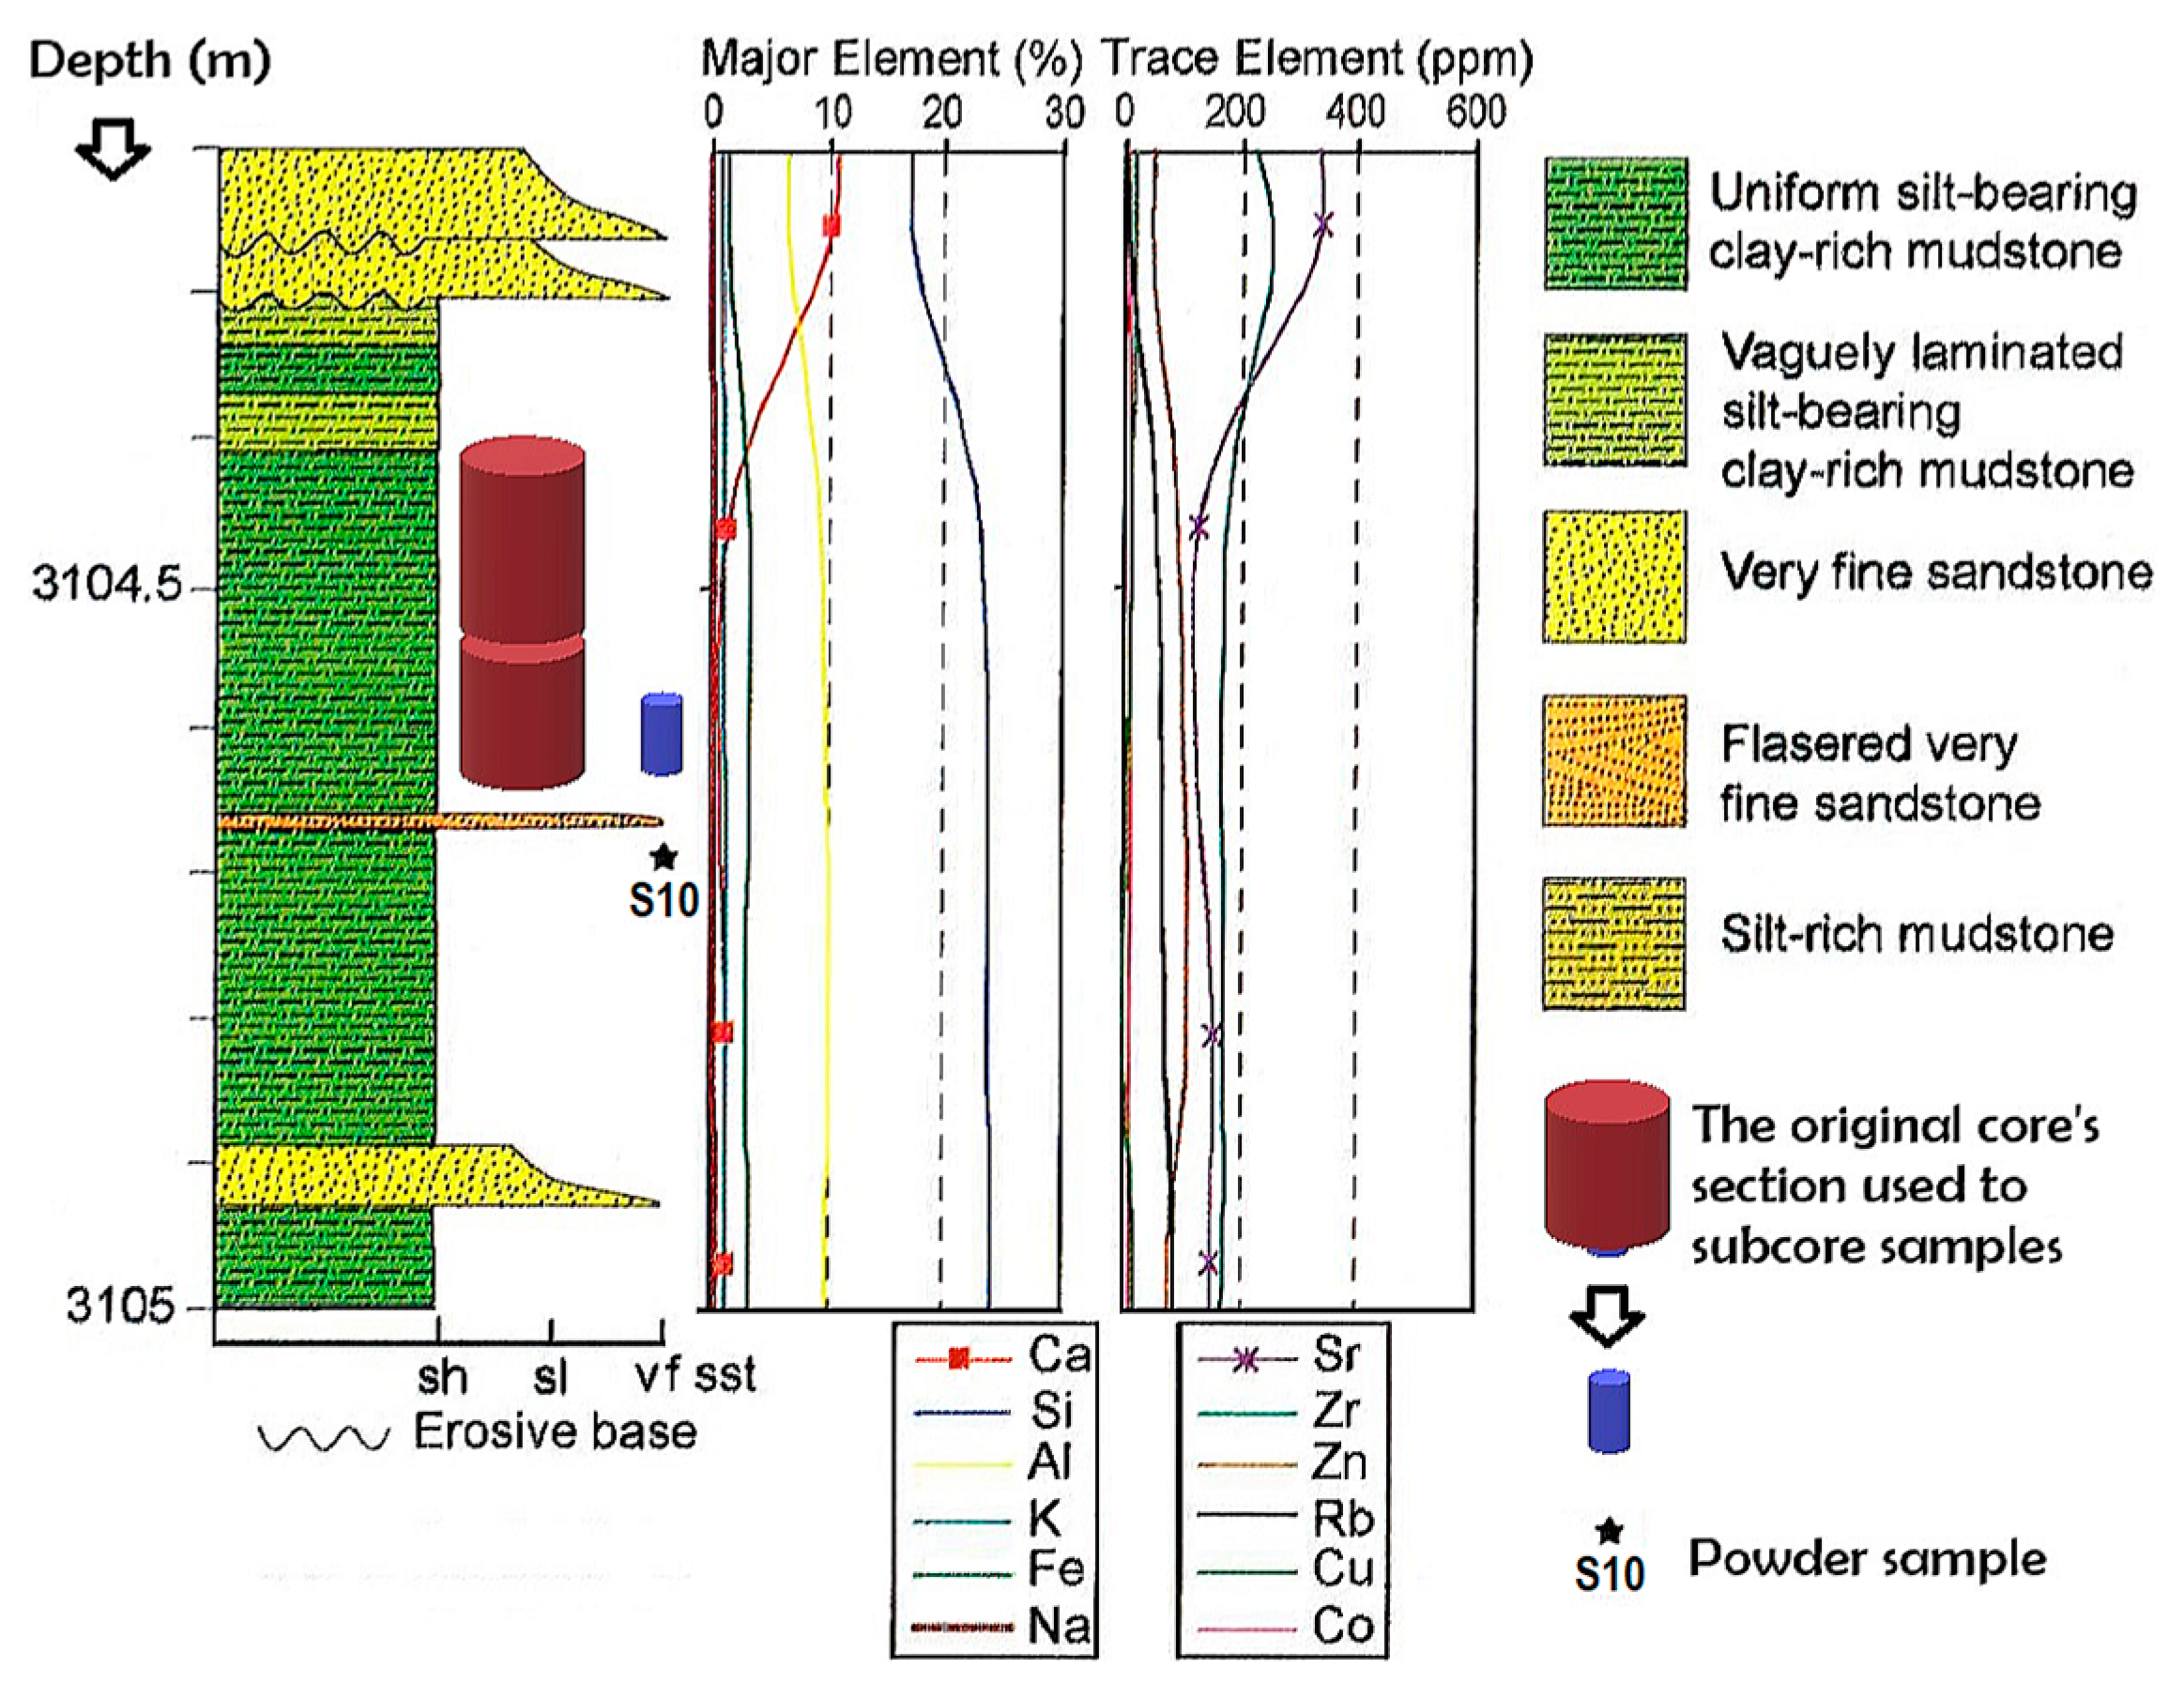
The original two core sections extracted from the depths of 3104–3105 m (Figure 2) were roughly 10 cm (4 in) in diameter and about 9 cm and 13 cm in length (i.e., about 3.5 in and 5 in, respectively). The shorter piece was used for the subcore sample preparation, for porosity measurements at 0.7 MPa using helium porosimeter HP-401 manufactured by TEMCO, Inc. (Loveland, OH, USA), and for permeability studies using AutoLab 1500 manufactured by New England Research, Inc. (White River Junction, VT, USA) for low- and moderate-permeability measurements, as described in [13]. The initial dimensions of two sub-cored samples were as follows: 37.57 mm diameter and 45.35 mm length (horizontal dimension, by design) for the first one; and 25.15 mm diameter and 49.77 mm length (vertical dimension) for the second subcore. The mass density of the first subcore sample was slightly lower (2.39 g/cm3) than for the second one (2.51 g/cm3). The porosity and permeability of both subcore samples were characterized prior to their exposure to CO2-saturated brine, and then the first sample was retained as a reference for subsequent reproducibility checks. Only the vertical subcore was used in the geochemical studies.
The longer section of the original core sample was further processed for computed tomography (CT) scanning. Due to the weak mechanical strength of the mudstone, the sample disintegrated during the processing and made CT scanning impossible.
The mineral composition of the uniform silt-bearing clay-rich mudstone used in this study was evaluated by using the powder sample S10 (Table 1) from the same depth range of 3104–3105 m (as shown in Figure 2).
The experiments exploring potential geochemical interactions of CO2/brine/rock in saline formations under CO2 sequestration conditions were conducted in a static reactor (autoclave) manufactured by Thar Technologies, Inc. (Pittsburgh, PA, USA), which had an open Teflon reaction cell (7.62 cm diameter × 10.16 cm length) inside the 17-4PH-1150 stainless steel high-pressure vessel (10.2 cm diameter × 16.5 cm depth). Using conventional pressure gradients for oil bearing reservoirs [14], the estimated overburden pressure was 74 MPa and the pore pressure above 30 MPa, at 3105 m depth. However, due to limitation of the experimental setup, it was impossible to reach pore pressures above 24 MPa.
Changes in the mudstone morphology after exposure to CO2-saturated synthetic brine representative of Tuscaloosa Basin were observed for six months. The details of synthetic brine preparation and chemistry (with the initial pH of 5.4) were described elsewhere [12]. The experimental conditions to which the subcore sample was exposed to were reactor temperature of 85 ± 1 °C and CO2 pressure of 23.8 MPa (3500 psig) controlled by ISCO 260D syringe pump that was manufactured by Teledyne ISCO (Lincoln, NE, USA). At the beginning of experiment, the entire pressure vessel was filled with brine to ensure that CO2 entering the reaction cell was fully saturated with water vapor, then the system was purged with CO2 three times with the initial pressure of up to 4.1 MPa (600 psig) and steadily heated and pressurized to the static experimental conditions within approximately four hours.

3. Results

Observations of the sample properties are grouped by the measurements before CO2 exposure, geochemical studies, and the measurements after CO2 exposure.

3.1. Porocity and Permeability Measurements before CO2 Exposure

3.1.1. First Subcore Sample (Horizontal Axis)

Prior to permeability measurements, the first subcore’s mass density was ρ = 2.39 g/cm3 and the average porosity was approximately 3.05% compared to the 2.99% MICP porosity observed in a prior study [11]. It was then subjected to two stages of permeability measurements. During the first stage, it was subjected to confining pressure of up to 50 MPa and the upstream pore pressure of up to 24 MPa. As a result, the porosity decreased to 2.4%. The butts of the sample (about 4–5 mm from each end) were significantly damaged and had to be cut off. That reduced the length of the sample to 36.55 mm.
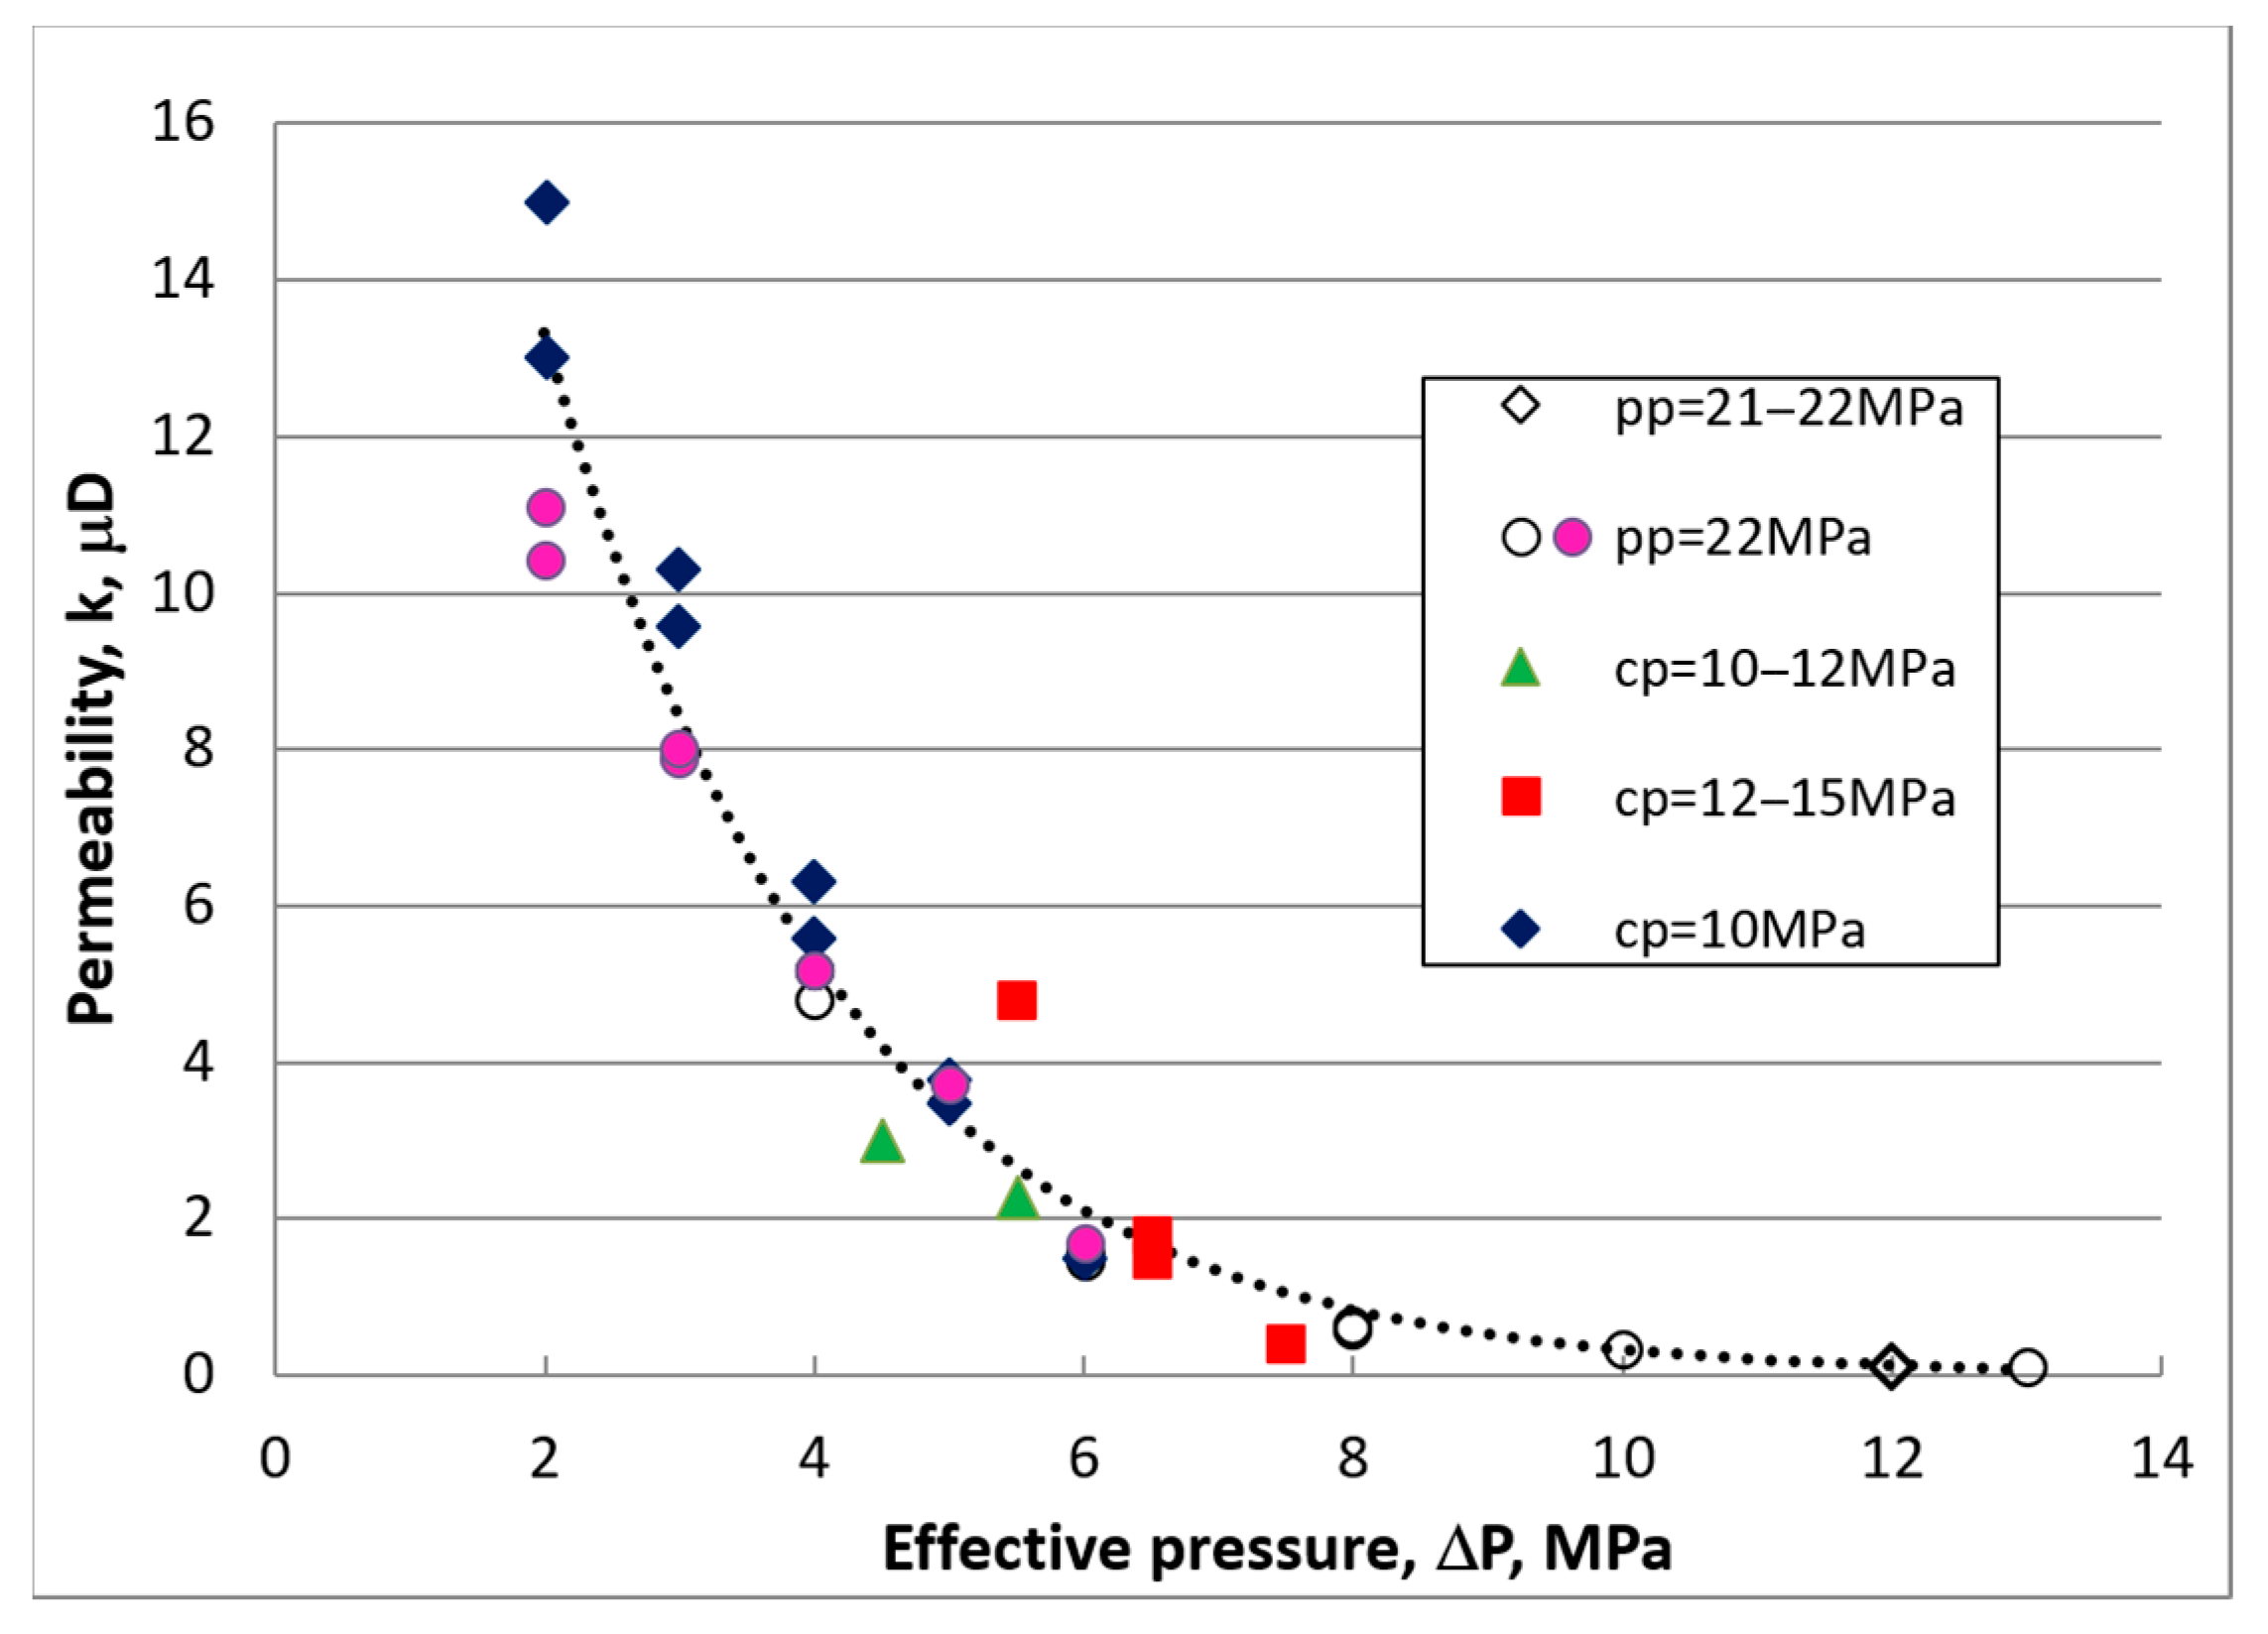
To avoid further mechanical damage, the second stage of permeability measurements (with shortened sample) was performed at relatively modest confining pressures below 24 MPa and pore pressures of up to 22 MPa. The plot summarizing all permeability measurements at various effective pressures from the combined two stages is shown in Figure 3. The effective pressure is defined per Terzaghi’s principle as a difference between the confining pressure and the pore pressure [15].
The permeability values were determined by the preset AutoLab’s “sine-6” method (a transient, six-period sine wave) for both stages. Argon gas was used as a pore fluid. For both stages of permeability measurements, a sharp reduction in flow was observed at the effective pressures above 10–15 MPa, which complicated the measurements.

3.1.2. Second Subcore Sample (Vertical Axis)

Prior to confinement, the second subcore’s mass density was ρ = 2.51 g/cm3 and the average porosity was initially estimated at 2.6% using the same automated procedure as with the first subcore. To account for longer equilibration time in the low-permeability materials, pressure evolution was additionally monitored for two hours. As expected, there was a substantial, diffusion-driven pressure relaxation process observed after corrections for a steady gas leak. With such a correction, the true initial porosity was estimated to be 3.7%.
The results for permeability measurements are shown in Table 2. Due to poor gas flow (argon) AutoLab “sine-6” and “a-spike” methods were not effective in this case. Most of these measurements were performed using a “pulse decay” method, except for Test no. 5, in which the “pressure ramp” method was used for cross-validation.
While the overall trend showed decreasing permeability with increasing effective pressure, permeability loss was irreversible. The measurements repeated six months later, just before the geochemical studies, produced more reversible trends but generally lower permeability values (less than 10 nD) within the same range of pressures. The porosity decreased to 1.5%.

3.2. Geochemical Studies

Brine solutions were diluted with deionized water and analyzed for dissolved metal cation content using Optima 7300DV manufactured by PerkinElmer (Waltham, MA, USA) for inductively coupled plasma and optical emission spectrometry (ICP-OES) before and after the autoclave experiments with mudstone. Anions and solids were analyzed by scanning electron microscopy with energy dispersive X-ray (EDX-SEM) detection, XRD, and optical reflected light microscopy using the methods reported elsewhere [16].
The contents of major chemical elements and compounds in two batches of synthetic Lower Tuscaloosa brine used in the autoclave experiments are shown in Table 3. It can be observed that six months of interaction with the mudstone samples had noticeably changed the brine composition.
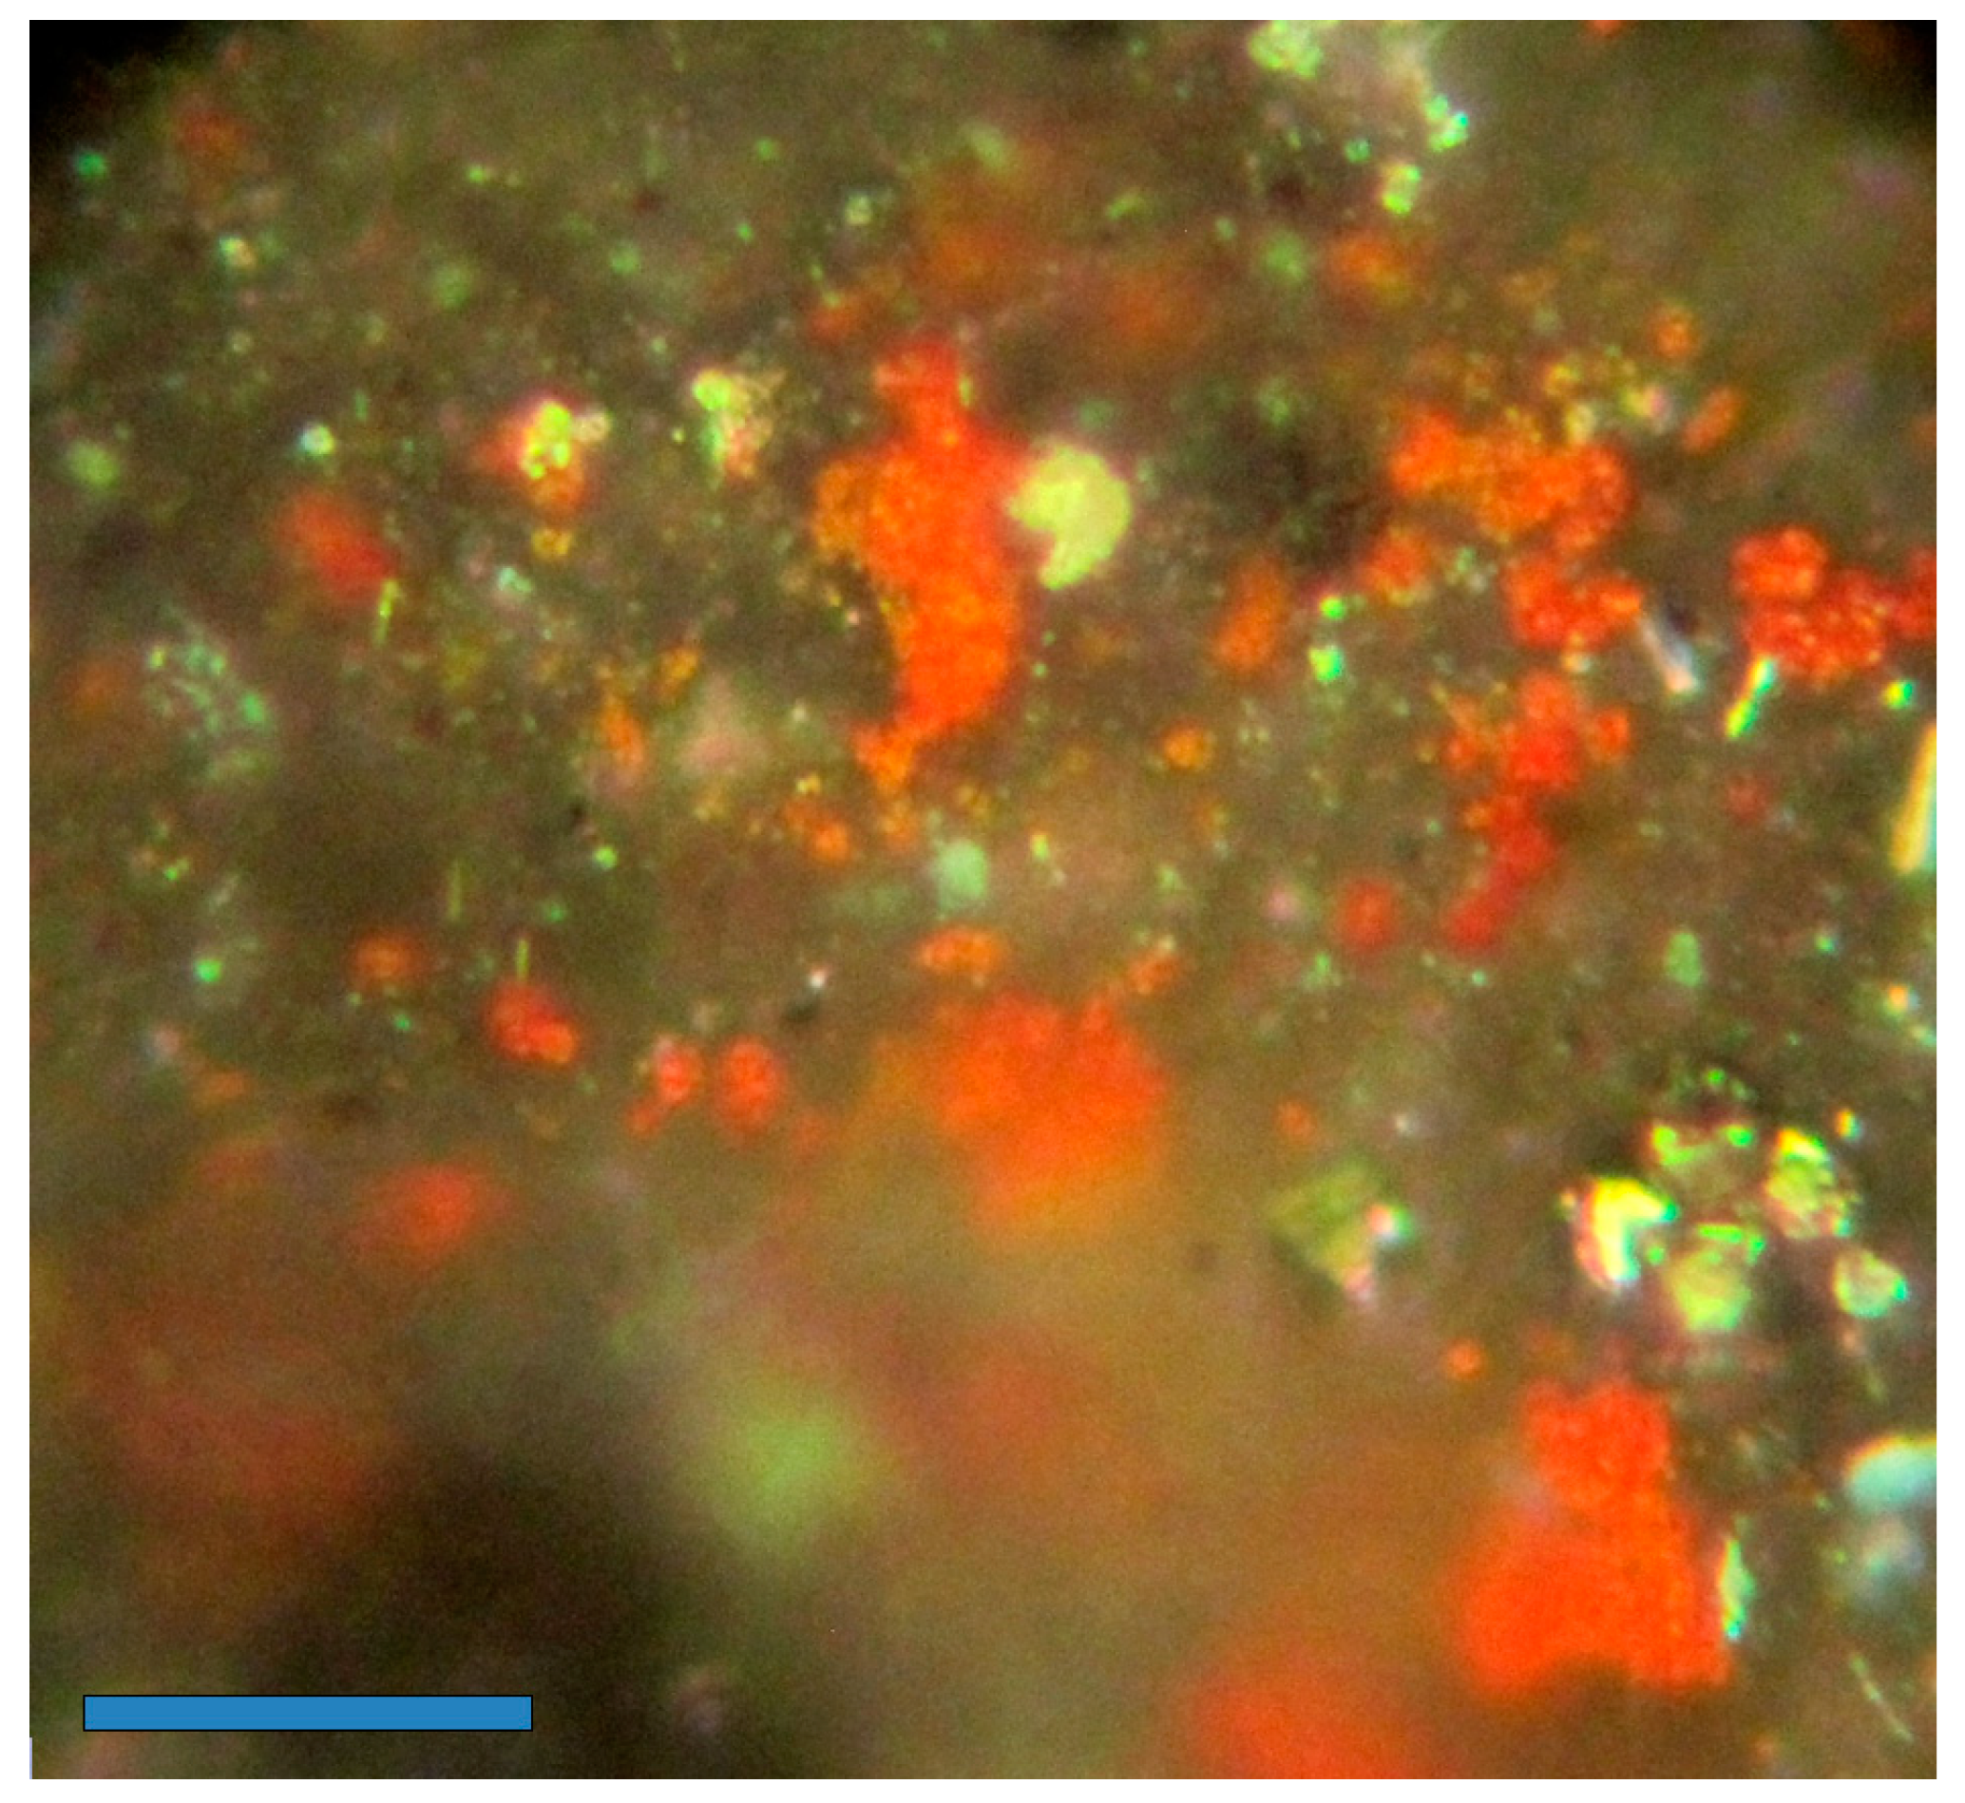
The mudstone samples after six months of the autoclave experiments were reddish-brown in appearance, particularly along the edges and in the interior areas where pyrite was observed. There were many areas where framboidal pyrite and individual euhedral pyrite were abundant in the mudstone sample, as illustrated in Figure A1. The red deposits are shown in Figure A2.

3.3. Permeability Measurements after CO2 Exposure

The mudstone sample that was exposed to CO2-saturated synthetic brine in the six-month autoclave experiment (the vertical subcore, originally 25.15 mm diameter) became saturated with water. To minimize mechanical damage to the fragile sample, about 0.5 g of water was removed from the pore space by cycling argon pressure in AutoLab system between 3 MPa and 25 MPa, instead of using a desiccator for drying. Following the pressure cycling, the crumbled ends were cut off at lengths of about 5 mm on each side of the sample. That reduced the length of the sample to 39.57 mm. The diameter before the final permeability measurements was at 25.16 mm, the mass density was ρ = 2.53 g/cm3, and the average porosity was estimated at 1.5% (1.55% for the full-length sample).
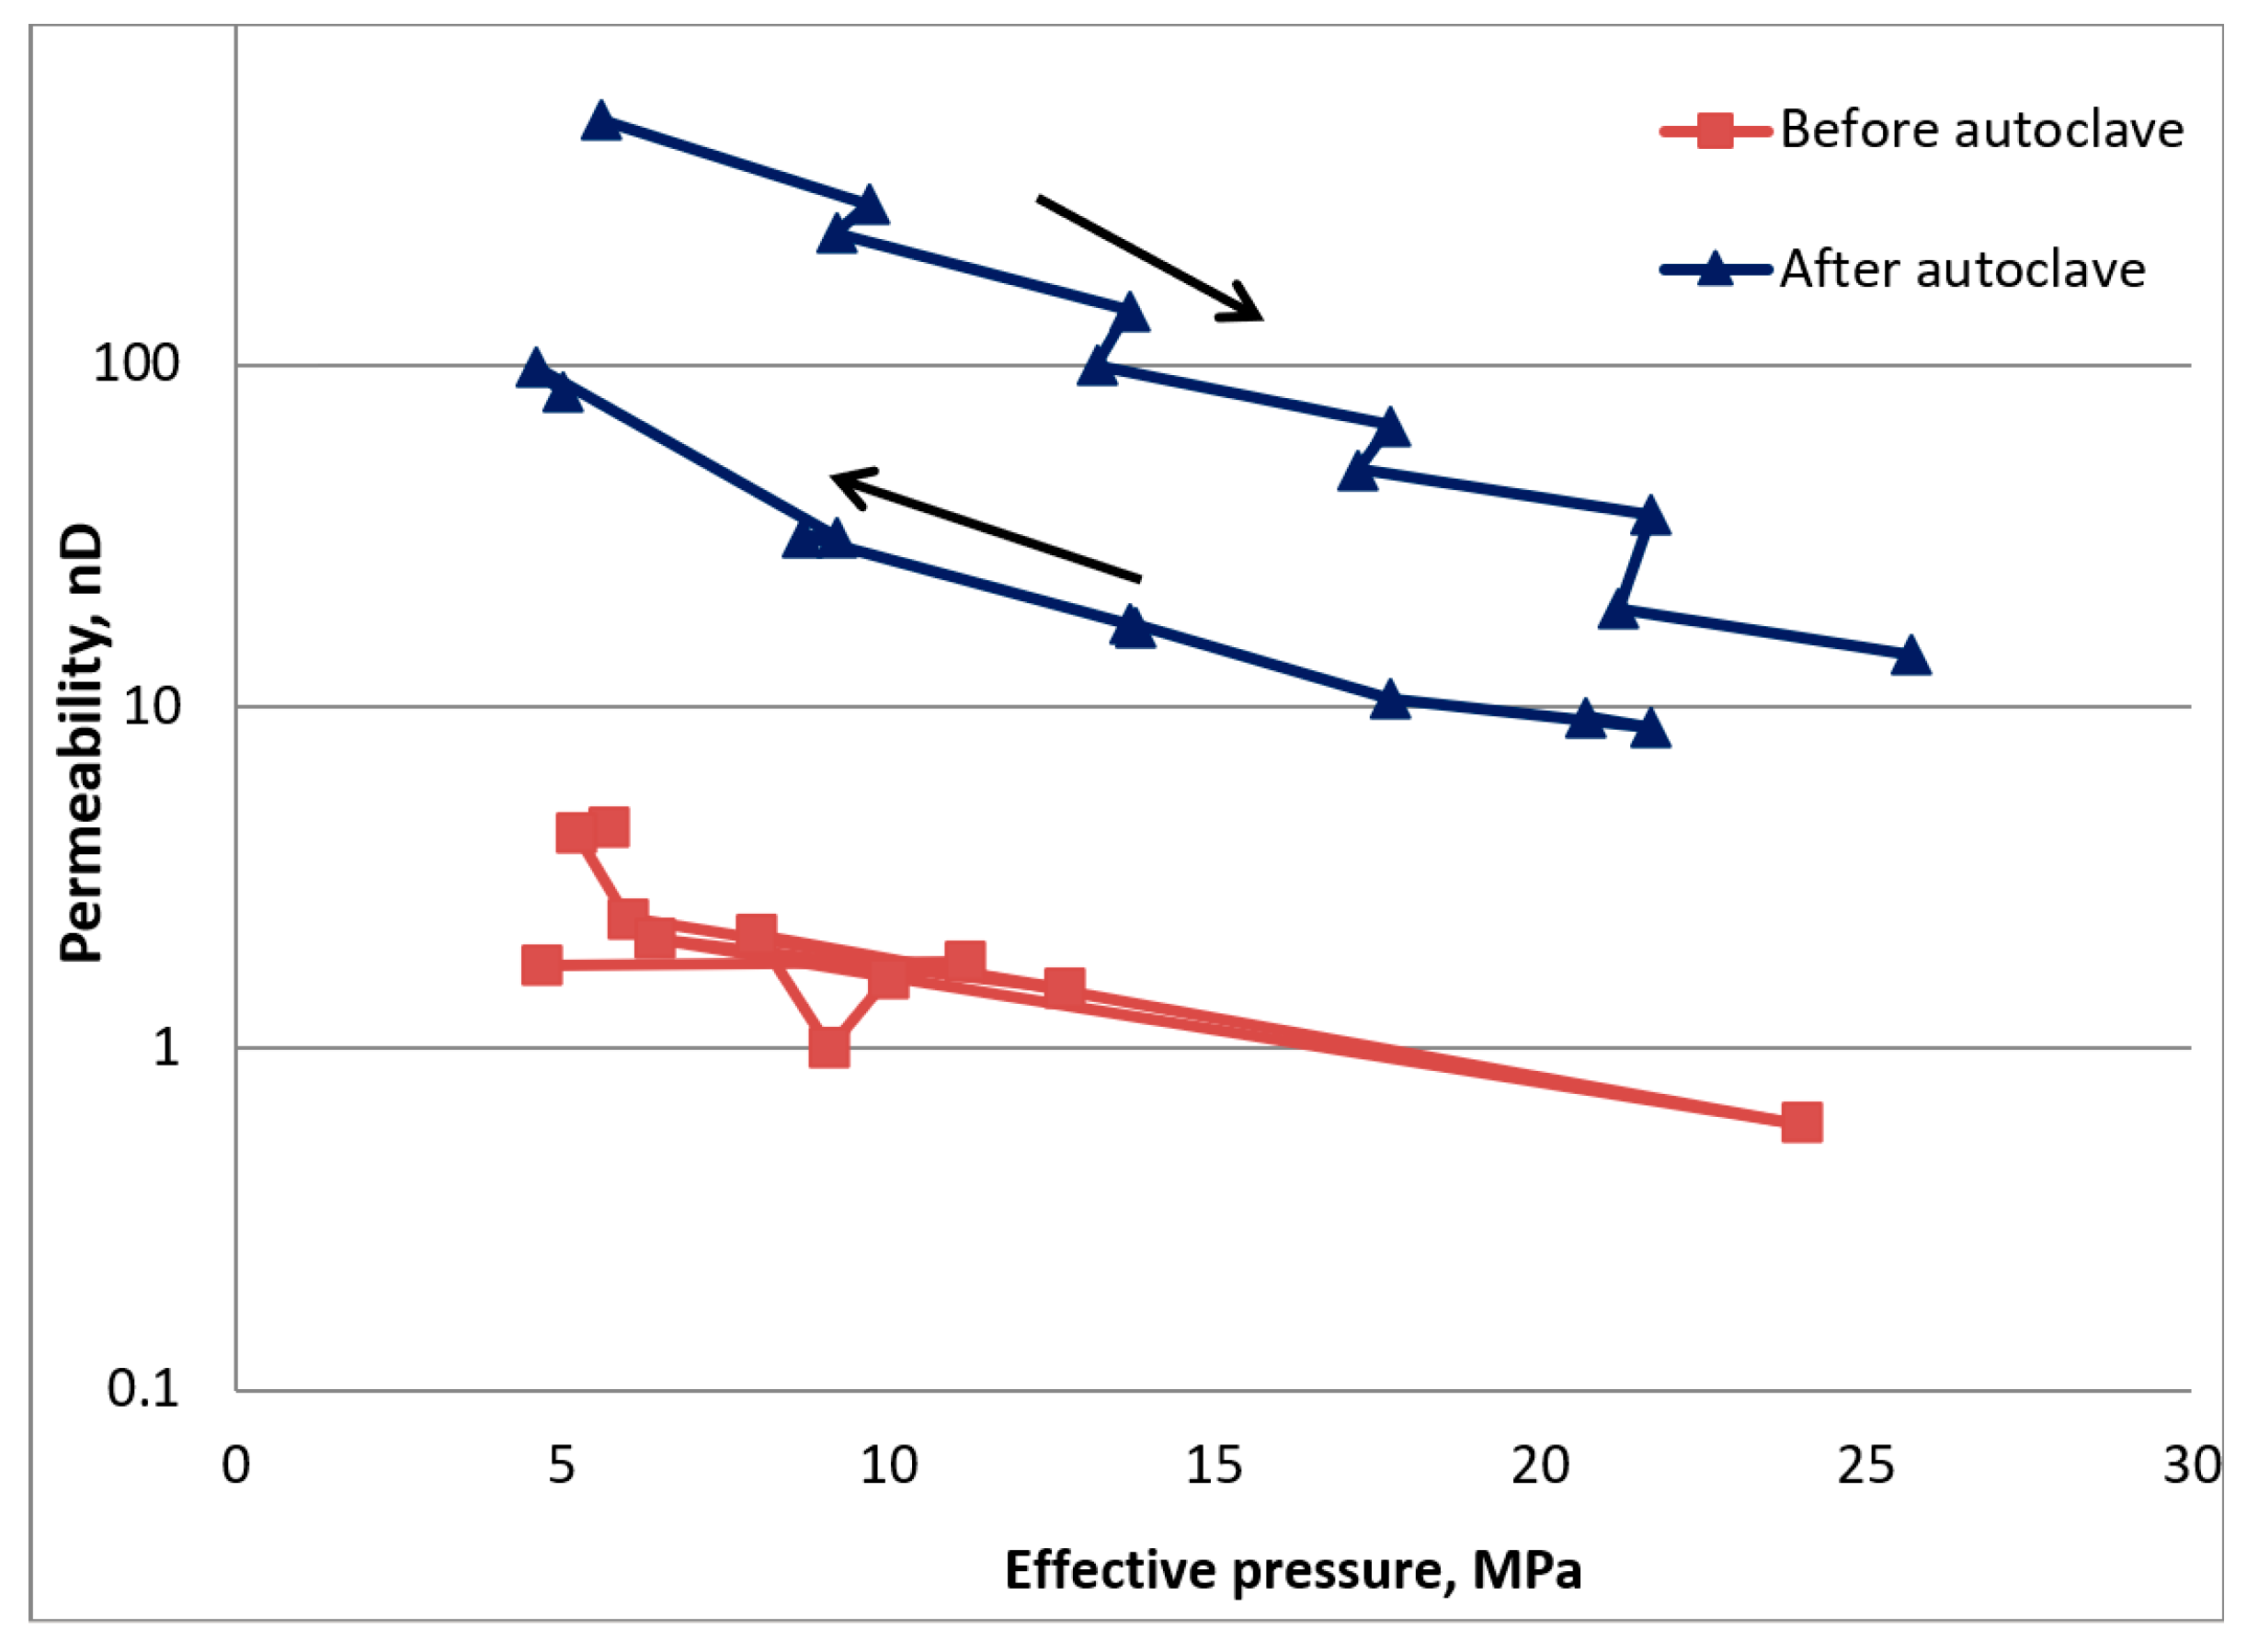
For cross-validation, these measurements were performed with three different upstream transient-pressure patterns: a step, a six-period sine wave, and a linear ramp. Permeability values were derived from the downstream pressure responses. The details are provided in Table A1. The dominant trend was decreasing permeability with increasing effective pressure, but permeability loss was irreversible (as shown in Figure 4). However, the permeability hysteresis loop was at substantially higher levels than prior to the autoclave experiments.

4. Discussion

The concentration of Ca, Mg, K, and Fe cations noticeably increased during the six-month interaction of the CO2-saturated brine with mudstone. The observed increase in Ca concentration can be attributed to calcite dissolution. Similarly, dissolution of illite and K-feldspar (see Table 1) can explain the increase in Mg, K, and Fe concentrations. Generally, the dissolution process involves the following steps: (a) dissociation of H2O molecules, (b) protonation of non-bridging oxygens at mineral’s surface, (c) bonding between CO2 molecules and the hydroxyl anions (OH), (d) leaching of the mobile cations, and (e) their interaction with the dissociated species, as described in [17,18]. The reaction products remain in the solution along with other salts until it becomes supersaturated:
Cat.n+ + (HCO3) + OH → Cat.(2/n) · (CO3) → (sol.)
where Cat. = metal cation, n = cation oxidation number, sol. = solvated.
There was also some indication that pyrite oxidation was involved in the formation of reddish deposits in the mudstone sample that were observed after the autoclave experiment. While the porosity of the exposed mudstone sample only marginally increased, from 1.5% to 1.55%, a significant increase in permeability of at least one order of magnitude was observed after the water removal from the sample. Hence, the mineral dissolution of calcite, illite, and K-feldspar likely improved the pore connectivity and led to increased permeability without affecting the porosity of the sample. However, the permeability of the exposed mudstone showed a downward trend, falling to less than 10 nD (Figure 4) even at pressures three times lower than what is expected within the target geological interval.
Comparison of the permeability data for two subcore samples (Figure 3 and Figure 4) showed anisotropy of permeability prior to the autoclave experiments, particularly at lower pressure. However, both subcore samples became practically impermeable at effective pressure above 25 MPa (for example, at the confining pressure of 50 MPa and pore pressure of 24 MPa). In fact, at the confining pressures above 10 MPa permeability was already in the nano-darcy range and then continued to trend down toward 10 nD or lower, as extrapolated to the target geological conditions.
It is likely that the permeability of the original core samples received for this study (prior to sub-coring) was higher than in situ because of the secondary fractures that could form due to decompression and delamination during their retrieval. Some of those changes may have been reversed by the high-pressure confinement, but the net effect would be some additional increase in permeability, which implies that the estimates of the final permeability at less than 10 nD are very conservative. That qualifies the mudstone interval as a good natural seal. Other studies suggest that even with higher mudstone permeability, the existence of the secondary and tertiary seals is likely to provide a stable caprock seal in the presence of CO2 [12].

5. Conclusions

In this study, chemical interactions between a mudstone core sample (from a caprock directly above the Lower Tuscaloosa CO2 storage reservoir) and CO2-saturated brine were investigated under the CO2 storage conditions. The observed increase in the mudstone permeability attributed to calcite, illite, and K-feldspar dissolution because of CO2–brine exposure is likely insufficient to impact Tuscaloosa mudstone’s effectiveness as a natural seal, thanks to its relatively low initial permeability and the relative thickness of the stratigraphic interval. Potential mudstone heterogeneity requires further study of each facies and lithology (Table 1) regarding the overall sealing capacity of the mudstone layer.

Author Contributions

Conceptualization, V.R.; methodology, Y.S.; software, I.H.; validation, Y.S. and I.H.; formal analysis, I.H.; investigation, V.R.; resources, Y.S.; data curation, I.H.; writing—original draft preparation, V.R. and I.H.; writing—review and editing, V.R. and Y.S.; visualization, I.H.; supervision, Y.S.; project administration, V.R.; funding acquisition, Y.S. All authors have read and agreed to the published version of the manuscript.

Funding

This research received no external funding.

Data Availability Statement

Data are contained within the article.

Acknowledgments

The authors wish to acknowledge Jiemin Lu (former University of Texas) for the mudstone sections and related information, Dustin Crandall and Dustin McIntyre (NETL) for conducting the subcore sampling, and Gino Irdi (former NETL) for performing the microphotography.

Conflicts of Interest

The authors declare no conflicts of interest. The funders had no role in the design of the study; in the collection, analyses, or interpretation of data; in the writing of the manuscript; or in the decision to publish the results.

Disclaimer

This report was prepared as an account of work sponsored by an agency of the United States Government. Neither the United States Government nor any agency thereof, nor any of their employees, makes any warranty, express or implied, or assumes any legal liability or responsibility for the accuracy, completeness, or usefulness of any information, apparatus, product, or process disclosed, or represents that its use would not infringe privately owned rights. Reference herein to any specific commercial product, process, or service by trade name, trademark, manufacturer, or otherwise does not necessarily constitute or imply its endorsement, recommendation, or favoring by the United States Government or any agency thereof. The views and opinions of authors ex-pressed herein do not necessarily state or reflect those of the United States Government or any agency thereof.

Appendix A

Tuscaloosa Mudstone powder samples, after having been subjected to a six-month exposure in CO2-saturated brine (the autoclave experiments) were prepared, which entailed grinding and polishing them for a subsequent reflected-light examination. Dry and oil immersion objective lenses were utilized in the examination. The microphotographs are shown below (Figure A1 and Figure A2). Additionally, the details of permeability measurements after CO2 exposure are provided in Table A1.
Figure A1. Photomicrograph of mudstone area containing framboidal pyrite (FeS2) with euhedral grains surrounded by a quartz, clay, and micrite matrix: blue bar is a 50-micron scale.
Sustainability 16 05758 g0a1
Figure A2. Photomicrograph of mudstone area (not near the edge) where red deposits are associated with pyrite. Blue bar is a 20-micron scale.
Sustainability 16 05758 g0a2
Table A1. Permeability measurements in chronological order.
Test No.MethodConf P (MPa)Pore P (MPa)k (nD)
1Sine-6104.4522
2Pressure step155.3296
3Sine-6155.8233–255
4Pressure step206.3145
5Sine-6206.8100
6Pressure step257.366.5
7Sine-6257.849.7
8Sine-6308.336.3
9Pressure step308.819.4
10Sine-6359.314.1
11Pressure step4010.3<DL
12Sine-63510.3<DL
13Pressure step309.39.35
14Pressure step308.38.65
15Pressure step104.4522
16Pressure step155.3296
17Pressure step155.8233–255
18Pressure step257.310.5
19Pressure step206.316.3–19.1
20Pressure ramp206.216.4–17.8
21Pressure step156.331.5
22Sine-6155.831.5
23Pressure step105.499
24Sine-6105.083.1
Note: Conf P = confining pressure; Pore P = pore pressure; k = permeability; DL = detection limit.

References

  1. Aminu, M.D.; Nabavi, S.A.; Rochelle, C.A.; Manovic, V. A review of developments in carbon storage. Appl. Energy 2017, 208, 1389–1419. [Google Scholar] [CrossRef]
  2. Ali, M.; Jha, N.K.; Pal, N.; Kesharz, A.; Hoteit, H.; Sarmadivaleh, M. Recent advance in carbon dioxide geological storage, experimental procedures, influencing parameters, and future outlook. Earth-Sci. Rev. 2022, 225, 103895–103922. [Google Scholar] [CrossRef]
  3. Dziejarski, B.; Krzyznska, R.; Andersson, K. Current status of carbon capture, utilization, and storage technologies in the global economy: A survey of technical assessment. Fuel 2023, 342, 127776–127814. [Google Scholar] [CrossRef]
  4. Mineralogy of Sandstones: Porosity and Permeability, Geological Digressions. Available online: https://www.geological-digressions.com/mineralogy-of-sandstones-porosity-and-permeability (accessed on 14 March 2024).
  5. Carbon Storage FAQs, National Energy Technology Laboratory. Available online: https://www.netl.doe.gov/carbon-management/carbon-storage/faqs/carbon-storage-faqs (accessed on 14 March 2024).
  6. Tang, Y.; Yang, R.; Du, Z.; Zeng, F. Experimental Study of Formation Damage Caused by Complete Water Vaporization and Salt Precipitation in Sandstone Reservoirs. Transp. Porous Med. 2015, 107, 205–218. [Google Scholar] [CrossRef]
  7. Wang, H.; Alvarado, V.; Bagdonas, D.A.; McLaughlin, J.F.; Kaszuba, J.P.; Grana, D.; Campbell, E.; Ng, K. Effect of CO2-brine-rock reactions on pore architecture and permeability in dolostone: Implications for CO2 storage and EOR. Int. J. Greenh. Gas. Control 2021, 107, 103283. [Google Scholar] [CrossRef]
  8. Cavanagh, A.; Wildgust, N. Pressurization and Brine Displacement Issues for Deep Saline Formation CO2 Storage. Energy Procedia 2011, 4, 4814–4821. [Google Scholar] [CrossRef]
  9. Merrill, R.K.; Gann, D.E.; Jennings, S.P. Tishomingo County geology and mineral resources [Mississippi]. Miss. Off. Geol. Bull. 1988, 127, 178. [Google Scholar]
  10. Carbon Storage Atlas, National Energy Technology Laboratory. Available online: https://netl.doe.gov/coal/carbon-storage/atlas/secarb/phase-III/cranfield-project (accessed on 26 March 2024).
  11. Lu, J.; Milliken, K.; Reed, R.M.; Hovorka, S. Diagenesis and sealing capacity of the middle Tuscaloosa mudstone at the Cranfield carbon dioxide injection site, Mississippi, U.S.A. Environ. Geosci. 2011, 18, 35–53. [Google Scholar] [CrossRef]
  12. Soong, Y.; Howard, B.H.; Dilmore, R.M.; Haljasmaa, I.; Crandall, D.M.; Zhang, L.; Zhang, W.; Lin, R.; Irdi, G.A.; Romanov, V.N.; et al. CO2/brine/rock interactions in Lower Tuscaloosa formation. Greenh. Gas. Sci. Technol. 2016, 6, 824–837. [Google Scholar] [CrossRef]
  13. Soong, Y.; Howard, B.H.; Hedges, S.W.; Haljasmaa, I.; Warzinski, R.P.; Irdi, G.; McLendon, T.R. CO2 sequestration in Saline Formation. Aerosol Air Qual. Res. 2014, 14, 522–532. [Google Scholar] [CrossRef]
  14. Zhang, J.J. Abnormal pore pressure mechanisms. In Applied Petroleum Geomechanics; Elsevier: Amsterdam, The Netherlands, 2019; pp. 233–280. [Google Scholar]
  15. Biot, M.A. General theory of three-dimensional consolidation. J. Appl. Phys. 1941, 12, 155–164. [Google Scholar] [CrossRef]
  16. Soong, Y.; Hedges, S.W.; Howard, B.H.; Dilmore, R.M.; Allen, D.E. Effect of contaminants from flue gas on CO2 sequestration in saline formation. Int. J. Energy Res. 2014, 38, 1224–1232. [Google Scholar] [CrossRef]
  17. Dai, X.; Wei, C.; Wang, M.; Song, Y.; Chen, R.; Wang, X.; Shi, X.; Vandeginste, V. Mineralization mechanism of carbon dioxide with illite interlayer cations using molecular dynamics simulation and experiments. J. CO2 Util. 2022, 64, 102161. [Google Scholar] [CrossRef]
  18. Tutolo, B.M.; Luhmann, A.J.; Kong, X.-Z.; Saar, M.O.; Seyfried, W.E. CO2 sequestration in feldspar-rich sandstone: Coupled evolution of fluid chemistry, mineral reaction rates, and hydrogeochemical properties. Geochim. Cosmochim. Acta 2015, 160, 132–154. [Google Scholar] [CrossRef]
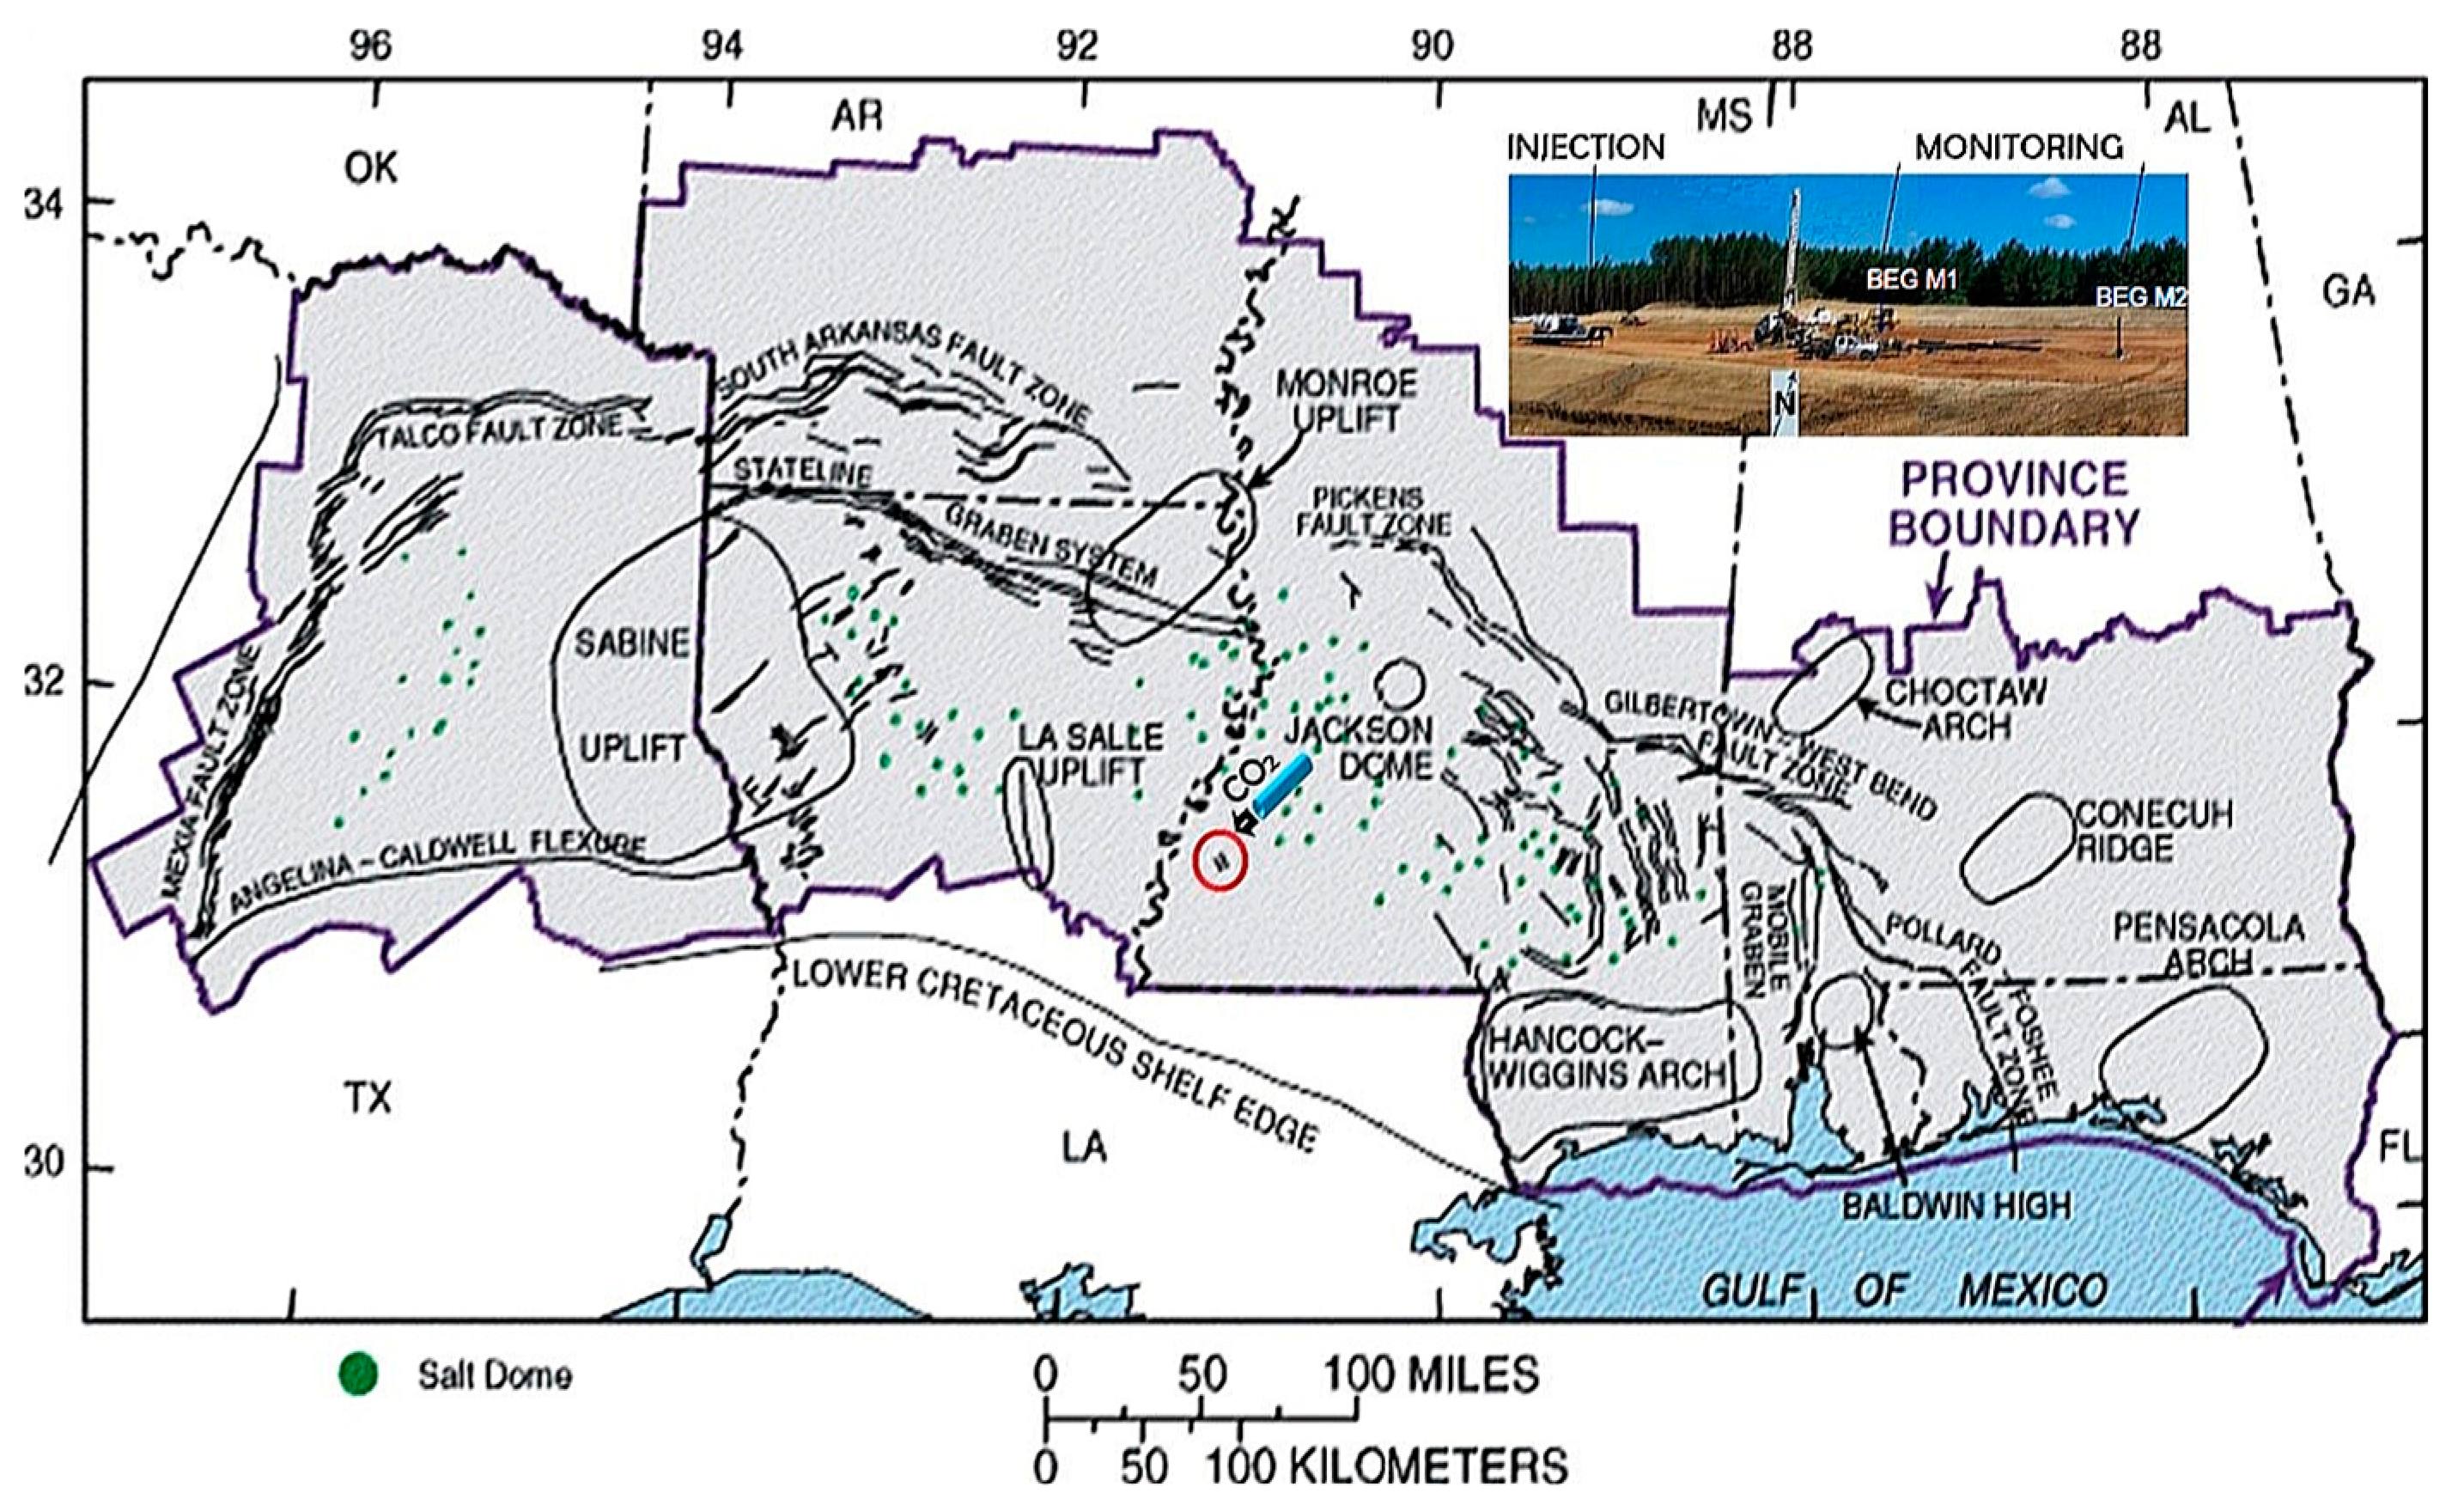
Figure 1. Geologic location and provincial boundaries map of the Cranfield site (circled red); inset: the field photo of one injection and two monitoring wells at the study site [10].
Sustainability 16 05758 g001
Figure 2. Origin and preliminary characterization of the samples and their natural environment [11]: sh = shale; sl = silt; vf sst = very fine sandstone. (Courtesy of Jiemin Lu and AAPG).
Sustainability 16 05758 g002
Figure 3. Permeability in horizontal direction vs. effective pressure: first stage (hollow markers) and second stage (filled markers); cp = confining pressure; pp = pore pressure.
Sustainability 16 05758 g003
Figure 4. Permeability in vertical direction vs. effective pressure: before the exposure (red) and after the exposure to CO2-saturated brine (blue). The arrows show the measurement order (first to last).
Sustainability 16 05758 g004
Table 1. Mineral composition of the powder samples from the monitoring well (%) [11].
Sample No.IlliteKaoliniteQuartzK-FeldsparPyriteCalciteAlbiteAnatase
S1035.530.716.27.54.71.91.91.5
Table 2. Permeability measurements in chronological order.
Test No.1234567
Conf P (MPa)10152428322323
Pore P (MPa)66.310.418.5151312
k (nD)17–2114–187.5–9.58.5–10.52.5–3.11.8–2.21.4–1.6
Note: Conf P = confining pressure; Pore P = pore pressure; k = permeability.
Table 3. Two batches of synthetic Lower Tuscaloosa brine, with and without mudstone (ppm).
ContentBatch 1Mudstone 1Batch 2Mudstone 2
Na (cat.)43,74348,38845,00747,491
Ca (cat.)11,79813,20211,39711,586
Mg (cat.)1035124010971268
Sr (cat.)696775734731
K (cat.)412530423487
S (an.)166332161290
Fe (cat.)124210129318
Chloride92,22393,00592,95294,412
Bromide432432481481
Sulfate238271244230
Note: Mudstone = brine with mudstone; cat. = total cations; an. = total anions.
Disclaimer/Publisher’s Note: The statements, opinions and data contained in all publications are solely those of the individual author(s) and contributor(s) and not of MDPI and/or the editor(s). MDPI and/or the editor(s) disclaim responsibility for any injury to people or property resulting from any ideas, methods, instructions or products referred to in the content.