Abstract
The development of clean energy is a crucial strategy for combating climate change. However, the widespread adoption of wind power has led to significant challenges such as wind curtailment and power restrictions. A potential solution is the abandonment of onshore wind power for hydrogen production (AOWPHP). To ensure the sustainable development of clean energy, it is essential to assess the environmental impact of the AOWPHP. This study employs a life cycle assessment (LCA) methodology to evaluate the environmental impacts of the AOWPHP using QDQ2-1 alkaline electrolyzer technology in China. Furthermore, a scenario analysis is conducted to project these environmental impacts over the next 30 years. The findings indicate the following: (1) The global warming potential (GWP) over the life cycle is 5614 kg CO2-eq, the acidification potential (AP) is 26 kg SO2-eq, the human toxicity potential (HTP) is 12 kg DCB-eq, and the photochemical ozone creation potential (POCP) is 3.77 × 10⁻⁶ kg C2H4-eq. (2) Carbon emissions during the production stage significantly contribute to the environmental impact, with steel and concrete being notably polluting materials. The POCP shows high sensitivity at 0.97%, followed by the GWP and AP. (3) The scenario analysis indicates an upward trend in environmental impacts across low-speed, baseline, and high-speed development scenarios, with impacts peaking by 2050. For instance, under the high-development scenario in 2050, the GWP for each material reaches 41,808 kg CO2-eq. To mitigate these impacts effectively, recommendations include reducing reliance on steel and concrete, developing green logistics, enhancing operational efficiency in wind farms and hydrogen production plants, and exploring new epoxy resin materials. These insights are crucial for promoting sustainable growth within the AOWPHP in China while reducing global carbon emissions.
1. Introduction
According to the International Energy Agency’s (IEA) World Energy Outlook 2020 Edition, global CO2 emissions are projected to reach approximately 26.5 billion tons by 2030, then decrease to 10 billion tons by 2050, and eventually achieve net-zero emissions by 2070 based on existing and ongoing infrastructure. However, this trajectory is expected to result in a global temperature increase of 1.65 °C [1]. In recent years, China has been dedicated to regulating fossil fuel use and actively promoting the production and utilization of renewable energy sources to mitigate energy scarcity and address global warming issues [2].
To achieve these goals, it is essential to transition from traditional fossil fuels to renewable energy sources. This shift is necessary due to the detrimental impact of fossil fuels on the global climate and ecology, as well as the need for resource recycling [3]. Moreover, renewable energy is crucial for fostering social justice and can significantly reduce carbon dioxide emissions and pollution [4,5]. It is evident that the Chinese government prioritizes renewable energy production and is accelerating the country’s energy transition. By the end of 2022, wind power had an installed capacity of 3650 GW, with power generation reaching 7,627,000 GW, accounting for 8.6% of all renewable energy generation [6]. Wind power has become China’s third-largest source of electricity and a cornerstone of clean energy consumption [7]. In 2023, China added 75.9 million kilowatts of new wind power to the grid, an increase of 102% year-on-year [8]. The rapid growth in wind power installation has increased the proportion of clean energy in China’s power grid but also presents higher requirements for wind power consumption in the country.
Wind power generation is generally concentrated at night, whereas peak electricity consumption typically occurs during the day [9,10]. When a substantial amount of wind power is wasted during off-peak hours, this is referred to as wind power abandonment [11,12]. Specifically, in this paper, abandoned power generation refers to wasted wind power. In 2020, the national average wind power wastage rate was 3%, with Xinjiang at 10.3%, Gansu at 6.4%, and western Inner Mongolia at 7% [13]. A total of 16.6 billion kWh of wind electricity was wasted in 2020 [13]. The rate of wind power abandonment slightly decreased to 3.1% in 2021 [14] but rose again to 3.2% in 2022 [6]. Wind abandonment has become a significant barrier hindering the growth potential of wind power in China.
Various solutions to the issue of wind curtailment include battery storage, pumped hydro storage, and compressed air storage [9,15,16,17]. However, the widespread adoption of most energy storage technologies is hindered by their high costs [16,17]. On the other hand, hydrogen has extensive real-world applications [18], and its demand has significantly increased. Currently, there are several methods to produce hydrogen, such as steam methane reforming (SMR), the partial oxidation of methane (POM), auto-thermal reforming (ATR), electrolysis, and biomass gasification, with efficiencies ranging from 70 to 85%, 55 to 75%, 60 to 75%, 50 to 70%, and 35 to 50%, respectively [19,20]. Utilizing abandoned wind power to produce hydrogen has been widely recognized as a solution to address both wind and power abandonment issues. In response to these challenges, the National Development and Reform Commission and the National Energy Administration have issued an “Implementation Plan for Addressing Wind Power Curtailment”, which emphasizes strategic deployment in renewable energy-rich regions to encourage the construction of hydrogen production facilities powered by excess wind energy and other priority consumption methods for renewable energy sources [21]. The abandonment of onshore wind power for hydrogen production (AOWPHP) represents a critical technological solution to mitigate wind power constraints and enhance the reliability and stability of wind power supply [11,12,22], positioning it as a primary focus for future efforts in clean energy transition.
Wind and hydrogen are indeed cleaner energy sources compared to fossil fuels like coal and oil [23]. However, it is crucial to assess whether electricity generated by wind turbines can be classified as entirely “green” in terms of environmental impact. Similarly, we need to examine whether hydrogen production from wind energy can achieve zero pollution and emissions. It is evident that the entire process of utilizing wind power for hydrogen production will impact the environment due to factors such as the materials used in manufacturing and energy consumption during transportation [24,25]. Therefore, evaluating the environmental impact of the AOWPHP throughout its life cycle has become a critical concern.
This paper integrates research and industry data, employs a life cycle assessment methodology, develops a life cycle inventory for the AOWPHP, evaluates its environmental impacts, identifies environmental impact categories and sources, and analyzes the primary materials contributing to environmental pollution. Furthermore, it conducts a sensitivity analysis of these materials to understand their varying environmental impacts under different scenarios. Lastly, this paper models and forecasts environmental effects over the next 30 years to provide insights for the sustainable development of the AOWPHP.
2. Literature Review
2.1. Study on WPHP
Scholars have primarily focused on investigating the technological feasibility, economics, and model optimization of wind power-to-hydrogen production (WPHP). Komorowska et al. developed a Monte Carlo-based framework to assess the competitiveness of offshore wind power-to-hydrogen systems and applied it in a case study in Poland, demonstrating its utility [26]. Seyyed et al. from Iran examined the impact of wind power siting on hydrogen production using geographic information systems (GISs) and a multiple-criteria decision-making methodology, concluding that the GIS-AHP methodology is valuable for identifying optimal hydrogen production sites [27]. Stepan et al. evaluated the resource potential of wind power–hydrogen energy in Ukraine and determined that Ukraine could potentially develop 688 GW of wind farms, capable of producing 43 megatonnes of green hydrogen annually through electrolysis [28]. Cheng et al. investigated the role of offshore wind power in renewable energy hydrogen generation in Australia [29]. Omar et al. from Ireland conducted a feasibility assessment of large-scale floating offshore wind power stations for hydrogen generation, emphasizing the importance of selecting appropriate locations for water electrolysis facilities based on user proximity [30]. Niklas et al. from Germany examined three water electrolysis technologies—alkaline, solid oxide, and polymer electrolyte membrane—and their implications for hydrogen generation [31]. Kiryanova et al. from Russia studied the impact of energy prices on the efficiency of wind power-to-hydrogen production [32].
Scholars have conducted extensive research on the economics of wind power-to-hydrogen production. Depending on the location of the wind power plant, it can be categorized as onshore or offshore. Ahmadi et al. identified Sangn as the optimal location for a wind hydrogen plant in Afghanistan, with a production cost of USD 1.4527 per kilogram of H2 [33]. Mohamed et al. indicated that Cairo, Aswan, Asyout, and Mersa Matruh in Egypt have potential for wind power-to-hydrogen production, with production costs ranging from 4.54 USD/kg to 7.48 USD/kg and overall system efficiencies between 7.69% and 9.37% [34]. Hasan et al. found that Basrah in Iraq achieved the highest hydrogen production at 49,150 m3H2/year, with a production cost of 0.752 USD/m3H2 when surplus energy was sold to the grid [35]. Han et al. from China examined the economic, environmental, and social benefits of wind power-to-hydrogen production using the Cloud Multimoora technique, highlighting significant potential but also the need for additional investment [36]. Leonhard et al. from Austria calculated the levelized cost of hydrogen ranging from 3.08 EUR/kg to 13.12 EUR/kg, emphasizing the impact of renewable energy capacity factors and full-load hours of electrolyzers on costs [37]. Haeseong et al. from Korea conducted an economic analysis on renewable energy and electrolysis, finding that alkaline electrolysis from onshore wind power had the lowest levelized cost at USD 25.13 per kilogram and emphasizing the role of renewable energy capacity factors in cost determination [38].
Tiago et al. from Portugal conducted a scenario analysis on the techno-economics of hydrogen production from floating offshore wind power stations in the Atlantic Ocean. They concluded that utilizing wind power during off-peak hours, coupled with the sale of oxygen, yields greater economic benefits [39]. The ratio of the hydrogen production unit’s power to the wind farm’s capacity was identified as a crucial factor affecting hydrogen production [40]. Quang et al. conducted an economic study on an offshore wind power hydrogen generation project in Ireland and found that the levelized cost of hydrogen (LCOH) in 2030 varies geographically by over 50% depending on the location [40]. To shorten the payback period, Camilla et al. from Italy recommended setting the electrolyzer capacity between 80% and 90% of the wind farm’s capacity [41]. Moreover, to maintain a payback period within 11 years, the wind farm’s capacity should exceed 150 MW, with a fixed hydrogen price of 6 USD/kg [41]. Zetao et al. investigated the economics of hydrogen generation from offshore wind power stations in Guangdong Province, China. They reported greenhouse gas (GHG) emissions ranging from 4.6 to 19 g CO2-eq/kWh and suggested that increasing the unit’s capacity could potentially reduce the GHG emissions per kWh [42]. Song et al. from China examined the cost of hydrogen generation, encompassing production, storage, conversion, transportation, and disposal at the destination [43]. Luo et al. studied the techno-economics of offshore wind power hydrogen production in southern China and concluded that advances in electrolyzer technology will make offshore wind power hydrogen production more economically feasible [44]. Torbjørn et al. from Norway found that a 1.852 MW electrolyzer could produce a maximum of 17,242 kg of hydrogen, achieving a minimum hydrogen production cost of 4.53 USD/kgH2, with system efficiencies ranging from 56.1% to 56.9% in all scenarios [45].
Umar et al. from the USA improved microgrid scheduling by incorporating considerations for the state of charge and lifetime of energy storage devices [46]. Dohyung et al. developed a scheduling model for an ideal wind–hydrogen system that integrates the efficiency of wind-powered hydrogen production. They employed the artificial bee colony method to optimize hydrogen production power. Their proposed control strategy has the potential to increase hydrogen production by 6.18 tons and enhance efficiency by 4.8%, providing a theoretical basis for the widespread adoption of hydrogen energy storage systems in the power grid [47].
2.2. Environmental Impact Study of WPHP
Researchers have extensively investigated the environmental consequences of hydrogen production, particularly focusing on the impact of wind-powered hydrogen production (WPHP) on global greenhouse gas emissions. Mathieu et al. conducted a life cycle assessment study involving 21 electrolytic hydrogen generation systems, including WPHP, highlighting that virtually all assessments consider global warming [48]. They identified wind power systems as the primary contributor to global warming, with electrolyzers showing minimal impact [48]. Similarly, Suleman et al. compared the environmental implications of using wind power versus natural-gas steam methane reforming for hydrogen production, concluding that wind power has fewer negative environmental effects [49]. Renewable power generation systems, such as hydroelectricity, wind, and photovoltaic methods, have been identified as potential mitigators of environmental impacts associated with hydrogen production [50,51]. Zhao et al. conducted a comprehensive “cradle-to-grave” life cycle study of hydrogen generation from water electrolysis using wind power and polymer electrolyte membranes, assessing the environmental implications throughout production and usage [52]. Their findings indicated that dispersed wind-powered hydrogen production resulted in significantly lower CO2-eq emissions during operation compared to other production technologies [53].
Reiter et al. explored the impact of converting excess electricity from stored renewable sources, like wind power, into hydrogen using power-to-gas technology, focusing on its global warming potential [54]. They found that the greenhouse gas emissions associated with this process are approximately 600 g CO2-eq/kgH2 [54]. Samane et al. investigated the environmental consequences of hydrogen production through wind power electrolysis, examining how various parameters of WPHP influence the greenhouse gas footprint [51]. Their study estimated that the overall greenhouse gas emissions from a wind-powered hydrogen production project were approximately 0.68 ± 0.05 kg CO2-eq/kgH2, with the wind power system contributing 65% of the total emissions, primarily during the manufacturing stage [51]. Additionally, Cetinkaya et al. provided an estimate of approximately 970 g CO2-eq/kgH2 for the CO2-equivalent emissions from wind-powered hydrogen generation [55]. Superchi et al. introduced a green index for hydrogen and assessed the techno-economic feasibility of WPHP in heavy industry, using the steelmaking sector as a case study. They found that under optimal conditions, the emission intensity associated with steel production could potentially be reduced to 235 kg CO2/tonne of steel compared to conventional methods [56].
Existing studies play a crucial role in advancing WPHP, yet further research is essential. While extensive research exists on the technical feasibility, economics, system optimization, site selection, and energy analysis of WPHP, there remains a notable gap in understanding its environmental impacts beyond carbon emissions. Few studies have comprehensively examined the entire life cycle from wind power to hydrogen, incorporating diverse input and output data to evaluate carbon emissions. China, as the world’s most populous developing country, places significant emphasis on developing new energy sources. Therefore, it is imperative for research to focus on the environmental implications of WPHP within China. Addressing these implications will not only contribute to global trends in new energy development but also support China’s sustainable energy transition goals.
This paper utilizes a life cycle assessment methodology to examine the environmental impacts of the AOWPHP in China. The assessment covers the global warming potential (GWP), acidification potential (AP), human toxicity potential (HTP), and photochemical ozone creation potential (POCP) across the entire process from raw material extraction to hydrogen generation. Furthermore, this study employs a scenario analysis to forecast the environmental impacts of the AOWPHP in China over the next 30 years. It aims to provide insights into future trends and proposes countermeasure suggestions to mitigate global warming effects. These measures are essential for promoting the sustainable development of renewable energy in China and aligning with global carbon reduction goals.
The contributions of this paper are as follows: (1) From a research perspective, this paper uses national-level average data for the AOWPHP as a basis while considering regional variations to comprehend macro-level environmental impacts and enrich the existing literature. (2) This paper specifically focuses on analyzing the GWP, AP, HTP, and POCP related to the AOWPHP. (3) In order to support China’s goal of achieving double carbon targets, a scenario analysis is conducted to project environmental impacts over the next 30 years. This clearly illustrates various trends in environmental impacts and serves as a valuable reference for decision makers involved in the AOWPHP.
3. Methodology and Data
3.1. Goal and Scope Definition
This paper aims to achieve the following specific objectives: (1) Identify key processes and substances responsible for carbon emissions in wind-powered hydrogen production, analyzing the sensitivity of these substances; (2) conduct a scenario analysis to project the environmental impacts of China’s AOWPHP by 2050; (3) propose strategies to reduce carbon emissions.
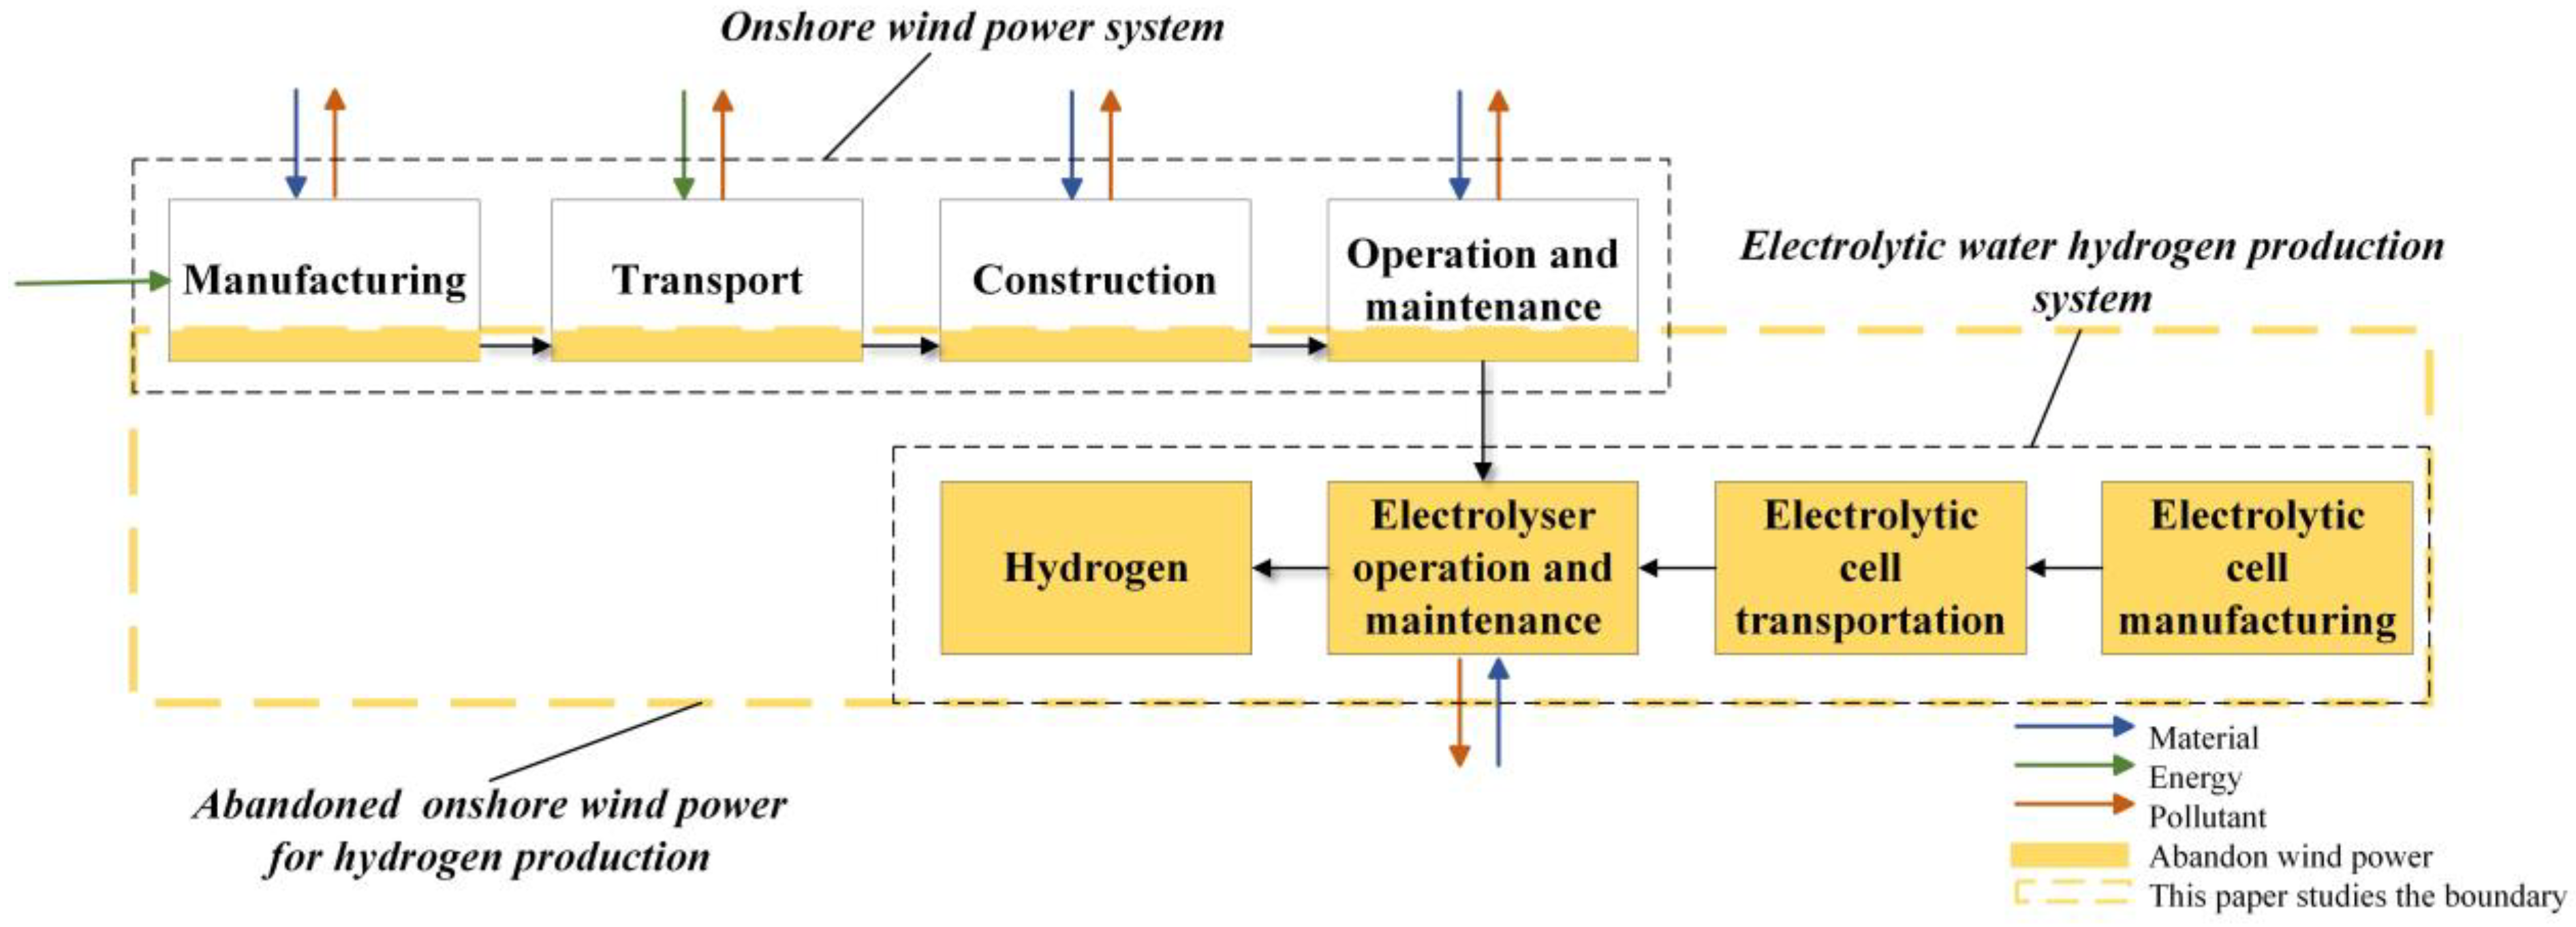
This study defines the research scope of the wind power hydrogen production project from “cradle to gate”, encompassing wind power generation through water electrolysis for hydrogen synthesis. To comprehensively assess the AOWPHP, the project is segmented into two subsystems: wind power generation and water electrolysis for hydrogen production. Data on material consumption, energy use, and pollutant emissions are collected and analyzed for each subsystem to determine the overall environmental impact, as depicted in Figure 1.

Figure 1.
The study boundary of the AOWPHP in this study.
This paper aims to accurately identify pollutant emissions across different stages of the entire wind power project life cycle. The life cycle is divided into four phases: the production and manufacturing of wind turbine components, transportation, installation and construction, and operation and maintenance. Data collection and summarization are conducted separately for each phase. The electrolyzer serves as the key component in the water electrolysis system. This study specifically focuses on data collection for three phases: electrolyzer production and manufacturing, transportation, and water electrolysis for hydrogen production.
The functional unit in this study measures the system’s input and output data relative to the production of 1 kgH2. It serves as a reference for assessing the associated input and output data, specifically focusing on pollutant emissions from the materials and energy used to produce 1 kgH2.
3.2. Data Representativeness
This study aims to comprehensively assess the environmental impacts associated with industrial hydrogen generation utilizing wind power and alkaline electrolyzers in China during the year 2020. This study requires extensive data from diverse sources. Data sources include authoritative bodies such as the National Bureau of Statistics, the Ministry of Industry and Information Technology, China Electricity Council, China Iron and Steel Industry Association, China Fiberglass Industry Association, and China Concrete and Cement Products Association. Additionally, information from the product design literature of representative enterprises, design specifications, material balance sheets, industry reports, and national standards is utilized. For calculating material and energy consumption, emission coefficients, and energy consumption coefficients of various raw materials, the IPCC report “Global Climate Change and Greenhouse Gas Inventory Methodology”, core journal research papers from domestic and international sources, and the Chinese Life Cycle Database (CLCD) are predominantly referenced. Relevant normative documents such as the Technical Specification of Wind Power Plant Design (DL/T 5383-2007) [57], are also consulted [58]. In establishing the model, considerations are made for energy and material losses during the production process. Currently, this paper does not incorporate these losses, focusing instead on available data and established methodologies.
3.3. Inventory Analysis
3.3.1. Wind Power System Inventory Analysis
The wind power system plays a crucial role in the wind energy hydrogen generation project. Xinjiang Goldwind Science & Technology Co., Ltd. (Xinjiang, China) stands out as a leading manufacturer of wind turbines, with its GW121-2.5 MW turbine type having the highest installed capacity in 2020, as reported on its official website. Accordingly, the wind farm is assumed to comprise 30 GW121-2.5 MW turbines installed on 103 m high towers, with an annual power output of approximately 21.9 GWh over a 20-year operational lifespan. A wind turbine consists of several components including a tower, nacelle cover, generator, blades, wind measuring system, and electronic control system. The technical specifications of the GW121-2.5 MW wind turbine, sourced from the manufacturer, are detailed in Table 1.

Table 1.
GW121-2.5 MW wind turbine technical indicators.
- (1)
- Manufacturing phase
During the manufacturing phase, from raw material acquisition to production and molding, the environmental impact of critical components is significant. Pollutant emissions vary depending on material composition, processing procedures, and technological advancements. Table 2 presents inventory data for each component during the manufacturing stage.
Table 2.
List of material and energy consumption data in manufacturing stage of wind power system.
- (2)
- Transportation phase
Environmental impacts during the transportation phase primarily stem from fuel or energy consumption (e.g., diesel, gasoline, electricity). In this study, it is assumed that domestic wind turbines are transported by road trucks fueled by diesel, avoiding sea transport to reduce manufacturing and supply costs and overall project expenses. The average transportation distance from raw material sources to equipment manufacturers and from wind turbine factories to installation sites is estimated to be 1000 km.
- (3)
- Installation construction phase
The construction phase of the wind power project considered in this study involves two main aspects: the wind farm itself and the associated network infrastructure. This includes tower foundation construction, turbine installation, substation foundation construction, and cable installation [59,60]. Concrete and steel bars are the primary raw materials used in tower foundations and substation infrastructure.
- (4)
- Operation and maintenance phase
This study assumes the project will meet its designed operational life of 20 years. As of 2022, the national power line loss rate stands at 4.84% [61]. During the operational phase, approximately 15% of the energy and material usage is estimated relative to the production phase [62,63,64].
3.3.2. Inventory Analysis of Electrolyzed Water System
A universal alkaline hydrolysis tank is selected as the central equipment for generating hydrogen from electrolyzed water in this study. The analysis focuses on scheduled maintenance, energy consumption, and emissions, excluding unexpected maintenance and overhauls. The hydrogen generation process involves immersing the electrolyzer in an alkaline water electrolyte solution. Inventory data for the production, transportation, and operational stages of the electrolyzer equipment are summarized and analyzed. Table 3 presents the technical specifications of the QDQ2-1 alkaline electrolyzer.
Table 3.
QDQ2-1 alkaline water electrolyzer technical parameters.
- (1)
- Manufacturing phase
The electrolyzer primarily consists of electrodes and diaphragms, which divide it into an anode compartment and a cathode compartment separated by a diaphragm. Typically, a 30–40% KOH solution is used as the electrolyte. The anode is commonly made of nickel or steel coated with nickel, while the cathode is typically constructed from steel activated with various catalyst coatings (refer to Table 4).
Table 4.
List of material and energy consumption in manufacturing phase of electrolyzer.
- (2)
- Transportation phase
This study assumes road transportation mode, with trucks fueled by diesel carrying the raw materials and electrolyzer equipment. The average transportation distances are estimated to be 600 km from the electrolyzer raw material sources to the equipment manufacturer and 400 km from the equipment manufacturer to the wind farm. Other transportation data align with those of the wind power system.
- (3)
- Operation and maintenance phase
As per standard operational specifications, the electrolyzer equipment requires comprehensive maintenance every 7–15 years, involving electrode replacement and diaphragm reactivation. This study estimates that energy and material consumption during the operation and maintenance phase amount to 15% of the total consumed during the production phase. Table 5 details pollutant emission coefficients for each material.
Table 5.
Pollutant emission factors for various raw materials.
3.3.3. Inventory Analysis of AOWPHP
The total pollutant emissions of the wind power hydrogen production project comprise emissions from both the wind power generation and water electrolysis hydrogen production systems. This can be calculated using Formula (1), where the emissions are the product of activity data and various pollutant emission factors [73,74]. The specific calculations are expressed in Formulas (2) and (3) for each system, respectively.
Among them, represents various types of material and energy consumption throughout the life cycle. represents various types of pollutants such as CO2, CO, SO2, CH4, N2O, SOX, PM10, and NOX. represents life cycle stages such as production and manufacturing, transportation, installation, and operation. represents the total amount of pollutants emitted. represents the emission of species pollutants in the wind power generation system. represents the emission of species pollutants in the electrolytic water–hydrogen production system. represents the emission coefficients of species pollutants in the material consumption or energy consumption.
3.4. Characterization
Environmental effect outcomes are absolute values derived from the combination of released compounds via impact potential coefficients. The environmental effect equivalent factor is utilized in this study to quantify the environmental damages caused by CO, CO2, PM10, CO2, NOX, and CH4 emissions over the life cycle of wind power hydrogen generation. Equations (4)–(7) show the characterization formulae for each environmental impact category:
where: —GHG global warming coefficient;
—greenhouse gas emissions.
—acidification potential coefficient of emissions;
—acidifying pollutant emissions.
where: —coefficient of potential for human toxic effects of pollutants;
—emissions of pollutants from inventory data.
where: —POCP coefficients for different emitted substances causing photochemical smog;
—emissions of pollutants causing photochemical smog.
The characterization factors for each pollutant are shown in Table 6.
Table 6.
Characterization coefficients.
4. Results and Analysis
4.1. Key Process Analysis
As shown in Figure 2, the global warming potential accounts for 99% of the total environmental impact, with an environmental impact value of 5.61 × 10³ kg CO2-eq; the acidification potential is the next highest, with an environmental impact value of 2.57 × 101 kg SO2-eq. The human body toxicity potential is 1.24 × 101 kg DCB-eq; the photochemical ozone creation potential is 3.77 × 10⁻⁶ kg C2H4-eq. Among the four stages, manufacturing has the highest environmental impact, contributing 99% to the total, followed by transportation, operation and maintenance, and installation and construction, which has the lowest impact.
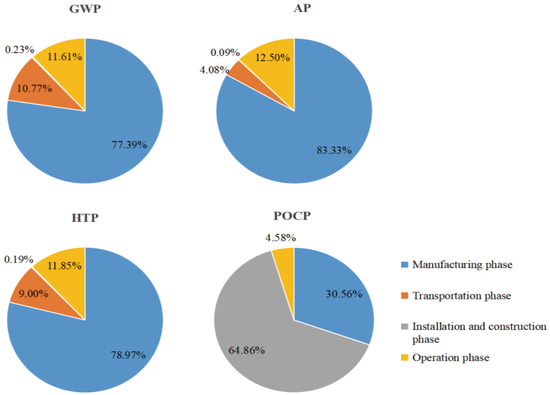
Figure 2.
Main environmental impacts and sources.
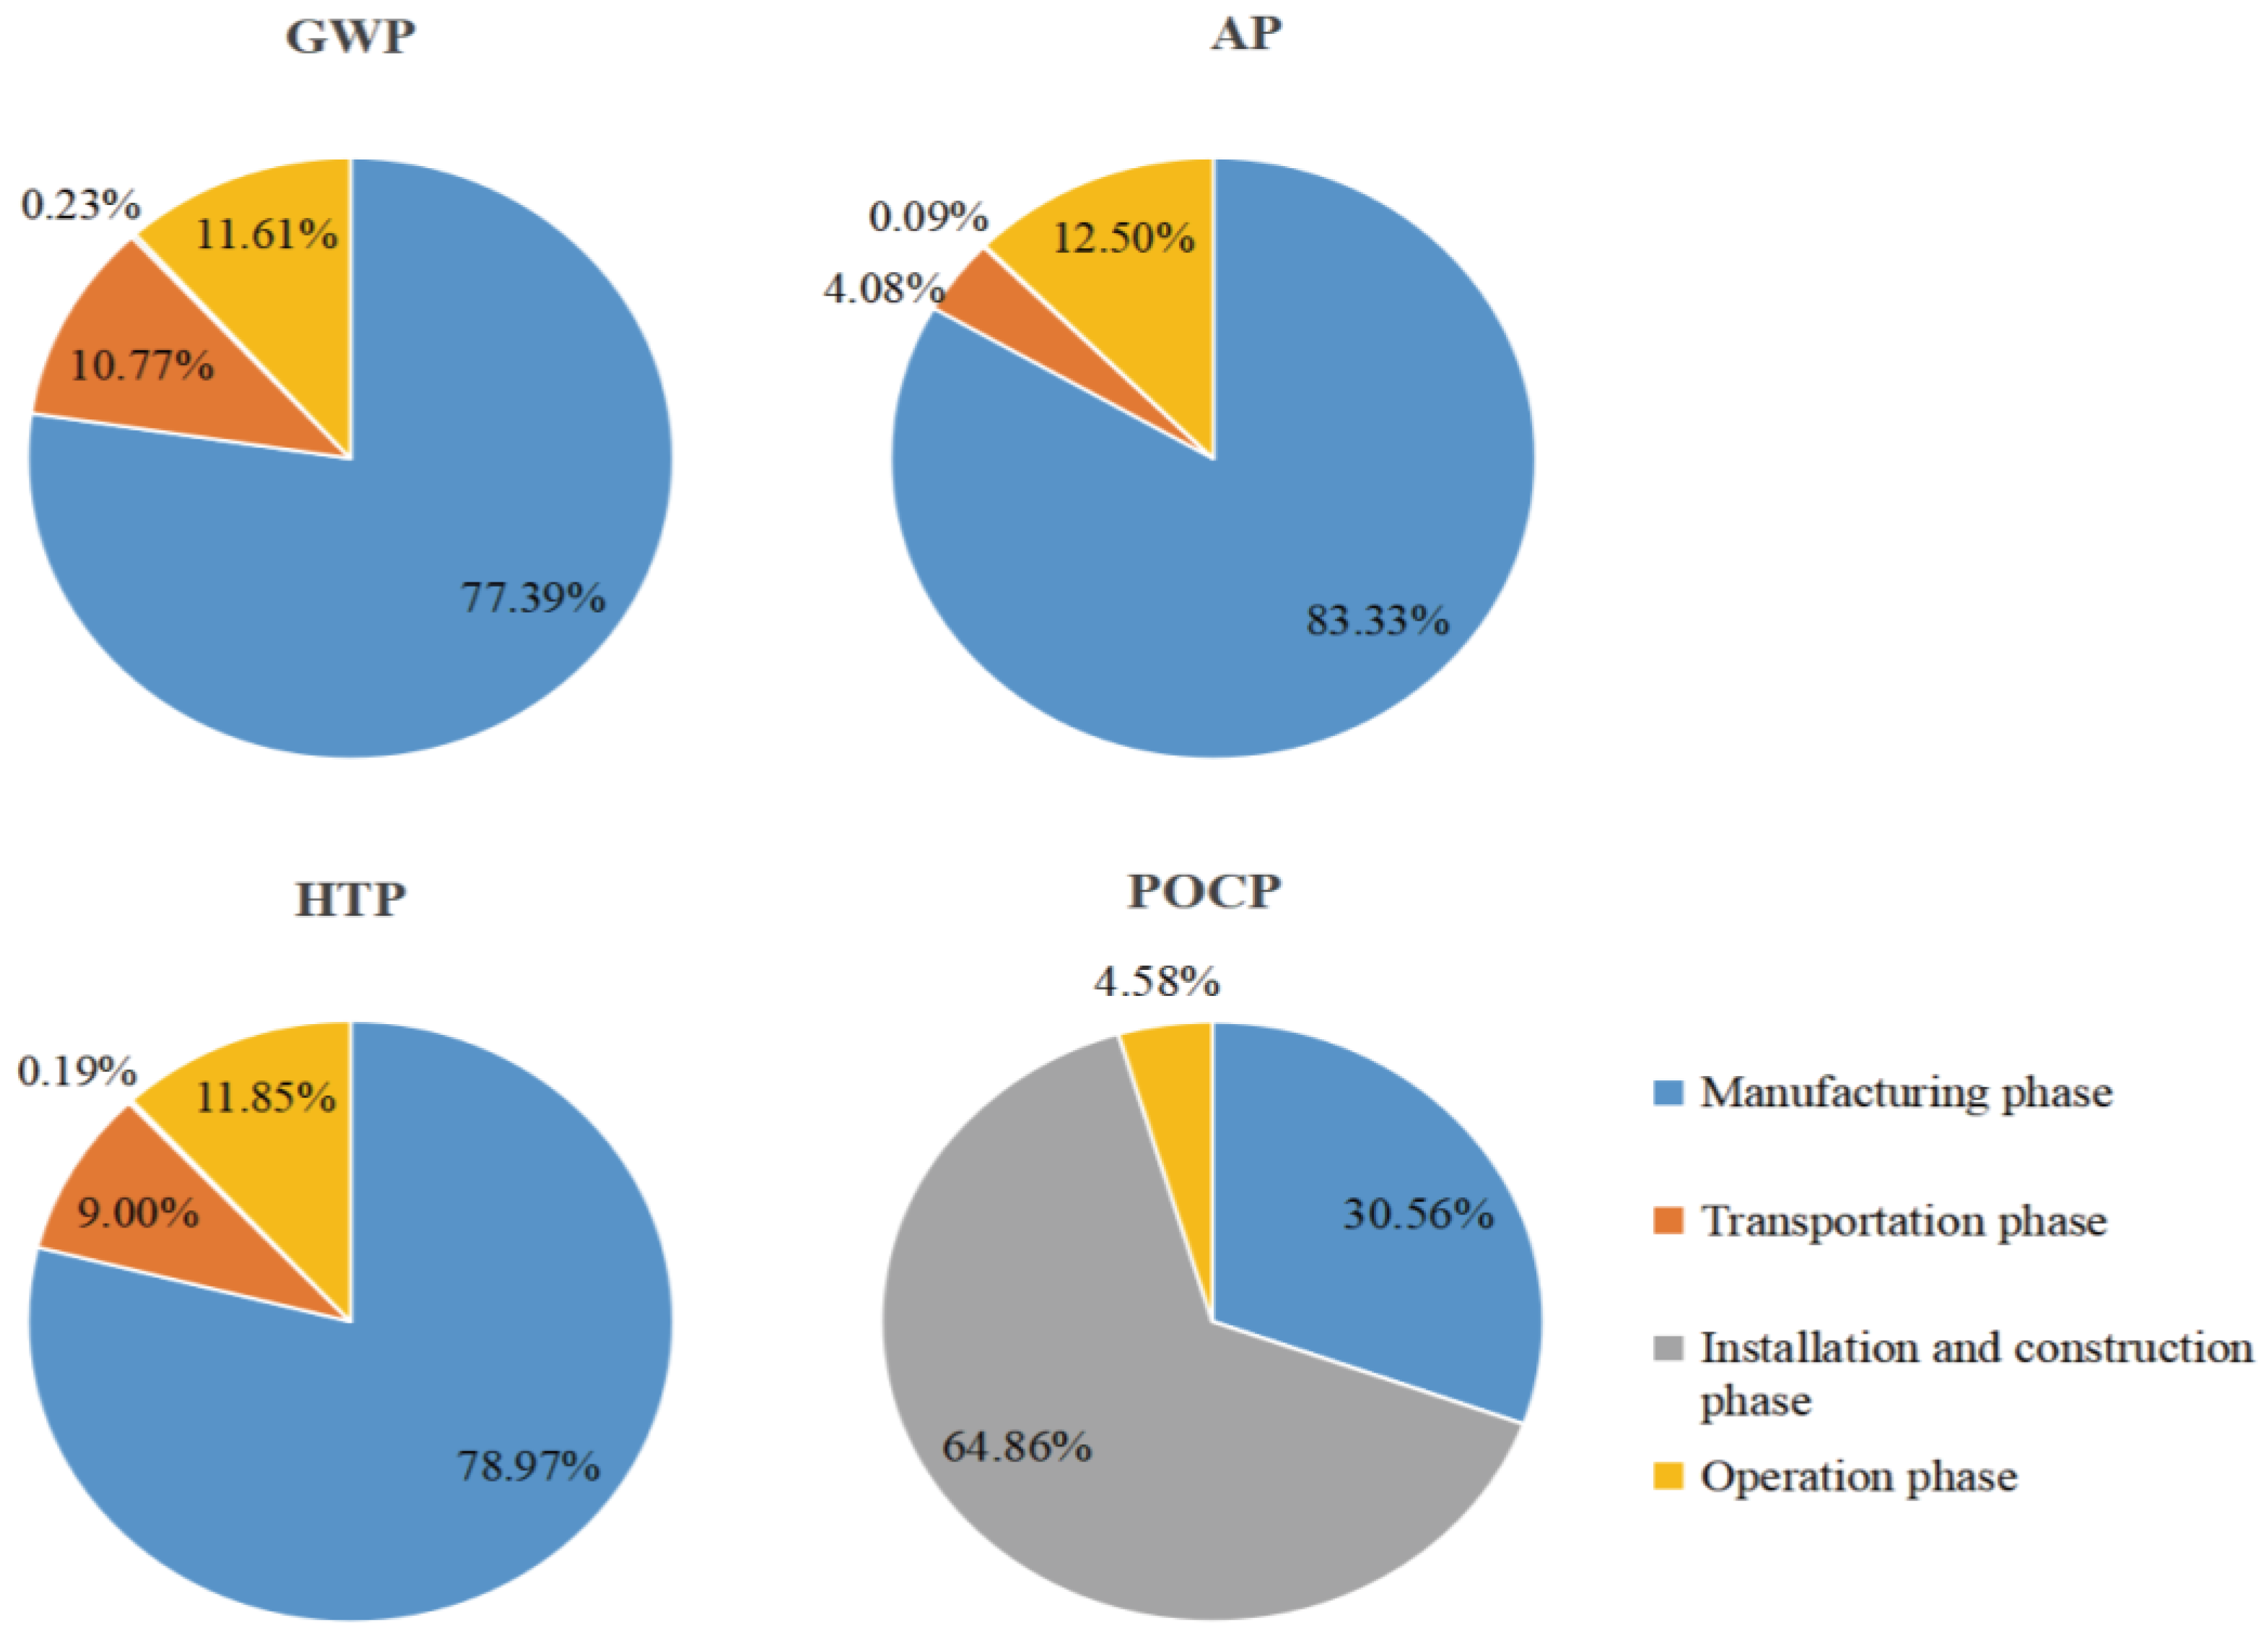
In Figure 3, the production, transportation, and operation phases are the primary contributors to the GWP, accounting for 99% of the overall environmental impact. Manufacturing is the primary source of the AP. The installation and construction stages show minimal environmental impact, primarily associated with photochemical pollution.
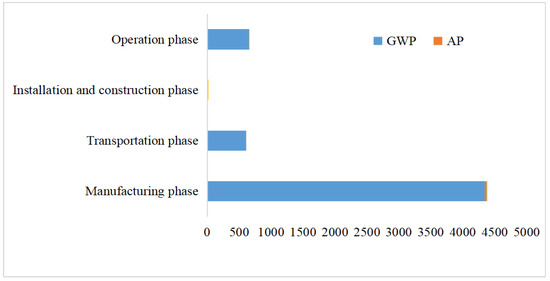
Figure 3.
Environmental impacts of activities in each phase.
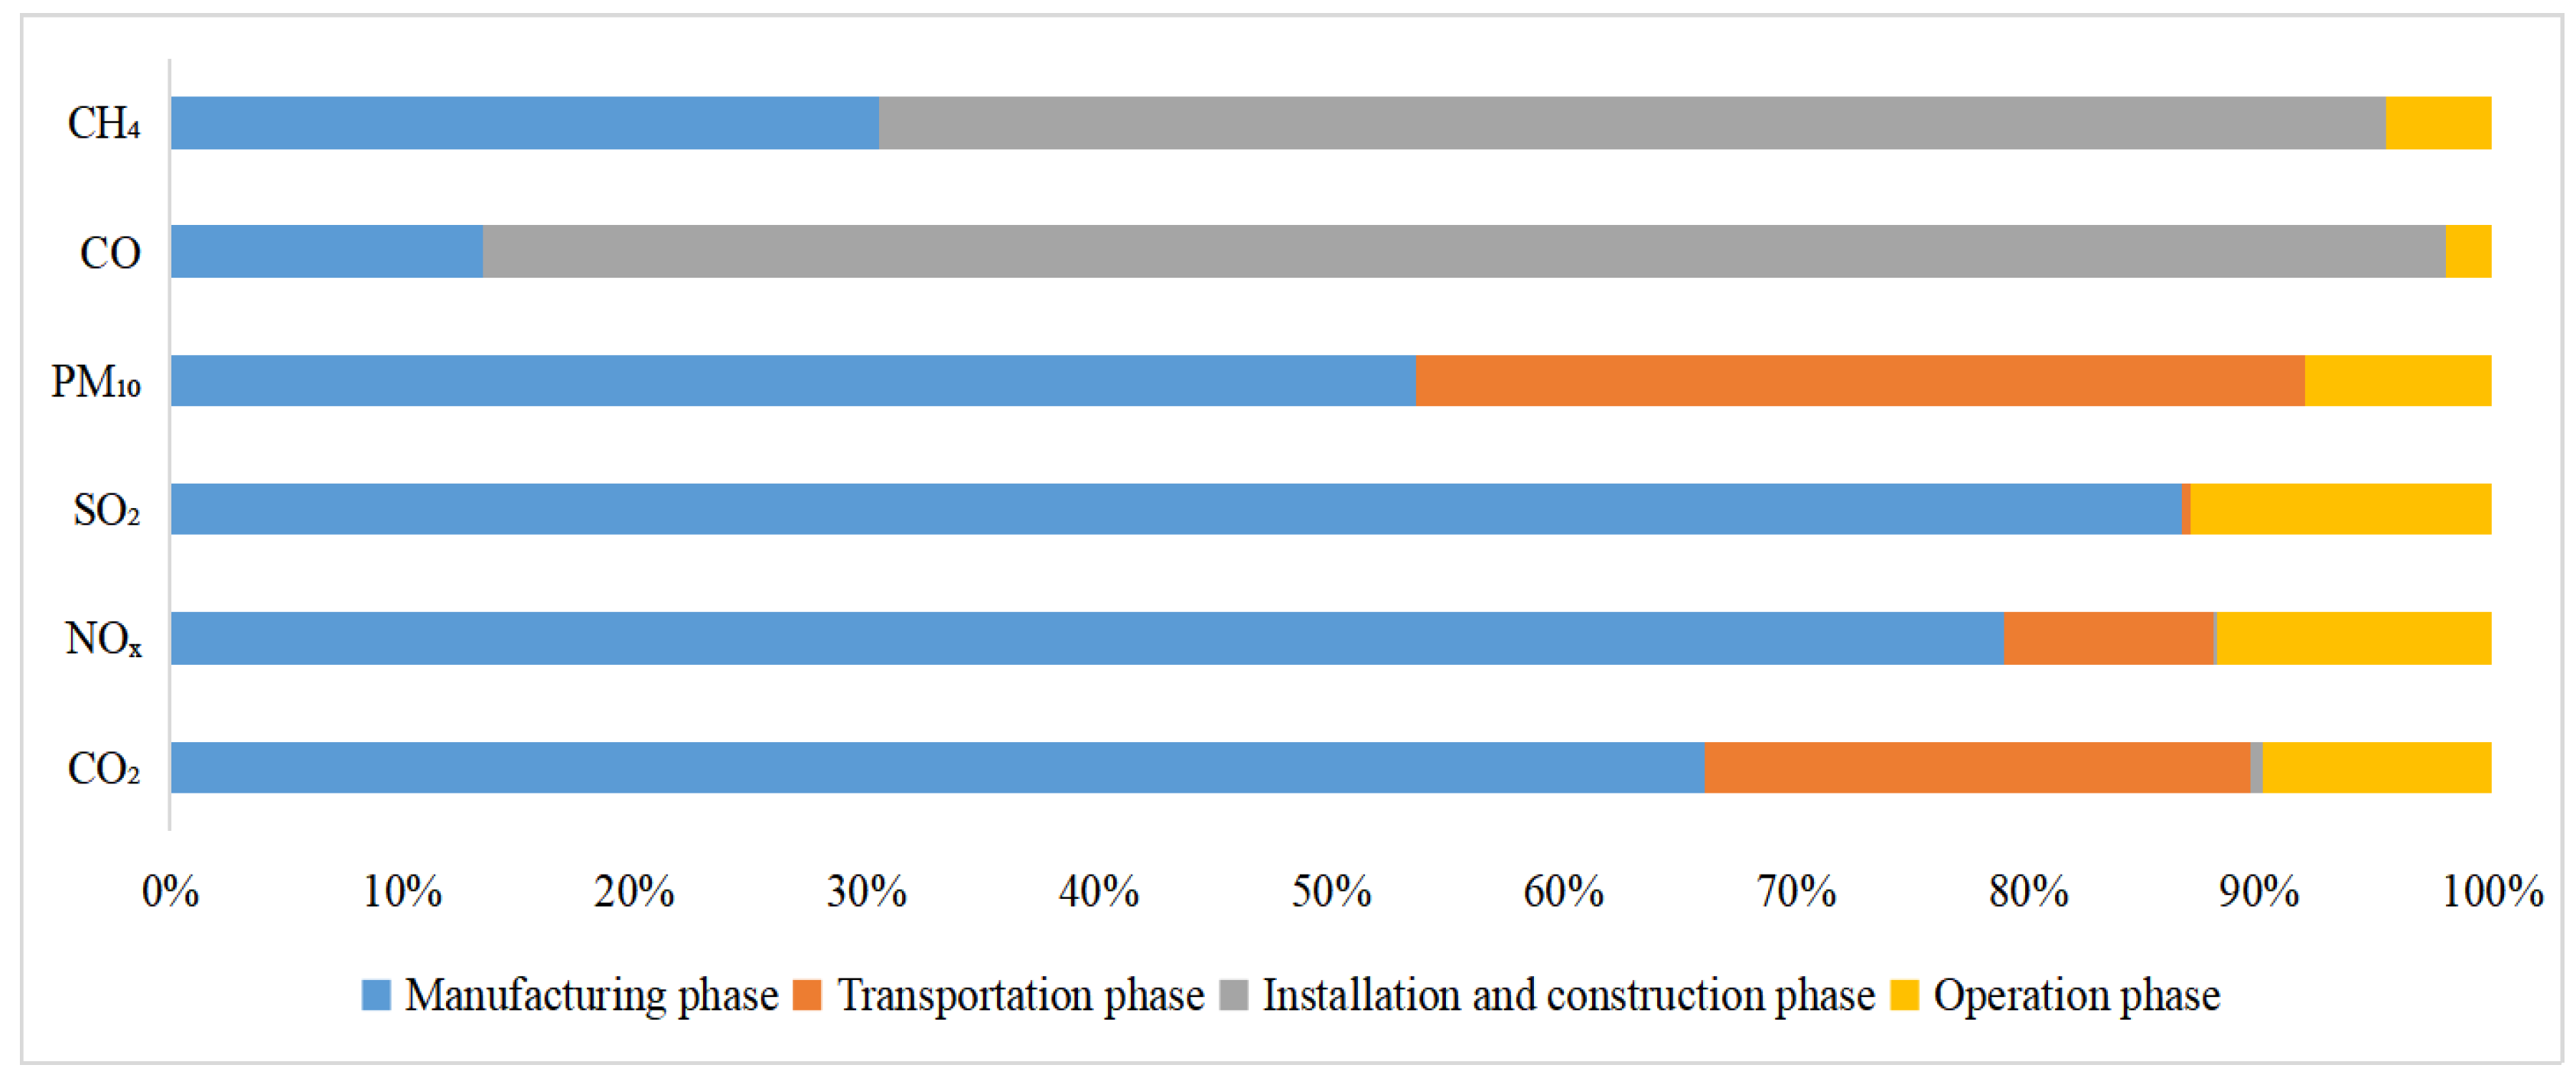
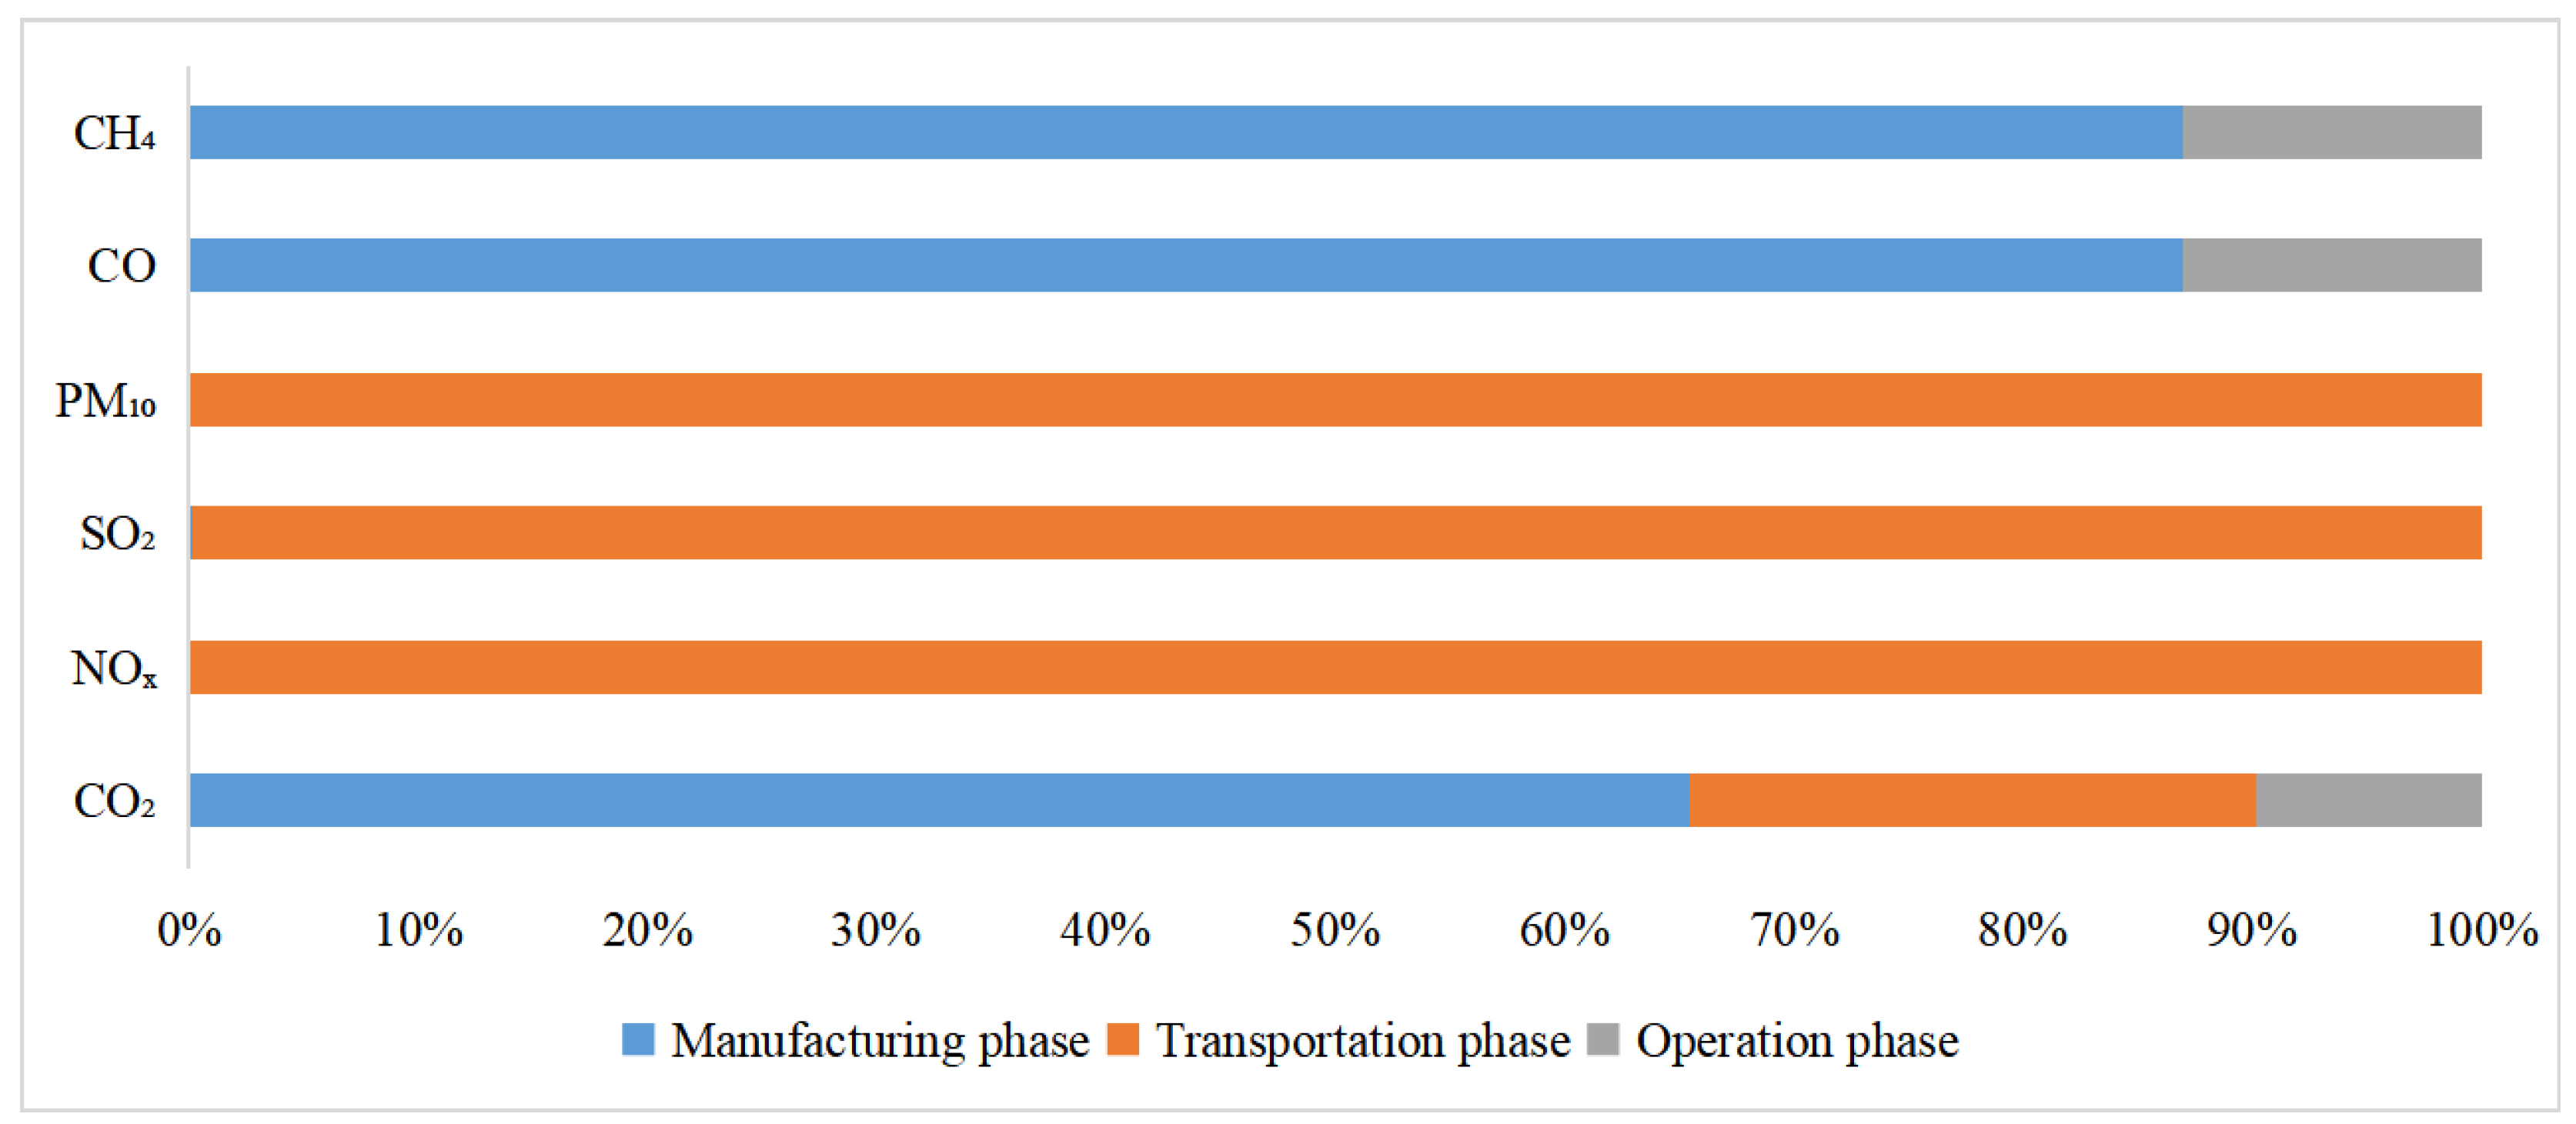
Figure 4 demonstrates that during the manufacturing phase, CO2, PM10, NOX, and SO2 emissions collectively account for more than 50% of the total project life cycle emissions. Transportation contributes significantly to PM10, CO2, and NOX emissions. During installation and construction, CO and CH4 are the predominant emissions, comprising over 60% of the total project’s life cycle. The operation phase produces all pollutants, with SO2, NOX, and CO2 being the top three contributors.
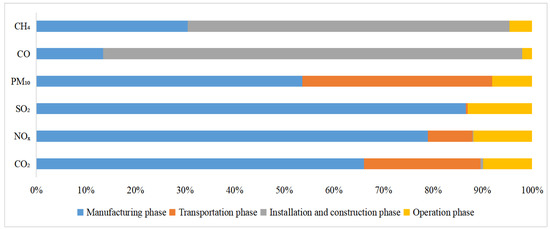
Figure 4.
Main emissions by phase.
The environmental implications of each of the two subsystems are depicted in Figure 5. The wind power system’s GWP, AP, HTP, and POCP are 4518 kg CO2-eq, 25 kgSO2-eq, 11 kgDCB-eq, and 3.77 × 10⁻⁶ kg C2H4-eq, respectively, while the electrolytic water-to-hydrogen system’s values are 1.10 × 10³ kg CO2-eq, 1.05 × 100 kg SO2-eq, 1.12 × 100 kgDCB-eq, and 3.18 × 10⁻⁹ kg C2H4-eq. When comparing wind power systems to electrolyzed water-to-hydrogen systems, wind power systems exhibit a higher environmental impact. This is primarily due to the energy-intensive nature of copper and steel used during production, along with diesel fuel consumption for transportation. The iron and steel industries are resource-intensive, demanding significant energy, water, and ore inputs, with coal representing 72.19% of total steel production. Additionally, electrolyzers significantly influence the acidification potential, global warming potential, and human toxicity potential.
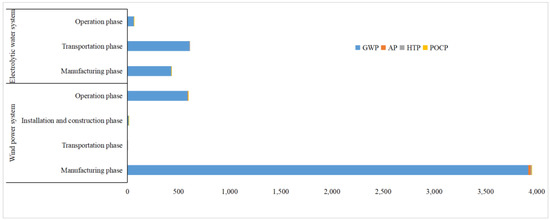
Figure 5.
Impact of subsystem activities on environment.
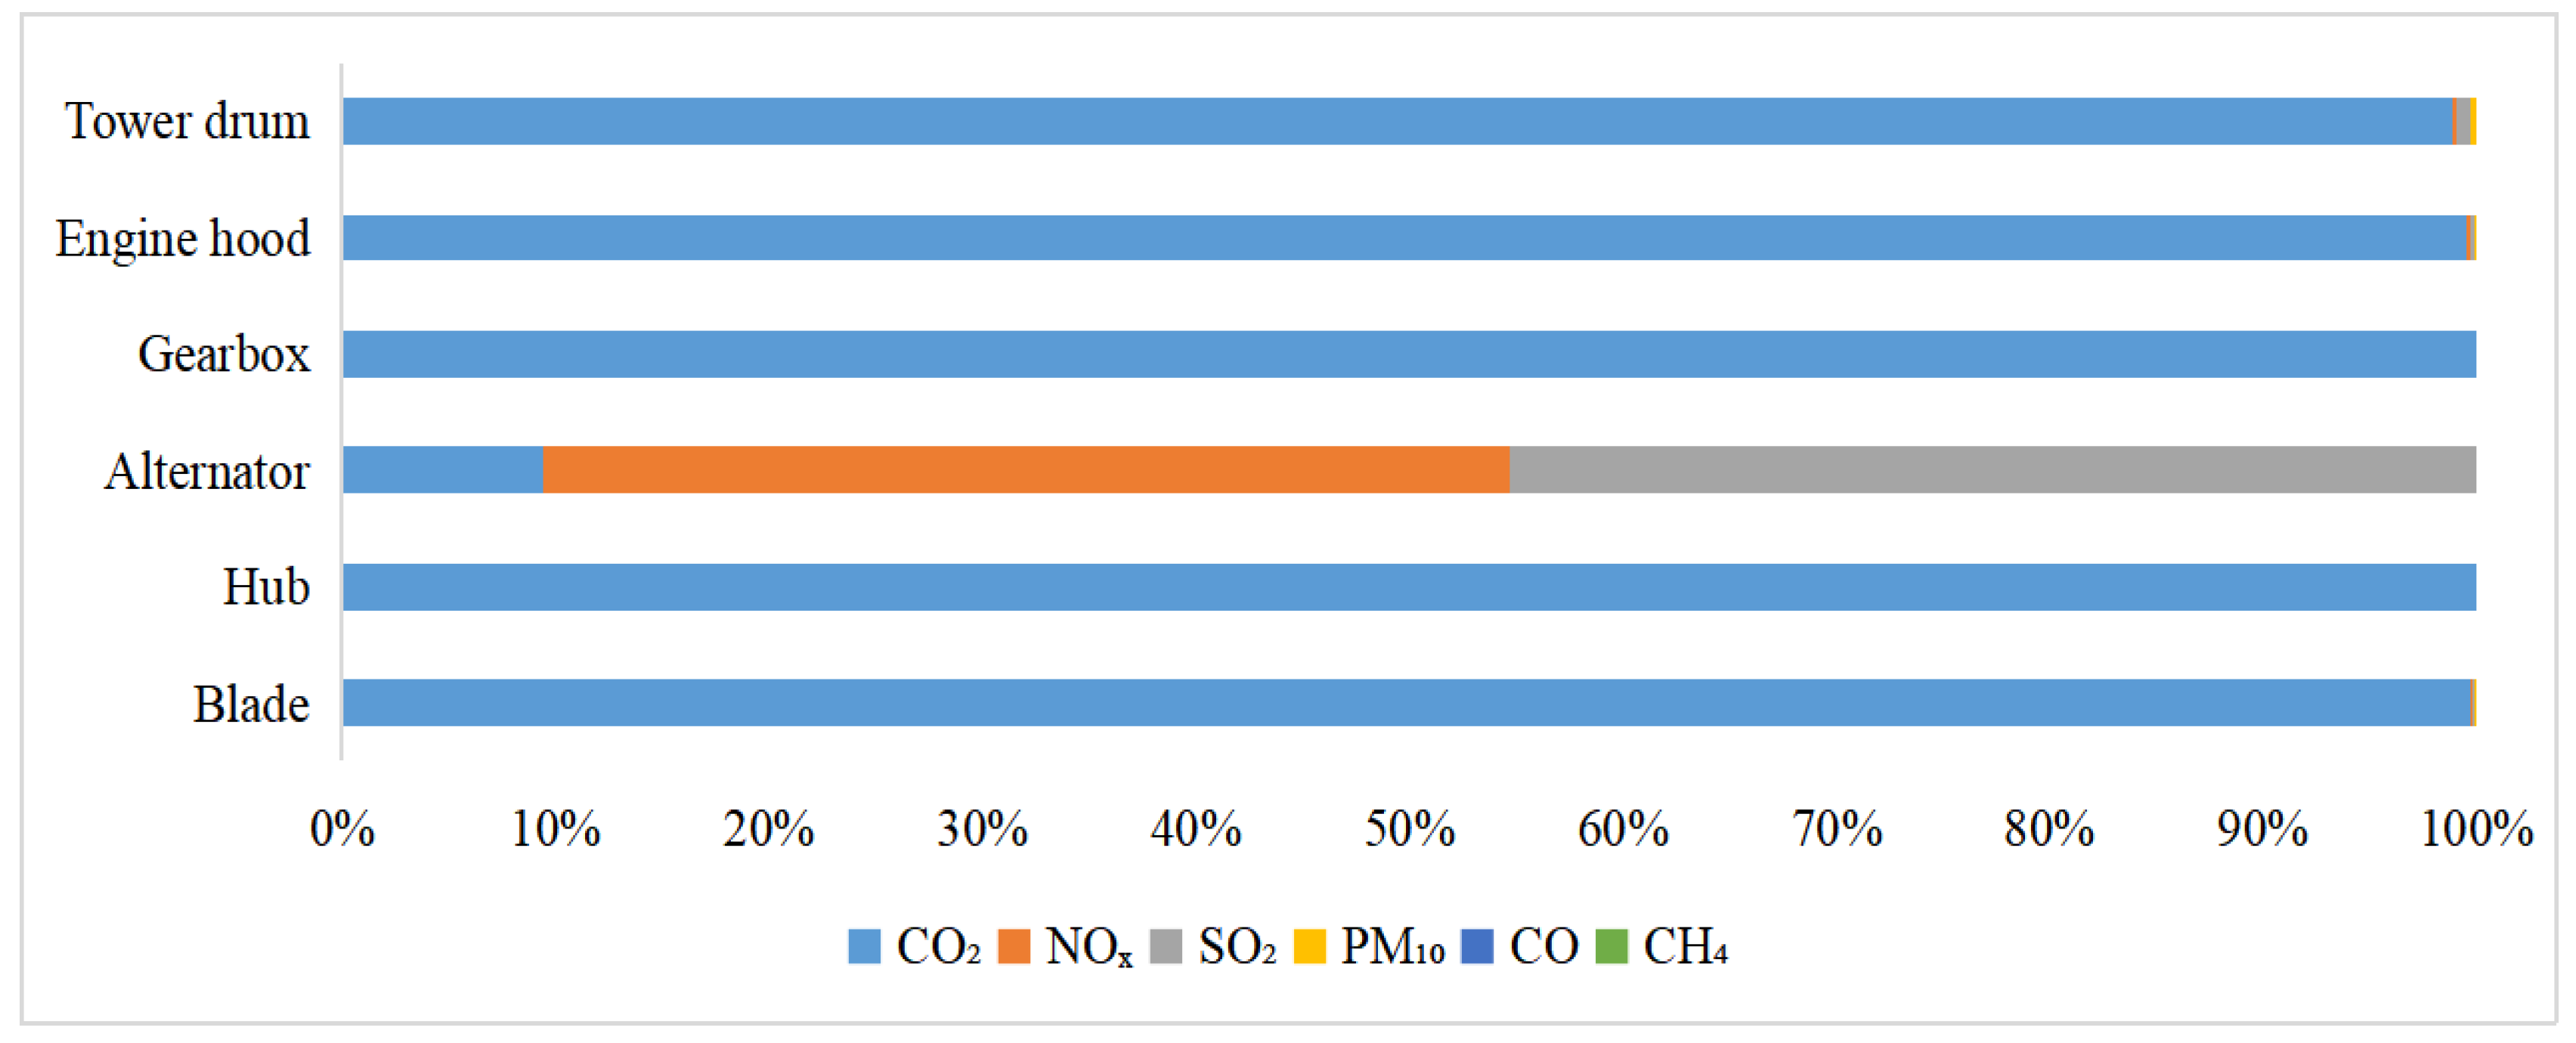
Following this, the wind power generation subsystem is examined. As shown in Figure 6, the manufacturing stage emerges as the predominant source of pollutant emissions, contributing over 80% of total emissions of CO2, NOX, SO2, and PM10. The transportation phase produces negligible pollutants. The installation and construction stages generate a significant amount of CO, CH4, and CO2. During operation, equal amounts of NOX, CO2, PM10, and CO2 are generated. Figure 7 examines the pollutant emissions from the six major components of the wind power subsystem. The tower, nacelle cover, gearbox, hub, and blades clearly constitute the largest contributors to CO2 emissions. The raw materials used in the tower, especially high quantities of steel, contribute significantly to CO2 emissions. The generator is the primary source of SO2 and NOX emissions, while the remaining components have minimal impact on these two pollutants.
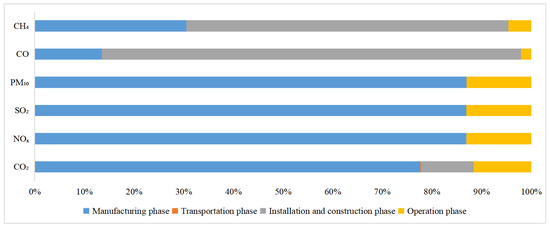
Figure 6.
Emissions from various stages of wind power subsystem.
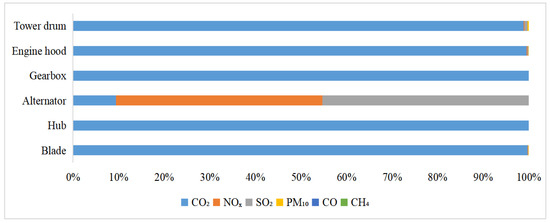
Figure 7.
Emissions from components of wind power subsystem.
Figure 8 illustrates the pollutant emissions from each stage of the electrolyzed water-to-hydrogen system. The environmental impacts of the electrolytic water subsystem are predominantly attributed to the transportation phase. This is primarily due to the significant energy consumption involved in transporting components over long distances, despite the minimal material and energy requirements during the production and operation stages of the electrolyzer’s components. Diesel fuel combustion produces primary pollutants such as NOX, PM10, CO2, and CO. Additionally, inhalation of diesel fuel combustion particulates can lead to aspiration pneumonia, and carcinogens like 3,4-benzoflora are present in the substantial volume of black smoke resulting from incomplete combustion. The production phase of the electrolyzer is the main source of CO, CH4, and CO2 emissions, whereas minimal amounts of these pollutants are generated during operation. Overall, the environmental impact of the electrolytic water–hydrogen generation component is less pronounced compared to the wind power subsystem.
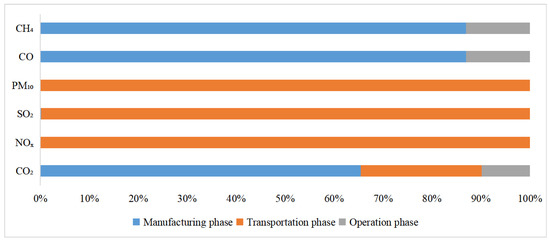
Figure 8.
Pollutant emissions from each stage of the electrolyzed water subsystem.
In summary, the manufacturing stage is the primary source of environmental impact, attributed to the emissions of pollutants such as CO2 and NOX from various machinery and equipment manufacturing processes. These emissions have significant environmental consequences. The wind power generation system is a critical component of the AOWPHP, involving complex wind turbine components and key materials with high energy consumption, high emissions, and substantial environmental pollution.
4.2. Analysis of Key Substances
The results of the environmental impacts of each substance in the key processes are shown in Figure 9.

Figure 9.
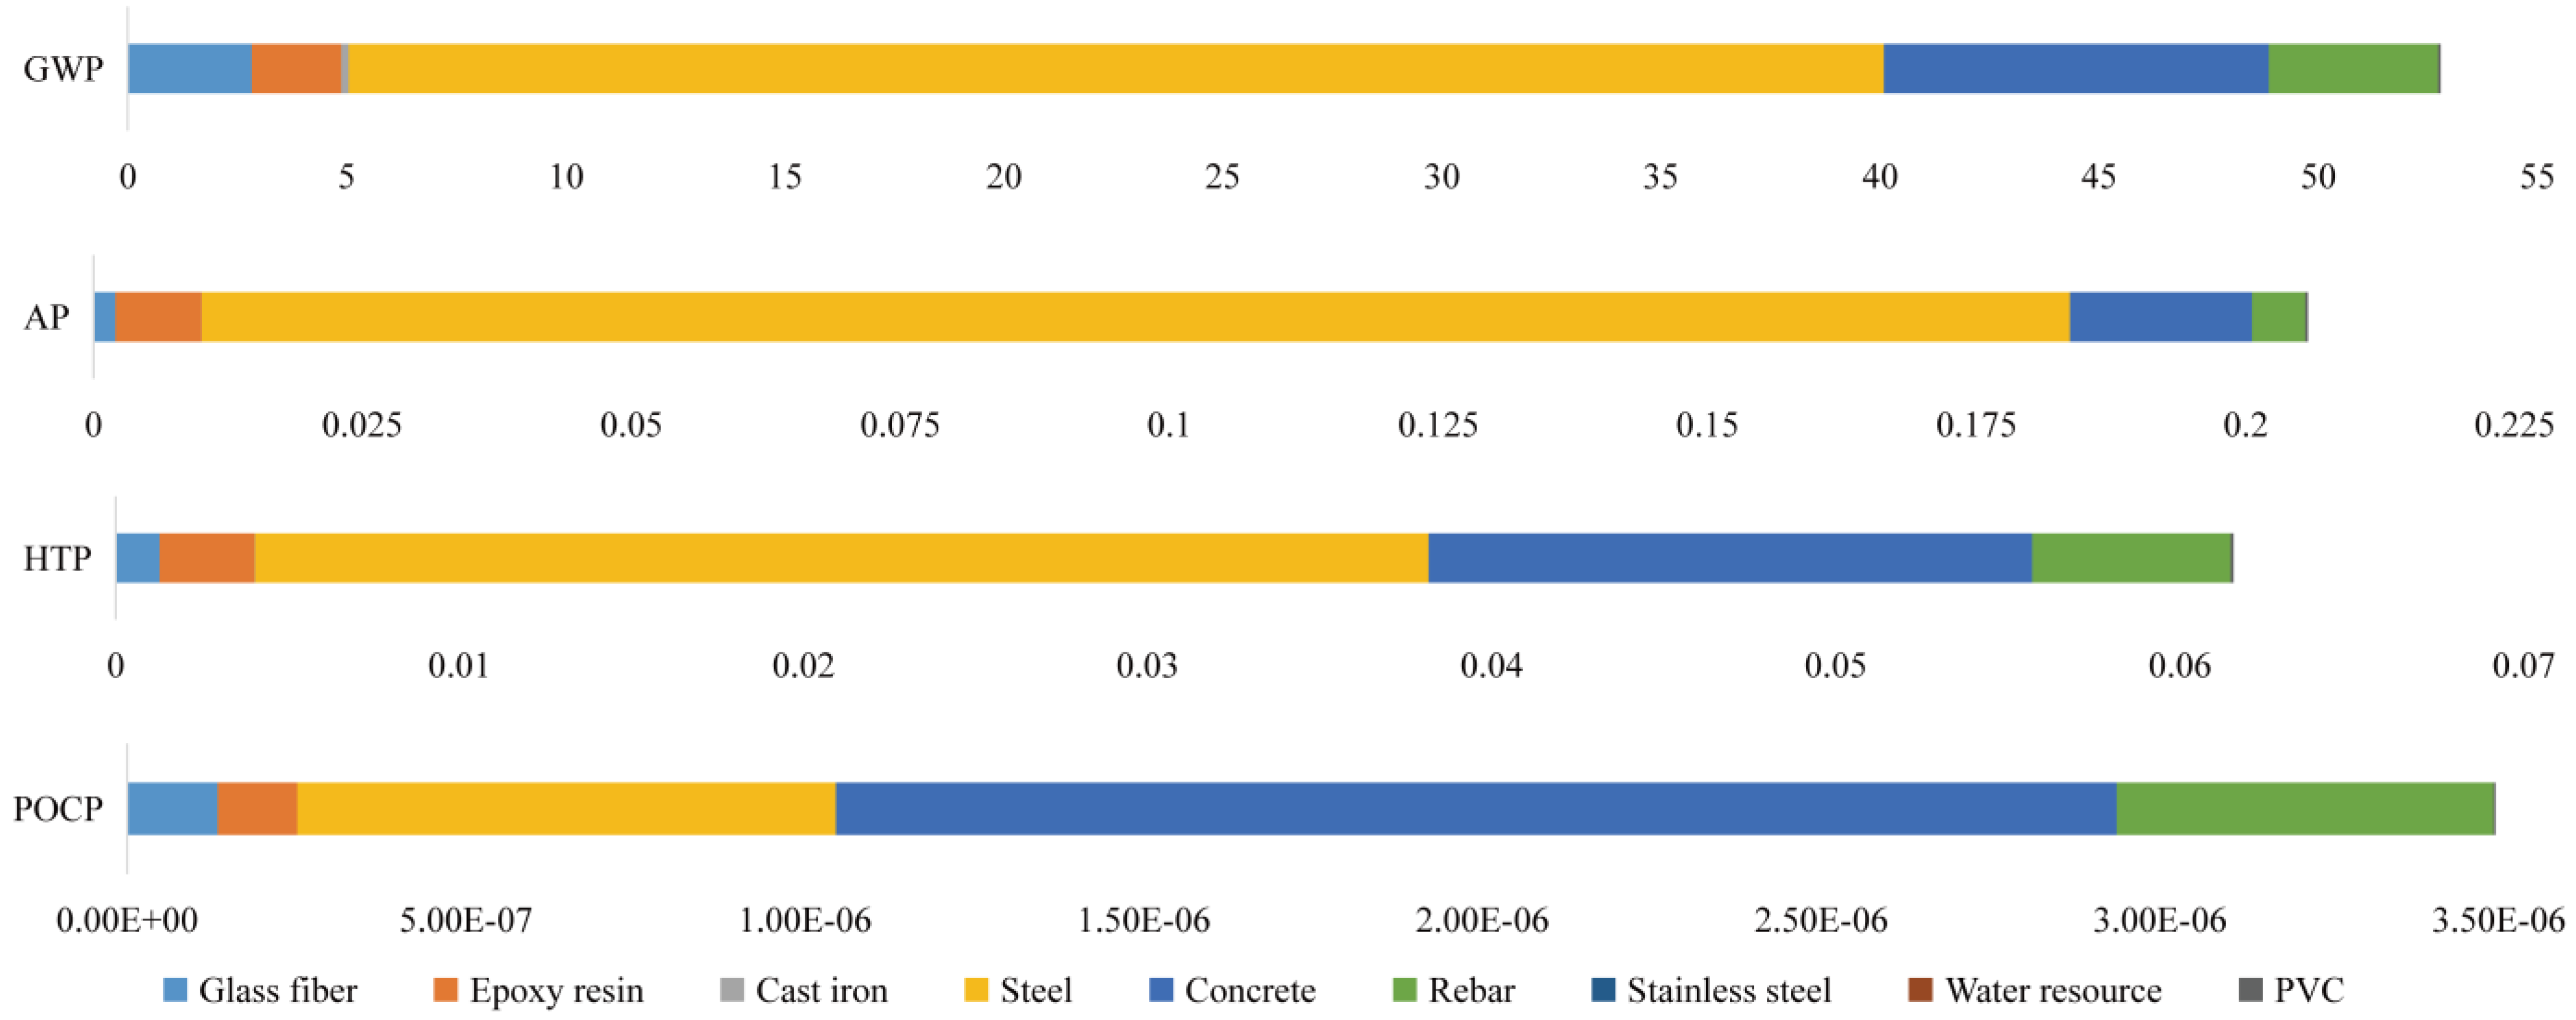
Environmental impact of major raw materials.
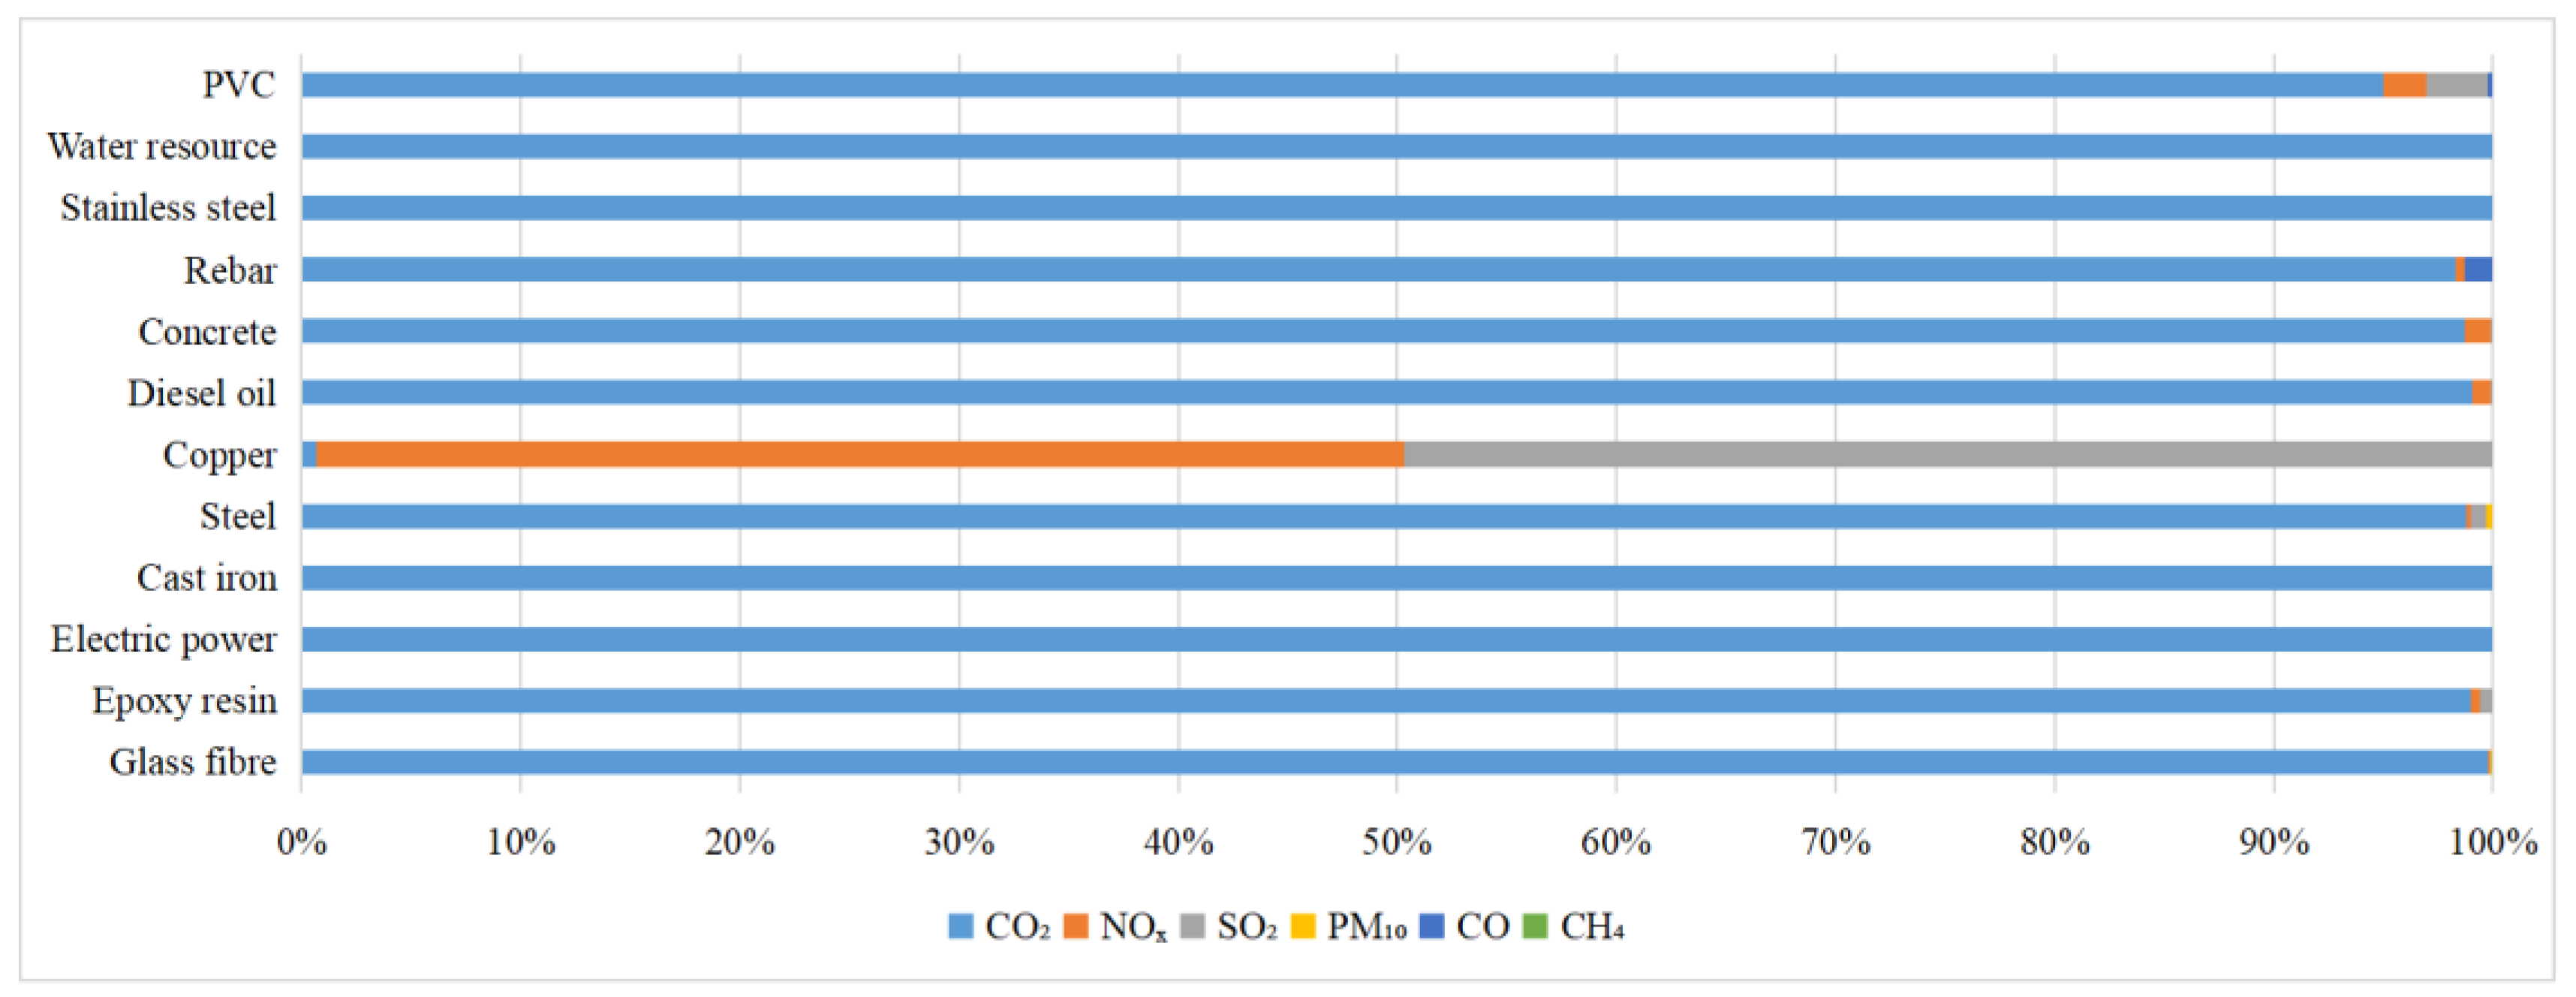
Steel and concrete are significant contributors to global warming during their production stages, as illustrated in Figure 9. This is primarily due to the substantial CO2 and NOX emissions associated with copper use, along with the high characterization value of NOX in the GWP. Consequently, widespread steel usage contributes to four categories of environmental pollution: GWP, AP, HTP, and POCP. Steel, concrete, and epoxy resin account for the majority of AP emissions. The HTP is predominantly influenced by iron, steel, concrete, and reinforcing steel. Concrete has the greatest impact on the POCP, followed by steel and reinforcing steel, both of which emit significant amounts of CH4 during manufacturing. Glass fiber and epoxy resin have a minor influence on the POCP, while other materials have negligible effects. Additionally, cast iron, stainless steel, electrolytes, and PVC contribute minimally to various environmental issues and can be disregarded.
In conjunction with Figure 10, further analysis reveals that concrete, iron, and steel have significant environmental impacts during manufacturing. These materials produce substantial quantities of NOX and CO2, which are major contributors to the GWP and AP. Despite CO2 emissions being higher than NOX emissions, the impact factor of NOX on the GWP is 310, significantly higher than that of CO2 and other gases, making it the most influential gas in terms of the GWP. Key measures to mitigate the environmental impact of concrete and steel include strict regulations of raw material usage, improvements in manufacturing processes, and reducing transportation distances to minimize NOX and CO2 emissions.

Figure 10.
Pollutant emissions from various raw materials.
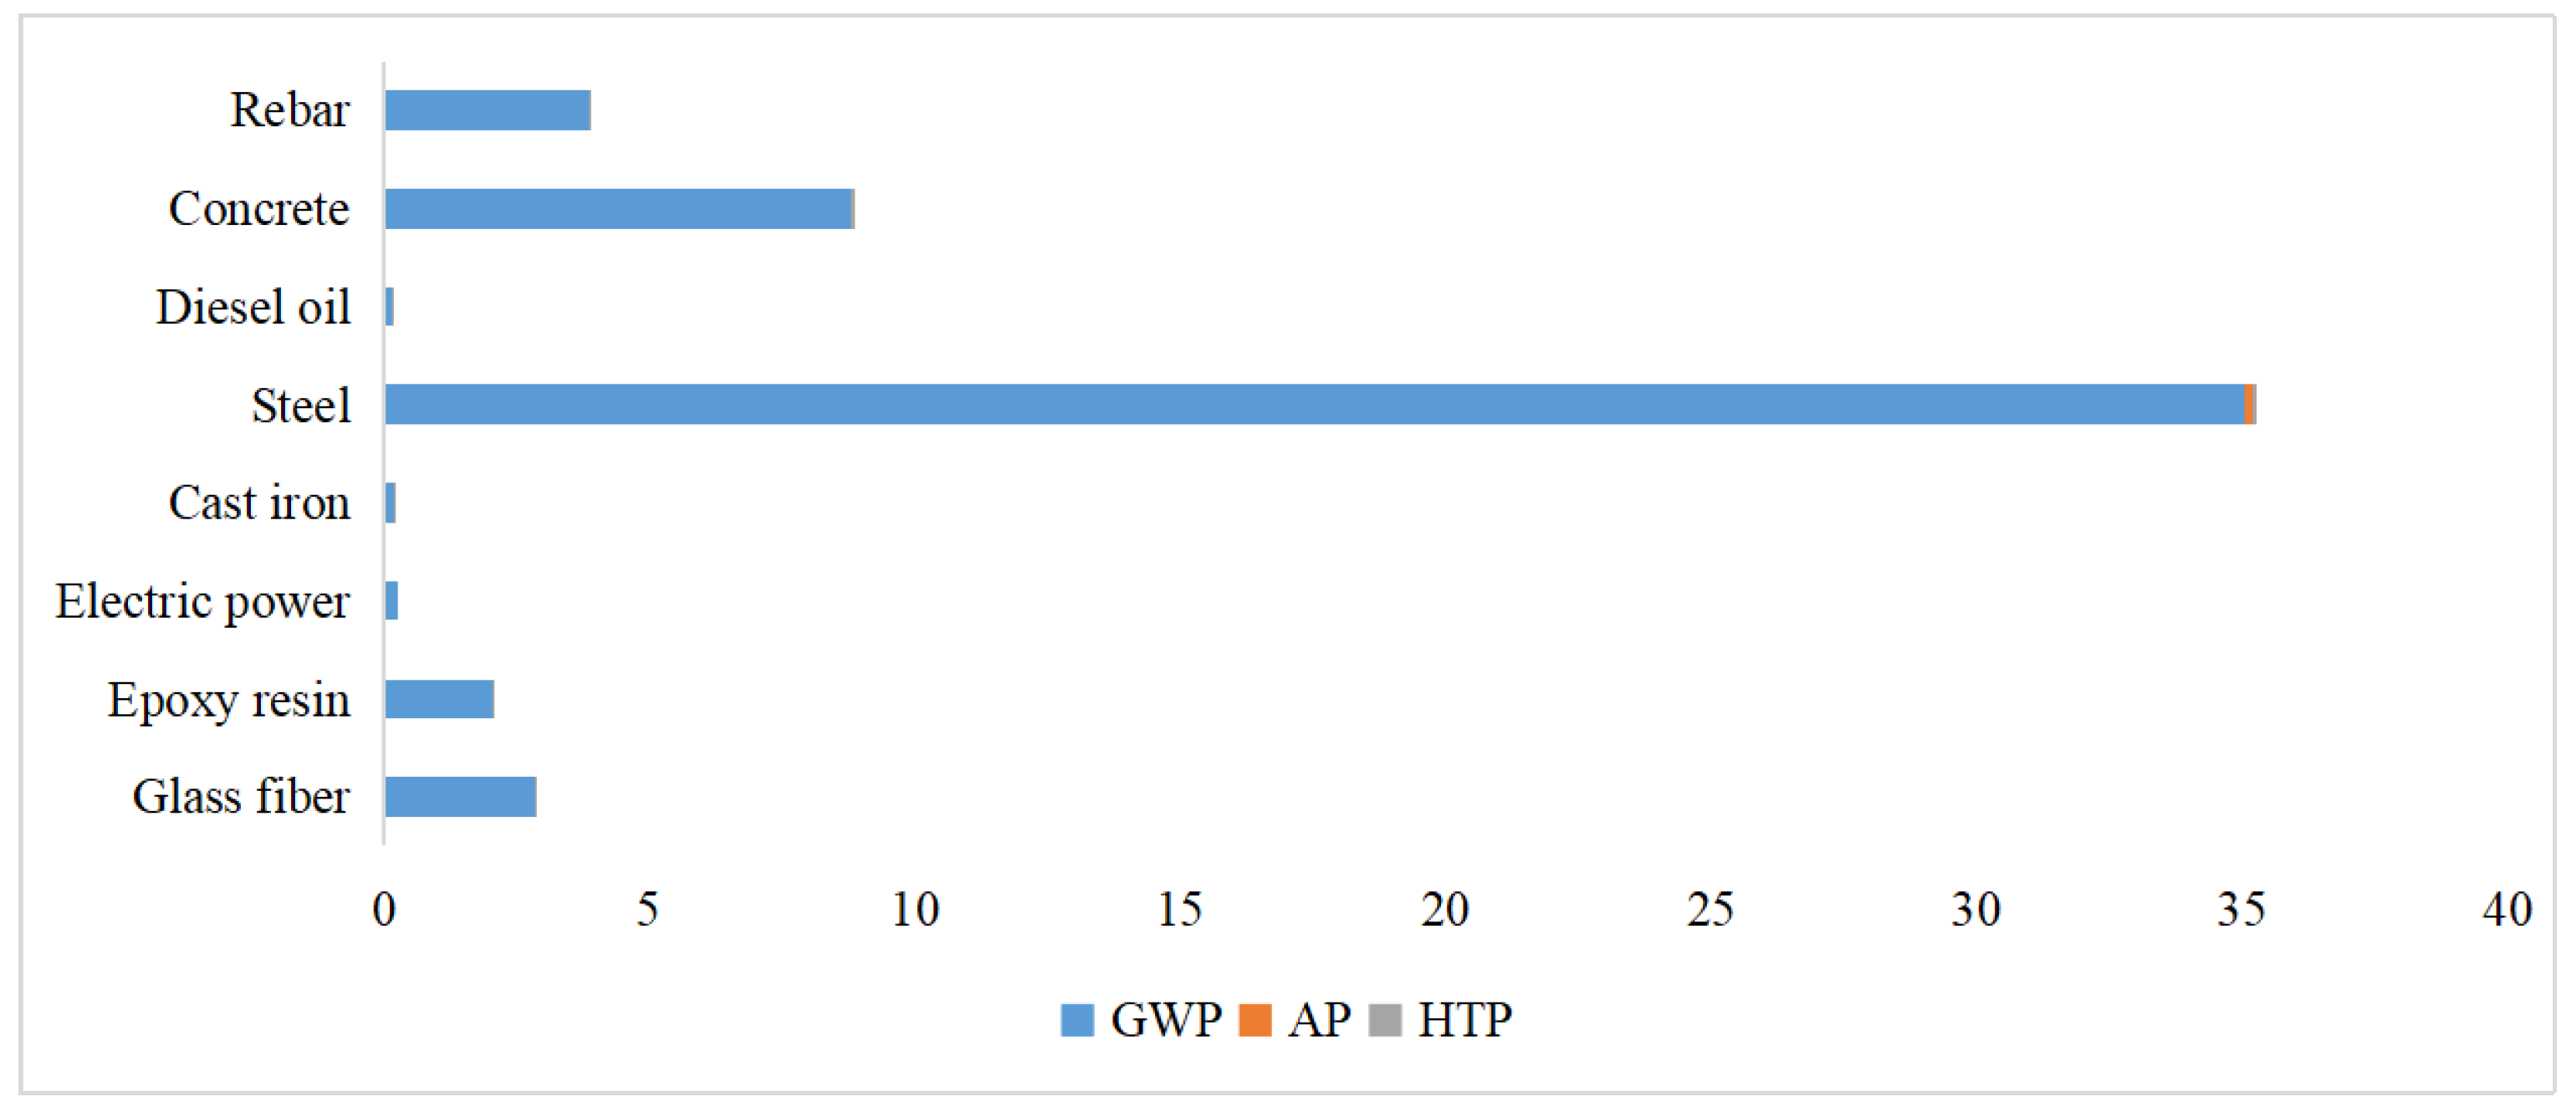
Previous research indicates that the manufacturing phase of the wind power production subsystem is chiefly responsible for various environmental impacts. Figure 11 illustrates that the primary environmental impacts in this phase stem from the GWP associated with raw materials. Iron and steel have a GWP impact of 35 kg CO2-eq, concrete has a GWP impact of 9 kg CO2-eq, steel reinforcement has a GWP impact of 4 kg CO2-eq, fiberglass has a GWP impact of 3 kg CO2-eq, and epoxy resin has a GWP impact of 2 kg CO2-eq. The effects of each substance on the AP and the HTP are quite minor. The AP of cast iron is 2 kg SO2-eq.
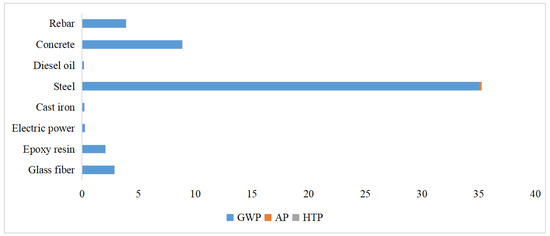
Figure 11.
Environmental impacts of substances in manufacturing phase of wind power subsystem equipment.
4.3. Sensitivity Analysis
A sensitivity analysis is a crucial phase in LCA research that evaluates how variations in input data affect the outcomes of a life cycle inventory assessment (LCIA). This analysis can be conducted using percentage adjustment methods for both input and output parameters. A sensitivity analysis may involve arbitrary ranges of variance or consistent ranges of uncertainty. A common approach is the one-factor sensitivity analysis, where one parameter is varied within a specified range while keeping other parameters constant. This allows researchers to assess the impact of individual factors on the overall results. The calculation formula for a one-factor sensitivity analysis is as follows:
where is the sensitivity to , is the LCIA indicator, is the LCIA outcome indicator value, and is the inventory data value for the stage .
The sensitivity analysis of the material inputs in the manufacturing phase is carried out. The environmental implications of steel, reinforcing steel, fiberglass, concrete, and epoxy resin are among the top five of all materials. As a result, the impact of increasing and decreasing each of these five materials by 10% on the four impact indicators is analyzed for sensitivity, and the results of the corresponding list sensitivity for each environmental impact indicator are shown in Table 7.
Table 7.
Sensitivity of each environmental indicator to main raw materials (unit: %).
With a sensitivity of 0.97%, the POCP has the maximum sensitivity for the essential materials. The most likely explanation for this is because concrete is the most often used material, and the concrete manufacturing process creates more CH4, which is the sole pollutant in this article in relation to the POCP. As a result, photochemical pollution is the most susceptible. This is followed by the susceptibility of the GWP and AP, which have sensitivities of 0.011% and 0.009%, respectively.
4.4. Comparative Analysis
Table 8 summarizes the GWP data of WPHP from both this study and earlier research. When considering identical system boundaries, China’s wind power hydrogen generation plant demonstrates a larger GWP impact compared to that reported in [54]. This disparity can be attributed to China’s delayed wind power growth, gradual development in wind turbine manufacturing and WPHP, and the ongoing need for technological advancements. Consequently, the findings of this publication surpass those of Ghandehariun et al. [51].
Table 8.
Comparison of GWP with AOWPHP in other countries.
However, uncertainties remain regarding the scale of wind turbines [54], with pollutant emissions during wind turbine manufacturing being a primary contributor to the GWP. In contrast to Canada, where Ghandehariun et al. confined their study to “wind power generation-hydrogen production by electrolysis of water-hydrogen compression-hydrogen transportation” [51], our study expanded the system boundary. As a result, the GWP within our system exceeds that found in Reiter et al. [54], primarily due to the larger scale of turbines, approximately 17 times larger than those in [55]. The increase in turbine size significantly outweighs the impacts of increasing hydrogen storage and transit within the system boundary. Overall, this study demonstrates superior results compared to earlier studies, owing to its comprehensive scope, technological advancements in each country, and the scale of wind power deployment.
Combined with Figure 4 and Figure 6, the environmental impact of wasted wind power and the conversion of wasted wind power to hydrogen were compared. From the perspective of the key stage of environmental impact, the manufacturing stage of both sides is the key stage of environmental impact, followed by the operation stage. From the perspective of the types of environmental impacts, the main environmental impacts of both sides are the GWP, followed by the AP. The notable difference is that the former exhibits a greater environmental impact during installation than during transportation, while the reverse holds true for the latter. This disparity is likely due to the greater manpower and material costs associated with installing electrolytic cells compared to the installation of large equipment in wind farms. Furthermore, China’s concentrated electrolytic cell manufacturing requires nationwide transportation, incurring high costs. Conversely, wind power component manufacturing in China is typically close to wind farms, resulting in lower transportation costs.
4.5. Trend Analysis of Environmental Impacts
4.5.1. Scenario Construction
Different scenarios for the future growth of the AOWPHP are created to estimate the changes in environmental impacts under different scenarios based on identifying the major stages of the environmental impacts of sources, critical compounds, sensitive materials, and so on.
According to the basic principle of scenario analysis, this paper takes 2020 as the base period and draws on China’s economic construction plan for a five-year period to divide the predicted 2021–2050 period into six phases to set the scenario parameters, taking China’s carbon emission reduction commitment and related policy planning in 2030 as the base period. The six phases are 2021–2025, 2026–2030, 2031–2035, 2036–2040, 2041–2045, and 2046–2050.
China is in a period of rapid development, and each stage of development faces a different situation of environmental impacts. So, in the prediction scenarios, it is also necessary to follow the principles of seeking truth from facts and adapting to local conditions. Drawing lessons from [42,70], three different scenarios for sensitive materials are set up, and five typical development scenarios are constructed, as shown in Table 9.
Table 9.
Scenario construction of environmental impacts of AOWPHP.
(1) Baseline development scenario: all components are set to change at a “medium” rate under current policy circumstances and technical levels. (2) Low-speed development scenario: The rate of change in all influencing factors is set to low-speed development. The main reason for this setting is that COVID-19 and natural disasters will reduce the speed of economic development and reduce industrial activities, which to some extent will affect the environmental impact of wind power hydrogen production projects, and thus affect the national carbon emissions. (3) High-speed development scenario: Rapid economic development and unfettered expansion will have irreversible environmental consequences. This scenario is placed in the backdrop of greater economic development and increasing energy demand intensity.
4.5.2. Scenario Parameter Setting
The parameters for this scenario are based on projected trends in wind power and hydrogen energy development. Firstly, the criteria for key materials in the wind power system are established.
During the “14th Five-Year Plan” period, China aims to achieve an average annual new installed capacity of wind power exceeding 50 million kilowatts. Beyond 2025, this target increases to over 60 million kilowatts annually, with a goal of reaching at least 800 million kilowatts by 2030. This growth trajectory aligns with China’s objectives of reaching carbon peak and carbon neutrality, indicating a continued expansion of wind power capacity over the next decade. The increased demand for raw materials in wind turbines correlates directly with the rise in installed wind-generating capacity. Factoring in the three-year impact of the COVID-19 pandemic and the imperative of economic recovery, along with developments in the resin industry since 2020, this paper hypothesizes a rebound in the utilization of wind turbine equipment post-2020, categorized into three developmental scenarios. For instance, in the first scenario, the use of epoxy resin materials starts at 75% of the lowest growth rate (10.11%) observed in China’s cumulative installed wind power capacity from 2016 to 2020. Subsequent stages then see incremental increases of 2%, 3%, 4%, 5%, and 4%, building on the growth rate of the preceding stage.
Secondly, in the medium-speed development scenario, the utilization of epoxy resin materials shows a moderate growth rate. In the initial stage, epoxy resin usage corresponds to the average 16.72% growth rate of national cumulative installed wind power capacity from 2016 to 2020. Subsequently, growth rates for the second through sixth stages increase by 3%, 7%, 10%, 13%, and 12%, respectively, compared to the preceding stage.
Thirdly, under the high-speed development scenario, the utilization of epoxy resin materials exhibits accelerated growth. Initially, it assumes a growth rate equivalent to 150% of the highest growth rate observed, which was 22.38% in cumulative installed wind power capacity from 2016 to 2020. Each subsequent stage increases by 5%, 10%, 15%, 10%, and 5% based on the growth rate of the preceding stage, as detailed in Table 10.
Table 10.
Wind power system development scenario parameters.
The key components of the electrolytic water-to-hydrogen system, including diesel, electricity, and stainless steel, are then parameterized. According to the “China’s Hydrogen Energy and Fuel Cell Industry White Paper 2020” by the Hydrogen Alliance, China currently boasts a hydrogen production capacity of approximately 41 million tons per year, yielding about 33.42 million tons, thereby leading globally in hydrogen production. By 2030, China’s hydrogen energy sector is expected to emerge as a pivotal economic driver and a cornerstone of the nation’s new energy policy. Predictions suggest that hydrogen energy will constitute approximately 5.9% of China’s energy system by 2035. According to the China Hydrogen Energy Alliance, hydrogen produced from renewable energy electrolyzed water will account for 15% of the country’s hydrogen production in 2030, rising to 45% and 70% in 2040 and 2050, implying that the demand for electrolyzers in the hydrogen energy market will rise in the future. Given the three-year impact of the new Crown pneumonia epidemic, the fact that economic recovery will take time, as well as the actual change rule of the hydrogen energy and electrolyzer industry chain since 2020, this paper assumes that the use of electrolyzers will begin to rebound after 2020, with the change reflected in the three scenarios of the setup.
Firstly, in the low-speed development scenario, electrolyzer usage sees gradual increments. Initially, electrolyzer usage is set at 75% of the minimum growth rate of 2.04% observed in national hydrogen production from 2016 to 2020. Subsequent stages then increase by 2%, 4%, 6%, 8%, and 10%, building upon the growth rate of the preceding stage. Secondly, in the medium-speed development scenario, the growth rate of electrolyzer usage is moderate. The initial stage corresponds to 6.87% of the average growth rate of national hydrogen production from 2016 to 2020. Successive stages increase by 10%, 15%, 16%, 15%, and 15%, relative to the growth rate of the previous stage. Thirdly, electrolyzer usage accelerates in the high-speed development scenario. Here, the initial stage is set at 150% of the highest growth rate recorded, which was 13.64% of national hydrogen production from 2016 to 2020. The following stages then increase by 5%, 10%, 15%, 20%, and 25% sequentially, based on the growth rate of the preceding stage, as detailed in Table 11.
Table 11.
Electrolyzed water system development scenario parameters.
4.5.3. Analysis of Environmental Impact Prediction Results
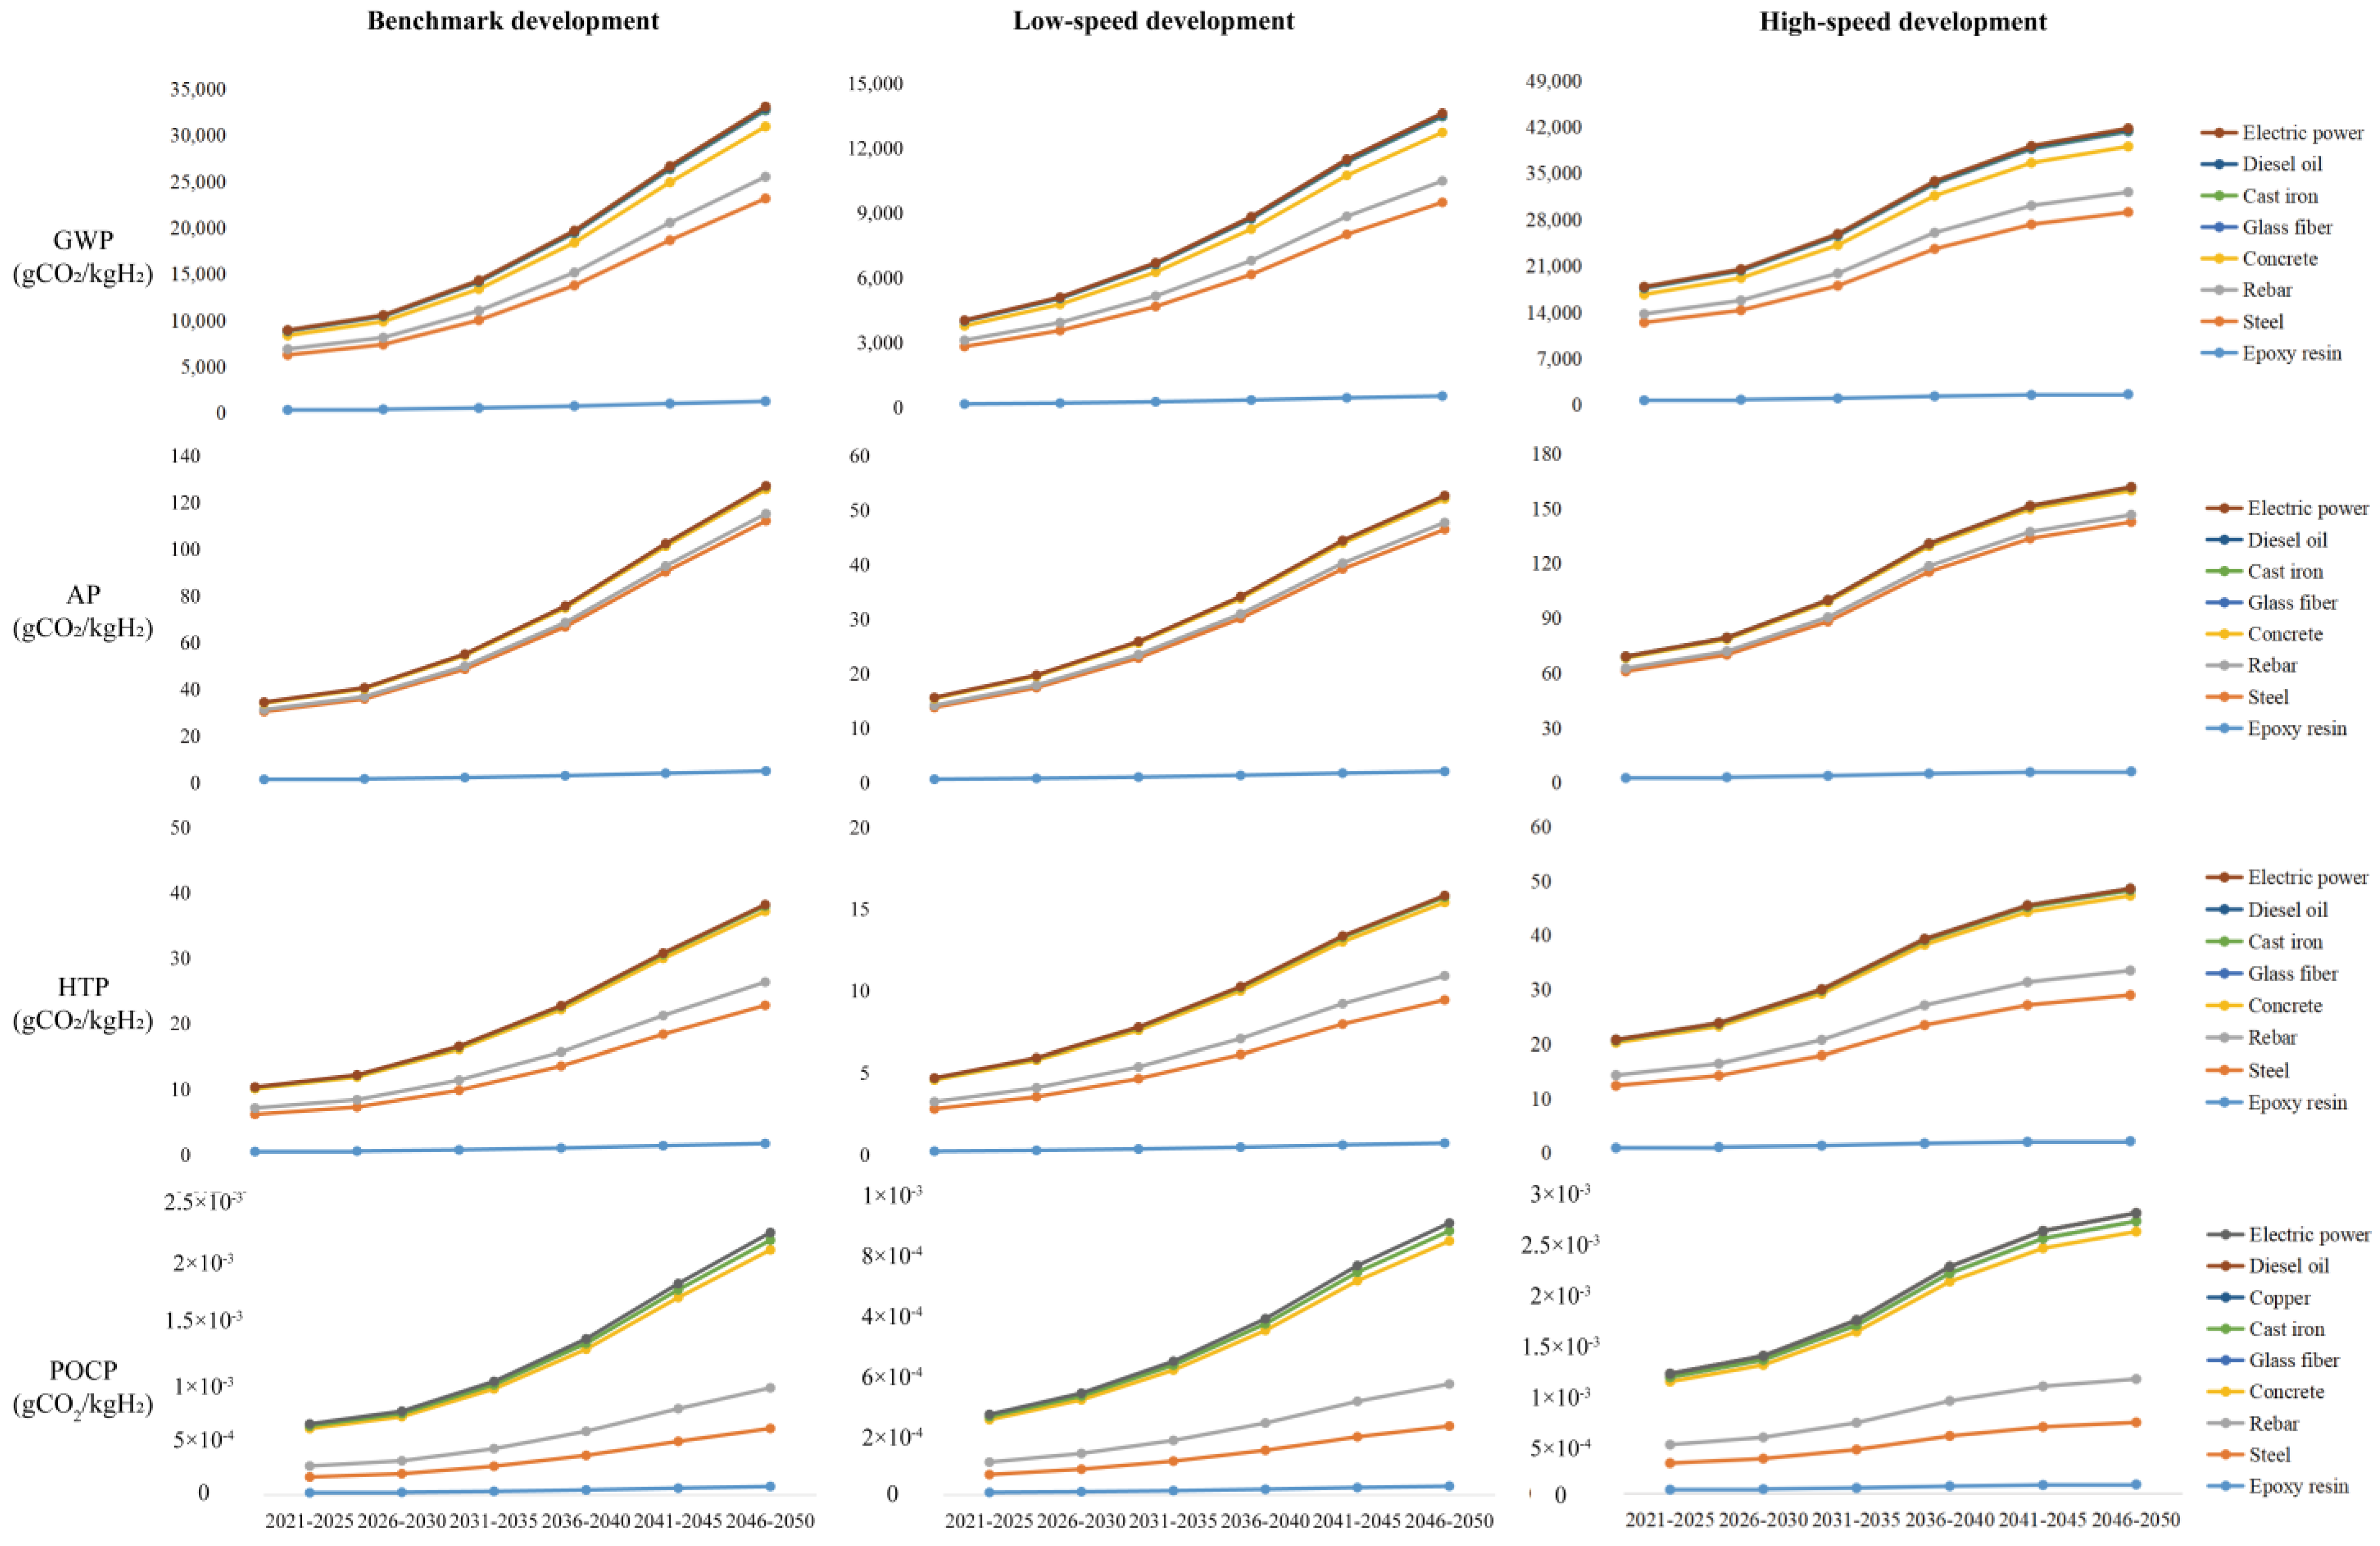
The environmental implications of the AOWPHP for the next 30 years may be calculated, as illustrated in Figure 12.
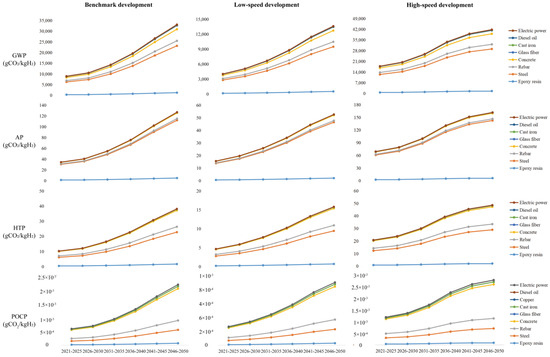
Figure 12.
Trends in projected environmental impact scenarios for AOWPHP (2021–2050).
According to Figure 12, the environmental effect values under the three scenarios reach their maximum around 2050. Both the baseline development scenario and the rapid development scenario show that environmental implications peak around 2050. It is important to note that the environmental impact peaks analyzed in this article are not the same as the carbon peak. China plans to achieve carbon neutrality by 2050 and carbon peaking by 2030. To meet the carbon peak objective, China needs to reduce the use of fossil fuels and significantly increase the adoption of renewable energy.
On the other hand, the reduction in fossil energy will inevitably lead to an increased demand for renewable energy, especially wind and hydrogen. This will result in a corresponding rise in the number of wind farms and hydrogen production facilities, leading to a surge in demand for the raw materials required for these projects, which will, to some extent, exacerbate the negative impact on the environment. Consequently, achieving a carbon peak in 2030 does not guarantee that environmental implications in China will also peak in 2030. On the contrary, the environmental implications of the AOWPHP are likely to worsen if carbon reduction programs are implemented. After 2030, the growth and construction of wind farms are expected to increase steadily, with the environmental impact peaking around 2050 under the rapid development scenario.
Overall, the environmental impact values for electricity, diesel, cast iron, fiberglass, and concrete are all increasing and are higher compared to other components. Epoxy resin has the lowest environmental impact value, likely due to its lower usage volume compared to other essential materials, resulting in a less significant environmental impact. Steel has a greater environmental impact than epoxy resin but a lower impact than resources such as electricity and diesel. There are notable disparities in the environmental repercussions under different growth scenarios. The GWP of each material in 2050 under the high-speed development scenario is 41,808 g CO2-eq, the AP is 162 g SO2-eq, the HTP is 49 g DCB-eq, and the POCP is 2.82 × 10⁻³ g C2H4-eq. The GWP of each material in 2050 under the baseline development scenario is 33,077 g CO2-eq, with an AP of 2.82 × 10⁻³ g C2H4-eq, a human toxicity potential of 38 g DCB-eq, and a POCP of 2.22 × 10⁻³ g C2H4-eq. Under the low-speed development scenario, the GWP of each material in 2050 is 13,613 g CO2-eq, the AP is 52 g SO2-eq, the HTP is 15 g DCB-eq, and the POCP is 9 g DCB-eq. The AOWPHP clearly has the largest influence on global warming.
5. Conclusions
As the country with the most installed wind power capacity, China has implemented several measures to increase wind power usage efficiency, one of which is the abandonment wind power for hydrogen projects (AOWPHP). This paper conducts an environmental impact study on China’s AOWPHP by combining the theory of life cycle assessment with literature research and the “cradle-to-gate” system boundary. It serves as a key reference for developing sustainable energy policies. The following outcomes were obtained:
- (1)
- The AOWPHP has a GWP of 5.61 × 10³ kg CO2-eq, an AP of 2.57 × 101 kg SO2-eq, an HTP of 1.24 × 101 kg DCB-eq, and a POCP of 3.77 × 10⁻⁶ kg C2H4-eq. The GWP has the greatest environmental impact. The key process analysis findings show that the manufacturing phase is a crucial stage in terms of environmental consequences, which may be linked to the process’s huge number of energy-intensive raw material inputs.
- (2)
- The core material analysis results demonstrate that large raw material inputs such as steel and concrete have the greatest environmental impact. According to the uncertainty study, the wind power-generating subsystem has the most significant influence on the uncertainty of environmental repercussions. Therefore, efforts should focus on reducing the uncertainty associated with pollution emissions from wind farms.
- (3)
- The inventory sensitivity study findings suggest that the POCP has the highest sensitivity to materials (0.97%), followed by the GWP and the AP.
- (4)
- The scenario study findings demonstrate that the environmental consequences of the wind power-to-hydrogen project increase in all three development scenarios and do not peak in 2050. However, the environmental effect values are close to their maximum in the high-speed development scenario.
Based on these research conclusions, this paper proposes the following policy suggestions:
- (1)
- Manufacturing Phase: As shown in Section 4.1, greenhouse gas emissions (GWP) during the manufacturing phase account for 99% of total emissions across the system’s life cycle. This is primarily due to the substantial consumption of iron and steel materials in the construction of wind turbine equipment. Therefore, wind turbine generator (WTG) manufacturers should prioritize sourcing steel products from large and medium-sized steel enterprises. Additionally, WTG manufacturers should encourage and utilize green and clean resources for the production of essential wind turbine components and carefully select environmentally friendly suppliers.
- (2)
- Installation and Building Phases: The GWP during the installation and building phases accounts for about 10% of the entire system’s emissions. It is crucial to address the carbon emissions generated during these phases. One effective strategy is to minimize the amount of cement used in concrete production. This can be achieved by incorporating active admixtures and adjusting the concrete mix ratio to reduce cement content. Furthermore, recycled concrete production generally consumes less power, coal, and fuel, and emits a lower environmental burden compared to conventional concrete production.
- (3)
- Wind Turbine Blades: Epoxy resin and glass fiber, which are used in wind turbine blades, are also significant materials. As global wind power capacity increases, wind turbine blades are becoming larger. However, China’s wind power sector is gradually expanding southward, where wind speeds are lower. Consequently, larger blades with lower wind speeds necessitate epoxy resins with longer infusion periods and improved workability. Future advancements in wind turbine blade materials should focus on recyclable thermoplastic resins and bamboo fiber composites, which offer promising alternatives.
This study’s scope could potentially expand in the future to encompass hydrogen storage and transportation, as well as hydrogen consumption. As nations strive toward achieving carbon neutrality goals, the significance of hydrogen energy as a green energy source is gaining prominence. Evaluating the environmental impact of hydrogen energy across the entire hydrogen production industry chain (including hydrogen production, storage, transportation, and consumption) holds substantial importance in effectively reducing the environmental footprint of hydrogen energy. Furthermore, future research should concentrate on enhancing the quality of data in the life cycle assessment (LCA) inventory and broadening the scope of local background data. The accuracy and availability of data form the bedrock of research and play a critical role in determining the precision of research outcomes.
Author Contributions
Conceptualization, Y.D.; Methodology, Y.D., H.H. and J.Z.; Software, Y.D. and J.Z.; Validation, H.H. and J.Z.; Formal analysis, Y.D., H.H., H.L. and J.Z.; Investigation, H.L.; Resources, Y.D., H.L. and J.Z.; Data curation, Y.D.; Writing—original draft, Y.D.; Writing—review & editing, Y.D., H.H., H.L. and Q.Y.; Visualization, Y.D., H.L. and Q.Y.; Supervision, H.H., H.L. and Q.Y. All authors have read and agreed to the published version of the manuscript.
Funding
This study received no external funding.
Institutional Review Board Statement
Not applicable.
Informed Consent Statement
Not applicable.
Data Availability Statement
The data presented in this study are available on request from the corresponding author.
Conflicts of Interest
The authors declare no conflicts of interest.
Abbreviations
| Acronyms | Multiples used with SI units | ||
| AP | Potential for acidification | Mega (M) | 106 |
| AOWPHP | Abandoned wind power for hydrogen projects | Giga (G) | 109 |
| ATR | Auto-thermal reforming | GW | Gigawatts |
| BSI | British Standards Institution | GWh | Gigawatts/hour |
| CEC | China Electricity Council | kg | Kilogram |
| CLCD | Chinese Life Cycle Database | KW | Kilowatt |
| DCB | 1,2-dichlorobenzene | KWh | Kilowatt/hour |
| GHG | Greenhouse gas | MW | Megawatt |
| GIS | Geographic information system | MWh | Megawatt/hour |
| GWP | Potential for global warming | Currencies | |
| HTP | Potential for human toxicity | € | Euro, currency in the European Union |
| IEA | International Energy Agency | $ | US dollar, currency in the United States of America |
| IPCC | United Nations Intergovernmental Panel on Climate Change | EUR | The common currency of 20 countries in the European Union |
| LCA | Life cycle assessment | Non-SI units and conversion to SI | |
| LCIA | Life cycle inventory assessment | h (hour), unit of time 1 h = 3600 s | |
| LCOH | Levelized cost of hydrogen | kWh (kilowatt/hour), unit of energy 1 kW h = 3,600,000 J | |
| NEA | National Energy Administration | liter, unit of volume 1 L = 0.001 m3 | |
| PEF | Product Environmental Footprint | year, unit of time 1 year = 8760 h | |
| POCP | Photochemical ozone creation potential | Subscripts | |
| POM | Partial oxidation of methane | hydro | Hydrogen |
| SMR | Steam methane reforming | wind,j | Pollutant emissions from wind farms |
| USA | United States of America | hydro,j | Pollutant emissions from hydrogen production system |
| WPHP | Wind power-to-hydrogen project | i | Various types of material and energy consumption |
| WTG | Wind turbine generator | j | Various types of pollutants such as CO2, CO, SO2, CH4, N2O, SOX, PM10, and NOX |
| Chemical elements | k | Life cycle stages such as production and manufacturing, transportation, installation, and operation | |
| CH4 | Methane | -eq | Equivalent |
| CO | Carbon monoxide | ||
| CO2 | Carbon dioxide | ||
| H2 | Hydrogen | ||
| N2O | Nitrous oxide | ||
| NOX | Nitrogen oxide | ||
| PM10 | Inhalable particle | ||
| PVC | Polyvinyl chloride | ||
| SO2 | Sulfur dioxide | ||
| The formula for calculating the power generation of wind farms: | |||
| Annual power generation of wind farm = 8760 × Generator capacity × Generation hours × Generator utilization hours × Generator efficiency Among them, the general power generation hours are between 1600 and 2200 h, and the value in this article is 2000 h. Generally, the utilization hours of the generator are calculated based on an average compliance rate of 70%. Generally, the larger the capacity of a generator, the higher the efficiency, with a value of 90–95%. For small-capacity generators, the efficiency is below 90%, with a value of 92% in this article. | |||
References
- International Energy Agency. World Energy Outlook 2020; IEA: Beijing, China, 2020. [Google Scholar]
- Xinhua Net. Xi Jinping’s Speech at the Opening Ceremony of the Paris Climate Change Conference. 2015. Available online: http://www.xinhuanet.com//world/2015-12/01/c_1117309642.htm (accessed on 2 July 2024).
- Falcone, P.M. Tourism-based circular economy in Salento (South Italy): A SWOT-ANP analysis. Soc. Sci. 2019, 8, 216. [Google Scholar] [CrossRef]
- Thombs, R.P. When democracy meets energy transitions: A typology of social power and energy system scale. Energy Res. Soc. Sci. 2019, 52, 159–168. [Google Scholar] [CrossRef]
- Kokkinos, K.; Karayannis, V.; Moustakas, K. Circular bio-economy via energy transition supported by Fuzzy Cognitive Map modeling towards sustainable low-carbon environment. Sci. Total Environ. 2020, 721, 137754. [Google Scholar] [CrossRef] [PubMed]
- National Energy Administration. National Renewable Energy Power Development Monitoring and Evaluation Report in 2022. 2023. Available online: http://zfxxgk.nea.gov.cn/2023-09/07/c_1310741874.htm (accessed on 2 July 2024).
- Zhao, Z.; Zuo, J.; Fan, L.; Zillante, G. Impacts of renewable energy regulations on the structure of power generation in China—A critical analysis. Renew. Energy 2011, 36, 24–30. [Google Scholar] [CrossRef]
- The Polaris Wind Power Grid. 2023 China’s Wind Power Industry. 2023. Available online: https://news.bjx.com.cn/html/20240306/1364641.shtml (accessed on 2 July 2024).
- Huang, H.; Du, Y.; Song, S.; Guo, Y. Key technologies and economic analysis of decentralized wind power consumption: A Case Study in B City, China. Energies 2020, 13, 4147. [Google Scholar] [CrossRef]
- Carbajales-Dale, M.; Barnhart, C.J.; Benson, S.M. Can we afford storage? A dynamic net energy analysis of renewable electricity generation supported by energy storage. Energy Environ. Sci. 2014, 7, 1538–1544. [Google Scholar] [CrossRef]
- Liu, C.; Wu, H.; Gao, C. Research on analyzing method of wind power consumption capacity. Power Syst. Prot. Control. 2014, 42, 61–66. [Google Scholar]
- Wu, W.; Wang, K.; Li, G. Robust unit combination for enhancing wind power consumption zone. J. Electrotechnol. 2018, 33, 523–532. [Google Scholar]
- National Energy Administration. National Renewable Energy Power Development Monitoring and Evaluation Report in 2020. 2021. Available online: http://zfxxgk.nea.gov.cn/2021-06/20/c_1310039970.htm (accessed on 2 July 2024).
- National Energy Administration. National Renewable Energy Power Development Monitoring and Evaluation Report in 2021. 2022. Available online: https://www.gov.cn/zhengce/zhengceku/2022-09/23/content_5711253.htm (accessed on 2 July 2024).
- Díaz-González, F.; Sumper, A.; Gomis-Bellmunt, O.; Villafáfila-Robles, R. A review of energy storage technologies for wind power applications. Renew. Sustain. Energy Rev. 2012, 16, 2154–2171. [Google Scholar] [CrossRef]
- Sundararagavan, S.; Baker, E. Evaluating energy storage technologies for wind power integration. Sol. Energy 2012, 86, 2707–2717. [Google Scholar] [CrossRef]
- Caralis, G.; Christakopoulos, T.; Karellas, S.; Gao, Z. Analysis of energy storage systems to exploit wind energy curtailment in Crete. Renew. Sustain. Energy Rev. 2019, 103, 122–139. [Google Scholar] [CrossRef]
- Yang, N.; Deng, J.; Wang, C.; Bai, Z.; Qu, J. High pressure hydrogen leakage diffusion: Research progress. Int. J. Hydrogen Energy 2023, 50, 1029–1046. [Google Scholar] [CrossRef]
- Baeyens, J.; Zhang, H.; Nie, J.; Appels, L.; Dewil, R.; Ansart, R.; Deng, Y. Reviewing the potential of bio-hydrogen production by fermentation. Renew. Sustain. Energy Rev. 2020, 131, 110023. [Google Scholar] [CrossRef]
- Ji, M.; Wang, J. Review and comparison of various hydrogen production methods based on costs and life cycle impact assessment indicators. Int. J. Hydrogen Energy 2021, 46, 38612–38635. [Google Scholar] [CrossRef]
- People’s Republic of China. Implementation Plan for Solving the Problem of Water, Wind, and Light Abandonment. 2017. Available online: https://www.gov.cn/xinwen/2017-11/14/content_5239536.htm (accessed on 2 July 2024).
- Qolipour, M.; Mostafaeipour, A.; Tousi, O.M. Technoeconomic feasibility of a photovoltaic-wind power plant construction for electric and hydrogen production:a case study. Renew. Sustain. Energy Rev. 2017, 78, 113–123. [Google Scholar] [CrossRef]
- Nicoletti, G.; Arcuri, N.; Nicoletti, G.; Bruno, R. A technical and environmental comparison between hydrogen and some fossil fuels. Energy Convers. Manag. 2015, 89, 205–213. [Google Scholar] [CrossRef]
- Wang, L.; Wang, Y.; Du, H.; Zuo, J.; Li, R.Y.M.; Zhou, Z.; Bi, F.; Garvlehn, M.P. A comparative life-cycle assessment of hydro-, nuclear and wind power: A China study. Appl. Energy 2019, 249, 37–45. [Google Scholar] [CrossRef]
- Li, Y. Research on Life Cycle Evaluation of Several Hydrogen Production Methods. Master’s Thesis, Xi’an University of Architecture and Technology, Xi’an, China, 2010. [Google Scholar]
- Komorowska, A.; Benalcazar, P.; Kamiński, J. Evaluating the competitiveness uncertainty of offshore wind-to-hydrogen production: A case study of Poland. Int. J. Hydrogen Energy 2023, 48, 14577–14590. [Google Scholar] [CrossRef]
- Seyyed, S.; Hosseini, D.; Seyyed, J.; Hosseini, D. Locating wind farm for power and hydrogen production based on Geographic information system and multi-criteria decision making method: An application. Int. J. Hydrogen Energy 2022, 47, 24569–24583. [Google Scholar]
- Stepan, K.; Iryna, I.; Borys, T. Resource potential for wind-hydrogen power in Ukraine. Int. J. Hydrogen Energy 2021, 46, 157–168. [Google Scholar]
- Cheng, C.; Llewelyn, H. The role for offshore wind power in renewable hydrogen production in Australia. J. Clean. Prod. 2023, 391, 136223. [Google Scholar] [CrossRef]
- Omar, S.I.; Alessandro, S.; Roberts, P. Dedicated large-scale floating offshore wind to hydrogen: Assessing design variables in proposed typologies. Renew. Sustain. Energy Rev. 2022, 160, 112310. [Google Scholar]
- Niklas, G. Comparative Life-Cycle-Assessment analysis of three major water electrolysis technologies while applying various energy scenarios for a greener hydrogen production. J. Energy Storage 2021, 43, 102759. [Google Scholar]
- Kiryanova, N.G.; Matrenin, P.V.; Mitrofanov, S.V. Hydrogen energy storage systems to improve wind power plant efficiency considering electricity tariff dynamics. Int. J. Hydrogen Energy 2022, 47, 10156–10165. [Google Scholar] [CrossRef]
- Ahmadi, M.H.; Dehshiri, S.S.H.; Dehshiri, S.J.H.; Mostaafeipour, A.; Almutrai, K.; Ao, H.X.; Rezaei, M.; Techato, K. A Thorough Economic Evaluation by Implementing Solar/Wind Energies for Hydrogen Production: A Case Study. Sustainability 2022, 14, 1177. [Google Scholar] [CrossRef]
- Mohamed, N.; Tamer, F.M.; Shinichi, O.; Hassan, H. Techno-economic assessment of clean hydrogen production and storage using hybrid renewable energy system of PV/Wind under different climatic conditions. Sustain. Energy Techn. 2022, 52, 102195. [Google Scholar]
- Hasan, M.M. Techno-economic analysis of solar/wind power based hydrogen production. Fuel 2022, 324, 124564. [Google Scholar] [CrossRef]
- Han, C.; Jiaming, H.; Yisheng, Y. Economic-Environmental-Social Benefits Assessment of Wind Power Hydrogen Production Project Based on Cloud-multimoora Approach. Sustainability 2022, 14, 9118. [Google Scholar] [CrossRef]
- Leonhard, P.; Ramchandra, B. Analysis of the Levelized Cost of Renewable Hydrogen in Austria. Sustainability 2023, 15, 4575. [Google Scholar] [CrossRef]
- Haeseong, S.; Dohyung, J.; Sangdon, L. Techno-economic evaluation of green hydrogen production with low-temperature water electrolysis technologies directly coupled with renewable power sources. Energy Convers. Manag. 2023, 286, 117083. [Google Scholar]
- Tiago, R.L.; Ana, F.F.; RB Santos, P. Hydrogen production from the WindFloat Atlantic offshore wind farm: A techno-economic analysis. Appl. Energy 2022, 310, 118481. [Google Scholar]
- Quang, V.D.; Van Nguyen, D.; Hadi, M. A geospatial method for estimating the levelised cost of hydrogen production from offshore wind. Int. J. Hydrogen Energy 2023, 48, 15000–15013. [Google Scholar]
- Camilla, N.B.; Nima, B.G.; Gianluca, V. Assessment of offshore liquid hydrogen production from wind power for ship refueling. Int. J. Hydrogen Energy 2022, 47, 1279–1291. [Google Scholar]
- Huang, Z.; Yu, Y.; Chen, Y.; Tan, T.; Kong, X. Mapping of the Greenhouse Gas Emission Potential for the Offshore Wind Power Sector in Guangdong, China. Sustainability 2022, 14, 15533. [Google Scholar] [CrossRef]
- Song, S.; Lin, H.; Sherman, P.; Yang, X.; Nielsen, C.P.; Chen, X.; McElroy, M.B. Production of hydrogen from offshore wind in China and cost-competitive supply to Japan. Nat. Commun. 2021, 12, 6953. [Google Scholar] [CrossRef] [PubMed]
- Luo, Z.; Wang, X.; Wen, H.; Pei, A. Hydrogen production from offshore wind power in South China. Int. J. Hydrogen Energy 2022, 47, 24558–24568. [Google Scholar] [CrossRef]
- Torbjørn, E.; Jonas, F.J.; Øystein, U. Simulating offshore hydrogen production via PEM electrolysis using real power production data from a 2.3 MW floating offshore wind turbine. Int. J. Hydrogen Energy 2023, 48, 28712–28732. [Google Scholar]
- Umar, S.; Khalid, K.; Fahad, A. Techno-Economic Assessment and Operational Planning of Wind-Battery Distributed Renewable Generation System. Sustainability 2021, 13, 6776. [Google Scholar] [CrossRef]
- Dohyung, J.; Kilwon, K.; Kyong-Hwan, K. Techno-economic analysis and Monte Carlo simulation for green hydrogen production using offshore wind power plant. Energy Convers. Manag. 2022, 263, 115695. [Google Scholar]
- Mathieu, D.; Jaco, Q.; Jan, M. Assessing the environmental impacts of wind-based hydrogen production in the Netherlands using ex-ante LCA and scenarios analysis. J. Clean. Prod. 2021, 299, 126866. [Google Scholar]
- Suleman, F.; Dincer, I.; Agelin-Chaab, M. Comparative impact assessment study of various hydrogen production methods in terms of emissions. Int. J. Hydrogen Energy 2016, 41, 8364–8375. [Google Scholar] [CrossRef]
- Maciel, L.B.B.; Viola, L.; de Queiróz Lamas, W.; Silveira, J.L. Environmental studies of green hydrogen production by electrolytic process: A comparison of the use of electricity from solar PV, wind energy, and hydroelectric plants. Int. J. Hydrogen Energy 2023, 48, 36584–36604. [Google Scholar] [CrossRef]
- Ghandehariun, S.; Kumar, A. Life cycle assessment of wind-based hydrogen production in Western Canada. Int. J. Hydrogen Energy 2016, 41, 9696–9704. [Google Scholar] [CrossRef]
- Zhao, G.; Pedersen, A.S. Life cycle assessment of hydrogen production and consumption in an isolated territory. Procedia CIRP 2018, 69, 529–533. [Google Scholar] [CrossRef]
- You, C.; Kwon, H.; Kim, J. Economic environmental social impacts of the hydrogen supply system combining wind power natural gas. Int. J. Hydrogen Energy 2020, 45, 24159–24173. [Google Scholar] [CrossRef]
- Reiter, G.; Lindorfer, J. Global warming potential of hydrogen methane production from renewable electricity via power-to-gas technology. Int. J. Life Cycle Assess. 2015, 20, 477–489. [Google Scholar] [CrossRef]
- Cetinkaya, E.; Dincer, I.; Naterer, G.F. Life cycle assessment of various hydrogen production methods. Int. J. Hydrogen Energy 2012, 37, 2071–2080. [Google Scholar] [CrossRef]
- Superchi, F.; Papi, F.; Mannelli, A.; Balduzzi, F.; Ferro, F.; Bianchini, A. Development of a reliable simulation framework for techno-economic analyses on green hydrogen production from wind farms using alkaline electrolyzers. Renew. Energy 2023, 207, 731–742. [Google Scholar] [CrossRef]
- DL/T 5383-2007; Technical Specification of Wind Power Plant Design. People’s Republic of China Development and Reform Commission: Beijing, China, 2007.
- FD 001-2007; Preparation Rules and Calculationg Standard for Budgetary Estimation of Windpower Projects Feasibility Study Report. China Renewable Energy Engineering Institute: Beijing, China, 2007.
- GB/T 19568-2017; Code for Assembly and Installation of Wind Turbines. National Standards Committee: Beijing, China, 2017. Available online: http://c.gb688.cn/bzgk/gb/showGb?type=online&hcno=8CFB8DC8D696644560B9ED87294F51DF (accessed on 2 July 2024).
- GB/T 37898-2019; Safety Technical Regulations for Wind Turbine Lifting. National Standards Committee: Beijing, China, 2019. Available online: http://c.gb688.cn/bzgk/gb/showGb?type=online&hcno=53EFC925CA93F27175792F02EDBF2DE2 (accessed on 2 July 2024).
- China Electricity Council (CEC). List of 2022 National Electric Power Industry Statistical Express. 2023. Available online: https://www.cec.org.cn/upload/1/editor/1674033286551.pdf (accessed on 2 July 2024).
- Ma, Y.; Duan, H.; Li, Q.; Xie, M. Emission reduction benefits of wind farm GHGs based on life cycle analysis. J. Shenzhen Univ. (Sci. Technol. Ed.) 2020, 37, 653–660. [Google Scholar]
- Gao, C.; Na, H.; Song, K.; Dyer, N.; Tian, F.; Xu, Q.-J.; Xing, Y. Environmental impact analysis of power generation from biomass and wind farms in different locations. Renew. Sustain. Energy Rev. 2019, 102, 307–317. [Google Scholar] [CrossRef]
- Wang, Q.; Luo, K.; Wu, C.; Fan, J. Impact of substantial wind farms on the local and regional atmospheric boundary layer: Case study of Zhangbei wind power base in China. Energy 2019, 183, 1136–1149. [Google Scholar] [CrossRef]
- Corbière-Nicollier, T.; Laban, B.G.; Lundquist, L.; Leterrier, Y.; Månson, J.-A.E.; Jolliet, O. Life cycle assessment of biofibres replacing glass fibres as reinforcement in plastics. Resour. Conserv. Recycl. 2001, 33, 267–287. [Google Scholar] [CrossRef]
- Kabir, R.; Rooke, B.; Dassanayake, G.M.; Fleck, B.A. Comparative life cycle energy, emission, and economic analysis of 100 kW nameplate wind power generation. Renew. Energy 2012, 37, 133–141. [Google Scholar] [CrossRef]
- Xue, B.; Ma, Z.; Geng, Y.; Heck, P.; Ren, W.; Tobias, M.; Maas, A.; Jiang, P.; de Oliveira Jose, A.P.; Fujita, T. A life cycle co-benefits assessment of wind power in China. Renew. Sustain. Energy Rev. 2015, 41, 338–346. [Google Scholar] [CrossRef]
- Xu, L.; Yu, J.; Chen, Y. Analysis of carbon emission and energy accounting for wind farm operation. J. Dalian Polytech. Univ. 2020, 39, 281–288. [Google Scholar]
- Yang, J.; Chen, B. Integrated evaluation of embodied energy, greenhouse gas emission and economic performance of a typical wind farm in China. Renew. Sustain. Energy Rev. 2013, 27, 559–568. [Google Scholar] [CrossRef]
- Li, J.; Li, S.; Wu, F. Research on carbon emission reduction benefit of wind power project based on life cycle assessment theory. Renew. Energy 2020, 155, 456–468. [Google Scholar] [CrossRef]
- Schleisner, L. Life cycle assessment of a wind farm and related externalities. Renew. Energy 2000, 20, 279–288. [Google Scholar] [CrossRef]
- Carbon Emissions Trading Network. Electricity, Heat, Cooling, Steam Emission Factors. 2019. Available online: http://www.tanpaifang.com/tanguwen/2019/0831/65462.html (accessed on 2 July 2024).
- British Standards Institution (BSI). Guide to PAS 2050 How to Assess the Carbon Footprint of Goods and Services; British Standards Institution (BSI): London, UK, 2008. [Google Scholar]
- Trust, G.C. PAS 2050-Specification for the Assessment of the Life Cycle Greenhouse Gas Emissions of Goods and Service; British Standards Institution (BSI): London, UK, 2011. [Google Scholar]
- Lakeman, J.A. Climate Change 1995 the Science of Climate Charge; Intergovernmental Panel on Climate Change: Geneva, Switzerland, 1995. [Google Scholar]
- Intergovernmental Panel on Climate Change (IPCC). Climate Change. In The Physical Science Basis; Intergovernmental Panel on Climate Change: Geneva, Switzerland, 2007; ISBN 978 0521 88009 1. [Google Scholar]
- Heijungs, R.; Guinée, J.B.; Huppes, G.; Lankreijer, R.M.; Udo de Haes, H.A.; Wegener Sleeswijk, A.; Ansems, A.M.M.; Eggels, P.G.; van Duin, R.; de Goede, H.P. Environmental Life Cycle Assessment of Products: Guide and Backgrounds (Part 1); Centre of Environmental Science: Leiden, The Netherlands, 1992. [Google Scholar]
- Wenzel, H.; Hauschild, M.Z.; Alting, L. Environmental Assessment of Products: Volume 1: Methodology, Tools and Case Studies in Product Development; Springer Science & Business Media: Berlin/Heidelberg, Germany, 2000. [Google Scholar]
- Huijbregts, M.A.J.; Gilijamse, W.; Ragas, A.M.J.; Reijnders, L. Evaluating uncertainty in environmental life-cycle assessment. A case study comparing two insulation options for a Dutch one-family dwelling. Environ. Sci. Technol. 2003, 37, 2600–2608. [Google Scholar] [CrossRef]


Disclaimer/Publisher’s Note: The statements, opinions and data contained in all publications are solely those of the individual author(s) and contributor(s) and not of MDPI and/or the editor(s). MDPI and/or the editor(s) disclaim responsibility for any injury to people or property resulting from any ideas, methods, instructions or products referred to in the content. |
© 2024 by the authors. Licensee MDPI, Basel, Switzerland. This article is an open access article distributed under the terms and conditions of the Creative Commons Attribution (CC BY) license (https://creativecommons.org/licenses/by/4.0/).