Article

Effect of Eminex® on Greenhouse Gas and Ammonia Emissions from Dairy Slurry and Lagoon Wastewater

1
Department of Animal Sciences, University of California, Davis, CA 95616-8521, USA
2
Department of Biological and Agricultural Engineering, University of California, Davis, CA 95616-8521, USA
3
Air Quality Research Center, University of California, Davis, CA 95616-8521, USA
*
Author to whom correspondence should be addressed.
Sustainability 2024, 16(13), 5778; https://doi.org/10.3390/su16135778
Submission received: 6 June 2024 / Revised: 1 July 2024 / Accepted: 3 July 2024 / Published: 6 July 2024
(This article belongs to the Section Pollution Prevention, Mitigation and Sustainability)

Abstract

:
Manure management emits large quantities of greenhouse gases (GHG) in California. Eminex®, a manure additive, previously demonstrated significant GHG reductions in slurry. However, it has not been tested in lagoon wastewater. The aim of the present study was to investigate the effects of Eminex® on GHG, ammonia (NH3), and ethanol (EtOH) emissions from fresh dairy slurry and dairy lagoon wastewater. Both manures received the following treatments: high (1.0 kg Eminex®/m3 manure), low (0.5 kg Eminex®/m3 manure). Experiments were conducted in four replicates with an untreated manure control. The physical characteristics of the manure were determined during the monitoring periods of emissions: 7 days for slurry and 28 days for lagoon wastewater. All slurry emissions, except for N2O, declined over time (p < 0.05). Lagoon wastewater total N increased with treatment (p < 0.05) possibly due to the urea provided by Eminex®. Most lagoon wastewater emissions also decreased over time (p < 0.05). However, Eminex®, compared to control, increased lagoon wastewater NH3 volatilization (p < 0.05). With improvements to manure composition through increasing N content, as well as reductions in emissions, Eminex® is a promising tool to mitigate the negative environmental impacts of manure management.

1. Introduction

California leads the U.S. in gross milk production, home to 1.72 million lactating cows [1,2]. A mature cow produces 58–69 kg of manure daily [3], meaning 36.4 to 43.3 million metric tons (MMT) of manure must be managed annually in the state. About 54% of California dairy farms use anaerobic lagoons as their primary form of manure storage [4]. These lagoons lead to the formation of greenhouse gases (GHGs) like methane (CH4), carbon dioxide (CO2), and nitrous oxide (N2O) due to the anaerobic decomposition of volatile solids in manure [5,6]. Manure management is directly responsible for about 9.1% of the U.S.’s CH4 emissions [7]. Dairy manure represented approximately 25% of all CH4 emissions in California [8]. Manure management also contributes about 4.6% of direct nitrous oxide (N2O) emissions. Ammonia (NH3) is another key pollutant. Although NH3 is not a GHG, it is an air pollutant of concern that contributes to the formation of particulate matter 2.5 [PM2.5] that are small inhalable particles with a diameter of ≤2.5 microns with the ability to carry pathogens into lung tissue and cause serious human health issues [9,10]. Furthermore, the microbial processes that generate NH3 and other nitrogenous gases can also result in N2O production [7,11,12,13]. In addition, manure can be a source of ethanol (EtOH) emissions. EtOH is a volatile organic compound and often associated with malodor from manure and tropospheric ozone (O3) formation [14,15,16,17].
California legislation, specifically Senate Bill 1383 mandates a 40% reduction in CH4 originating from the agricultural sector below 2013 levels [18]. Two California government programs aim to address these issues: the Alternative Manure Management Program (AMMP) and the Dairy Digester Research & Development Program (DDRDP). Both programs help finance the installation of manure management tools, like solid separators or anaerobic digesters, on dairy farms meant to reduce emissions. Current AMMP projects are expected to offset 1.1 MMT carbon dioxide equivalents (CO2e) over the next 5 years [19]. Since launching in 2014, DDRDP has funded 117 anaerobic digesters which have cumulatively offset 22.95 MMT CO2e over 10 years or 2.3 MMT CO2e annually [20]. However, not all dairies qualify for financial aid and moreover, similar projects are not widely available in the U.S.
Aside from alternative manure management systems, which require costly equipment and on-farm infrastructural changes [1,21], research has looked at changing manure characteristics and using additives to help reduce emissions [5,6,13,22]. Manure additives and treatments offer cost-effective alternatives to hardware installations to reduce emissions. Larger hardware installations are often more beneficial for large dairy farms due to the economies of scale [23], while smaller dairy producers have fewer options through which they can offset manure emissions.
There are some manure additives that are commercially available such as SOP Lagoon. Additives can be used on dairies with different sizes. The SOP Lagoon was found to reduce GHG and NH3 emissions as well as the odor from lagoon wastewater [6,24]. SOP Lagoon is a calcium sulfate dihydrate compound, which is relatively abundant in nature and traditionally used to improve soil properties and formulated via proprietary technology [6]. Initially tested in laboratory settings, a dose of 61.6 g SOP Lagoon/m3 lagoon wastewater significantly reduced CO2, CH4, NH3, and N2O emissions and odor intensity [6]. A follow-up commercial on-farm trial in Italy found 80% reductions in CH4 and 75% reductions in CO2 after two months of treatment compared to untreated liquid manure [24].
Calcium cyanamide (CaCN2) was presented as an effective manure additive in reducing numerous emissions [13]. It is produced by combining calcium carbonate with charcoal, and passing it through nitrogen gas under white heat conditions [25]. Eminex® (Alzchem Group AG, Trostberg, Germany), is a granulated product containing CaCN2 and was first tested in a dairy slurry under a temperature controlled, sealed anaerobic system. Results showed that Eminex® reduced CO2, CH4, and N2O by 99%, 99%, and 88%, respectively [13,26]. However, to our knowledge, Eminex® has never been tested in dairy lagoon wastewater. The objectives of this research were to (1) determine the efficacy of Eminex® in reducing GHGs and other gaseous emissions from fresh dairy slurry and dairy lagoon wastewater within the context of U.S. manure management systems and (2) determine the characteristics of the slurry and lagoon wastewater after receiving the additive. It was hypothesized that a one-time application of Eminex® will significantly reduce gaseous emissions in both manure types.

2. Materials and Methods

A completely randomized design was utilized to determine the efficacy of Eminex® in reducing emissions from dairy slurry and lagoon wastewater. Eminex® is a granular, brick red compound with a density of 2.3 g/cm3, containing 43% CaCN2, 16.5% calcium hydroxide, 10% graphite, 10% calcium carbonate, 8% magnesium carbonate, 18% total N, 15% cyanamide-N, and 0.1% nitrate-N. Eminex® was applied to fresh dairy slurry and to dairy lagoon wastewater in two separate experiments (experiment 1 and experiment 2, respectively). Previous research with Eminex® used a closed, anaerobic, and temperature-controlled setup to monitor GHG and NH3 emissions [13]. The dairy cattle slurry was stored at 20.2 °C for 26 weeks, the duration of which mimicked the maximum storage length for slurry in Germany [13]. The present research versus the earlier European research better represents U.S. short-term storage conditions. Experiment 1 and 2 both took place during the summer in California, spanning May through August during which average daily ambient temperatures ranged from 13.1 °C to 23.5 °C.

2.1. Experiment 1—Slurry Collection and Experimental Set Up

Dairy feces and urine were collected from lactating dairy cows (days in milk: 102; milk yield: 40.8 kg/day) at the UC Davis Dairy Research Facility over two days, one week apart. Urine and feces were collected manually from the cows to eliminate cross contamination and premature NH3 volatilization. Experiment 1 was conducted to emulate manure collected using scraping system and vacuum trucks. During the summer, slurry collected by these systems can be spread in thin layers over concrete slabs to be sun dried for approximately 7 days [27,28] before it can be piled for composting in windrows.
Collected excreta were assembled into a slurry, with feces and urine combined at a ratio of 1.7:1.0 feces wt. to urine wt. [29] and homogenized for 60 s using an electric hand drill and paddle extension. The slurry was subsampled for chemical composition and pH was measured prior to the experimental start. The slurry was then placed in six ceramic bowls, with 2.26 kg slurry/bowl. Each bowl had a diameter of 25.4 cm and a depth of 5.08 cm (volume = 2574 cm3). Each bowl was randomly assigned a treatment prior to starting the experiment. There were two treatments (n = 4/treatment): (1) low dose at a rate of 0.5 kg Eminex®/m3 slurry (SL-LD) and (2) a high dose at a rate of 1 kg Eminex®/m3 slurry (SL-HD). In addition, an untreated control (SL-CONT; n = 4) was also tested. The HD treatment was the manufacturer-recommended dose for slurry. Given that Eminex® has not been tested in dairy lagoon wastewater before this study, it was crucial to determine a suitable dose of it for this diluted form of excreta. It was also of interest to test Eminex® at a lower dosage; therefore, 50% of the manufacturer-recommended dose was selected.
After Eminex® application, the slurry was mixed for an additional 60 s to allow for proper distribution, then each bowl immediately placed under a flux chamber (FC; Odotech Inc., Montreal, QC, Canada) to begin emissions measuring. The same protocol for feces and urine collection and treatment administration was repeated a week later. All FCs and bowls were spaced 1 m apart to prevent carryover and contamination between treatments. For the first 7 days, six bowls were monitored at a time. Two bowls per treatment group were randomly distributed in each round. The following week, the same procedure was repeated, and the next six bowls were monitored for 7 days.
All bowls were additionally sampled to analyze total solids (TS) [30], volatile fatty acids (VFAs), total N (TN) [31], and total C (TC) on day 0 and 7. The samples were frozen at −20 °C prior to being sent out to an independent lab for chemical analysis (Dairy One Forage Lab, Ithaca, NY, USA). The applied short-term storage of slurry may represent a dairy practice in which slurry collecting by either scraping or via vacuum trucks may undergo sun drying in thin layers before it is piled up and used for bedding.

2.2. Experiment 2—Lagoon Wastewater Collection and Experimental Setup

Lagoon wastewater was collected in batches from the uncovered lagoon of a 1000-head commercial dairy in Solano County, CA. Lagoon wastewater was collected in a plastic tote on three separate days every two weeks, using a trash pump (Honda Trash Pump WT20X, HONDA, Tokyo, Japan) then the lagoon wastewater was transported back to the UC Davis Feedlot Research Facility to commence emissions monitoring experiments.
Batches of 189 L of lagoon wastewater were dispensed into four, 208 L stainless steel barrels per collection batch (Uline, Pleasant Prairie, WI, USA). After filling, each barrel was homogenized via an electric hand drill with a paddle extension for 60 s. Then, samples were collected for each barrel on day 0 and the pH was measured using an Oakton® pH 5+ Handheld pH Meter (Cole-Parmer Instrument Company, LLC., Vernon Hills, IL, USA). Each barrel was randomly assigned a treatment prior to study start. There were two treatments, each with four replicates (n = 4/treatment): (1) low dose at a rate of 0.5 kg Eminex®/m3 lagoon wastewater (LW-LD) and (2) a high dose at a rate of 1 kg Eminex®/m3 lagoon wastewater (LW-HD). An untreated control (LW-CONT; n = 4) was also tested.
After applying Eminex®, barrels were mixed for another 60 s. The first four filled barrels were covered by FCs to start emissions monitoring. The same collection and treatment procedure above was repeated until 12 barrels were filled, across three collections, with four barrels filled per collection.
The staggering of collection, filling, and treatment application was unavoidable due to equipment restrictions, as only four FCs were available during experiment 2. There were three rows of four barrels, with treatments randomly distributed throughout each row, as shown in Figure 1. On each row’s respective day 0, the first sampling period started. At the end of day 14, the FCs were moved to the next row. On each row’s respective day 42, the second 14-day sampling period began (Figure 1). The lack of sufficient FCs made it impossible to simultaneously monitor all 12 barrels once they contained lagoon wastewater; therefore, no data were collected between sampling rounds. To minimize time between barrels filling while maximizing monitoring, the protocol described above was adopted. Barrels not being actively sampled were left uncovered throughout all rounds of sampling (day 15 to 41). Samples were collected from each barrel to analyze TS [30], TN [31], TC, and VFAs on day 0, 14, 28, and 56 of the trial. Samples were frozen at −20 °C prior to being sent out to an independent lab for analysis (Dairy One Forage Lab, Ithaca, NY, USA).
The VFA analysis protocol provided by Dairy One Forage Lab included dilution, blending, and filtration through a disposable syringe. Aliquots of the extracted mix were combined with 0.06 M oxalic acid containing 100 ppm trimethylacetic acid (internal standard). Samples were then injected into a Perkin Elmer Clarus 680 Gas Chromatograph (Perkin Elmer, Waltham, MA, USA) containing Supelco packed column (Sigma Aldrich, St. Louis, MO, USA) with the following specifications: 2 m × 2 m Tightspec ID and 4% Carbowax 20 M phase on 80/120 Carbopack B-DA [32,33,34].

2.3. Emissions Sampling

Emissions sampling, calculations, and statistical analysis were mostly similar for both experiments. The main difference was in sampling periods, as slurry bowls were sampled for 7 days, and lagoon wastewater barrels were sampled for 28 days. Gaseous emissions were monitored by an INNOVA 1412 photo-acoustic multi-gas analyzer (LumaSense Technologies Inc., Ballerup, Denmark) to quantify CO2, CH4, N2O, NH3, and ethanol (EtOH) emissions. The INNOVA 1412 analyzer had the following detection limits: minimum of 0.4 ppm CH4, 1.5 ppm CO2, 0.03 ppm N2O, 1.0 ppm NH3, and 0.08 ppm EtOH. Each FC was sampled at 20 min intervals in sequence over a 24 h period.

2.4. Emissions Calculations

Concentrations of measured gases in the FCs over the 24 h period were truncated to remove the first 12 and last 1 min of each 20 min sampling period to avoid carryover effects between treatments.
The emission rate for each gas was calculated as follows:
Gas   emission   rate   ( mg / h / m 2 ) = Cn   ×   FL   × 60 A   ×   MW × MV × Conv
where Cn = the net concentration of each gas, calculated as the difference between the measured concentration from each sample minus the background concentration of the fresh inlet air in either ppm or ppb; FL = the ambient air flow rate at 8 L/min and 60 is the conversion of minutes to hour; MW = the molecular weight of the gas in grams per mole; A = the cross-section area under the flux chamber, approximately 0.05 m2 for slurry bowls, and 0.25 m2 for lagoon wastewater barrels; Conv = a conversion factor of 10−3 for the concentration of ppm and 10−6 for the concentration of ppb; and MV = the volume of one molar gas at temperature 20 °C (24.04 L/mole).
The effect of the treatments on the emissions rates was calculated as a percentage of the emission rates of the control as follows:
Reduction   in   emissions   ( % ) = LSMT LSMC LSMT
where LSMT = least square means of emissions from the treatment, mg/h/m2; LSMC = least square means of emissions from the control, mg/h/m2. When the value of the nominator is negative, that means the treatment emitted less amounts of gas than the control and vice versa.

2.5. Statistical Analysis

Gaseous emissions and manure composition data were analyzed using a linear mixed effects model with repeated measures over time using the ‘lme4’ package of R version 4.1.2 [35]. Serial correlation structures and model selection were determined based on Akaike information criterion, Bayesian information criterion, and log likelihood [36]. Assumptions of normality and homogeneity of variances were checked, and appropriate logarithmic transformations were applied when necessary. Following the model selection criteria and model fit, different ‘rounds’ of monitoring were not included in gaseous emissions models. A two-way ANOVA was used to explore the effect of treatment, day, and the interaction, on emissions and the chemical composition of the lagoon wastewater and slurry, separately, according to the base model:
Ybtd = µ + βb + βt + βd + εbtd
where Ybtd = the dependent response variable; µ = mean of the response variable; β b = barrel/bowl (experimental unit, random variable); β t   = treatment; β d = day; and ε btd = the error terms for the models in question. Least squares means (LSM) were determined using “emmeans”. Pairwise treatment LSM comparisons were conducted using Tukey’s HSD post hoc analysis. The significance of fixed effects was evaluated using p-values. Differences were declared significant at p < 0.05 and trends at p < 0.1.

3. Results and Discussion

3.1. Physical Characteristics of Fresh Dairy Slurry

Table 1 shows the dairy slurry physical characteristic results. Slurry TS increased slightly in the control samples but significantly decreased in the treated slurry samples over time (p = 0.001). However, the two treatments showed no significant differences in TS values. Slurry TC increased over time in the control and the two treatments (p = 0.01), but the latter two were not significantly different. Decreasing TS in SL-LD and SL-HD were likely because CH4 and CO2 were still emitted throughout the monitoring period. The volatile solids, major constitutes of the TS of manure, are the precursors of CO2 and CH4 formation [37,38]. Reductions in gas emissions could be the reason for the TC increase over time.
Slurry TN also decreased over time (p = 0.02). However, all treatments were similar. The decrease in N might be due to the emissions of NH3 during the monitoring period. The pH for the present study was alkaline and the NH3-ammonium (NH4+) equilibrium favored NH3 formation in alkaline environments [29]. When applied to manure, the CaCN2 in Eminex® became dicyandiamide (DCD) and urea [25]. As TN decreased less in SL-LD and SL-HD compared to SL-CONT, despite high pH and low emissions (Figure 2d) in SL-HD, the hydrolysis of the urea from Eminex® might be affected by the high pH in SL-HD. The low hydrolysis of urea can result in low concentrations of NH4+, a main driving force of NH3 emissions and N losses from slurry. The degradation of urea is catalyzed by urease enzyme for which the maximum activity occurred at pH between 6.8 and 7.6 [39]. These pH values were lower that the measured ones in the present study.
The pH of the slurry did not differ significantly between the control and the treatments. The additive was meant to increase the pH of slurry because Eminex® contained calcium hydroxide, calcium carbonate, and magnesium carbonate. However, the same was not seen in the present study.
Table 1 also shows the VFA results. Acetic acid concentration increased over time (p < 0.001). There was a trend for the effect of treatment (p = 0.08), where SL-HD, compared to SL-CONT, had a 9.7% greater acetic acid concentration (p < 0.05), while SL-LD and SL-HD did not differ significantly. There was also a trend between SL-LD and SL-CONT, as SL-LD containing 8.8% more acetic acid (p < 0.1). Accumulation of acetic acid could indicate that methanogenesis had been inhibited by Eminex®. Previous work with Eminex® by Holtkamp, Clemens and Trimborn [13] also noted increased acetic acid concentrations in treated dairy slurry versus untreated slurry.
The concentration of propionic acid in slurry also increased over time (p < 0.001), by 21.0%, 24.0%, and 25.8% for SL-CONT, SL-LD, and SL-HD, respectively, compared to day 0. The increased concentration of propionic acid may be attributed to the presence of the alkaline pH that favored the production of propionic [40,41]. The concentration of butyric acid in slurry also significantly increased (p = 0.001) over the monitoring time, by 26.6% for SL-CONT and SL-LD, and 28.1% for SL-HD. Butyric acid concentrations were not significant in the treatments versus the control at any time point. Butyric acid concentration was the lowest of the three VFAs in slurry.

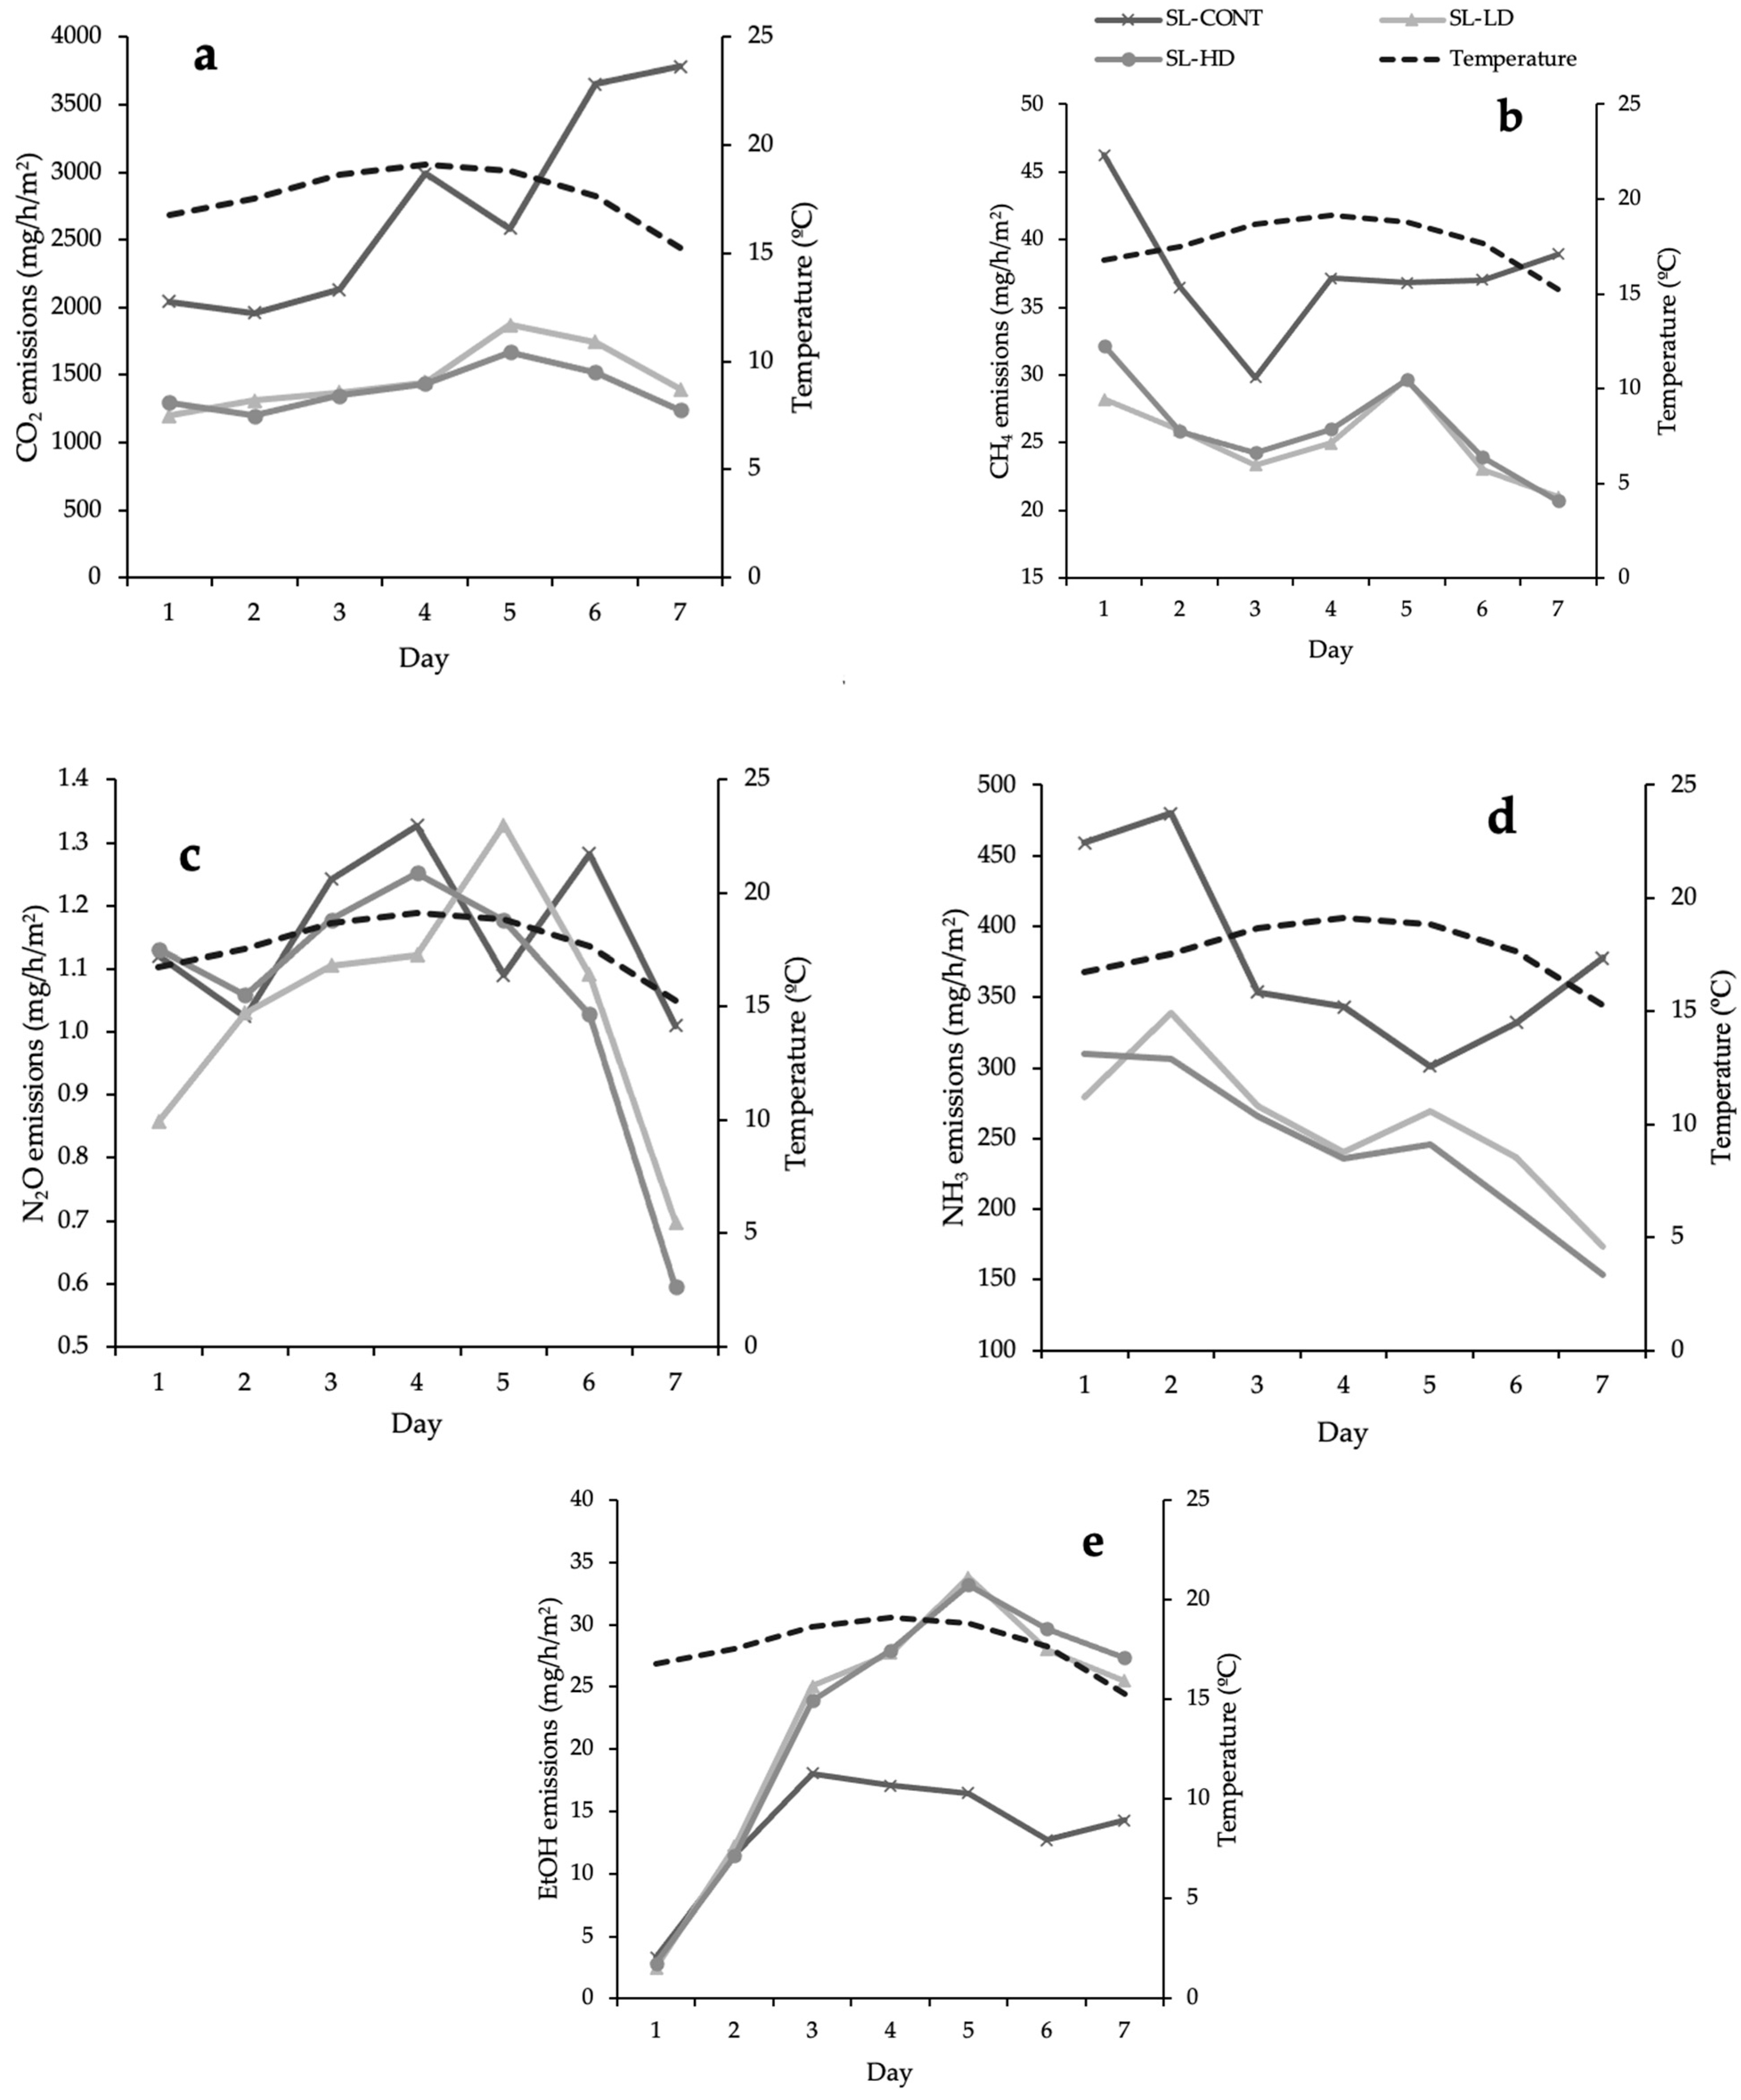
3.2. Fresh Slurry Gaseous Emissions

The Eminex® treatments with both doses elicited similar impacts to all gases, positively and negatively, except for N2O (Figure 2a–e). It was therefore possible that a smaller amount of Eminex® still offered emissions mitigation. Holtkamp, Clemens and Trimborn [13] also mentioned that Eminex® started suppressing gas production within 40 min of application. This explained the discrepancies seen in gaseous production between LD, HD, and CONT on day 1 (Figure 2a–e).
Gaseous flux data are presented in Table 2. The first GHG, CO2 decreased over time across treatments (Figure 2a; p = 0.02). Both SL-LD and SL-HD, versus SL-CONT, tended to emit 44.4% and 49.3% less CO2, respectively, with a trend for treatment effect (p < 0.1). The differences between Eminex® treated groups and SL-CONT were significant (p < 0.05), but SL-LD and SL-HD did not differ significantly. With the accumulation of acetic acid, this meant that acidogenesis, the transformation of monosaccharides into VFAs, was occurring [42] but acetogenesis, which transformed VFAs and alcohols into acetate, hydrogen (H2), CH4, and CO2 was not [43,44]. The reductions in CO2 were lower than reductions seen by Holtkamp, Clemens and Trimborn [13], in which Eminex® reduced CO2 by 81% to 99%. The difference in gas reduction was likely due to differences in experimental setup and the characteristics of manure. Influence of temperature, wind, and other environmental factors could have prevented Eminex® from reducing CO2 as aggressively as in Holtkamp, Clemens and Trimborn [13], who used a sealed storage system. Regardless, the present study showed that Eminex® still reduced CO2 emissions from slurry stored outdoors.
CH4 emissions across treatments decreased over time (Figure 2b; p = 0.01), and SL-LD and SL-HD versus SL-CONT tended to show 30.1% and 30.4% lower emissions, respectively (p < 0.1). CH4 emissions from SL-CONT compared to the two treated groups significantly differed (p < 0.05), but the two treated groups did not differ significantly at any time point over the monitoring period. The reduction in CH4 might explain the accumulation of VFAs [45,46,47]. Gases like CH4 remove H2 and consume reducing equivalents (e.g., nicotinamide adenine dinucleotide (NAD) plus hydrogen (NADH)) to allow microbial fermentation to continue [9]. VFAs, products of acidogenesis and acetogenesis, are precursors for CH4 and CO2 [48,49]. The accumulation of VFAs and the decline of CH4 may indicate that Eminex® interrupted methanogenesis, as the accumulation of acetic acid meant a buildup of H2 and reducing equivalents. The effect of the Eminex® on the manure microbiome requires further research to determine if only methanogens are directly impacted or if the entire microbiome is affected by Eminex®.
The CH4 mitigation of experiment 1 was also less substantial than the 99% CH4 reduction reported by Holtkamp, Clemens and Trimborn [13]. The differences between the two studies may be attributed to the differences in characteristics of manure, particularly the total and volatile solid contents, and the temperature of the slurry in each study. Holtkamp et al. (2023) [13] maintained a consistent temperature of 20.2 °C. High ambient temperatures can accelerate the degradation of volatile solids in manure and enhance gas emission potential [38,50,51]. The present study was carried out at ambient temperatures ranged from 13.1 °C to 23.5 °C, and LD and HD Eminex® treatments still reduced CH4 emissions.
The emission rates of N2O had no significant differences across control and the two treatments (Figure 2c). The short monitoring time (7 days) might explain the lack of the mitigation of N2O emissions. Holtkamp, Clemens and Trimborn [13] reported a 60% reduction in N2O after 26 weeks. Park, et al. [52] found that the application of DCD decreased N2O by 59.8% following a 56 day application period. As DCD is present in Eminex®, it was possible that with a longer monitoring time, there might have been a more substantial reduction in N2O emissions.
NH3 emissions decreased over time (Figure 2d; p < 0.05) with the effect of treatment (p = 0.04). NH3 losses from SL-LD and SL-HD were 28.8% and 34.9% lower, respectively, than SL-CONT (p < 0.05). However, SL-LD and SL-HD were not significantly different at any time point. Reductions in NH3 in experiment 1 could be due to DCD, which is a nitrification inhibitor. The DCD could also inhibit NH4+ oxidation via deactivating the NH3 monooxygenase enzyme, thereby preventing NH3 formation [53]. By the end of the sampling period, the slurry had formed thin crusts. Crusting is another physical factor that reduces NH3 emissions by preventing the gas to scape [54]. However, the crust was broken on day 4 for sampling and emissions did not subsequently increase (Figure 2d). This confirmed that Eminex® effectively reduced NH3 emissions from slurry.
Conversely, EtOH emissions across treatments increased over the monitoring time (Figure 2e; p < 0.001). Compared to SL-CONT, SL-LD and SL-HD emitted 68.8% and 67.9% more EtOH (p < 0.001). Emissions from SL-LD and SL-HD differed versus SL-CONT (p < 0.05), but SL-LD and SL-HD were similar. As a carbon-based compound (CH3CH2OH), increasing EtOH losses explained why TS and TC of SL-LD and SL-HD decreased compared to SL-CONT. Eminex® might interrupt the metabolic pathways associated with normal manure fermentation, and EtOH emissions increased to allow fermentation to continue. This could be attributed to the H2 removal as EtOH. As a byproduct of fermentable sugars hydrolysis produced via microbial fermentation, EtOH formation consumed reducing equivalents and H2 [55].
Prior to this study, Eminex® had never been tested in a liquid manure, which is one of the most popular systems of manure storage in the U.S. Therefore, experiment 2 aimed to quantify the efficacy of Eminex® in mitigating emissions from lagoon wastewater. Unlike in slurry, EtOH was not detected in lagoon wastewater.

3.3. Physical Characteristics of Dairy Lagoon Wastewater

The chemical composition of the dairy lagoon wastewater is presented in Table 3. Lagoon wastewater TS increased over time (p = 0.01). Compared to d 0, TS content of treatments LW-LD and LW-HD increased by 23.8% and 33.3%, respectively (p < 0.05). The TS of LD and HD treatments were not significantly different. Paired with decreased CH4 emissions, increased TS meant that less solids from lagoon wastewater was fermented into CH4 and CO2 (i.e., biogas).
Lagoon wastewater TN increased over time (p < 0.001). Compared to LW-CONT, LW-LD and LW-HD contained 33.3% more TN (p < 0.05). However, LW-LD and LW-HD were similar to each other. Additionally, LW-HD and LW-LD contained higher amounts of TN compared to LW-CONT. This was likely due to the 40% N in Eminex®, as NH3 losses in experiment 2 should have decreased the TN in lagoon wastewater [13,25,52]. Increasing TN in lagoon wastewater would benefit farmers applying manure to their crop fields, as N is an essential nutrient for plant growth and is often limiting [12,56].
Lagoon wastewater TC across treatments increased over time (p < 0.001). TC content increased by 13.6%, 18.1%, and 10.0% for LW-LD, LW-HD, and LW-CONT, respectively, compared to day 0. However, TC across all three treatments were similar. In experiment 2, Eminex® improved the composition of lagoon wastewater, resulting in more TC compared to untreated lagoon wastewater. Evaporation could have contributed to increasing TC due to hot ambient temperatures, as concentration increased with water removal [57]. However, it was also possible that Eminex® inhibited C losses by suppressing CO2 and CH4 emissions (Table 4).
In lagoon wastewater, pH across all treatments became more alkaline over time (p < 0.001). However, pH in the control and treatments were similar. This may indicate that lagoon wastewater had enough buffer capacity preventing Eminex® from changing the lagoon wastewater pH.
The concentrations of acetic acid are shown in Table 3. Other VFAs were also quantified; however, they were below the detectable limits of the Dairy One Forage Lab equipment (>1 ppm). Because the present study took place over the summer in California, the high ambient temperatures could have degraded VFAs faster in the lagoon wastewater before the samples were collected, thus making them undetectable [58]. Acetic acid concentrations increased over time (p < 0.001) and tended to differ across treatments (p < 0.1), with LW-LD and LW-HD acetic acid concentrations versus LW-CONT increasing by 608.7% and 526.2%, respectively. Acetic acid content of LW-LD and LW-HD differed from LW-CONT (p < 0.05), but LW-LD and LW-HD did not significantly differ. The increased acetic acid concentration might be attributed to the higher acidogenesis versus methanogenesis rates that led to lower methane emissions as discussed in the following section [48,49]. More research is needed to evaluate the effect of the Eminex® on the activity of acidogenesis.

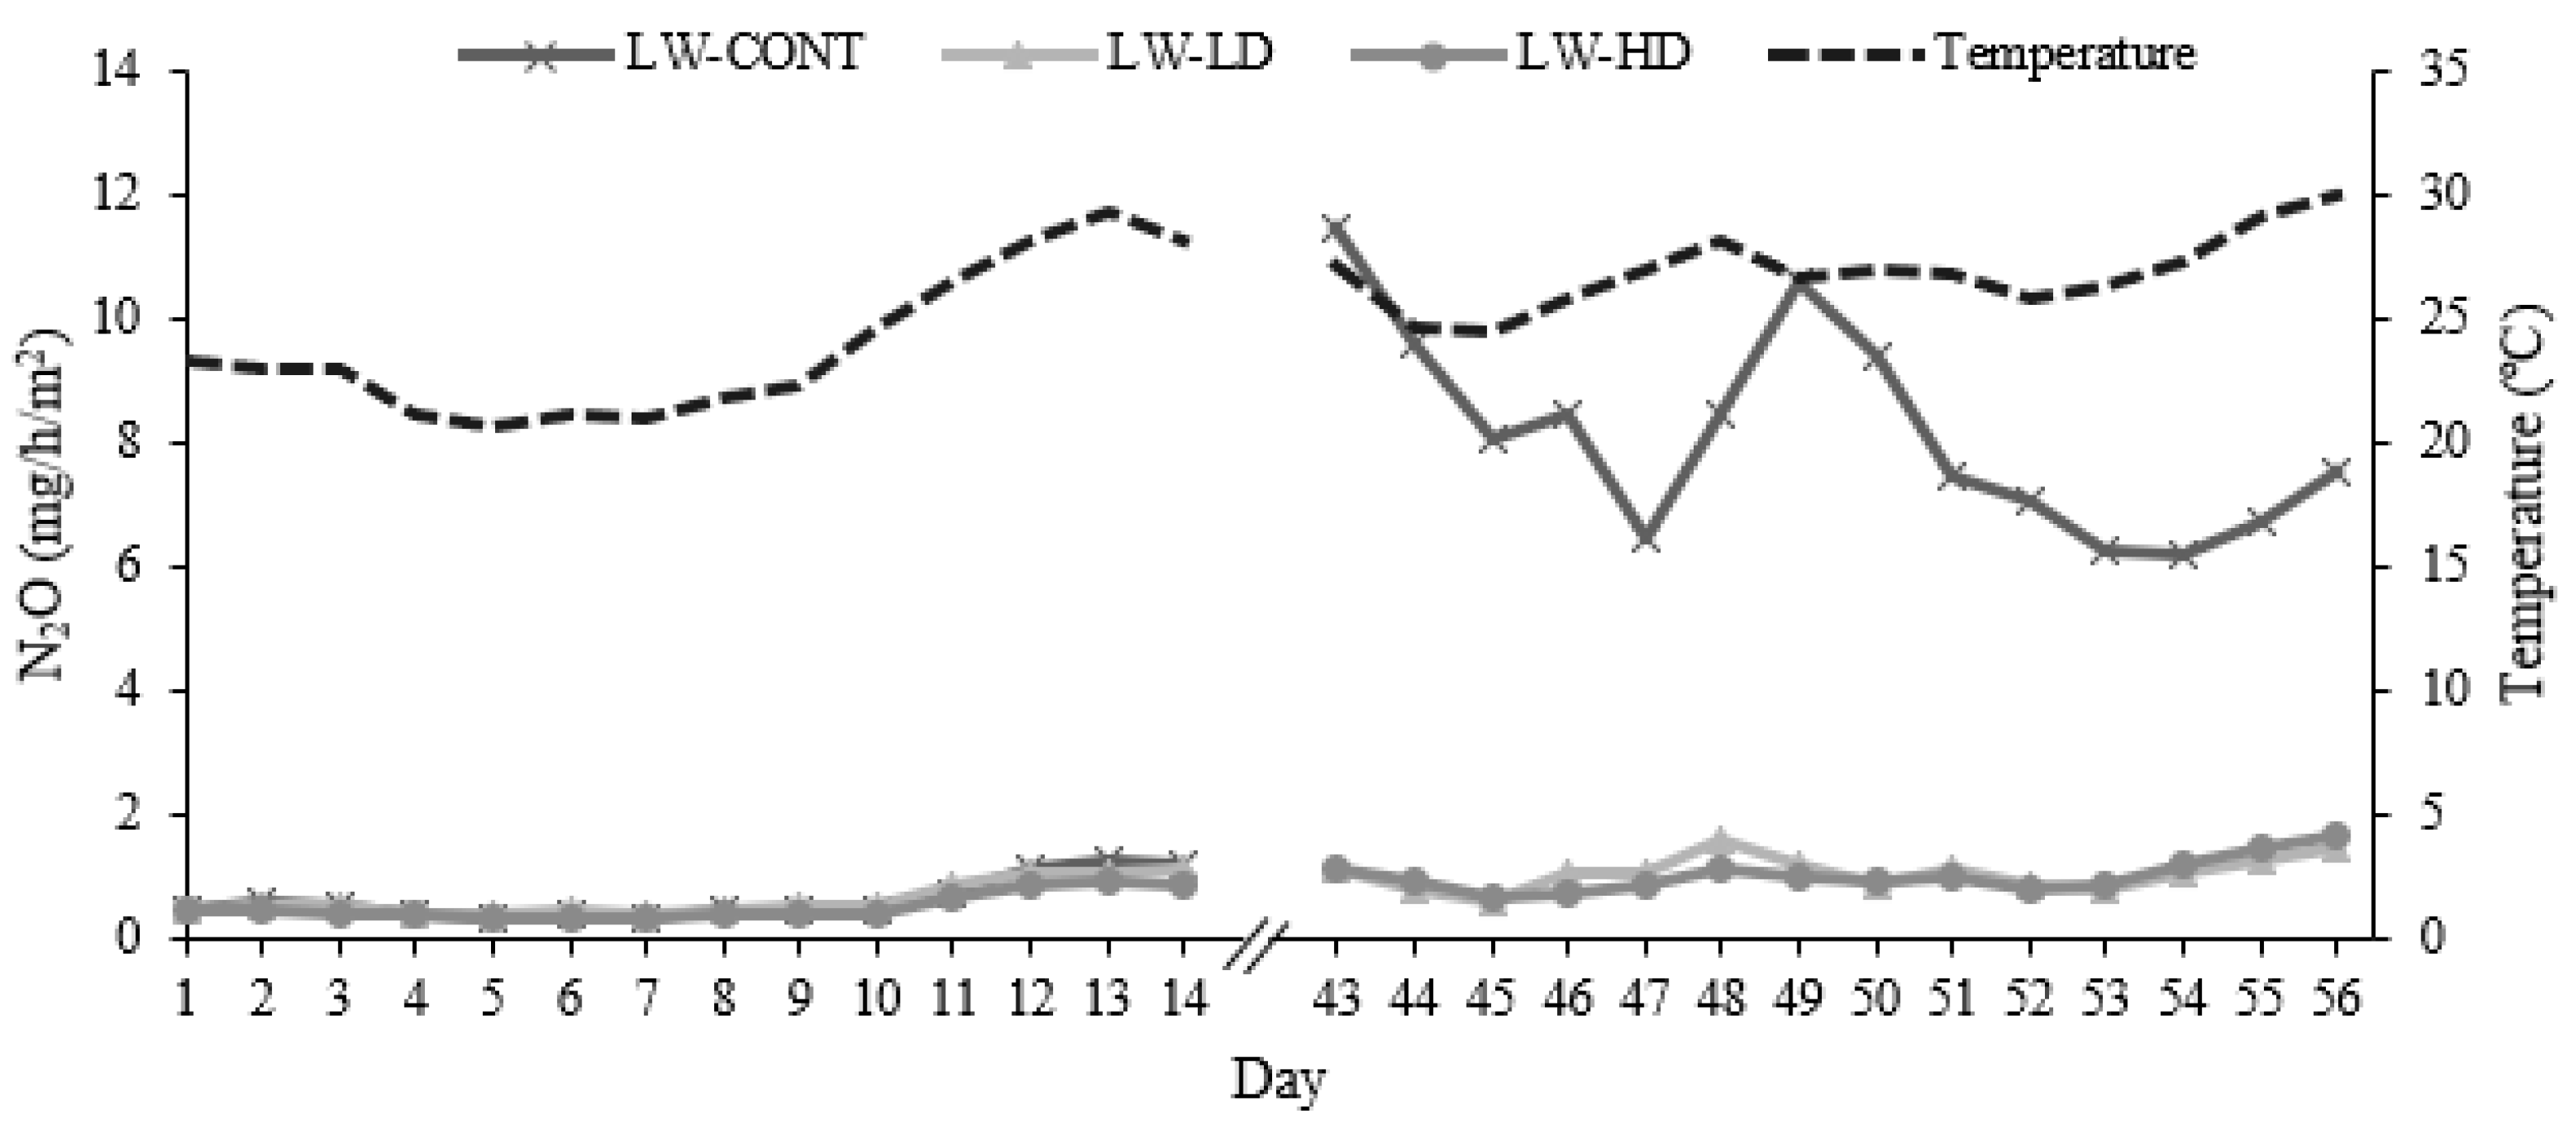
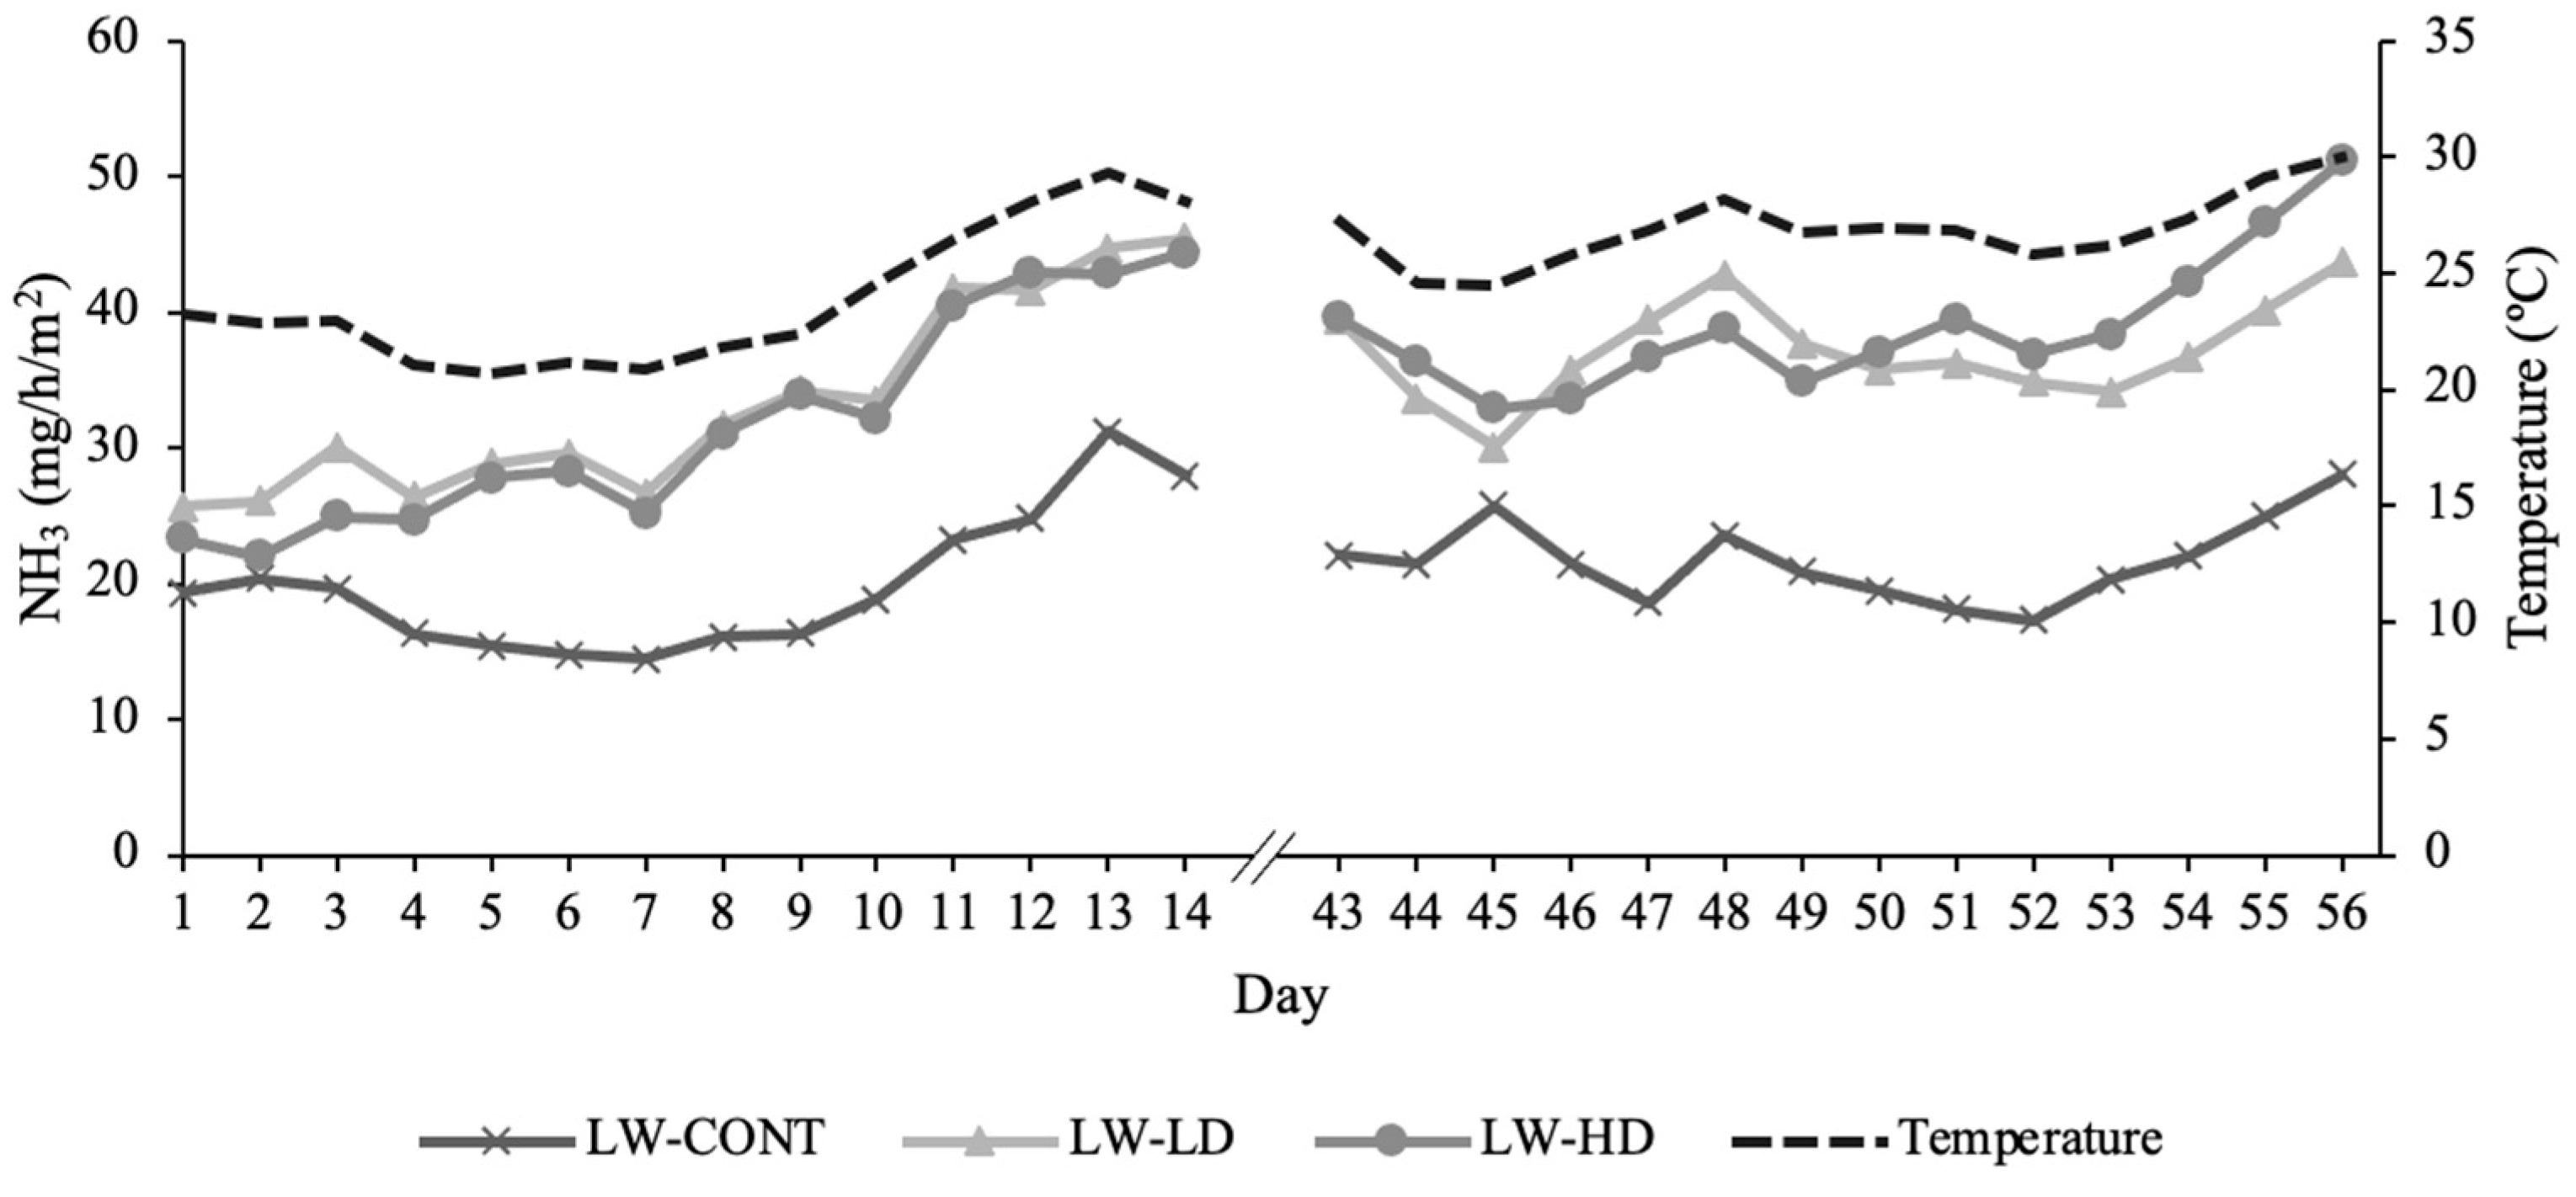
3.4. Lagoon Wastewater Gaseous Emissions

Eminex® treatments, LD and HD, respectively, elicited similar suppression patterns like in the slurry experiment (experiment 1). The rapid action of Eminex®, mentioned in Section 3.1, was also confirmed in lagoon wastewater, leading to prominent difference between LD, HD, and CONT treatments already on day 1. The experiment 2 gaseous emissions are shown in Table 4.
Emissions of CO2 decreased over time (Figure 3; p < 0.001). Emissions of CO2 from LW-LD and LW-HD, versus LW-CONT, were 2.9% and 12.0% lower, respectively (p < 0.1). However, CO2 emissions for the treatments did not significantly differ from the control. The suppression of carbon-based GHGs also contributed to the increased TC, as seen in LW-LD and LW-HD (Table 3). Eminex® seemed to be less effective at suppressing CO2 in lagoon wastewater compared to dairy slurry. The difference could have been caused by the experimental setup and the variations in the slurry and wastewater compositions. Experiment 2 took place during a hotter part of the year and the barrels had a larger emitting surface area. Heat and wind turbulence affected mass transfer between dissolved organic carbon, leading to steep concentration gradients and greater O2 consumption in lagoon wastewater [59]. With sufficient O2 present at the wastewater surface, aerobic microorganisms could continue transforming CH4 into CO2 via oxidation [6,60]. As previously mentioned, this was a smaller reduction compared to those reported by Holtkamp, Clemens and Trimborn [13] though there were differences in the temperatures and types of manure used in both studies.
For CH4, emissions decreased over time (Figure 4; p < 0.001). CH4 emission rates for LW-LD and LW-HD, versus LW-CONT, decreased by 80.9% and 85.1% for LW-LD and LW-HD, respectively, (p < 0.05), while LW-LD and LW-HD did not differ significantly. Like in the slurry experiment, it was assumed that methanogenesis was suppressed in lagoon wastewater. Throughout the present study, ambient temperatures also did not negatively impact Eminex®’s ability to suppress CH4 emissions from lagoon wastewater. Eminex® had previously been tested in temperature-controlled settings at 20.2 °C [13]. Experiment 2 occurred from June to August in California with temperatures spiking to 43 °C. At higher temperatures, volatile solids degraded faster and led to more CH4 [21,37,38].
For N2O, emissions also declined across treatments over time (Figure 5; p < 0.001). LW-LD and LW-HD, versus LW-CONT, emitted 81.1% and 82.7% less N2O, respectively. The difference in reduction of N2O between slurry and wastewater confirmed the hypothesis that more time was needed for the DCD in Eminex® to reduce N2O emissions, given that lagoon wastewater was monitored for 28 days and slurry was monitored for only 7 days. Increased NH3 losses could also contribute to N2O reductions, as the reactive N capable of becoming N2O was prematurely emitted as NH3 [9,61]. Despite the lack of N2O reductions in the slurry experiment, treating lagoon wastewater with Eminex® demonstrated a significant emission mitigation for this potent, nitrogenous GHG.
Unlike in slurry, NH3 emissions of the treated samples significantly increased over time (Figure 6; p < 0.001). Compared to LW-CONT, emissions increased by 65.3% and 65.7% for LW-LD and LW-HD, respectively. There were no significant differences between the treatment at any time point. Because the lagoon wastewater experiment was conducted at ambient temperature and exposed to wind, it was possible that climactic factors led to increased volatilization. Wind speed and temperature have been found to explain about 60% of variation in NH3 losses, with up to 35% more NH3-N loss in warmer climates [59]. Increasing temperature and wind speed enhanced emissions since this directly affected the NH3-NH4+ equilibrium and the diffusion and convection of gases near emitting surfaces [51].
Like temperature, the pH of the lagoon wastewater was an important factor influencing the NH3-NH4+ equilibrium [29]. The pH for Eminex® treated groups were 7.77–7.79, favoring NH3 volatilization with the greatest release occurring between pH 7 and 10 [29]. Paired with the urea content of Eminex® (40% N), this resulted in more N available to become NH3, especially since the pH in the wastewater was relatively lower, favoring higher urease activity [39] than that of the slurry.

3.5. Future of Eminex®

Eminex® is easy to use, existing as a granulated powder that can easily be applied. Its ability to reduce GHGs and NH3 make it a powerful additive in addressing manure-based emissions. Furthermore, Eminex®’s efficacy in different manure types open it up for use by most dairy farmers. As shown in slurry and lagoon wastewater, there were no differences between the high and low dose, meaning that substantial reductions in emissions can still be achieved with lower, more practical doses. Research is needed to determine how low the dose can be while maintaining emissions reductions. There are some key environmental considerations, like impacts to aquatic ecosystems that must be monitored and protected, as the manufacturer data sheet states that CaCN2 is toxic to aquatic environments due to hydrolysis in water. Responsible usage and proper disposal must be adhered to if Eminex® is to be used in a commercial setting. Moreover, increased N contents in slurry and lagoon wastewater may increase the potential of emissions of nitrogenous gases. Further studies are needed to evaluate the effect of the additive post-storage of these materials.
The main issue lies in the manufacturer-recommended dose of 1 kg Eminex®/m3 manure and cost. Eminex® is quoted as being €2 to €3/kg or $2.17 to $3.29/kg (personal communication). At the manufacturer-recommended dose that lasts for 12 weeks, a 1000-head dairy with a 95,000 m3 lagoon would require 95 tons of Eminex® and cost the farmer $3.72/cow/day [62]. Additional research is needed to pursue more in-depth cost comparisons between Eminex® and other similar manure management technologies such as anaerobic digestion and aeration.

4. Conclusions

Eminex® demonstrated consistent, strong mitigative effects for GHGs in slurry and lagoon wastewater. Eminex® reduced CO2, CH4, and NH3 in fresh dairy slurry. However, N2O was unchanged and EtOH increased. In lagoon wastewater, CO2, CH4, and N2O all decreased with Eminex® treatment. However, NH3 increased. The reduction in the emissions of CO2 and CH4 could be due to the inhibitory effect of the additive on methanogenesis. The contradictory effect of the additive on the emission of NH3 from the slurry and wastewater may be attributed to its effect on urease activity that depends on the pH of both materials. The quality of manure also improved, containing more N and C after treatment. The present study simulated batch storage of slurry and lagoon wastewater. While it is mimicking the situation of slurry handling before sun drying, it does not accurately mimic the feeding regime of anaerobic lagoons, where new manure is added multiple times per day. Additional research is needed to test the additive in laboratory using fed-batch storage systems, and in a commercial setting to see if Eminex® is capable of continuously reducing emissions with daily added manure.
Even so, Eminex® remains a potent option to help reduce GHG emissions from manure management in the dairy sector. Eminex® showed gas reductions at 50% of the manufacturer-recommended dose, with no significant differences between treatment levels. Future research should establish lower doses to help minimize labor and financial costs. Establishing a low dose through a titration study is especially important for use in lagoon wastewater, as its composition differs significantly from slurry. It would be prudent to test its efficacy again on a commercial farm to quantify emissions reductions. A longitudinal emissions study is also highly recommended to help determine the long-term impacts of Eminex® on GHG emissions.

Author Contributions

Conceptualization, A.S.R., B.M. and H.M.E.M.; methodology, A.S.R., B.M., H.M.E.M., Y.P. and Y.Z.; software, Y.P. and Y.Z.; validation, Y.P. and Y.Z.; formal analysis, A.S.R.; investigation, A.S.R. and B.M.; resources, F.M.M.; data curation, Y.P.; writing—original draft preparation, A.S.R.; writing—review and editing, A.S.R., H.M.E.M. and F.M.M.; visualization, A.S.R.; supervision, F.M.M.; project administration, F.M.M.; funding acquisition, F.M.M. All authors have read and agreed to the published version of the manuscript.

Funding

This research received no external funding.

Institutional Review Board Statement

Not applicable.

Informed Consent Statement

Not applicable.

Data Availability Statement

The data presented in this study are available on request from the corresponding author.

Acknowledgments

The authors would like to thank the efforts of the undergraduate research interns involved in this project and their overall invaluable contributions to running the experiment.

Conflicts of Interest

The authors declare no conflict of interest.

References

  1. El Mashad, H.M.; Barzee, T.J.; Franco, R.B.; Zhang, R.; Kaffka, S.; Mitloehner, F. Anaerobic Digestion and Alternative Manure Management Technologies for Methane Emissions Mitigation on Californian Dairies. Atmosphere 2023, 14, 120. [Google Scholar] [CrossRef]
  2. USDA. Pacific Region Milk Production. 2021; pp. 1–2. Available online: https://www.nass.usda.gov/Statistics_by_State/California/Publications/Livestock_Releases/Milk_Production/2022/202208MILKPROD.pdf (accessed on 10 December 2023).
  3. Varma, V.S.; Parajuli, R.; Scott, E.; Canter, T.; Lim, T.T.; Popp, J.; Thoma, G. Dairy and swine manure management—Challenges and perspectives for sustainable treatment technology. Sci. Total Environ. 2021, 778, 146319. [Google Scholar] [CrossRef] [PubMed]
  4. EPA. Annexes to the Inventory of U.S. Greenhouse Gas Emissions and Sinks; EPA: Washington, DC, USA, 2023; pp. 1–531.
  5. Sokolov, V.K.; VanderZaag, A.; Habtewold, J.; Dunfield, K.; Wagner-Riddle, C.; Venkiteswaran, J.J.; Crolla, A.; Gordon, R. Dairy manure acidification reduces CH4 emissions over short and long-term. Environ. Technol. 2021, 42, 2797–2804. [Google Scholar] [CrossRef]
  6. Peterson, C.B.; El Mashad, H.M.; Zhao, Y.; Pan, Y.; Mitloehner, F.M. Effects of SOP Lagoon Additive on Gaseous Emissions from Stored Liquid Dairy Manure. Sustainability 2020, 12, 1393. [Google Scholar] [CrossRef]
  7. EPA. Inventory of U.S. Greenhouse Gas Emissions and Sinks: 1990–2021. 2023; pp. 1–881. Available online: https://www.epa.gov/system/files/documents/2023-04/US-GHG-Inventory-2023-Main-Text.pdf (accessed on 10 December 2023).
  8. CARB. Current California GHG Emission Inventory Data. Available online: https://ww2.arb.ca.gov/ghg-inventory-data (accessed on 10 December 2023).
  9. Wattiaux, M.A.; Uddin, M.E.; Letelier, P.; Jackson, R.D.; Larson, R.A. Invited Review: Emission and mitigation of greenhouse gases from dairy farms: The cow, the manure, and the field. Appl. Anim. Sci. 2019, 35, 238–254. [Google Scholar] [CrossRef]
  10. EPA. Particulate Matter (PM) Basics. Available online: https://www.epa.gov/pm-pollution/particulate-matter-pm-basics (accessed on 25 June 2024).
  11. Khairunisa, B.H.; Loganathan, U.; Ogejo, J.A.; Mukhopadhyay, B. Nitrogen transformation processes catalyzed by manure microbiomes in earthen pit and concrete storages on commercial dairy farms. Environ. Microbiome 2023, 18, 32. [Google Scholar] [CrossRef] [PubMed]
  12. Fowler, D.; Coyle, M.; Skiba, U.; Sutton, M.A.; Cape, J.N.; Reis, S.; Sheppard, L.J.; Jenkins, A.; Grizzetti, B.; Galloway, J.N.; et al. The global nitrogen cycle in the twenty-first century. Philos. Trans. R. Soc. B 2013, 368, 20130164. [Google Scholar] [CrossRef] [PubMed]
  13. Holtkamp, F.; Clemens, J.; Trimborn, M. Calcium cyanamide reduces methane and other trace gases during long-term storage of dairy cattle and fattening pig slurry. Waste Manag. 2023, 161, 61–71. [Google Scholar] [CrossRef]
  14. Shaw, S.L.; Mitloehner, F.M.; Jackson, W.; DePeters, E.J.; Fadel, J.G.; Robinson, P.H.; Holzinger, R.; Goldstein, A.H. Volatile Organic Compound Emissions from Dairy Cows and Their Waste as Measured by Proton-Transfer-Reaction Mass Spectrometry. Environ. Sci. Technol 2007, 41, 1310–1316. [Google Scholar] [CrossRef] [PubMed]
  15. Filipy, J.; RUmburg, B.; Mount, G.; Westberg, H.; Lamb, B. Identification and quantification of volatile organic compounds from a dairy. Atmos. Environ. 2006, 40, 1480–1494. [Google Scholar] [CrossRef]
  16. Yuan, B.; Coggon, M.M.; Koss, A.R.; Warneke, C.; Eilerman, S.; Peischl, J.; Aikin, K.C.; Ryerson, T.B.; de Gouw, J.A. Emissions of volatile organic compounds (VOCs) from concentrated animal feeding operations (CAFOs): Chemical compositions and separation of sources. Atmos. Chem. Phys. 2017, 17, 4945–4956. [Google Scholar] [CrossRef]
  17. El-Mashad, H.M.; Zhang, R.; Rumsey, T.; Hafner, S.; Montes, F.; Rotz, A.C.; Arteaga, V.; Zhao, Y.; Mitloehner, F.M. A Mass Transfer Model of Ethanol Emission from Thin Layers of Corn Silage. J. ASABE Trans. 2010, 53, 1903–1909. [Google Scholar] [CrossRef]
  18. Lara, S.; Williams, A.; Allen, S.; Gonzalez, A.; Hancock, S.; Hill, S. Senate Bill No. 1383. 2016. Available online: http://www.leginfo.ca.gov/pub/15-16/bill/sen/sb_1351-1400/sb_1383_bill_20160831_amended_asm_v95.pdf (accessed on 10 December 2023).
  19. CDFA. Alternative Manure Management Program. Available online: https://www.cdfa.ca.gov/oefi/AMMP/ (accessed on 10 December 2023).
  20. CDFA. Dairy Digester Research & Development Program. Available online: https://www.cdfa.ca.gov/oefi/ddrdp/ (accessed on 5 June 2024).
  21. Meyer, D.; Heguy, J.; Karle, B.; Robinson, P. Characterize Physical and Chemical Properties of Manure in California Dairy Systems to Improve Greenhouse Gas Emission Estimates; University of California, Davis: Davis, CA, USA, 2019; pp. 1–70. [Google Scholar]
  22. Hou, Y.; Velthof, G.L.; Oenema, O. Mitigation of ammonia, nitrous oxide and methane emissions from manure management chains: A meta-analysis and integrated assessment. Glob. Chang. Biol. 2014, 21, 1293–1312. [Google Scholar] [CrossRef] [PubMed]
  23. Cowley, C.; Brorsen, B.W. Anaerobic Digester Production and Cost Functions. Ecol. Econ. 2018, 152, 347–357. [Google Scholar] [CrossRef]
  24. Chiodini, M.E.; Constantini, M.; Zoli, M.; Bacenetti, J.; Aspesi, D.; Poggianella, L.; Acutis, M. Real-Scale Study on Methane and Carbon Dioxide Emission Reduction from Dairy Liquid Manure with the Commerical Additive SOP LAGOON. Sustainability 2023, 15, 1803. [Google Scholar] [CrossRef]
  25. Dixon, G.R. Calcium Cyanamide—A Synoptic Review of an Environmentally Benign Fertiliser Which Enhances Soil Health. In Proceedings of the XXVIIIth IHC—IS on Environmental, Edaphic & Gen Factors Affecting Plants, Seeds, and Turfgrass, Lisbon, Portugal, 22–27 August 2010; 2012. Available online: https://www.researchgate.net/publication/284135320_Calcium_cyanamide_-_A_synoptic_review_of_an_environmentally_benign_fertiliser_which_enhances_soil_health (accessed on 10 December 2023).
  26. Hermann, C.; Jost, C.; Theuerl, S.; Mundt, K.; Bock, D. To determine the effect of calcium cyanamide additives on methane emissions during the storage of livestock slurry under anaerobic conditions. 2021; 1–40. [Google Scholar]
  27. CDFA. Recommendations for Short-Lived Climate Pollutants; California Department of Food and Agriculture: Sacramento, CA, USA, 2015; pp. 1–26.
  28. Kaffka, S.; Barzee, T.J.; El Mashad, H.; Williams, R.; Zicari, S.; Zhang, R. Evaluation of Dairy Manure Management Practices for Greenhouse Gas Emissions Mitigation in California; UC Davis: Davis, CA, USA, 2016; pp. 1–127. [Google Scholar]
  29. Hristov, A.N.; Hanigan, M.; Cole, A.; Todd, R.; McAllister, T.A.; Ndegwa, P.M.; Rotz, A. Review: Ammonia emissions from dairy farms and beef feedlots. Can. J. Anim. Sci. 2011, 91, 135. [Google Scholar] [CrossRef]
  30. Hoskins, B.; Wolf, A.; Wolf, N. Dry Matter Analysis; A3769; University of Wisconsin Extension: Madison, WI, USA, 2003; pp. 14–17. [Google Scholar]
  31. Watson, M.; Wolf, A.; Wolf, N. Total Nitrogen; A3769; University of Wisconsin Extension: Madison, WI, USA, 2003; pp. 18–24. [Google Scholar]
  32. Supelco. GC Separation of VFA C2–C5; Bulletin 749B; Supelco Inc.: Bellefonte, PA, USA, 1975. [Google Scholar]
  33. Supelco. Analyzing Fatty Acids by Packed Column Gas Chromatography; Bulletin 856A; Supelco GC: Bellefonte, PA, USA, 1990. [Google Scholar]
  34. W.H. Miner Institute. Volatile Fatty Acid SOP; W.H. Miner Institute: Chazy, NY, USA.
  35. R Core Team. R: A Language and Environmental for Statistical Computing; R Foundation for Statistical Computing: Vienna, Austria, 2021. [Google Scholar]
  36. Pinheiro, J.C.; Bates, D.M. Mixed-Effects Models in S and S-PLUS; Springer: New York, NY, USA, 2000. [Google Scholar]
  37. Hilgert, J.E.; Amon, B.; Amon, T.; Belik, V.; Dragoni, F.; Ammon, C.; Cárdenas, A.; Petersen, S.O.; Herrmann, C. Methane Emissions from Livestock Slurry: Effects of Storage Temperature and Changes in Chemical Composition. Sustainability 2022, 14, 9934. [Google Scholar] [CrossRef]
  38. Cárdenas, A.; Ammon, C.; Schumacher, B.; Stinner, W.; Herrmann, C.; Schneider, M.; Weinrich, S.; Fischer, P.; Amon, T.; Amon, B. Methane emissions from the storage of liquid dairy manure: Influences of season, temperature and storage duration. Waste Manag. 2021, 121, 392–402. [Google Scholar] [CrossRef] [PubMed]
  39. Muck, R.E. Urease Activity in Bovine Feces. J. Dairy Sci. 1981, 65, 2157–2163. [Google Scholar] [CrossRef]
  40. Lu, Y.; Zhang, Q.; Wang, X.; Zhou, X.; Zhu, J. Effect of pH on volatile fatty acid production from anaerobic digestion of potato peel waste. Bioresour. Technol. 2020, 316, 123851. [Google Scholar] [CrossRef]
  41. Castro-Ramos, J.J.; Solís-Oba, A.; Solís-Oba, M.; Calderón-Vázquez, C.L.; Higuera-Rubio, J.M.; Castro-Rivera, R. Effect of the initial pH on the anaerobic digestion process of dairy cattle manure. AMB Express 2022, 12, 162. [Google Scholar] [CrossRef]
  42. Kamusoko, R.; Jingura, R.M.; Chikwambi, Z.; Parawira, W. Chapter 25—Biogas: Microbiological research to enhance efficiency and regulation. In Handbook of Biofuels; Academic Press: Cambridge, MA, USA, 2022; pp. 485–497. [Google Scholar]
  43. Chen, B.; Azman, S.; Dewil, R.; Appels, L. Alkaline anaerobic digestion of livestock manure: Unveiling mechanisms, applications, and perspective. Chem. Eng. J. 2023, 477, 146852. [Google Scholar] [CrossRef]
  44. Garcia-Aguirre, J.; Aymerich, E.; González-Mntez de Goñi, J.; Esteban-Gutiérrez, M. Selective VFA production potential from organic waste streams: Assessing temperature and pH influence. Bioresour. Technol. 2017, 244, 1081–1088. [Google Scholar] [CrossRef] [PubMed]
  45. Barret, M.; Gagnon, N.; Topp, E.; Masse, E.; Massé, D.I.; Talbot, G. Physico-chemical characteristics and methanogen communities in swine and dairy manure storage tanks: Spatio-temporal variations and impact on methanogenic activity. Water Res. 2013, 47, 737–746. [Google Scholar] [CrossRef] [PubMed]
  46. Ungerfeld, E.M. Metabolic Hydrogen Flows in Rumen Fermentation: Principles and Possibilities of Interventions. Front. Microbiol. 2020, 11, 589. [Google Scholar] [CrossRef] [PubMed]
  47. Shima, S.; Huang, G.; Wagner, T.; Ermler, U. Structural Basis of Hydrogenotrophic Methanogenesis. Annu. Rev. Microbiol. 2020, 74, 713–733. [Google Scholar] [CrossRef] [PubMed]
  48. Li, Y.; Chen, Y.; Wu, J. Enhancement of methane production in anaerobic digestion process: A review. Appl. Energy 2019, 24, 120–137. [Google Scholar] [CrossRef]
  49. D’Silva, T.C.; Isha, A.; Chandra, R.; Vijay, V.K.; Subbarao, P.M.V.; Kumar, R.; Chaudhary, V.P.; Singh, H.; Khan, A.A.; Tyagi, V.K.; et al. Enhancing methane production in anaerobic digestion through hydrogen assisted pathways—A state-of-the-art review. Renew. Sust. Energ. Rev. 2021, 151, 111536. [Google Scholar] [CrossRef]
  50. Qu, Q.; Zhang, K. Effects of pH, Total Solids, Temperature and Storage Duration on Gas Emissions from Slurry Storage: A Systematic Review. Atmosphere 2021, 12, 1156. [Google Scholar] [CrossRef]
  51. Kupper, T.; Häni, C.; Neftel, A.; Kincaid, C.; Bühler, M.; Amon, B.; VanderZaag, A. Ammonia and greenhouse gas emissions from slurry storage—A review. Agric. Ecosyst. Environ. 2020, 300, 106963. [Google Scholar] [CrossRef]
  52. Park, S.H.; Lee, B.R.; Kim, T.H. Urease and nitrification inhibitors with pig slurry effects on ammonia and nitrous oxide emissions, nitrate leaching, and nitrogen use efficiency in perennial ryegrass sward. Anim. Biosci. 2021, 34, 2023–2033. [Google Scholar] [CrossRef] [PubMed]
  53. Ning, J.; Ai, S.; Cui, L. Dicyandiamide has more inhibitory activities on nitrification than thiosulfate. PLoS ONE 2018, 13, e0200598. [Google Scholar] [CrossRef] [PubMed]
  54. Grant, R.H.; Boehm, M.T. Manure Ammonia and Hydrogen Sulfide Emissions from a Western Dairy Storage Basin. J. Environ. Qual. 2015, 44, 127–136. [Google Scholar] [CrossRef]
  55. Ro, K.S.; Dietenberger, M.A.; Libra, J.A.; Proeschel, R.; Atiyeh, H.K.; Sahoo, K.; Park, W.J. Production of Ethanol from Livestock, Agricultural, and Forest Residuals: An Economic Feasibility Study. Environments 2019, 6, 97. [Google Scholar] [CrossRef]
  56. Anas, M.; Liao, F.; Verma, K.K.; Sarwar, M.A.; Mahmood, A.; Chen, Z.; Li, Q.; Zeng, X.; Liu, Y.; Li, Y. Fate of nitrogen in agriculture and environment: Agronomic, eco-physiological and molecular approaches to improve nitrogen use efficiency. Biol. Res. 2020, 53, 47. [Google Scholar] [CrossRef]
  57. Raghavarao, K.S.M.S.; Madhusudhan, M.C.; Hrishikesk Tavanandi, A.; Niranjan, K. Chapter 12—Athermal Membrane Processes for the Concentration of Liquid Foods and Natural Colors. In Emerging Technologies for Food Processing, 2nd ed.; Sun, D., Ed.; Academic Press: Cambridge, MA, USA, 2014; pp. 213–237. [Google Scholar]
  58. Page, L.H.; Ni, J.; Zhang, H.; Heber, A.J.; Mosier, N.S.; Liu, X.; Joo, H.; Ndegwa, P.M.; Harrison, J.H. Reduction of volatile fatty acids and odor offensiveness by anaerobic digestion and solid separation of dairy manure during manure storage. J. Environ. Manag. 2015, 152, 91–98. [Google Scholar] [CrossRef] [PubMed]
  59. Petersen, S.O. Symposium review: Greenhouse gas emissions from liquid dairy manure: Prediction and mitigation. J. Dairy Sci. 2018, 101, 6642–6654. [Google Scholar] [CrossRef] [PubMed]
  60. Møller, H.B.; Sommer, S.G.; Ahring, B.K. Biological degradation and greenhouse gas emissions during pre-storage of liquid animal manure. J. Environ. Qual. 2004, 33, 27–36. [Google Scholar] [CrossRef]
  61. Chadwick, D.; Sommer, S.; Thorman, R.; Fangueiro, D.; Cardenas, L.; Amon, B.; Misselbrook, T. Manure management: Implications for greenhouse gas emissions. Anim. Feed Sci. Technol. 2011, 166, 514–531. [Google Scholar] [CrossRef]
  62. Alzchem Group. Available online: https://www.alzchem.com/en/brands/eminex/ (accessed on 4 June 2022).
Figure 1. Schematic of sampling setup used for lagoon wastewater in experiment 2. Black barrels represent experimental barrels filled with lagoon wastewater and gray covers represent FCs during active monitoring. Solid arrows indicate FC movement every 14 days. Dashed arrow indicates FC returning to first row to start second monitoring period on day 42.
Sustainability 16 05778 g001
Figure 2. Daily gaseous emissions from slurry: (a) daily CO2 emissions, (b) daily CH4 emissions, (c) daily N2O emissions, (d) daily NH3 emission, and (e) daily EtOH emissions. Ambient temperature (dashed lined), SL-CONT (x), SL-LD (triangles), and SL-HD (circles).
Sustainability 16 05778 g002
Figure 3. Emissions of CO2 over time after treatment application. Break in the x-axis indicates time between first to second sampling periods where emissions were not actively monitored. Ambient temperature (dashed lined), SL-CONT (x), SL-LD (triangles), and SL-HD (circles).
Sustainability 16 05778 g003
Figure 4. Emissions of CH4 over time after treatment application. Break in the x-axis indicates time between first to second sampling periods where emissions were not actively monitored. Ambient temperature (dashes), SL-CONT (x), SL-LD (triangles), and SL-HD (circles).
Sustainability 16 05778 g004
Figure 5. Emissions of N2O over time after treatment application. Break in the x-axis indicates time between first to second sampling periods where emissions were not actively monitored. Ambient temperature (dashed lined), SL-CONT (x), SL-LD (triangles), and SL-HD (circles).
Sustainability 16 05778 g005
Figure 6. Emissions of NH3 over time after treatment application. Break in the x-axis indicates time between first to second sampling periods where emissions were not actively monitored. Ambient temperature (dashed lined), SL-CONT (x), SL-LD (triangles), and SL-HD (circles).
Sustainability 16 05778 g006
Table 1. Least squares means and SEM of the chemical composition of fresh dairy slurry over 7 days of treatment.
ParametersDay 0TreatmentSEMp-Values
SL-CONTSL-LDSL-HDTDT × D
Total Solids, %DM13.214.011.511.71.61NS0.001NS
Total N, %DM0.570.540.550.560.0120.010.020.005
Total C, %DM44.645.144.944.70.103NS0.01NS
pH8.037.797.887.930.117NSNSNS
Acetic acid, ppm28634887 a*5319 *5361 b1450.08<0.0010.02
Propionic acid, ppm661.480082083222.9NS<0.001NS
Butyric acid, ppm402.750950951534NS0.001<0.001
Columns with different letters (a, b) indicate significant differences between those values at p < 0.05. Symbol ‘*’ in columns indicates a trend at p < 0.1. NS = not significant (p > 0.05); SL-CONT = control group, no treatment; SEM = standard error; SL-LD = low dose; SL-HD = high dose; %DM = percent dry matter; T = treatment; D = day; T × D = treatment × day interaction.
Table 2. Least squares means and SEM of gas fluxes from fresh dairy slurry after 7 days of treatment.
Gas Emissions 1Treatment 2SEMp-Values
SL-CONTSL-LDSL-HDTDT × D
CO2 (mg/h/m2)2733 a1519 b1387 b3450.060.02NS
CH4 (mg/h/m2)37.5 a26.2 b0.563.20.060.01NS
N2O (mg/h/m2)1.21.11.10.4NSNSNS
NH3 (mg/h/m2)378 a269 b246 b41.30.04<0.001NS
EtOH (mg/h/m2)13.2 a22.3 b22.2 b3.5<0.001<0.001NS
1 Gaseous emissions are based on the surface area of bowls containing 2.26 kg of slurry. 2 Values presented are mean emission rates across the entire monitoring period. Columns with different letters (a, b) indicate significant differences between those values at p < 0.05. NS = not significant (p > 0.05); SL-CONT = control group, no treatment; SEM = standard error; SL-LD = low dose; SL-HD = high dose; T = treatment; D = day; T × D = treatment × day interaction.
Table 3. Least squares means and SEM of the chemical composition of dairy lagoon wastewater after 56 days of treatment.
ParametersDay 0TreatmentSEMp-Values
SL-CONTSL-LDSL-HDTDT × D
Total Solids, %DM0.420.420.520.560.06NS0.01NS
Total N, %DM0.030.03 a0.04 b0.04 b0.0040.02<0.0010.005
Total C, %DM0.20.220.250.260.01NS<0.001NS
pH7.387.667.777.790.06NS<0.001NS
Acetic acid, ppmND 12.9 a21.1 b18.6 b5.20.07<0.0010.02
1 ND = not detected. Columns with different letters (a, b) indicate significant differences between those values at p < 0.05. NS = not significant (p > 0.05); SL-CONT = control group, no treatment; SEM = standard error; SL-LD = low dose; SL-HD = high dose; %DM = percent dry matter; T = treatment, D = day; T × D = treatment × day interaction.
Table 4. Least squares means and SEM of gas fluxes from lagoon wastewater after 56 days of treatment.
Gas Emissions 1Treatment 2SEMp-Values
SL-CONTSL-LDSL-HDTDT × D
CO2 (mg/h/m2)50749244682.2NS<0.001NS
CH4 (mg/h/m2)13.7 a2.6 b2.0 b3.30.06<0.001<0.001
N2O (mg/h/m2)4.40.840.771.1NS<0.001<0.001
NH3 (mg/h/m2)21.335.235.36.90.04<0.001NS
1 Gaseous emissions are based on the surface area of barrels containing 189 L of lagoon wastewater. 2 Values presented are mean emission rates across the monitoring periods (day 1–14 and day 43–56). Columns with different letters (a, b) indicate significant differences between those values at p < 0.05. NS = not significant (p > 0.05); SL-CONT = control group, no treatment; SEM = standard error; SL-LD = low dose; SL-HD = high dose. T = treatment, D = day, T × D = treatment × day interaction.
Disclaimer/Publisher’s Note: The statements, opinions and data contained in all publications are solely those of the individual author(s) and contributor(s) and not of MDPI and/or the editor(s). MDPI and/or the editor(s) disclaim responsibility for any injury to people or property resulting from any ideas, methods, instructions or products referred to in the content.

