Article

Analysis of the Effect of Environmental Regulation on Eco-Efficiency of Service Sector

1
School of Management, Wuhan Polytechnic University, Wuhan 430048, China
2
Faculty of Geography, Dimitrie Cantemir University, 540545 Targu Mures, Romania
*
Authors to whom correspondence should be addressed.
Sustainability 2024, 16(13), 5774; https://doi.org/10.3390/su16135774 (registering DOI)
Submission received: 15 May 2024 / Revised: 21 June 2024 / Accepted: 5 July 2024 / Published: 6 July 2024

Abstract

:
The green transformation of the service sector is crucial for promoting the construction of ecological civilization and boosting high-quality development. The aim of the relationship between environmental regulation and eco-efficiency is to explore the path of the green transformation of the service sector. Based on the provincial data in China from 2001~2019, this study investigated the effect of environmental regulation on the eco-efficiency of the service sector, concentrating on the influencing mechanism and threshold effect of environmental regulation on the eco-efficiency of the largest service sector in the Chinese economy. Applying the panel OLS model, mediating model, and threshold effect model. The main findings are as follows. First, environmental regulation is not beneficial for boosting the eco-efficiency of the service sector because of compliance costs. Second, environmental regulation can reduce the eco-efficiency of the service sector through service agglomeration. However, the effect of innovation compensation can hinder the negative influence of environmental regulation on the eco-efficiency of the service sector. Third, the inhibiting effect of environmental regulation disappears non-linearly with boosting economic development. Conversely, the positive influence of environmental regulation becomes negative, along with improving service agglomeration. At last, this study provided recommendations for the policymakers who hope to accelerate the green transformation of the service sector from the perspectives of strengthening technological innovation, reducing agglomeration, and establishing coordinated development mechanisms.

1. Introduction

Sustainable development has been a common purpose around the world, which needs more measures to lessen environmental pollution and ecological harm [1]. More than 150 countries around the world have made carbon-neutral pledges, which have been accompanied by targeted policies and actions to put the agreements into practice and ultimately translate them into carbon emission reductions. Furthermore, most countries have achieved relative decoupling of carbon emissions from economic growth, but their progress towards carbon-neutral decarbonization varies widely [2]. For example, the EU Carbon Emissions Trading System (EUCETS), which establishes a carbon price and annually adjusts downward the cap on total emissions for specific sectors of the economy, has reduced emissions from successful energy-intensive industries by 42.8% over the past 16 years [3]. It is widely acknowledged that establishing a modern industrial system and giving impetus to industrial transformation is a critical path to accelerate sustainable development [4,5]. Developed countries have experienced the upgrading of economic structure dominated by the service sector from about the 1970s to the 1980s. Moreover, developed countries have contributed up to 70% of GDP. The economic contribution of the service sector in China has been rising during the past two decades. To be more precise, the ratio of the service sector ranged from 41% in 2002 to 54.4% in 2021, exceeding the secondary industry and becoming the largest of the national economy [6].
Although the service sector performs an indispensable role in relieving employment tension, optimizing economic structure, and boosting economic development, the ecological harm and environmental pressure brought by the service sector cannot be ignored [7]. For instance, the scale expansion of the service sector has inevitably aggravated energy consumption and carbon emissions [6,7,8]. In addition, some service sectors, such as the transportation and catering sectors, are considered high emission. The 14th Five-Year Plan stresses that a new system of service sector, characterized by high quality, high efficiency, and strong competitiveness, needs to be established in the future. Moreover, China, the world’s biggest emitter and developing country is committed to carbon peaking in 2030 and carbon neutrality in 2060. Along with the potential carbon emissions reduction in the agriculture and industry sectors, it is imperative to accelerate the low-carbon and green transformation of the service sector in the pursuit of sustainable development.
Eco-efficiency is a significant index that focuses on the association between the economy, resources, and environment [5]. It is a usual measure for evaluating the degree of green transformation [1,8]. Extant literature mainly concentrates on agricultural eco-efficiency [9,10] and its sub-sectors, such as the planting sector [11], forestry [12], and animal husbandry [13], industrial eco-efficiency [5,14] and its sub-sectors, such as the manufacturing sector [15], the building sector [16], and the energy sector [17], in addition to the eco-efficiency of specific areas [18] or eco-efficiency regarding sub-sectors of the service sector [8,19], while there is a dearth of research on the eco-efficiency of the whole service sector. Therefore, it is imperative to evaluate the eco-efficiency of the whole service sector to better understand the green transformation of the industry structure.
With the scale expansion of the service sector, the relevant issues of ecological damage and environmental pollution have been gradually exposed. The Chinese government has set out to strengthen environmental regulation in association with the service sector. For instance, governments at all levels put forward the goal regarding the optimization of the service sector’s structure and cultivate emerging service sectors that are low-consumption, low-emission, and high-value-added [6]. At the level of sub-sector, the Ministry of Transport in China actively controls vehicle pollution, promotes new energy vehicles, and encourages green travel. Previous literature has investigated the influence of environmental regulation on the green transformation of the service sector [20], energy efficiency [21], or carbon emission intensity [7] under the framework of multi-factor analysis, while there are viewpoints regarding the role of environmental regulation that remain controversial. Therefore, there is more empirical evidence about the association between environmental regulation and eco-efficiency of the service sector (EESS) under the framework of single-factor analysis. Although Gan and Wang [22] explored the effect of environmental regulation on the EESS by using fsQCA under the framework of multi-factor, the influencing paths, as well as the threshold effect of environmental regulation, warrant more research. Taking into consideration these gaps, this study plans to answer the following questions: Can environmental regulation improve the EESS? What are the influencing mechanisms? Whether the impact of environmental regulation on the EESS is dynamic and non-linear? Consequently, based on the Chinese provincial data, this study investigated the effect of environmental regulation on EESS through the two-way FE model. Furthermore, the influencing paths and the threshold effect were examined by the mediation effect model and the threshold effect model.
The marginal contribution of answering the above questions is as follows: First, EESS at the province level was evaluated by adopting Super-EBM under the undesirable variable, breaking through the previous literature that mainly focuses on agricultural or industrial eco-efficiency, broadening the application scope of eco-efficiency and enriching research on the green transformation of service sector. Second, this study chose China as a representative study area with a booming service sector and investigated the effect of environmental regulation on EESS under the analytical framework of a single factor. This research provides more empirical evidence on the effect of environmental regulation on EESS. More importantly, it calls for more attention to ecological costs and environmental pollution generated by the service sector in China. Third, this research is no longer limited to the shallow association between environmental regulation and EESS, analyzing the indirect effect and threshold effect of environmental regulation. This can provide a more theoretical explanation associated with Porter hypothesis and the green paradox. More importantly, the comprehensive findings will help other countries to restrain the environmental pollution and ecological damage of the service sector.
The remaining sections are structured. Section 2 presents the concept t of EESS and reviews relevant literature. Section 3 conducts theoretical analysis and raises the research hypothesis. Section 4 presents the methodologies and materials. Section 5 exhibits the empirical findings. Section 6 discusses the relevant results and summarizes the theoretical implications. Section 7 draws conclusions, provides recommendations, and analyzes the research direction for the future.

2. Literature Review

2.1. The Concept of EESS

Schaltegger and Sturm [23] introduced eco-efficiency from the field of ecology to social science for the first time and defined it as the ratio of value generated by resource input to environmental impact. World Business Council for Sustainable Development (WBCSD) believes that ecological cost and environmental influence caused by meeting human needs must be in accordance with the planet’s capacity [24]. This viewpoint, which simultaneously contains socio-economic development and ecological protection, has been gradually admitted by various organizations and researchers. For instance, Kuosmanen and Kortelainen [25] defined eco-efficiency as the capability of green transformation and put forward the principle of maximizing economic benefits and minimizing ecological costs. It is apparent that these definitions regarding eco-efficiency basically reach a consensus that following sustainable development, social welfare is maximized through minimizing resource input and environmental impact.
Alcántara and Padilla [26] argued that the environmental friendliness of the service sector may be an illusion, and the environmental cost produced by the service sector should not be neglected. Therefore, the development of the service sector needs to follow the principle of maximizing economic benefits and minimizing ecological costs. Referring to the concept of agricultural eco-efficiency [9,10] and industrial eco-efficiency [5,14], this study considers EESS as the extent to which the desirable (value-added of service sector) output is maximized and undesirable output (carbon emission from service sector) is minimized by investing a certain number of resource factors such as capital, labor, and energy (Figure 1). The improvement in EESS aims to form a coupling coordination relationship between the resource input system, eco-environment system, and economic development system, thus accelerating the green transformation of the service sector.

2.2. Low-Carbon Development of Service Sector

As the world moves into the service economy, carbon emissions from the service sector continue to grow since the early 20th century. Therefore, environmental issues brought about by the development of the service sector have posed a serious threat to the ecological system [26,27]. Scholars have gradually concentrated on the green transformation of the service sector, thus achieving sustainable development.
Carbon emission encompasses a wider range of ecological damage. Moreover, it is relatively easier to calculate carbon emissions from the service sector. Consequently, researchers focus on the green transformation of the service sector based on carbon emissions. Since the 21st century, the number of scholars who calculate carbon emissions from the service sector has steadily risen. Furthermore, their research objects mainly include France [28], Spain [27], China [29], and Uruguay [30]. In addition, Krackeler et al. [31] evaluated carbon emissions of the service sector from 13 countries that belong to the OECD. The above scholars prove that the service sector is not an absolutely clean industry; carbon emissions generated by service production should not be overlooked. What is more, quite a few scholars also forecasted the potential of carbon emission reduction from the service sector [32,33].
The energy efficiency of the service sector reveals an association between energy consumption, value-added, and carbon emission has received increasing attention. For example, Fang et al. [34], using the DEA approach and the Tobit model, reveal that the capital–labor ratio can shrink the energy efficiency of the service sector. Lin and Zhang [35] found that the energy efficiency of the service sector at the province level was relatively low, and there were spatial differences among various provinces. Zhang and Lin [6] calculated different sub-sectors of the service industry and found that the financial sector had the highest unified efficiency. Wang, Xu, Ye, He, and Liu [21], adopting the spatial Durbin model, demonstrated that service agglomeration is capable of significantly boosting adjacent regions’ energy efficiency. Moreover, quite a few indexes, such as carbon productivity efficiency and green total factor productivity, are also used to mirror the low-carbon development or green transformation of service sector [20,36,37].
There are some deficiencies as follows. First, as an index measuring the green transformation of the service sector, EESS needs to receive more attention. Second, although environmental regulation is included in the factors influencing energy efficiency, carbon productivity efficiency, and green total factor productivity, there is a dearth of literature that investigates the impact of environmental regulation under the single-factor framework. More seriously, there is still no consensus on the association between environmental regulation and eco-efficiency. Third, researchers failed to devote adequate attention to the mediating mechanism and non-linear impact of environmental regulation on EESS.

3. Research Hypothesis

3.1. Direct Role of Environmental Regulation in the EESS

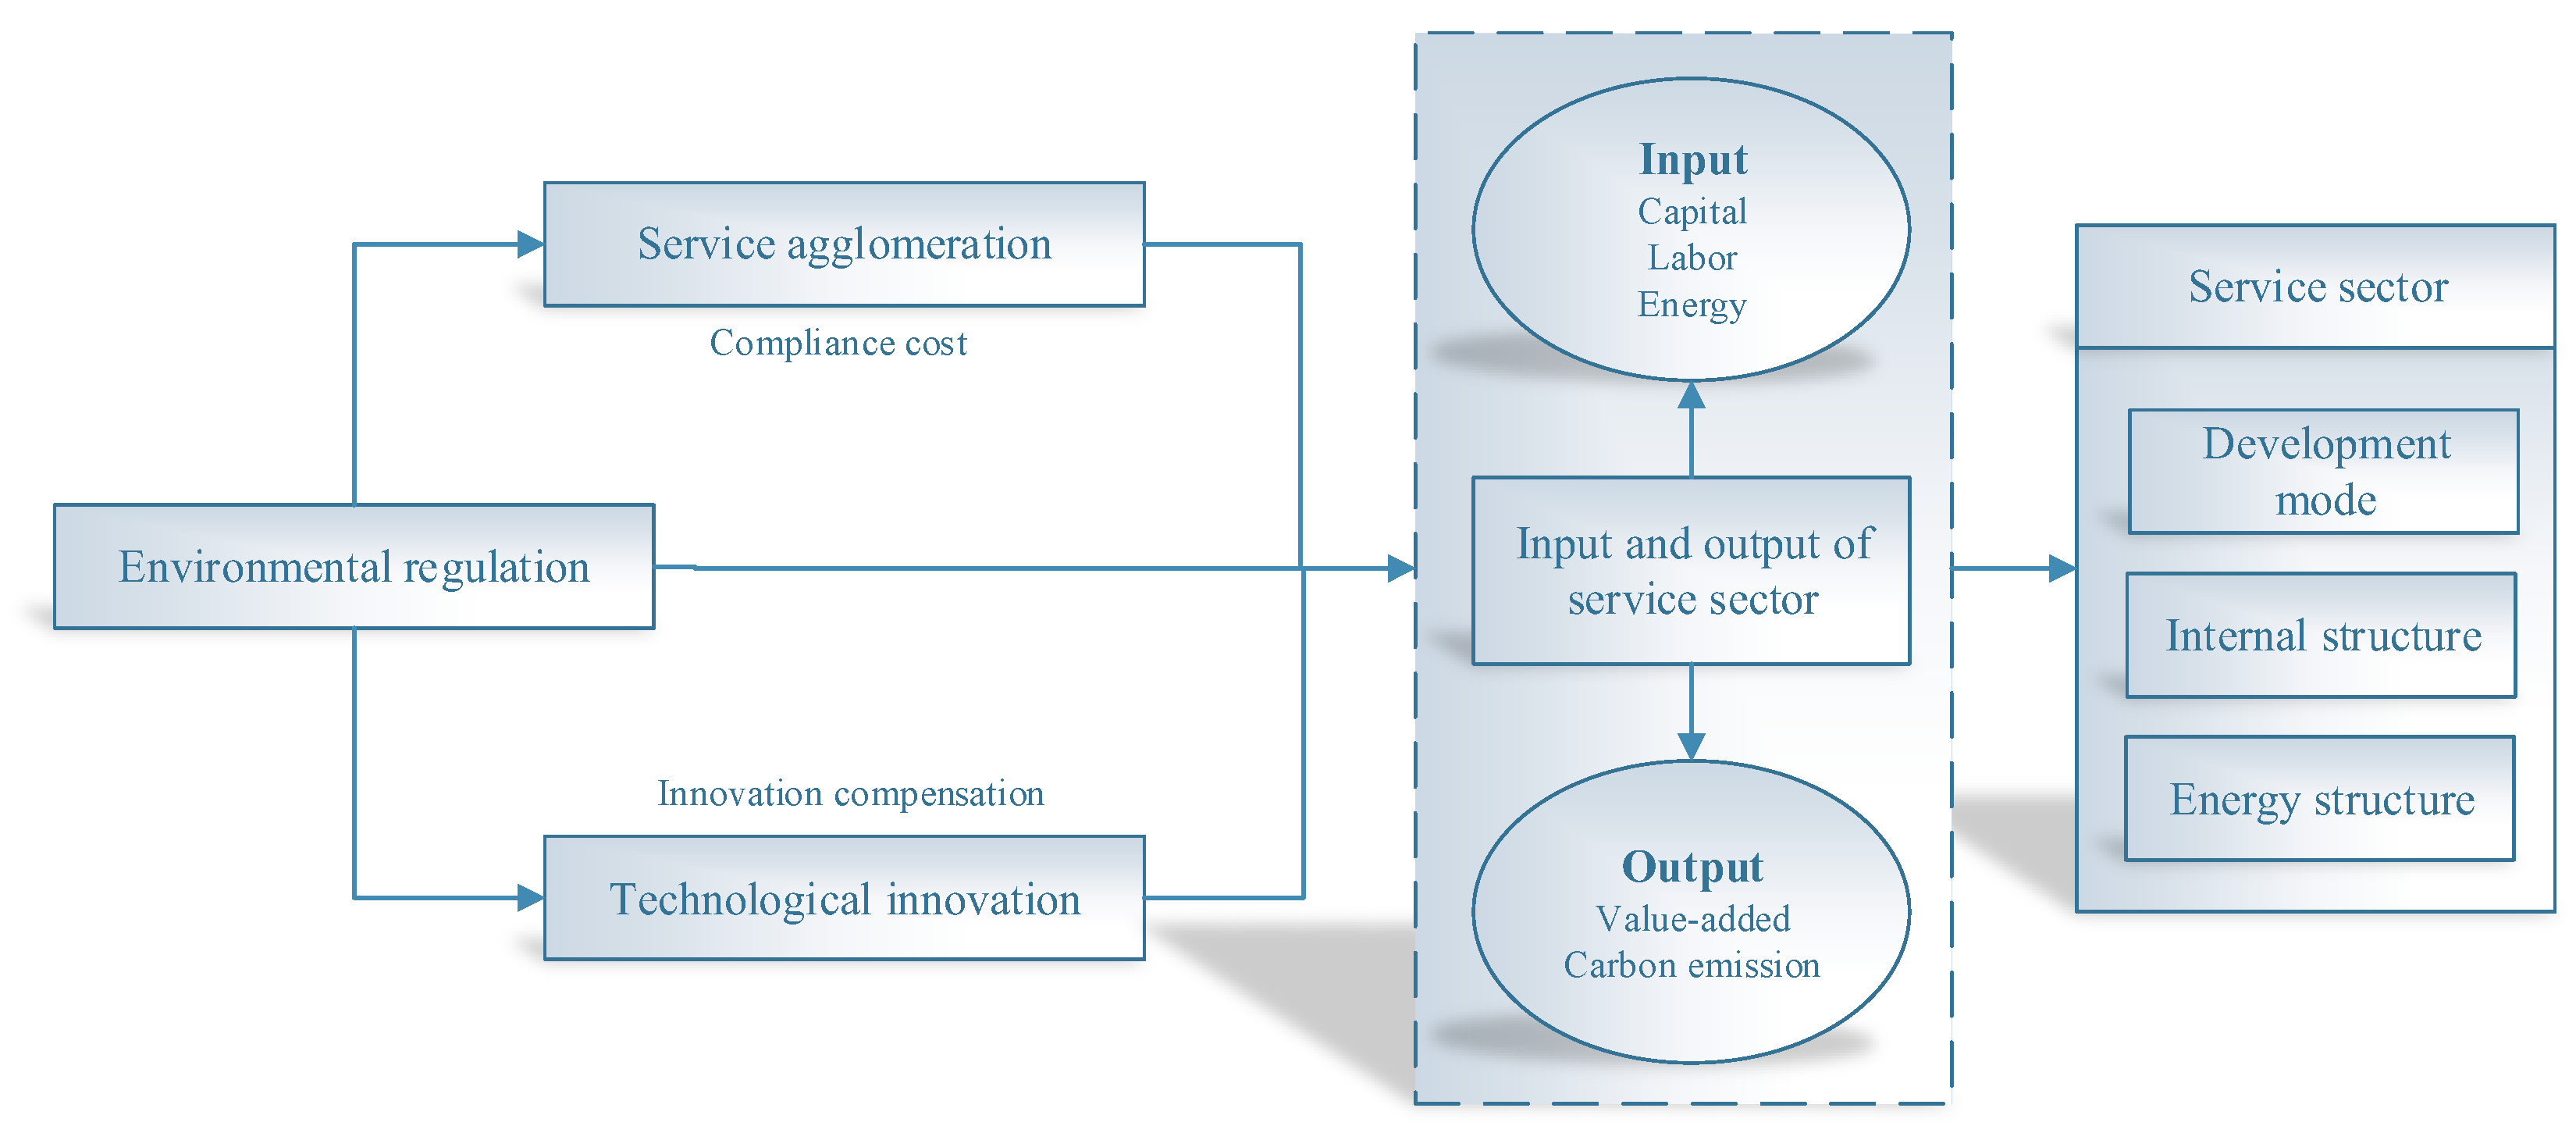
It is widely acknowledged that environmental regulation exerts multiple effects, such as emission reduction, green paradox, pollution heaven, and rebound effect, on the environmental system [38]. EESS is no exception. On the one hand, according to Porter’s hypothesis, moderate environmental regulation is beneficial for accelerating technological innovation, thus reducing carbon emissions and boosting EESS, namely, the innovation compensation effect [39]. On the other hand, based on the theory of green paradox provided by Sinn [40], the compliance cost effect driven by environmental regulation inevitably improves manufacturing cost and public cost, thereby extruding innovation input and lowering EESS [41]. Nonlinearity theory reveals that the influence of environmental regulation may be dynamic and alterable [42]. If environmental regulation is relatively low, pollution heaven and compliance costs may enhance energy consumption and carbon emissions, thereby reducing EESS [20]. When the degree of environmental regulation is moderate, the innovation compensation effect is conducive to reducing production redundancy and carbon emissions. However, if the strength of environmental regulation is too high, the rebound effect and scale effect may bring about greater ecological costs [18]. Therefore, this study put forward the following hypotheses.
H1a. 
Environmental regulation can boost EESS.
H1b. 
Environmental regulation can reduce EESS.
H1c. 
The impact of environmental regulation on EESS is dynamic and non-linear.

3.2. The Mediating Effect of Service Agglomeration on the EESS

The compliance cost stimulates service agglomeration so as to reduce total production costs and boost competitiveness. According to the theory of Mar externalities, which originated from Marshall [43], industry agglomeration can affect the eco-environment through intermediate input effect, labor force “reservoir” effect, and spillover effect. The reduction of search and transaction costs, as well as the share of input factor, are conducive to improving allocation efficiency and reducing input redundancy through efficient synergy sub-sectors [21,44]. However, service agglomeration driven by environmental regulation may hinder the improvement of EESS. First, when service agglomeration is too high, the agglomeration diseconomy and congestion effect may result in the misallocation of resources, thereby reducing EESS [45,46]. Second, over-agglomeration may generate a scale effect, contributing to the enhancement of energy consumption and carbon emissions that are not beneficial for EESS [46]. Consequently, the following hypotheses are raised.
H2a. 
Service agglomeration caused by environmental regulation can boost EESS.
H2b. 
Service agglomeration caused by environmental regulation can reduce EESS.

3.3. The Mediating Effect of Technological Innovation on the EESS

Porter and Linde [39] confirm that technological progress caused by environmental regulation can mitigate compliance costs and reduce pollutant emissions, thereby improving ecological quality. Furthermore, based on Porter’s hypothesis, moderate environmental regulation is beneficial for productivity efficiency improvement and for the compensation of production cost, thereby guaranteeing steady input as well as lowering the misallocation of resources [47]. Moreover, technological innovation can directly generate an emission reduction effect [36,48]. In addition, technological innovation can also improve production efficiency and reduce production redundancies. Therefore, the technological innovation caused by environmental regulation is conducive to improving the EESS. This study puts forward the following hypothesis.
H3. 
Environmental regulation can boost EESS through technological innovation.
On the basis of the above analysis, this study drew a picture of the theoretical mechanism (Figure 2).

4. Methodology and Data

4.1. Methodology

4.1.1. Super-EBM Model

The Super-EBM model under the undesirable variable was used to calculate EESS at the province level in China. The reasons for this research methodology use are as follows. First, the original ratio of input to output can be preserved, and the information of orthographic value can be obtained to the maximum extent [49]. Second, the relaxation variables with non-radial influence can be considered. Third, the differences in the efficiency of various DMUs can be compared in detail. The formula of the Super-EBM model under the undesirable variable is as follows.
r * = min θ ε x i = 1 m w i s i x i k φ + ε y r = 1 s w r + s r + y r k + ε u p = 1 q w p s p Z p k s . t . j = 1 n λ j x i j + s i = θ x i k , i = 1 , 2 m j = 1 n λ j y r j s r + = φ y r k , r = 1 , 2 s j = 1 n λ j Z k j + s p = φ Z p k , p = 1 , 2 q j j 0 j = 1 , 2 n λ j 0 , s i , s r + , s p 0
where r* is the eco-efficiency of the service industry; λj is the coefficient of the linear combination of DMU; xij, yrj, and Zkj represent ith input, rth desirable output, and kth undesirable output, respectively; n, m, s, and q are the number of DMUs, inputs, desirable outputs, and undesirable outputs, respectively; s i , s r + , and s p represent the redundancy of input, desirable output, and undesirable output, respectively; w i , w r + , and w p relative importance of each input, desirable output, and undesirable output, respectively; θ represent radial programming parameter; ε x , ε y , and ε u represent non-radial weight of input, desirable output, and undesirable output, respectively.

4.1.2. Benchmark Model

The two-way fixed effect (FE) model fully takes into account both individual fixed effect and time fixed effect, thus improving the explanatory power. Therefore, this study adopted a two-way FE model to examine the influence of environmental regulation on EESS. The formula of the two-way FE model is as follows:
ln E f f i i t = α 0 + α ln E r i t + β j C o n t r o l j i t + μ i + ϕ t + ε i t
where lnEffiiit is EESS; lnErit is the strength of environmental regulation; Controljit is the control variables. μi, φt, and εit is the individual FE, the time FE, and the random disturbance term, respectively.

4.1.3. Mediating Effect Model

The mediation effect model, which is simple and effective, can be widely used to explore the influencing mechanism [50]. As a consequence, the mediating effect model was employed to uncover the mechanism through which environmental regulation exerts an effect on EESS.
ln M i t = β 0 + β 1 ln E r i t + β 2 C + u i + μ i t
ln E f f i i t = α 0 + α 1 ln E r i t + α 2 ln M i t + α 3 C i t + u i + μ i t
where Mit is a mediating variable, namely, service agglomeration and technological innovation, in this study. Formula (3) examines whether environmental regulation has a significant influence on mediating variables. Formula (4) investigates whether mediating variables exert a significant impact on EESS.

4.1.4. Threshold Model

Influenced by both internal and external factors, the impact of environmental regulation on EESS varies. The threshold effect model was employed to examine the dynamic and non-linear relationship between the two. The model is set as
ln E f f i i t = α 0 + α 1 ln E r i t × I ln T i t γ + α 2 ln E r i t × I ln ln T i t > γ + β j C o n t r o l j i t + ε i t
where Tit is a threshold variable and γ is a threshold value.

4.2. Variables and Indicators Selection

4.2.1. Indicators Regarding EESS

With regard to input indicators, capital and labor play an indispensable role in the production of the service sector. Furthermore, the scale expansion of the service sector needs to consume energy; thus, energy was included in the input indicator [21]. Output indicators were divided into two types, namely, desirable output and undesirable output. In terms of desirable output, the value-added of the service sector is an important indicator that is used to evaluate the economic performance of the service sector. With respect to undesirable output, carbon emissions of the service sector contain a wider range of non-point source pollution [35]. More importantly, the data on carbon emissions of the service sector can be easily calculated and gained [29]. Therefore, carbon emissions from the service sector were regarded as an undesirable output. The index system of EESS can be seen in Table 1.

4.2.2. Explained Variable and Core Explanatory Variable

The ratio of investment in pollution control to gross domestic production (GDP) was used to measure the strength of environmental regulation [7]. Based on the input-output index system, EESS was evaluated through the Super-EBM model under the desirable variable.

4.2.3. Control Variable

(1) The optimization of energy structure (Es) is conducive to directly reducing carbon emissions, thereby boosting EESS [29]. The proportion of coal consumption in the service sector to total energy consumption was seen as the energy structure of the service sector;
(2) Urbanization is a double-edged sword. First, the scale effect generated by urbanization (Urb) inevitably generates more carbon emissions, thus improving the ecological cost of the service sector. Second, technological innovation and information communication are beneficial for improving energy efficiency and reducing ecological destruction. Urbanization was measured by the ratio of urban population to total population;
(3) There are two hypotheses for foreign direct investment, namely, pollution halo and pollution paradise [51]. Similarly, foreign direct investment may play a positive or negative role in improving the EESS. The ratio of foreign direct investment to GDP was employed to evaluate the openness degree (Ope);
(4) The scale-up of the service sector and the deepening of capital may bring about more carbon emissions, thus lowering the EESS [21]. The capital–labor ratio (Kl) was calculated by the proportion of capital investment to the number of employees;
(5) Reasonable fiscal decentralization (Fis) is conducive to stimulating enthusiasm for environmental regulation and ecological protection, thus boosting EESS [52]. However, the expansion of fiscal decentralization easily causes the race to the bottom and further aggravates the augment of carbon emissions [53]. The degree of fiscal decentralization was evaluated by the ratio of per capita fiscal outlays to total per capita expenditures.

4.2.4. Mediating Variable

(1) Taking data accessibility into account, this study adopted location entropy to measure the degree of service agglomeration (Agg) in provinces in China [21]. The calculation formula for service agglomeration is as follows:
S A i t = S i t / G i t S t / G t
where SAit is the degree of service agglomeration of province i in year t; Sit and Git are the value-added service sector and GDP of province i in year t, respectively. St and Gt are the total value-added of the service sector and GDP, respectively;
(2) The technological compensation driven by environmental regulation is capable of reducing compliance costs, thus improving EESS. This study used the number of patent applications to mirror the level of technological innovation (Tech).

4.2.5. Threshold Variable

The level of economic development (Eco) can affect the relationship between environmental regulation and EESS by promoting technological innovation and compensating compliance costs [54]. The per capita GDP was employed to evaluate the level of economic development. The evaluation of service agglomeration can be seen in Section 4.2.4.

4.3. Data Sources

Due to a lack of data, Hong Kong, Macao, Taiwan, and Xizang are not included in the research sample. What is more, since 2001, the Chinese government paid more attention to the development of the service industry, which was mirrored in the Outline of the tenth Five-Year Plan. In addition, COVID-19 has had a serious effect on the service industry. Thus, the end year of this study was regarded as 2019. In summary, the sample period is 2001~2019. The data on energy consumption, fixed investment, the number of employees, and the value-added in the service sector at the province level was taken from the China Energy Statistical Yearbook (2002~2020), Statistical Yearbook of the Chinese Investment in Fixed Assets (2002~2020), China Population & Employment Statistical Yearbook (2002~2020), and China Statistical Yearbook of the Tertiary Industry (2002~2020). Referring to the calculation method used by Gan, Wang, and Voda [29], the method of emission factor was employed to calculate the carbon emissions of the service sector. Furthermore, the carbon emission coefficient of various energy sources is referred to as IPCC [55]. The data on control variables, the number of invention patent applications, and per capita GDP came from the China Statistical Yearbook (2002~2020). The statistical description of each variable can be seen in Table 2. We took the logarithm of each variable, so as to reduce heteroscedasticity. Additionally, the results of variance inflation factor (VIF) indicate that there is no multicollinearity. The horizontal line represents that the variable do not have the VIF.

5. Result and Analysis

5.1. Spatiotemporal Evolution of EESS

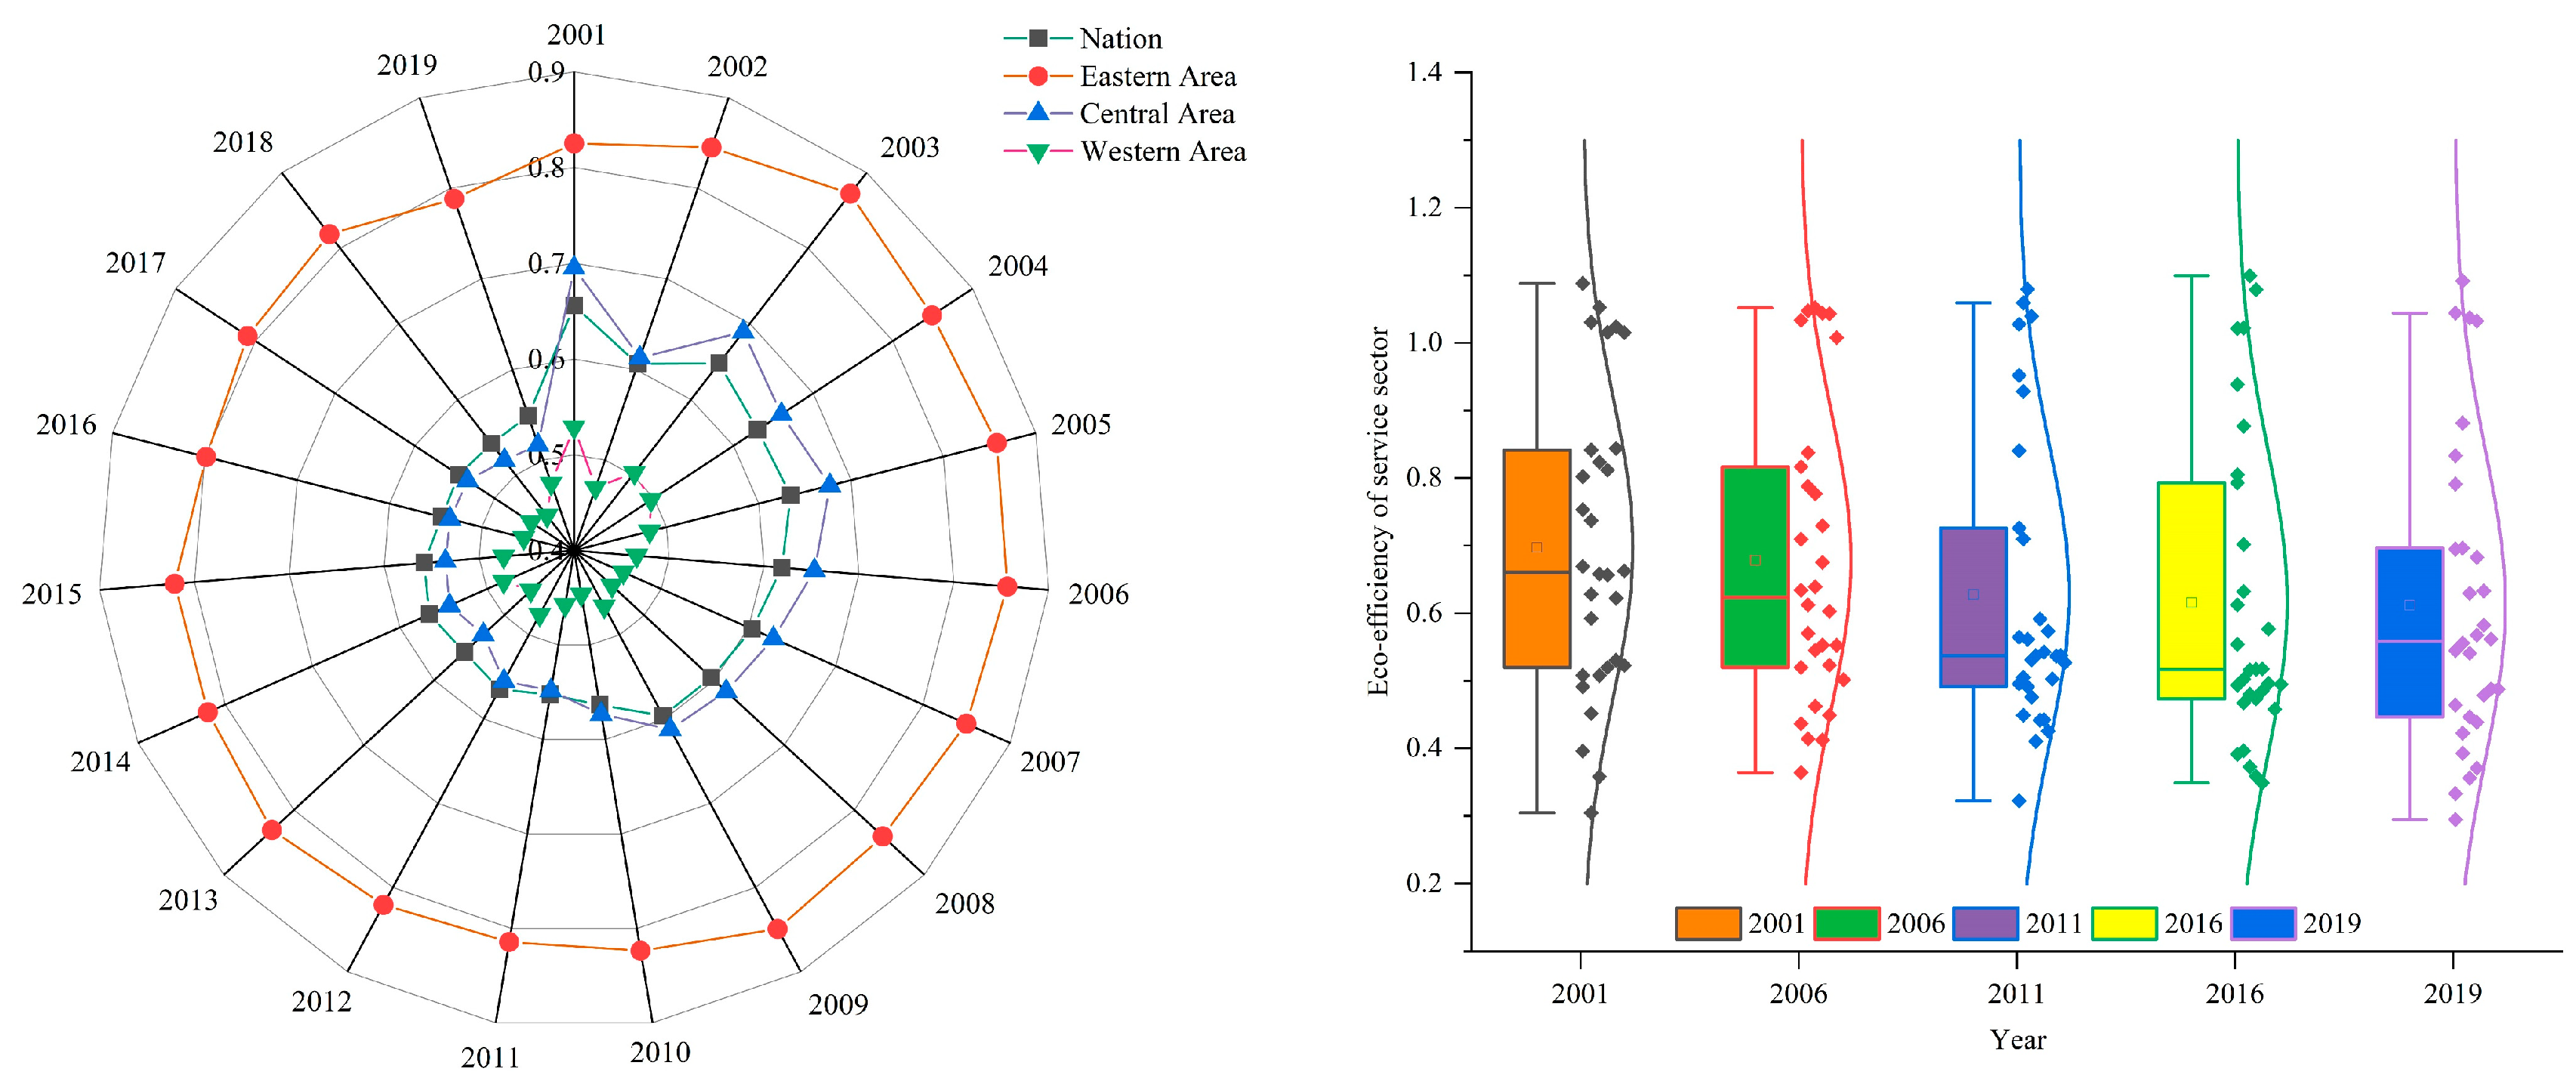
As shown in Figure 3, the EESS in China and three areas presented a downward, resulting from the situation that the development mode-driven factor investment rapidly expands the size of the service sector, thus bringing about more carbon emissions. Moreover, the augment of input redundancy has an inhibiting influence on the enhancement of EESS. The EESS in the Eastern Area is always greater than the national average value from 2001 to 2019. First, the prosperity of modern service sectors such as modern logistics, digital finance, and technical services lowers input redundancy. Second, green technological innovation effectively promotes the utilization of clean energy, thereby decreasing carbon emissions. According to the box diagram, these dots tend to disperse, which indicates that the spatial differences in EESS at the province level in China have become larger from 2001 to 2019. Furthermore, the distribution pattern of these dots changed from “dispersion at the ends and concentration in the middle” to “dispersion in the high values and concentration in the middle and low values”, implying that the EESS in the majority of provinces.
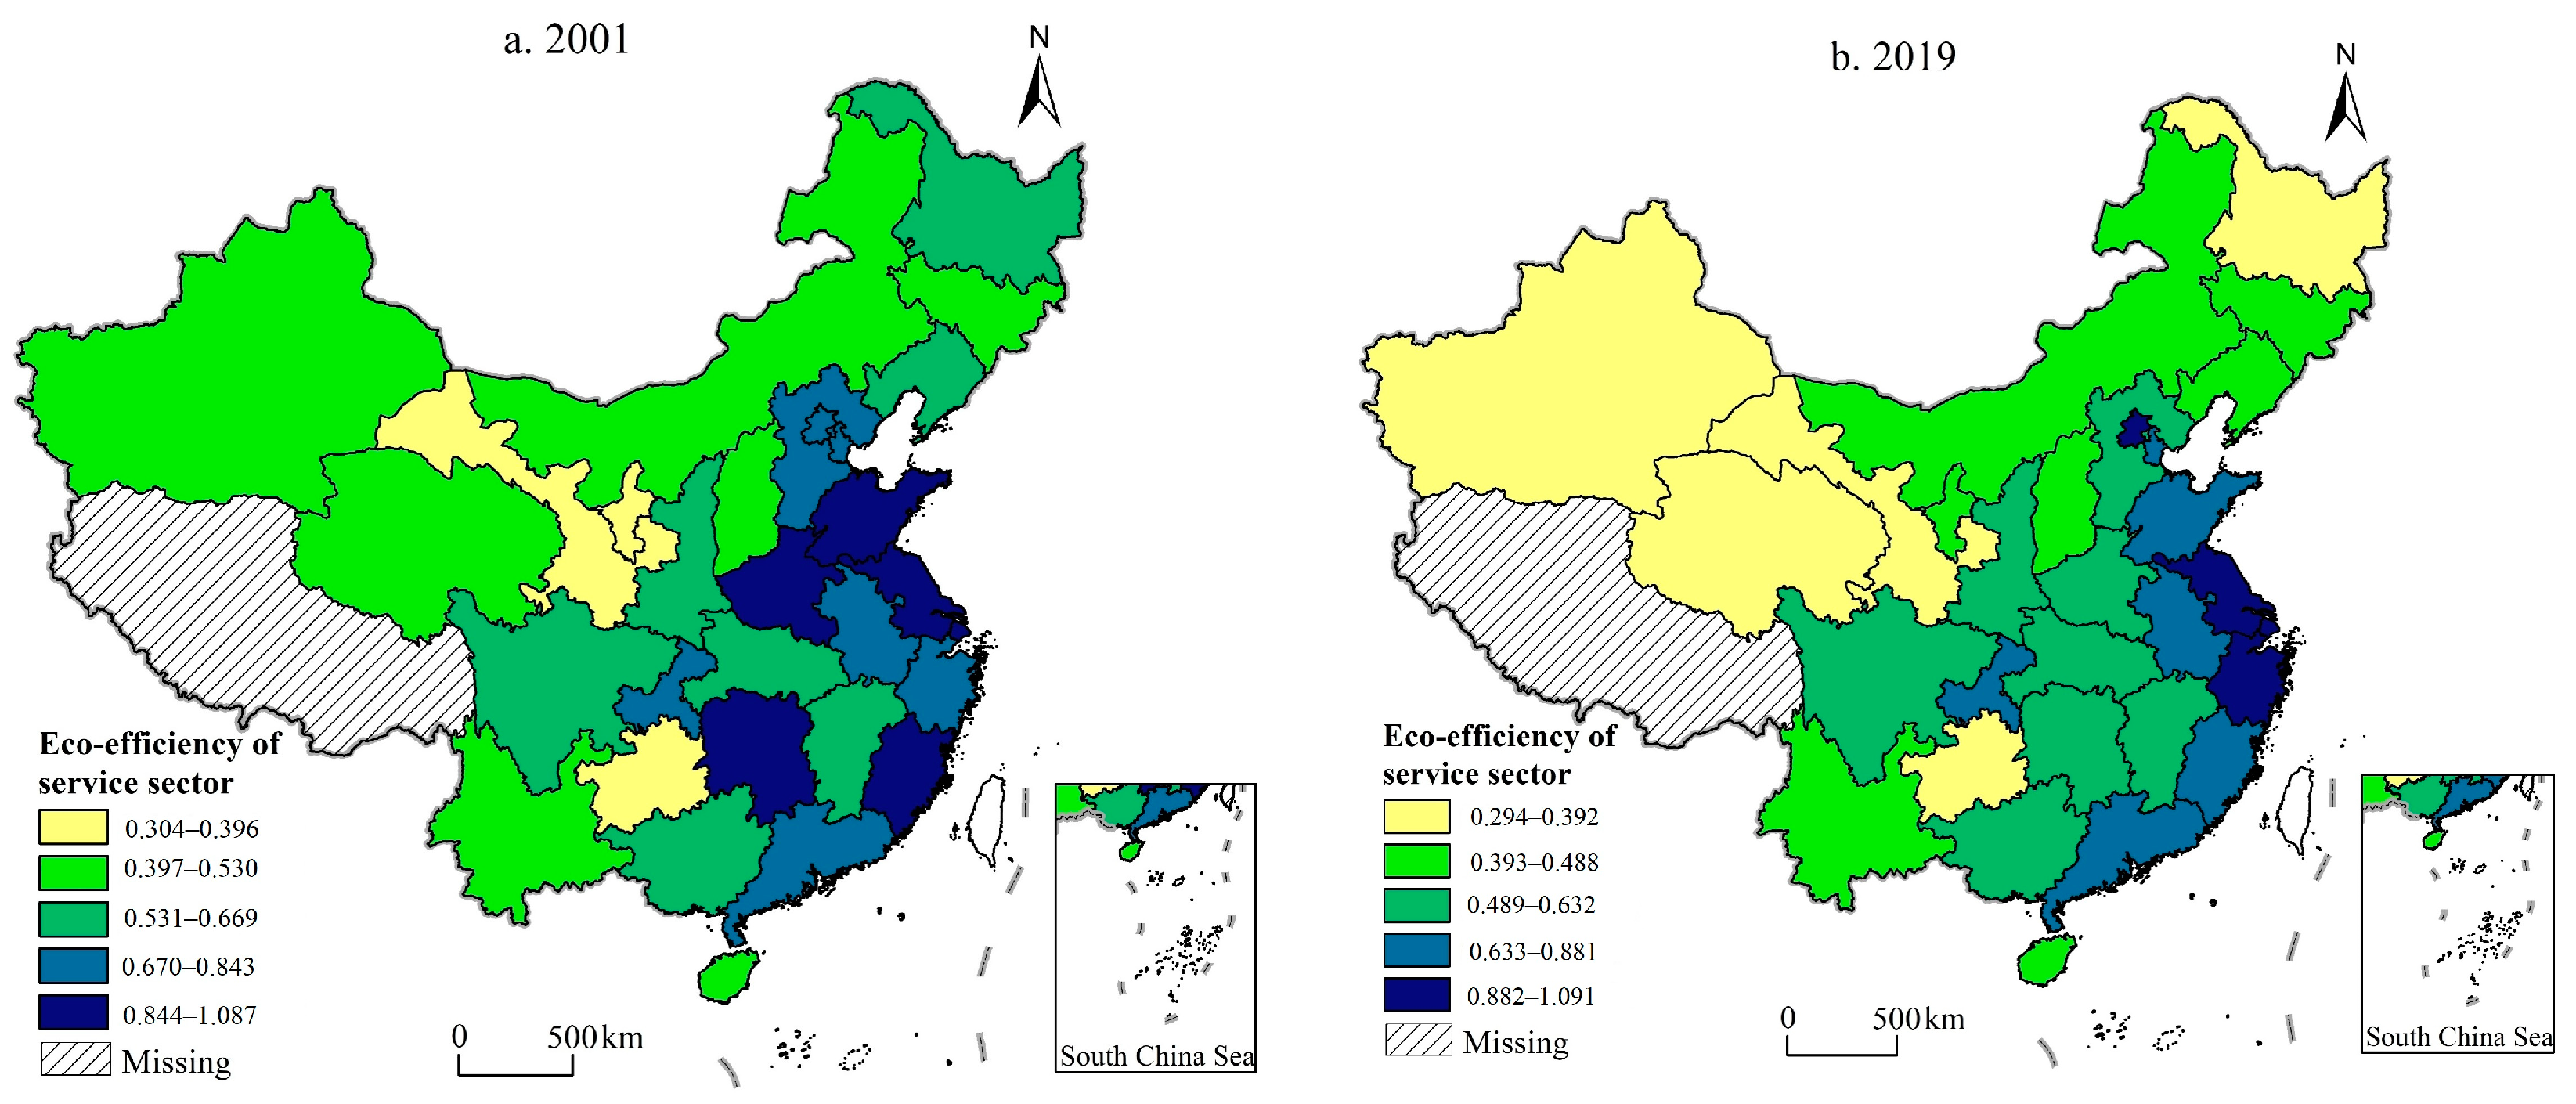
In 2001, provinces with high EESS were Henan, Shandong, Jiangsu, Shanghai, Fujian, and Hunan (Figure 4). However, the number of provinces with high EESS decreased from 6 in 2001 to 4 in 2019. To be more specific, provinces with high EESS were located in the Yangtze River Delta Region in 2019. Jiangsu and Shanghai always have higher EESS, resulting from the fact that the advanced technologies and rational industry structure reduce input redundancy and carbon emissions. Unfortunately, the number of provinces with relatively lower EESS has significantly increased during the sample period, which further verifies that provincial EESS in China showed a decreasing trend. Furthermore, these provinces were mainly distributed in the Central Area or Western Area. For example, the EESS in Gansu and Guizhou were relatively lower.

5.2. Benchmark Regression

Column (1) of Table 3 indicates that the coefficient of lnEr is −0.032 and passes the significance test when control variables are not included in the estimation model, illustrating that there is a negative association between environmental regulation and EESS. As shown in columns (2) to (6) of Table 3, upon adding control variables one by one, the regression coefficients are still negative at a 1% level of significance, which is in accordance with the “green paradox” that environmental regulation can significantly reduce EESS. Given the fact that environmental regulation in the service sector is relatively weak, quite a few service enterprises are trying to produce more products before more strict regulatory standards, resulting in a sharp rise in ecological cost. What is more, environmental regulation can directly boost production costs, cause input redundancy, and thus hinder the increase of EESS. Therefore, the H1b is verified.
The estimated coefficients of lnUrb and lnOpe, as shown in column (6) of Table 2, are negative and statistically significant. To be more specific, the expansion of the consumption scale caused by rapid urbanization inevitably boosts carbon emissions, thereby reducing EESS. In addition, with the improvement of openness, the transfer of high-consumption and high-emission service enterprises from developed countries contributes to increasing energy consumption and carbon emissions, thereby lowering EESS. This finding aligns with the hypothesis of pollution heaven and demonstrates that the environmental standard should be stricter when introducing service enterprises from developed countries or areas.

5.3. Heterogeneity Analysis

The full sample was divided into three areas, namely the Eastern Area, the Central Area, and the Western Area. Columns (1) to (3) of Table 4 show that the role of environmental regulation varies among different areas. The estimated coefficients of lnEr to lnEffi are negative and pass the significance test in the Eastern Area and the Western Area. Apparently, the impact strength in the Western Area is more than that of the Eastern Area, which results from the situation that more advanced innovation in the Eastern Area can partly counteract the negative externality of cost rise. In addition, the regression coefficient of lnEr to lnEffi is −0.001 but fails the significance test. On the one hand, the strength of environmental regulation in the Central Area is relatively weaker than that of the Eastern Area. On the other hand, the level of technological innovation is relatively higher than that of the Western Area. The effect of innovation compensation neutralizes the effect of compliance cost, thus bringing about the non-significantly negative effect of environmental regulation.
The full sample was classified into two sub-stages, namely 2001~2010 and 2011~2019. During the period of 2001~2010, the development of the service sector was driven the scale expansion. The central government in China emphasized that the promotion of the prosperity of the service sector needs to pay more attention to efficiency improvement. As shown in columns (4) to (5), the regression coefficient of lnEr to lnEffi is −0.043 during the period of 2001~2010. Before the implementation of stronger regulations, the service enterprises are forced to expand production scale, thus generating more carbon emissions. The estimated coefficient of lnEr to lnEffi is −0.001 but fails the significance test during the period of 2011~2019. The compliance cost generated by environmental regulation continues to rise as time goes by, thus bringing about the input-output misalignment. However, green technological innovation cannot only mitigate compliance costs but also reduce carbon emissions. Therefore, the negative externality of environmental regulation is not apparent during the period of 2011~2019.

5.4. Robustness Check

To confirm the validity of benchmark regressions, this study conducted a series of robustness tests, shown in columns (1) to (5) of Table 5.
First, this study calculated EESS by the Super-SBM model. The findings provided in column (1) of Table 5 indicate that the estimated coefficient of environmental regulation to EESS remains significantly negative, which is in accordance with the result of baseline regressions and provides empirical evidence for the H1b.
Second, the one-period lag of environmental regulation was employed to replace the core explanatory variable. Column (2) of Table 5 exhibits that the estimated coefficient of L.lnEr is −0.025, which is significant at the 1% level. This demonstrates that environmental regulation in both the current period and the lag period exerts a negative effect on EESS.
Third, emergencies (e.g., severe acute respiratory syndrome and financial crisis) may disturb the accuracy of estimated results; therefore, this study eliminated the samples in 2003 and 2008 to conduct regression models again. The result shown in column (3) reveals that environmental regulation significantly reduces EESS, providing evidence for the H1b.
Fourth, the EESS was divided into scale efficiency and pure technical efficiency, and the scale efficiency served as an explained variable to conduct the FE model due to the fact that, at present, the development of the service sector depends on scale expansion. Column (4) manifests that the estimated coefficient of lnEr to lnEffi is −0.034 and passes the significance test, indicating that environmental regulation is not conducive to improving the scale efficiency of the service sector.
Fifth, this research adopted dynamic SYS-GMM to solve the endogeneity; the air-dynamical coefficient was seen as an instrumental variable [56]. The lower the air-dynamical coefficient, the less likely it is that regional pollutants will spread so that provinces with lower air-dynamical coefficient have stricter environmental regulations when emitting the same amount of air pollutants. This is in line with the requirement of an instrumental variable. As shown in column (5), the AR (1) is less than 0.05, and the AR (2) is more than 0.1, indicating that there is no second-order autocorrelation in a residual sequence of difference equation. Moreover, the Sargan test is more than 0.1, revealing that this model accepts the null hypothesis that the air-dynamical coefficient is effective. Furthermore, the regression coefficient of lnEr is negative with a 10% level of significance, illustrating that the H1b is further verified.

5.5. Further Analysis

5.5.1. Indirect Effect

The above results demonstrate that environmental regulation exerts a negative effect on EESS. This study continues to inspect the influencing paths (Table 6).
Columns (1) to (2) report the results regarding the service agglomeration as a mediating variable. The results, shown in column (1), imply that the coefficient of lnEr to lnAgg is positive and statistically significant, demonstrating that environmental regulation can accelerate service agglomeration to further reduce production costs. Column (2) illustrates that the input–output misalignment and the increase in carbon emissions, caused by the crowing effect and agglomeration diseconomy, decrease EESS. The above regression results shed light on the fact that environmental regulation can reduce EESS through service agglomeration; the ratio of mediating effect to total effect is 0.295%. As a consequence, the H2b is confirmed.
Columns (3) to (4) show the results in terms of technological innovation as a mediating variable. Column (3) illustrates that the estimated coefficient of lnEr to lnTech is 0.325, which is significant at a 1% level. Column (4) implies that technological innovation has a significantly positive effect on EESS. Furthermore, the above regression results demonstrate that the technological innovation caused by environmental regulations exerts a suppressing effect on the reduction of EESS. In other words, the economic benefit generated by technological innovation is conducive to compensating the relevant cost caused by environmental regulation, thereby releasing the positive externality of environmental regulation. Moreover, the ratio of suppressing effect to total effect is 1.25%. Thus, the H3 is proved.

5.5.2. Threshold Effect

Before examining the threshold effect, this study confirms the number of threshold values through the bootstrap method. Table 7 shows that economic development and service agglomeration all have a significant single threshold effect. As a consequence, this study analyzed threshold models based on the single threshold values of economic development and service agglomeration.
Column (1) indicates that when the level of economic development is less than the single threshold value (4665.73), the estimated coefficient of lnEr to lnEffi is −0.167 with a 1% level of significance (Table 8). However, when the level of economic development spans the first threshold value, the effect of environmental regulation on EESS becomes significantly positive. This indicates that there has been a structural change in the direction of the impact of environmental regulation on EESS, with a U-shape in which the relationship between the two is first inhibited and then facilitated. Against the situation of a relatively lower level of economic development, service enterprises have less capital to conduct innovation activities, resulting in a phenomenon that innovation output cannot absolutely mitigate the cost of environmental compliance. In addition, the seeking rent by power, and corruption exert an inhibiting effect on the effect of emission reduction generated by environmental regulation. With the improvement of the economic level, service enterprises accept more fiscal support for technological innovation from governments at all levels, thus compensating for the cost of environmental compliance. This is named by the effect of innovation compensation.
Column (2) illustrates that when the degree of service agglomeration is lower than the single threshold value (0.913), the regression coefficient of lnEr to lnEffi is 0.020, which is significant at the 10% level. When the degree of service agglomeration exceeds the first threshold value, environmental regulation has a significantly negative effect on EESS. When the degree of service agglomeration is relatively low, the spatial spillover of knowledge, information, and technology can not only reduce production costs; but also accelerate technological innovation. The decrease in factor cost generated by the agglomeration economy can counteract the compliance cost caused by environmental regulation. With the improvement regarding the degree of service agglomeration, the price of production factors caused by agglomeration diseconomy will continue to rise, thus compressing the input of technological innovation and hindering the process of technological innovation. There is no doubt that the improvement of double cost is not beneficial for boosting productivity. More seriously, the lag of technological innovation is not conducive to mitigating carbon emissions, thus reducing EESS. In summary, the H1c is verified.

6. Discussion

The ecological damage and environmental pollution resulting from the scale expansion of the service sector have triggered a wave around the academic circle. Environmental regulation is regarded as the backbone of lowering ecological costs and achieving a green transformation of the service sector. This research innovatively investigated both the direct and indirect impact of environmental regulation on EESS. Besides, the dynamic and non-linear effect of environmental regulation on the EESS has also been examined. The findings of our research are discussed as follows.
It is found that EESS in China showed a decreasing trend, resulting from the fact that the development mode depended on factors input brings about the improvement of both input redundancy and carbon emissions [7]. This provides more evidence that it is imperative to boost the green transformation of the service sector [57,58]. Moreover, there were apparent differences in EESS between various provinces in China [35]. To be more specific, the Eastern Area had the highest EESS, followed by the Central Area and Western Area, revealing that the cooperation mechanism regarding the green transformation of the service sector needs to be established to reduce ecological costs and improve productivity [6].
Environmental regulation exerts an inhibiting effect on EESS because of compliance cost, which confirms the viewpoint of Jorgenson and Wilcoxen [59] as well as Barbera and McConnell [60] that the augment of environmental cost brings about the decrease of productivity efficiency and the loss of potential profit. Moreover, this finding is in line with Wang, Xu, Ye, He, and Liu [21]. However, the impact of environmental regulation on EESS varies under the influence of outside circumstances and is not necessarily detrimental [61]. To be more specific, the role that environmental regulation plays in EESS is dynamic and non-linear. Concretely, when the economic level crosses a single threshold value, the impact of environmental regulation becomes positive. This finding validates Zheng, Liu, and Wang [54], who argue that with the improvement of economic development level, environmental regulation will form a reverse influence on energy utilization efficiency. On the contrary, when the degree of service agglomeration is more than the single threshold value, environmental regulation exerts a negative effect, resulting from the situation that agglomeration diseconomy would squeeze the input of technological innovation, thus decreasing the effect of innovation compensation generated by environmental regulation [62,63].
The indirect effect analysis reveals that the service agglomeration caused by environmental regulation has an inhibiting influence on EESS, which supports the viewpoint of Verhoef and Nijkamp [64] that the energy consumption and carbon emissions caused by scale effect are not conducive to boosting eco-efficiency. Moreover, the agglomeration diseconomy and crowing effect do damage to the effect of innovation compensation. On the contrary, the technological innovation caused by environmental regulation has a significant suppressing effect on the negative impact of environmental regulation, further confirming that the effect of innovation compensation is beneficial for improving EESS. In other words, these findings also verify that the Porter hypothesis is suited for governmental regulations on the environment in the service sector [65,66].
The theoretical implications of this study are as follows. First, this research emphasizes that it is imperative to boost the sustainable development of the service sector to achieve high-quality development in China. Therefore, the Super-EBM model under the undesirable output was employed to calculate EESS at the province level, which responds to the necessity of green transformation of all industries. More importantly, this study breaks through the extant research that focuses on the eco-efficiency of agriculture or industry, thus expanding the application scope of eco-efficiency. Second, this study is no longer limited to examining the direct effect of environmental regulation but also concentrates on the mechanism through which environmental regulation exerts an effect on EESS. This provides clearer and concrete paths to accelerate the sustainable development of the service sector. Third, following these effects, such as emission reduction, green paradox, and rebound effect, caused by environmental regulation, this study innovatively analyzed the dynamic and non-linear impact of environmental regulation on EESS along with the change of economic development and service agglomeration, breaking through the previous literature that focuses on the linear relationship between environmental regulation and the green transformation of service sector.

7. Conclusions

7.1. Main Conclusions

This study explored the direct and indirect impact of environmental regulation on EESS. Moreover, the threshold effect of environmental regulation was also examined. The main conclusions are as follows.
First, the EESS showed a decreasing trend at the province level in China during the sample period. At the regional level, the EESS in the Eastern Area is always greater than the national average value from 2001 to 2019. In terms of spatial distribution, provinces with higher EESS are Henan, Shandong, Jiangsu, Shanghai, Fujian, and Hunan. The provinces with relatively low EESS were mainly distributed in the Central Area or Western Area.
Second, environmental regulation exerts a negative influence on EESS. In terms of heterogenous effect, the impact of environmental regulation on the EESS in the Western Area is stronger compared with the Eastern Area. There has been a structural change in the direction of the impact of environmental regulation on EESS; in other words, there is a single threshold effect of environmental regulation on EESS, which changes in economic level and service agglomeration.
Third, in terms of indirect effect, technological innovation caused by environmental regulation exerts a suppressing effect on the negative externalities of environmental regulation. Unfortunately, the mediating effect of service agglomeration on EESS is significantly negative. To be more specific, environmental regulation can reduce EESS through service agglomeration.

7.2. Policy Implications

The service sector cannot be considered a clean industry. The energy consumption and carbon emissions retain a state of rapid ascent. Therefore, under the background of high-quality development, it is imperative to boost EESS and accelerate the green transformation of the service sector. First, governments at all levels should pay more attention to negative externalizations generated by the service sector, transforming the development pattern of the service sector and promoting EESS. In particular, the cooperation mechanism of carbon emission reduction among provinces needs to be established. Second, the technological innovation promoted by environmental regulation is conducive to improving EESS; governments, therefore, should increase investment in technological innovation in terms of the service sector, especially in low-carbon technologies. Furthermore, enterprises also need to improve productivity efficiency and reduce the cost of environmental protection with the help of technological innovation. Third, when the level of economic development is too low, or the degree of service agglomeration is too high, the impact of environmental regulation on EESS becomes negative. While maintaining steady economic growth, technical subsidies and finance discounts can be employed to promote the green transformation of the service sector. In addition, the agglomeration dis-economy and crowing effect generated by service agglomeration should be poured into more attention to overcome the inhibiting effect of environmental regulation.

7.3. Limitations and Outlook

This research offers empirical evidence on the association between environmental regulation and EESS, while some deficiencies cannot be ignored. Meanwhile, these drawbacks pave the road for future research. First, due to a lack of datasets, 30 provinces were regarded as research samples. With the improvement of statistical calibers, future research can concentrate on the influence of environmental regulation on EESS at the city level or the county level. Second, there are other mediating paths on environmental regulation and EESS, which can be further explored. Third, future scholars can also explore the impact of different types of environmental regulations, such as command-and-control environmental regulation, market-driven environmental regulation, and voluntary participatory environmental regulation, on the eco-efficiency of the service sector.

Author Contributions

X.L.: Conceptualization and Writing—original draft. M.V.: Writing—review and editing. C.G.: Supervision and Funding acquisition. All authors have read and agreed to the published version of the manuscript.

Funding

This study was mainly supported by the National Social Science and Arts Program of China (No. 22BH149) from Xuefen Liu.

Institutional Review Board Statement

Not applicable.

Informed Consent Statement

Not applicable.

Data Availability Statement

Data will be made available on request by corresponding author.

Conflicts of Interest

The authors declare that there are no conflicts of interest regarding the publication of this article.

References

  1. Cui, S.; Wang, Z. The impact and transmission mechanisms of financial agglomeration on eco-efficiency: Evidence from the organization for economic co-operation and development economies. J. Clean. Prod. 2023, 392, 136219. [Google Scholar] [CrossRef]
  2. Yang, L.; Yang, Y.; Zhou, Y.; Shi, X. Research the synergistic carbon reduction effects of sulfur dioxide emissions trading policy. J. Clean. Prod. 2024, 447, 141483. [Google Scholar] [CrossRef]
  3. Wang, M.; Kuusi, T. Trade flows, carbon leakage, and the EU Emissions Trading System. Energy Econ. 2024, 134, 107556. [Google Scholar] [CrossRef]
  4. Li, K.; Qi, S.; Shi, X. Environmental policies and low-carbon industrial upgrading: Heterogenous effects among policies, sectors, and technologies in China. Technol. Forecast. Soc. Change 2023, 191, 122468. [Google Scholar] [CrossRef]
  5. Wang, F.; Wu, M.; Du, X. Does industrial upgrading improve eco-efficiency? Evidence from China’s industrial sector. Energy Econ. 2023, 124, 106774. [Google Scholar] [CrossRef]
  6. Zhang, G.; Lin, B. Impact of structure on unified efficiency for Chinese service sector—A two-stage analysis. Appl. Energy 2018, 231, 876–886. [Google Scholar] [CrossRef]
  7. Wang, Z.; Cheng, Z. Spatiotemporal interaction characteristics and transition mechanism of carbon intensity in China’s service industry under the targets of carbon peak and carbon neutrality. Acta Geogr. Sin. 2023, 78, 54–70. (In Chinese) [Google Scholar]
  8. Guo, L.; Li, P.; Zhang, J.; Xiao, X.; Peng, H. Do socio-economic factors matter? A comprehensive evaluation of tourism eco-efficiency determinants in China based on the Geographical Detector Model. J. Environ. Manag. 2022, 320, 115812. [Google Scholar] [CrossRef] [PubMed]
  9. Yang, B.; Zhang, Z.; Wu, H. Detection and attribution of changes in agricultural eco-efficiency within rapid urbanized areas: A case study in the Urban agglomeration in the middle Reaches of Yangtze River, China. Ecol. Indic. 2022, 144, 109533. [Google Scholar] [CrossRef]
  10. Yang, H.; Wang, X.; Bin, P. Agriculture carbon-emission reduction and changing factors behind agricultural eco-efficiency growth in China. J. Clean. Prod. 2022, 334, 130193. [Google Scholar] [CrossRef]
  11. Revollar, S.; Meneses, M.; Vilanova, R.; Vega, P.; Francisco, M. Eco-efficiency assessment of control actions in wastewater treatment plants. Water 2021, 13, 612. [Google Scholar] [CrossRef]
  12. Koskela, M.; Vehmas, J. Defining eco-efficiency: A case study on the Finnish forest industry. Bus. Strategy Environ. 2012, 21, 546–566. [Google Scholar] [CrossRef]
  13. Zhu, F.; Fang, Y.; Yi, S.; Yu, H. Eco-efficiency of grassland-based animal husbandry and its determinants in the source regions of the Yangtze and Yellow Rivers. China Environ. Sci. 2017, 37, 310–318. [Google Scholar]
  14. Matsumoto, K.i.; Chen, Y. Industrial eco-efficiency and its determinants in China: A two-stage approach. Ecol. Indic. 2021, 130, 108072. [Google Scholar] [CrossRef]
  15. Gutowski, T.G. The efficiency and eco-efficiency of manufacturing. Int. J. Nanomanufacturing 2010, 6, 38–45. [Google Scholar] [CrossRef]
  16. Ruschi Mendes Saade, M.; G. da Silva, M.; Gomes, V.; Gumez Franco, H.; Schwamback, D.; Lavor, B. Material eco-efficiency indicators for Brazilian buildings. Smart Sustain. Built Environ. 2014, 3, 54–71. [Google Scholar] [CrossRef]
  17. Tenente, M.; Henriques, C.; da Silva, P.P. Eco-efficiency assessment of the electricity sector: Evidence from 28 European Union countries. Econ. Anal. Policy 2020, 66, 293–314. [Google Scholar] [CrossRef]
  18. Liu, Y.; Zhu, J.; Li, E.Y.; Meng, Z.; Song, Y. Environmental regulation, green technological innovation, and eco-efficiency: The case of Yangtze river economic belt in China. Technol. Forecast. Soc. Change 2020, 155, 119993. [Google Scholar] [CrossRef]
  19. Yu, X.; Xu, H.; Lou, W.; Xu, X.; Shi, V. Examining energy eco-efficiency in China’s logistics industry. Int. J. Prod. Econ. 2023, 258, 108797. [Google Scholar] [CrossRef]
  20. Teng, Z. Spatial differentiation and driving factors of green total factor productivity in China’ s service industry. J. Quant. Technol. Econ. 2020, 37, 23–41. (In Chinese) [Google Scholar] [CrossRef]
  21. Wang, X.; Xu, L.; Ye, Q.; He, S.; Liu, Y. How does services agglomeration affect the energy efficiency of the service sector? Evidence from China. Energy Econ. 2022, 112, 106159. [Google Scholar] [CrossRef]
  22. Gan, C.; Wang, K. Research on spatiotemporal pattern evolution and configuration improvement of ecological efficiency of service industry in Yangtze River Economic Belt. Res. Environ. Sci. 2024, 37, 835–848. (In Chinese) [Google Scholar] [CrossRef]
  23. Schaltegger, S.; Sturm, A. Ökologische rationalität: Ansatzpunkte zur ausgestaltung von ökologieorientierten managementinstrumenten. Die Unternehm. 1990, 44, 273–290. [Google Scholar]
  24. WBCSD. Leadership for Improved Economic and Environmental Performance; WBCSD: Geneva, Switzerland, 1996; pp. 3–16. [Google Scholar]
  25. Kuosmanen, T.; Kortelainen, M. Measuring eco-efficiency of production with data envelopment analysis. J. Ind. Ecol. 2005, 9, 59–72. [Google Scholar] [CrossRef]
  26. Alcántara, V.; Padilla, E. Input–output subsystems and pollution: An application to the service sector and CO2 emissions in Spain. Ecol. Econ. 2009, 68, 905–914. [Google Scholar] [CrossRef]
  27. Farreny, R.; Gabarrell, X.; Rieradevall, J. Energy intensity and greenhouse gas emission of a purchase in the retail park service sector: An integrative approach. Energy Policy 2008, 36, 1957–1968. [Google Scholar] [CrossRef]
  28. Collard, F.; Fève, P.; Portier, F. Electricity consumption and ICT in the French service sector. Energy Econ. 2005, 27, 541–550. [Google Scholar] [CrossRef]
  29. Gan, C.; Wang, K.; Voda, M. Decoupling relationship between carbon emission and economic development in the service sector: Case of 30 provinces in China. Environ. Sci. Pollut. Res. 2022, 29, 63846–63858. [Google Scholar] [CrossRef] [PubMed]
  30. Piaggio, M.; Alcántara, V.; Padilla, E. The materiality of the immaterial: Service sectors and CO2 emissions in Uruguay. Ecol. Econ. 2015, 110, 1–10. [Google Scholar] [CrossRef]
  31. Krackeler, T.; Schipper, L.; Sezgen, O. Carbon dioxide emissions in OECD service sectors: The critical role of electricity use. Energy Policy 1998, 26, 1137–1152. [Google Scholar] [CrossRef]
  32. Xing, R.; Hanaoka, T.; Kanamori, Y.; Masui, T. Estimating energy service demand and CO2 emissions in the Chinese service sector at provincial level up to 2030. Resour. Conserv. Recycl. 2018, 134, 347–360. [Google Scholar] [CrossRef]
  33. Zhang, L. Model projections and policy reviews for energy saving in China’s service sector. Energy Policy 2013, 59, 312–320. [Google Scholar] [CrossRef]
  34. Fang, C.-Y.; Hu, J.-L.; Lou, T.-K. Environment-adjusted total-factor energy efficiency of Taiwan’s service sectors. Energy Policy 2013, 63, 1160–1168. [Google Scholar] [CrossRef] [PubMed]
  35. Lin, B.; Zhang, G. Energy efficiency of Chinese service sector and its regional differences. J. Clean. Prod. 2017, 168, 614–625. [Google Scholar] [CrossRef]
  36. Teng, Z.; Hu, Z.; Jiang, X. Study on the difference and covergence of carbon productivity in China’s service industry. J. Quant. Technol. Econ. 2017, 34, 78–94. (In Chinese) [Google Scholar] [CrossRef]
  37. Wang, R.; Hao, J.-X.; Wang, C.; Tang, X.; Yuan, X. Embodied CO2 emissions and efficiency of the service sector: Evidence from China. J. Clean. Prod. 2020, 247, 119116. [Google Scholar] [CrossRef]
  38. He, F.; Hu, Y. Non-linear effects of environmental regulation on urban sustainable development efficiency. China Popul. Resour. Environ. 2022, 32, 84–95. (In Chinese) [Google Scholar]
  39. Porter, M.E.; Linde, C.v.d. Toward a new conception of the environment-competitiveness relationship. J. Econ. Perspect. 1995, 9, 97–118. [Google Scholar] [CrossRef]
  40. Sinn, H.-W. Public policies against global warming: A supply side approach. Int. Tax Public Financ. 2008, 15, 360–394. [Google Scholar] [CrossRef]
  41. Lanoie, P.; Patry, M.; Lajeunesse, R. Environmental regulation and productivity: Testing the porter hypothesis. J. Product. Anal. 2008, 30, 121–128. [Google Scholar] [CrossRef]
  42. Cui, S.; Wang, Y.; Zhu, Z.; Zhu, Z.; Yu, C. The impact of heterogeneous environmental regulation on the energy eco-efficiency of China’s energy-mineral cities. J. Clean. Prod. 2022, 350, 131553. [Google Scholar] [CrossRef]
  43. Marshall, A. The principles of economics. Political Sci. Q. 1920, 77, 519–524. [Google Scholar]
  44. Glaeser, E.L.; Kahn, M.E. The greenness of cities: Carbon dioxide emissions and urban development. J. Urban Econ. 2010, 67, 404–418. [Google Scholar] [CrossRef]
  45. Brakman, S.; Garretsen, H.; Gigengack, R.; Van Marrewijk, C.; Wagenvoort, R. Negative feedbacks in the economy and industrial location. J. Reg. Sci. 1996, 36, 631–651. [Google Scholar] [CrossRef]
  46. Fan, C.C.; Scott, A.J. Industrial agglomeration and development: A survey of spatial economic issues in East Asia and a statistical analysis of Chinese regions. Econ. Geogr. 2003, 79, 295–319. [Google Scholar] [CrossRef]
  47. Gan, C.; Voda, M. Can green finance reduce carbon emission intensity? Mechanism and threshold effect. Environ. Sci. Pollut. Res. 2023, 30, 640–653. [Google Scholar] [CrossRef] [PubMed]
  48. Jia, R.; Shao, S.; Yang, L. High-speed rail and CO2 emissions in urban China: A spatial difference-in-differences approach. Energy Econ. 2021, 99, 105271. [Google Scholar] [CrossRef]
  49. Tone, K.; Tsutsui, M. An epsilon-based measure of efficiency in DEA—A third pole of technical efficiency. Eur. J. Oper. Res. 2010, 207, 1554–1563. [Google Scholar] [CrossRef]
  50. Xu, Q.; Zhong, M.; Li, X. How does digitalization affect energy? International evidence. Energy Econ. 2022, 107, 105879. [Google Scholar] [CrossRef]
  51. Wang, H.; Dong, C.; Liu, Y. Beijing direct investment to its neighbors: A pollution haven or pollution halo effect? J. Clean. Prod. 2019, 239, 118062. [Google Scholar] [CrossRef]
  52. Sun, Y.; Gao, P.; Razzaq, A. How does fiscal decentralization lead to renewable energy transition and a sustainable environment? Evidence from highly decentralized economies. Renew. Energy 2023, 206, 1064–1074. [Google Scholar] [CrossRef]
  53. Cheng, Y.; Awan, U.; Ahmad, S.; Tan, Z. How do technological innovation and fiscal decentralization affect the environment? A story of the fourth industrial revolution and sustainable growth. Technol. Forecast. Soc. Change 2021, 162, 120398. [Google Scholar] [CrossRef]
  54. Zheng, Z.; Liu, X.; Wang, Y. Has environmental regulation improved China’s energy efficiency? Analysis based on panel threshold model. J. Hainan Univ. (Humanit. Soc. Sci.) 2023, 42, 1–10. (In Chinese) [Google Scholar] [CrossRef]
  55. IPCC. Guidelines for National Greenhouse Gas Inventories; IPCC: Hayama, Japan, 2006.
  56. Chen, S.; Chen, D. Air pollution, government regulations and high-quality economic development. Econ. Res. J. 2018, 53, 20–34. [Google Scholar]
  57. Wang, J.; Dong, K.; Hochman, G.; Timilsina, G.R. Factors driving aggregate service sector energy intensities in Asia and Eastern Europe: A LMDI analysis. Energy Policy 2023, 172, 113315. [Google Scholar] [CrossRef]
  58. Dong, K.; Sun, R.; Hochman, G.; Li, H. Energy intensity and energy conservation potential in China: A regional comparison perspective. Energy 2018, 155, 782–795. [Google Scholar] [CrossRef]
  59. Jorgenson, D.W.; Wilcoxen, P.J. Environmental regulation and US economic growth. RAND J. Econ. 1990, 21, 314–340. [Google Scholar] [CrossRef]
  60. Barbera, A.J.; McConnell, V.D. The impact of environmental regulations on industry productivity: Direct and indirect effects. J. Environ. Econ. Manag. 1990, 18, 50–65. [Google Scholar] [CrossRef]
  61. Huang, X.; Tian, P. How does heterogeneous environmental regulation affect net carbon emissions: Spatial and threshold analysis for China. J. Environ. Manag. 2023, 330, 117161. [Google Scholar] [CrossRef] [PubMed]
  62. Yu, Q.; Li, M.; Li, Q.; Wang, Y.; Chen, W. Economic agglomeration and emissions reduction: Does high agglomeration in China’s urban clusters lead to higher carbon intensity? Urban Clim. 2022, 43, 101174. [Google Scholar] [CrossRef]
  63. Voda, M.; Kithiia, S.; Jackiewicz, E.; Du, Q.; Sarpe, C.A. Geosystems ‘pathways to the future of Sustainability. Sci. Rep. 2019, 9, 14446. [Google Scholar] [CrossRef] [PubMed]
  64. Verhoef, E.; Nijkamp, P. Externalities in urban sustainability: Environmental versus localization-type agglomeration externalities in a general spatial equilibrium model of a single-sector monocentric industrial city. Ecol. Econ. 2002, 40, 157–179. [Google Scholar] [CrossRef]
  65. Brännlund, R.; Lundgren, T. Environmental policy without costs? A review of the Porter hypothesis. Int. Rev. Environ. Resour. Econ. 2009, 3, 75–117. [Google Scholar] [CrossRef]
  66. Lanoie, P.; Laurent-Lucchetti, J.; Johnstone, N.; Ambec, S. Environmental policy, innovation and performance: New insights on the Porter hypothesis. J. Econ. Manag. Strategy 2011, 20, 803–842. [Google Scholar] [CrossRef]
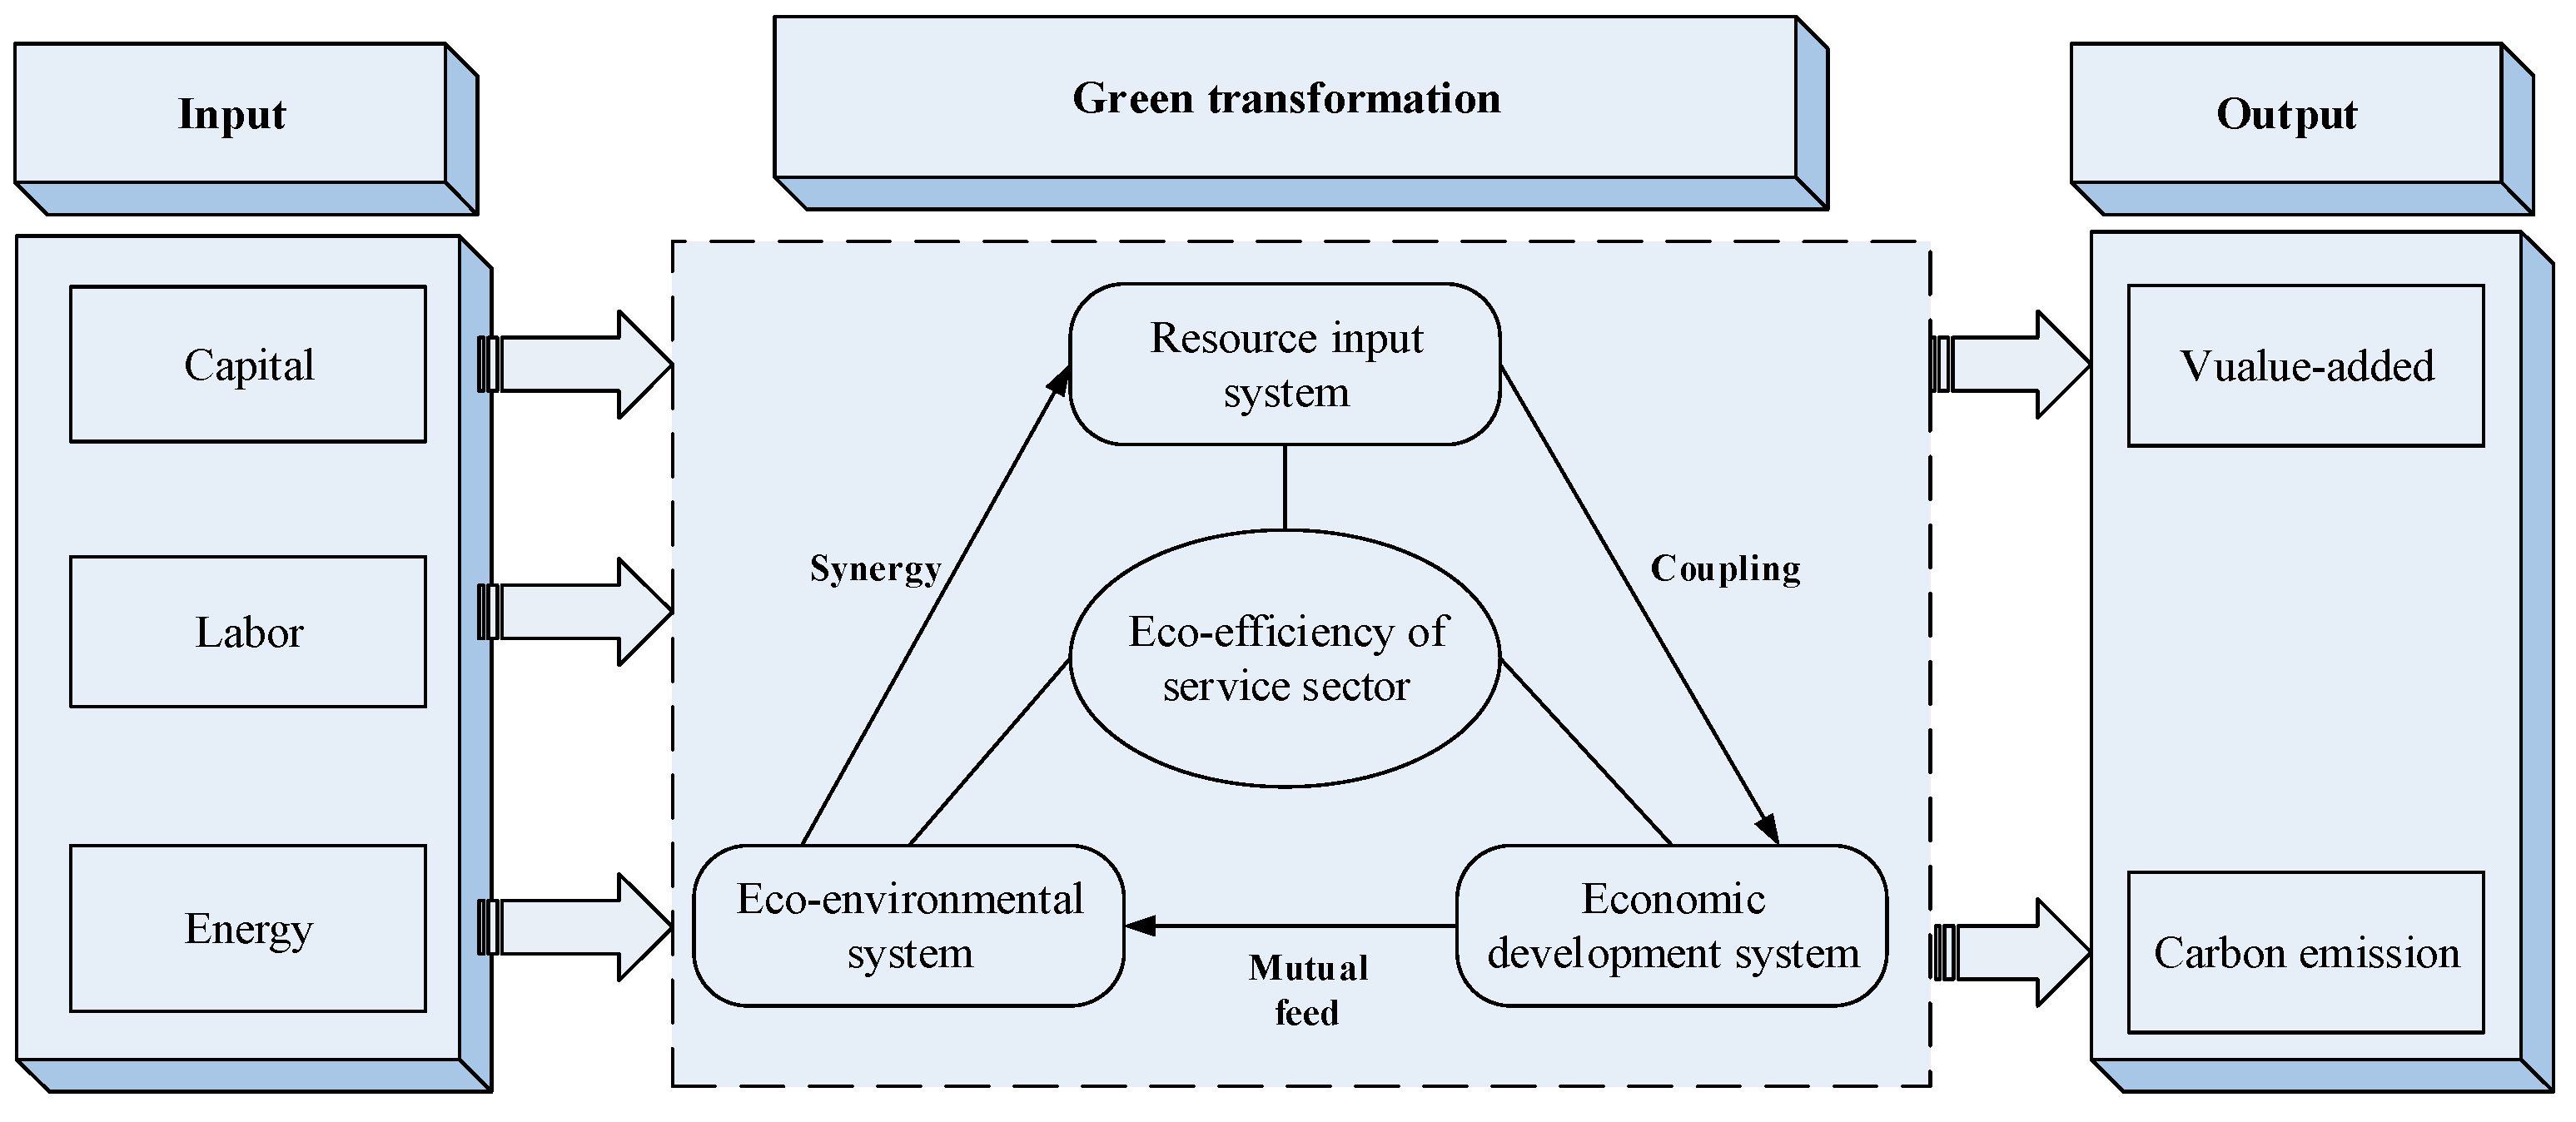
Figure 1. Connotation mechanism of the EESS.
Sustainability 16 05774 g001
Figure 2. Theoretical mechanism.
Sustainability 16 05774 g002
Figure 3. Temporal evolution of EESS.
Sustainability 16 05774 g003
Figure 4. Spatial distribution of the EESS.
Sustainability 16 05774 g004
Table 1. Index system of the EESS.
First-Level IndicatorSecond-Level IndicatorThird-Level IndicatorUnit
Input indicatorCapitalCapital stock of the service sector100 million
LaborThe number of employees from the service sectorPerson
EnergyTotal energy consumption1011 KJ
Output indicatorDesirable outputThe value-added of the service sector100 million
Undesirable outputCarbon emissions from the service sector10 thousand t
Table 2. The statistical description of each variable.
TypeVariableMeanObs.Std. DevMinMaxVIF
Dependent variablelnEffi−0.4865700.335−1.2220.117
Core independent variablelnEr−1.5735702.017−10.9960.9491.41
Mediating variablelnAgg−0.1815700.151−0.3430.635
lnTech9.6235701.7224.82013.601
Threshold variablelnEco10.1885700.8287.79112.008
Control variablelnEs−2.6185701.428−8.654−0.2931.50
lnUrb−0.7925700.582−5.317−0.0601.34
lnOpe−1.7155701.004−4.3680.5431.61
lnKl1.3275700.745−0.5623.2751.20
lnFis0.0775700.460−3.6521.5561.86
Table 3. Results of benchmark regression.
VariablelnEffi
(1)(2)(3)(4)(5)(6)
lnEr−0.032 ***
(0.010)
−0.029 ***
(0.010)
−0.028 ***
(0.010)
−0.034 ***
(0.011)
−0.031 ***
(0.011)
−0.031 ***
(0.011)
lnEs −0.010
(0.007)
−0.010
(0.007)
−0.009
(0.007)
−0.010
(0.007)
−0.010
(0.007)
lnUrb −0.077 **
(0.033)
−0.067 **
(0.033)
−0.059 *
(0.034)
−0.059 *
(0.034)
lnOpe −0.048 **
(0.020)
−0.044 **
(0.021)
−0.043 **
(0.021)
lnKl −0.028
(0.026)
−0.027
(0.027)
lnFis −0.001
(0.022)
Cons_−0.468 ***
(0.029)
−0.485 ***
(0.031)
0.562 ***
(0.045)
−0.652 ***
(0.059)
−0.619 ***
(0.067)
−0.619 ***
(0.067)
Province FEYesYesYesYesYesYes
Time FEYesYesYesYesYesYes
R20.0190.0150.0130.3850.3340.336
N570570570570570570
Note: The standard error is reported in parentheses; *, **, and *** represent 10%, 5%, and 1% levels, respectively. Similarly, hereinafter in other tables.
Table 4. Heterogenous effect of environmental regulation on EESS.
VariableDifferent AreasDifferent Periods
Eastern AreaCentral AreaWestern Area2001~20102011~2019
(1)(2)(3)(4)(5)
lnEr−0.027 **
(0.013)
−0.001
(0.031)
−0.084 ***
(0.028)
−0.043 *
(0.022)
−0.001
(0.012)
Control variableYesYesYesYesYes
Cons_−0.190 ***
(0.063)
−1.186 ***
(0.233)
−1.574 ***
(0.288)
−0.647 ***
(0.114)
−0.597 ***
(0.095)
Province FEYESYESYESYESYES
Time FEYESYESYESYESYES
R20.3380.4710.1790.5920.461
N228171171300270
Table 5. Empirical results of robustness tests.
VariableSuper-SBM
Model
Lag One PeriodEliminating YearsScale EfficiencyEndogeneity
(1)(2)(3)(4)(5)
L.lnEffi 0.771 ***
(0.048)
lnEr−0.049 ***
(0.015)
−0.032 ***
(0.011)
−0.034 ***
(0.014)
−0.010 *
(0.005)
L.lnEr −0.025 **
(0.012)
Control variableYesYesYesYesYes
Cons_−0.608 ***
(0.091)
−0.651 ***
(0.070)
−0.604 ***
(0.066)
−0.410 ***
(0.071)
−0.016
(0.027)
Province FEYesYesYesYes
Time FEYesYesYesNo
AR (1) test 0.001
AR (2) test 0.332
Sargan test 0.135
Hausma test 21.13 ***
R20.2550.2410.2800.013
N570540510570540
Table 6. Results of mediating effect.
Variable(1)(2)(3)(4)
lnAgglnEffilnTechlnEffi
lnEr0.025 ***
(0.002)
0.063 ***
(0.004)
0.325 ***
(0.024)
0.019 ***
(0.005)
lnAgg −0.731 ***
(0.073)
lnTech 0.077 ***
(0.007)
lnEs0.012 ***
(0.003)
−0.037 ***
(0.006)
−0.171 ***
(0.035)
−0.015 **
(0.006)
lnUrb0.037 ***
(0.008)
0.015
(0.015)
0.142 *
(0.082)
0.031 **
(0.015)
lnOpe0.074 ***
(0.005)
0.174 ***
(0.011)
0.912 ***
(0.052)
0.159 ***
(0.012)
lnKl−0.023 ***
(0.006)
−0.085 ***
(0.011)
1.105 ***
(0.061)
−0.187 ***
(0.014)
lnFis0.032 **
(0.013)
0.015
(0.232)
−0.639 ***
(0.122)
0.088 ***
(0.023)
Cons_0.159 ***
(0.021)
−0.047
(0.039)
9.945 ***
(0.200)
−0.697 ***
(0.087)
ModelFEFEFEFE
R20.5020.6900.6680.688
N570570570570
Bootstrap test[0.002, 0.004][0.003, 0.055]
Table 7. Threshold effect test.
IndexThreshold Variable
Economic DevelopmentService Agglomeration
Single threshold test47.09 **
(0.036)
46.52 **
(0.013)
Double threshold test17.70
(0.383)
8.34
(0.663)
Triple threshold test4.16
(0.876)
5.05
(0.733)
Number of BS300300
Critical value of 10%31.51127.203
Critical value of 5%40.51733.202
Critical value of 1%53.86848.660
Table 8. Results of threshold model parameter estimation.
Variable(1)(2)
lnEr_1 (Eco ≤ 4665.73)−0.167 ***
(0.030)
lnEr_2 (Eco > 4665.73)0.027 ***
(0.011)
lnEr_1 (Agg ≤ 0.913) 0.020 *
(0.012)
lnEr_2 (Agg > 0.913) −0.030 ***
(0.010)
Control variableYesYes
Cons_−0.531 ***
(0.051)
−0.527 ***
(0.051)
N570570
F20.55 ***20.25 ***
Disclaimer/Publisher’s Note: The statements, opinions and data contained in all publications are solely those of the individual author(s) and contributor(s) and not of MDPI and/or the editor(s). MDPI and/or the editor(s) disclaim responsibility for any injury to people or property resulting from any ideas, methods, instructions or products referred to in the content.